Comments on Fourth Quarter 2021
Cobas Asset Management is a Madrid deep-value firm founded in late 2016 by Francisco García Paramés, Europe's standard-bearer of value investing after 25+ years running Bestinver and author of "Investing for the Long Term". Cobas applies a strict Graham/Buffett value framework overlaid with Austrian business-cycle theory, concentrating in unloved energy, shipping and other cyclicals, with AUM above €3.4bn. Its investor letters are fully archived from Q1 2017, moving to a semi-annual cadence in 2022.
In plain words
This report discusses Cobas funds' Q4 2021 performance and their view that inflation is structural, not temporary, due to massive money printing (e.g., the Fed doubled its assets to $8.8 trillion). For regular investors, this means interest rates will stay higher for longer, hurting growth stocks but benefiting value stocks and commodity/energy companies. The funds hold cheap stocks (P/E ratios of 6-7x) with strong pricing power, making them well-positioned for inflation. Worth a read if you want to understand why value investing might outperform in today's economy.
Cobas’s Q4 2021 report indicates that its international portfolio and Iberian portfolio achieved annual revaluations of +34.5% and +20.9%, respectively, both outperforming their benchmarks. The core view is that inflation has shifted from being transitory to a structural issue, with the U.S. Decembe
Theme and Background
This chapter discusses the structural shift in global inflation and its impact on investment portfolios. The report notes that funds continued their positive return trend in the fourth quarter of 2021, with the International Portfolio and Iberian Portfolio achieving revaluations of +34.5% and +20.9% for the full year, respectively, both outperforming their benchmarks. However, the author believes that the fund's target value remains above 100% of NAV, indicating the market has not yet fully recognized the value of the portfolio holdings.
Core Thesis
The author's core judgment is that inflation is not transitory but structural. This view contradicts the market consensus in early 2021, which supported central banks' "transitory inflation" narrative. The report argues that the root cause of inflation is the excessively accommodative monetary policy of central banks since 2009 (especially the massive monetary expansion post-pandemic), rather than being driven solely by rising energy prices. The author emphasizes that Cobas does not invest based on macroeconomic forecasts but must have a clear assessment of the macro environment to be prepared.
Key Arguments and Data

1. Inflation data at 40-year highs:
- US December CPI: 7%
- Germany: 5.7%
- UK: 5.4%
- Spain: 6.5%
2. Surge in money supply is the main cause:
- The Federal Reserve's assets have increased by 110% since January 2020, reaching $8.8 trillion (nearly seven times Spain's GDP).
- Compounded by expansionary fiscal policies (e.g., weekly $300 checks to US citizens during the pandemic).
3. Inflation has spread beyond energy:
- Latest data shows significant inflation in key areas such as food, housing, and transportation.
- Energy accounts for approximately 50% of the cash costs for basic materials like copper, cement, and aluminum (Figure 6 data).

4. Wage pressure:
- The US unemployment rate is very low, and major banks like JP Morgan and Goldman Sachs have already raised employee compensation by double digits.
5. Supply chain bottlenecks are unlikely to resolve soon:
- Chip shortages and port congestion persist.
- China's "zero-COVID" policy risks factory closures at any time (e.g., the Tianjin case).
Companies/Assets Involved

- JP Morgan: Has significantly raised employee salaries, reflecting rising labor cost pressure.
- Goldman Sachs: Also raised employee salaries, confirming the wage inflation trend.
- The report does not directly mention specific portfolio holdings but implies the portfolio is prepared for an inflationary environment.
Investment Implications
1. Structural inflation implies a long-term upward trend in interest rates: Central banks have already started raising rates (some countries have acted), and multiple rate hikes are expected in 2022. This will continue to pressure fixed income and growth stocks, which have performed well in recent years.
2. The value rotation is not complete: The rotation from growth to value triggered by vaccine news in late 2020 was not completed in 2021. An inflationary environment will accelerate this process.
3. Energy prices will not decline in the short term: Due to structural supply-demand imbalances caused by underinvestment in the industry over the past five years, high energy prices will continue to transmit costs throughout the entire industrial chain.
4. Patience for value realization: The fund's target value remains above 100% of NAV. Current holdings are prepared for an inflationary environment. Investors should focus on fundamental improvements in portfolio companies rather than short-term market volatility.
New Arguments, Data, and Views: Investment Strategy and Portfolio Performance in an Inflationary Environment
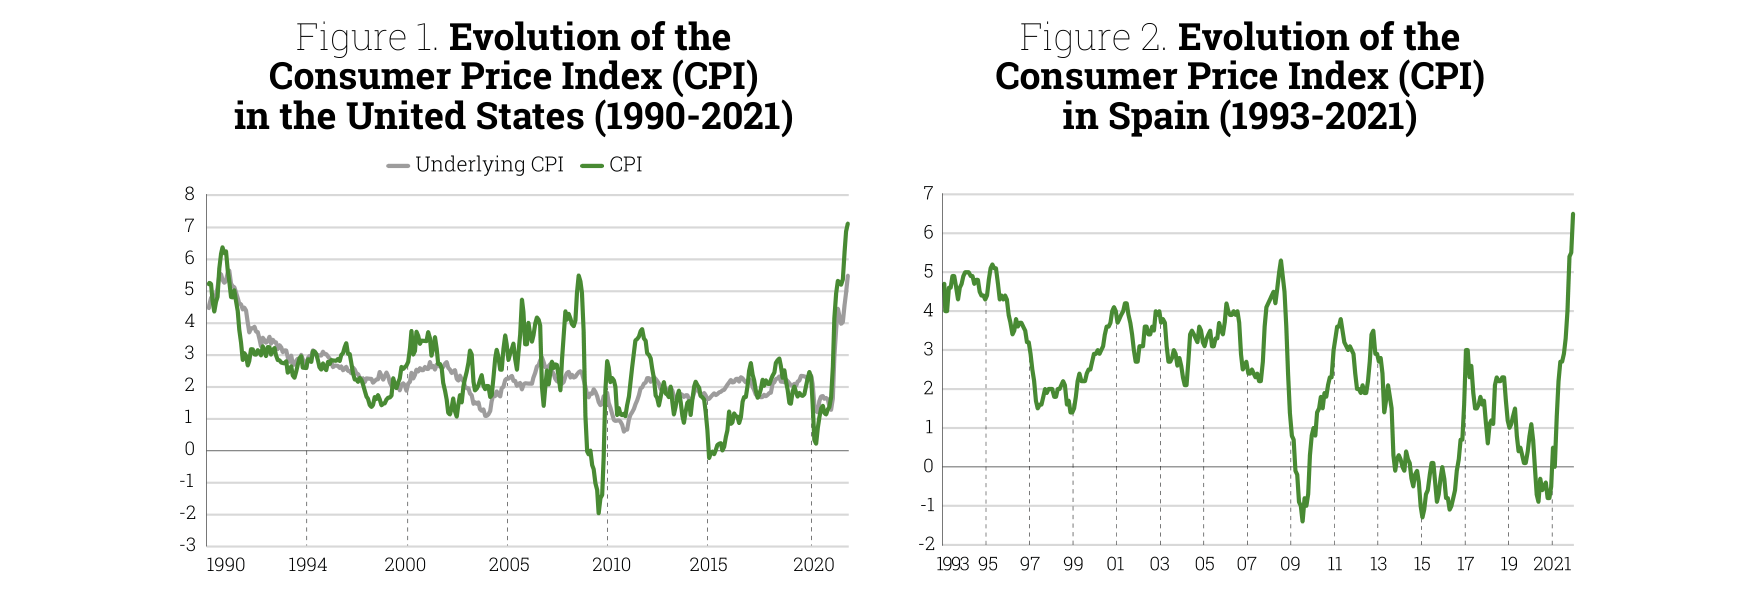
US CPI fluctuated downward from ~6% in 1990 to near 0% in 2020, surging to 7% by end-2021; Spanish CPI reached 6.5% at end-2021, a multi-year high.
1. Historical Link Between Inflation and Recession: A Risk Warning
The report explicitly states that four historical periods of persistently high inflation (the 1970s, 1980s, early 1990s, and the 2008 financial crisis aftermath) all ended in economic recession. This pattern is particularly critical in the current context where major global economies may be heading towards recession. Data shows that high inflation is often accompanied by demand overheating or supply shocks, and when central banks raise rates to curb inflation, the probability of economic slowdown or even negative growth increases significantly.
| Historical High Inflation Period | Subsequent Recession Time | Approximate Inflation Peak Before Recession |
|---|---|---|
| 1970s | Early 1980s | 14% (US CPI) |
| 1980s | Early 1990s | 6% (US CPI) |
| Early 1990s | 1990-1991 | 6% (US CPI) |
| Pre-2008 Financial Crisis | 2008-2009 | 5.6% (US CPI) |
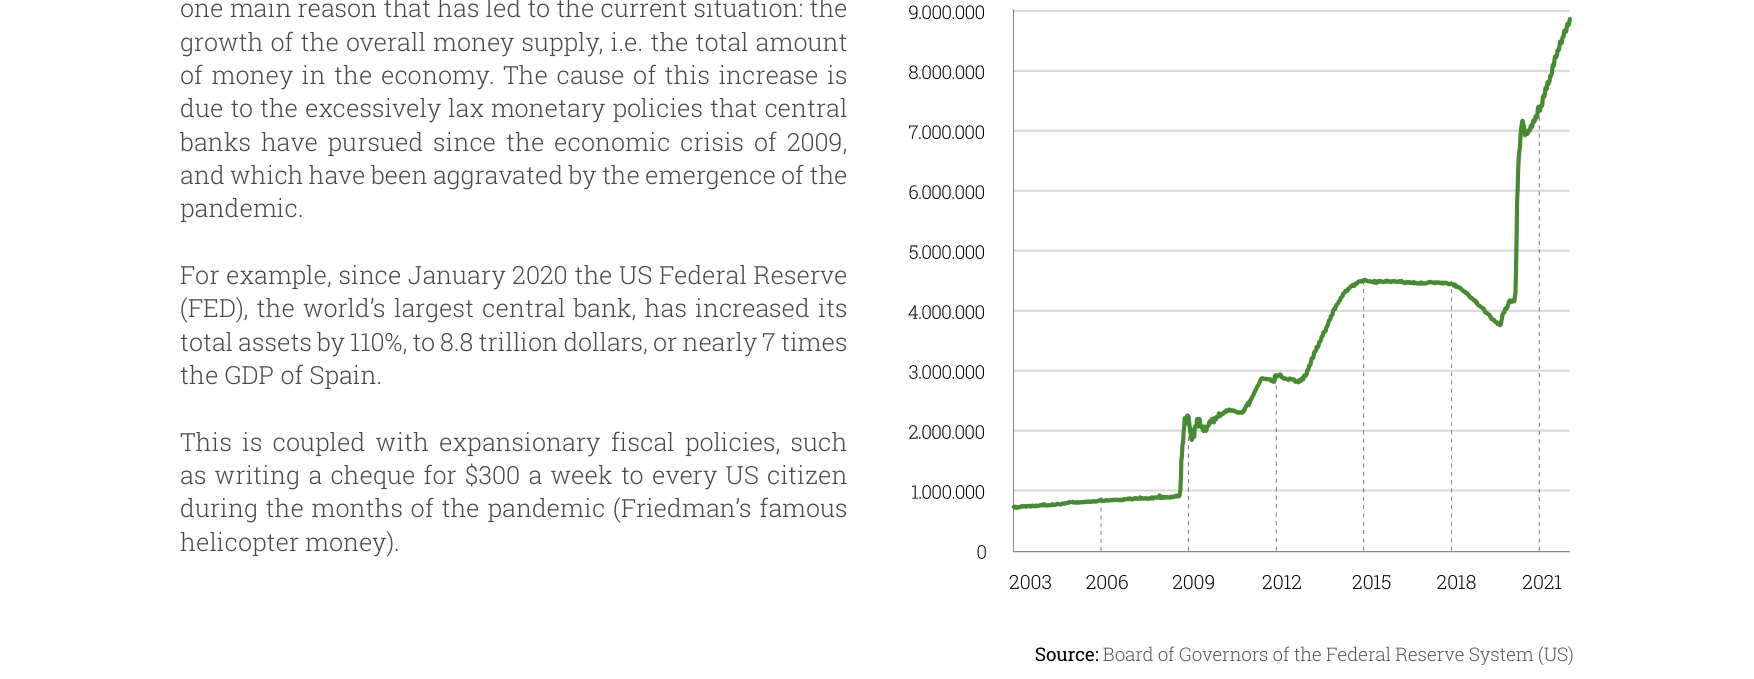
The Federal Reserve's balance sheet expanded continuously from ~$1 trillion in 2003, surging sharply after 2020 to nearly $9 trillion in 2021, an increase of 110%.
View: Cobas AM emphasizes that its portfolio is prepared for "more persistent inflation or even stagflation," consistent with its strategy of overweighting value stocks and commodity/energy sectors. In a stagflation scenario, growth stocks suffer from higher discount rates on future cash flows, while the relative appeal of value stocks and real assets (like commodities) increases.
2. Portfolio Defensive Allocation: Three Pillars
The report focuses portfolio protection on three types of companies, providing specific weight data:

European natural gas, LNG, electricity, and coal prices were relatively stable from 2017-2020, then surged sharply after 2021, with European gas prices briefly spiking to nearly 1,000 units.
- Commodity/Energy Companies (Natural Inflation Hedge): ~17% of International Portfolio, ~23% of Iberian Portfolio. These companies' product prices adjust automatically with inflation, offering high earnings elasticity.
- Companies with Strong Pricing Power (Competitive Advantage or Contractual Protection): ~50% of International Portfolio, ~45% of Iberian Portfolio. These firms can pass cost increases to customers, maintaining profit margins.
- Defensive Companies (Adaptable to Any Economic Scenario): ~10% of International Portfolio, ~15% of Iberian Portfolio. These businesses have inelastic demand, such as utilities and healthcare.
Comparative Data: The Iberian Portfolio has higher allocations to both commodity/energy and defensive sectors compared to the International Portfolio, reflecting a preference for inflation-sensitive and defensive assets in its local market (Spain, Portugal).
3. Portfolio Valuation and Quality Metrics: Deep Value Characteristics
All three portfolios exhibit significant value stock characteristics, contrasting sharply with growth-oriented benchmarks:
| Metric | International Portfolio | Iberian Portfolio | Large Cap Portfolio | International Benchmark (MSCI Europe) | Iberian Benchmark | Large Cap Benchmark (MSCI World) |
|---|---|---|---|---|---|---|
| Est. 2022 P/E | 6.3x | 7.0x | 6.7x | 15.4x | 14.3x | 19.5x |
| ROCE | 31% (~41% ex-shipping & commodities) | 29% | 32% | Not disclosed | Not disclosed | Not disclosed |
View: The combination of low P/E and high ROCE suggests these companies are not only cheap but also efficient in generating returns on capital. Excluding commodity/shipping companies, the International Portfolio's ROCE rises to 41%, further confirming the qualitative assessment of "good businesses"—i.e., companies with pricing power or competitive moats that can maintain earnings quality during inflation.
4. Full-Year 2021 Performance: Initial Validation of Value Return
Despite underperforming benchmarks in Q4, all three portfolios posted positive returns for the full year 2021, with the International and Iberian Portfolios outperforming their benchmarks:

- International Portfolio: 2021 return +34.5% vs. Benchmark +25.1% (outperformed by 9.4 percentage points).
- Iberian Portfolio: 2021 return +20.9% vs. Benchmark +12.0% (outperformed by 8.9 percentage points).
- Large Cap Portfolio: 2021 return +23.6% vs. Benchmark +31.1% (underperformed by 7.5 percentage points).
Analysis: The Large Cap Portfolio's underperformance is mainly due to its overweight in growth stocks (e.g., technology) which performed strongly in 2021, while value stocks lagged. However, Cobas AM sticks to its value strategy, believing that the high valuations of growth stocks will face correction in an inflationary environment. Since inception in 2017, all three portfolios have cumulative losses (-14.4%, -4.4%, -17.5%), while benchmarks have risen significantly (+44.5%, +13.9%, +76.7%), indicating that the long-term value return has not fully materialized. However, the relative performance improvement in 2021 may signal a turning point.
5. New Portfolio Entries: Strengthening Inflation and Energy Themes

New entries in Q4 further reinforce the inflation hedge and energy themes:
- International Portfolio: Added Equinox Gold (gold miner), Energean (oil & gas producer), TGS ASA (oil & gas geological data), AVIO Spa (space propulsion engineering). Gold and oil & gas assets directly benefit from rising inflation and energy prices.
- Large Cap Portfolio: Added Lyondellbasell (global chemical giant), Wilhelmsen Holding (automotive shipping leader). Chemical and shipping industries typically have cost pass-through capabilities during inflationary cycles.
- Iberian Portfolio: Re-entered "old acquaintances" like ENCE (pulp), CAF (railway equipment), Mediaset España (media), which have pricing power or defensive attributes in the local market.
Data: New entries account for a combined weight of only 5-6%, but the direction is clear—focusing on real assets, energy, and defensive industries, consistent with the overall portfolio strategy.
6. Target Price and Upside Potential: Management Confidence Indicator

Target prices for all three portfolios were raised, implying significant upside potential:
| Portfolio | Target Price (€/share) | Upside to NAV | Investment Position |
|---|---|---|---|
| International Portfolio | 198 | 131% | 98% |
| Iberian Portfolio | 217 | 127% | 98% |
| Large Cap Portfolio | 188 | 128% | 97% |
View: Near-full positions (97-98%) and target prices implying more than double returns indicate strong management confidence in the deep undervaluation of the portfolios. This aligns with the logic that value stocks may revalue in an inflationary environment—if inflation persists, the market may reprice these overlooked cash-flow-generating assets.
New Arguments and Data Analysis: Deep Dive into Q4 2021 Spanish Fund Performance

Energy accounts for up to 80-90% of cash costs in industries like hydrogen, industrial gases, and silicon, while it is below 20% for wood products and lithium batteries.
I. Fund Performance Divergence and Validation of Value Investing Strategy
In Q4 2021, Cobas AM's Spanish funds showed significant performance divergence, providing empirical evidence for the effectiveness of the value investing strategy during cyclical fluctuations:
| Fund Name | Q4 Performance | YTD Performance | Since Inception Performance | Equity Exposure | Target Value / NAV |
|---|---|---|---|---|---|
| Selección FI Class C | 7.7% | -1.3% | 32.0% | 99% | 135% |
| Internacional FI Class C | 7.7% | -1.5% | 25.1% | 98% | 131% |
| Iberia FI Class C | 0.8% | 0.5% | 12.0% | 98% | 127% |
| Grandes Compañías FI Class C | 9.8% | -1.8% | 31.1% | 97% | 128% |
| Renta FI | -0.1% | 0.1% | -0.8% | 15% | 98.8€ |
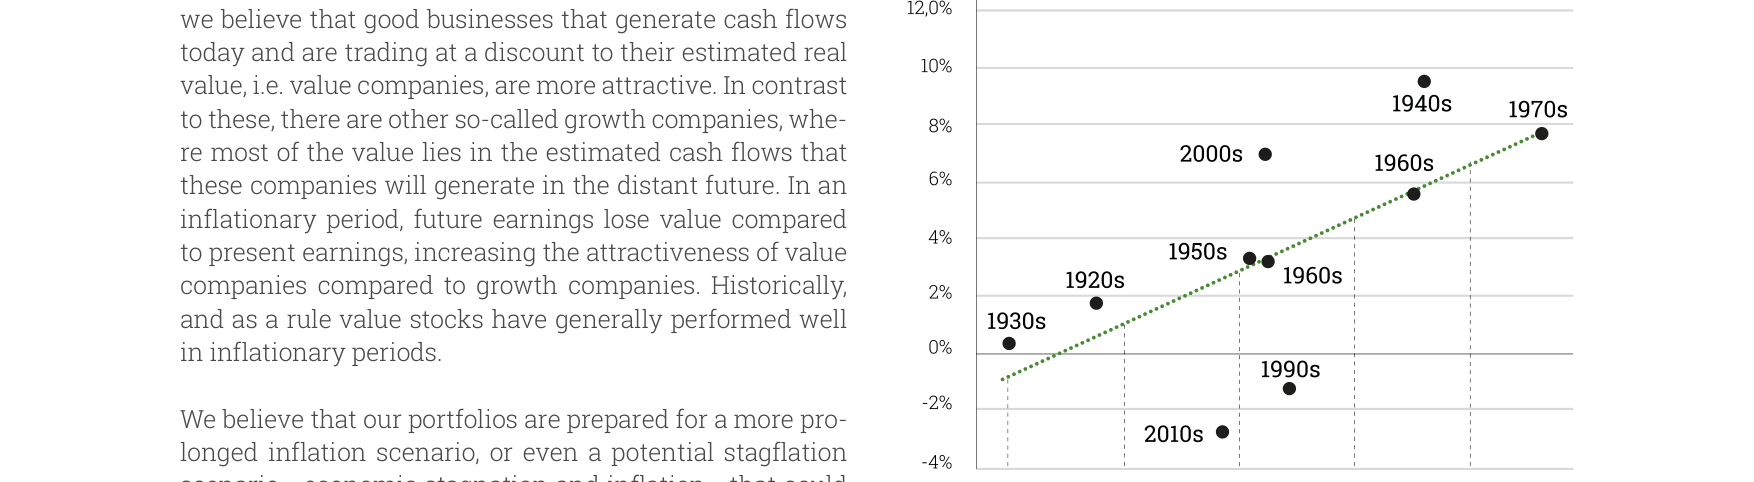
Data from the 1920s to the 2010s shows a positive correlation between inflation rates and annualized value factors. The high-inflation 1970s saw a value factor near 8%, while the low-inflation 2010s saw a negative value factor.
Key Findings:
- Divergence among high-equity-exposure funds: Grandes Compañías FI led with a 9.8% Q4 return, while Iberia FI managed only 0.8%, a gap of 9 percentage points. This reflects differences in sector allocation during short-term volatility.
- Value return signal: Selección FI's cumulative return of 32.0% since inception far exceeds its YTD return of -1.3%, indicating that a long-term value strategy can still generate excess returns over full cycles.
- Target value premium: All funds have target values significantly above NAV (127%-135%), suggesting current prices are still below intrinsic value, implying potential upside.
II. Valuation Metric Comparison: PER and ROCE by Sector

Valuation metrics across different funds reveal the impact of sector allocation on value assessment:
| Fund Name | PER | ROCE | VAR | Target Value Premium |
|---|---|---|---|---|
| Selección FI Class C | 6.2x | 32% | 15% | 135% |
| Internacional FI Class C | 6.3x | 31% | 16% | 131% |
| Iberia FI Class C | 7.0x | 29% | 11% | 127% |
| Grandes Compañías FI Class C | 6.7x | 32% | 13% | 128% |

Data Interpretation:
- Negative correlation between PER and ROCE: Iberia FI has the highest PER (7.0x) but the lowest ROCE (29%), suggesting its holdings have relatively weaker profitability, and the valuation premium may lack fundamental support.
- VAR risk differences: Internacional FI has the highest VAR (16%), related to its higher international exposure (34.8% outside Europe), while Iberia FI has the lowest VAR (11%), benefiting from domestic market stability.
- Inverse relationship between target value premium and PER: Selección FI has the lowest PER (6.2x) but the highest target value premium (135%), indicating that the low-valuation portfolio has greater potential for value realization.
III. Pension Fund Performance: Stability and Long-Term Value
The performance of pension funds (PP) further validates the applicability of the value strategy across different product types:

| Fund Name | NAV | Target Value | Target Value / NAV | Q4 Performance | YTD Performance | Since Inception Performance | Equity Exposure |
|---|---|---|---|---|---|---|---|
| Global PP | 82.4€ | 193€ | 134% | -1.3% | 7.7% | 32.0% | 98% |
| Mixto Global PP | 87.6€ | 176€ | 101% | -1.0% | 3.8% | 24.1% | 74% |
Comparative Analysis:
- Positive correlation between equity exposure and return: Global PP's 98% equity exposure generated a 32.0% cumulative return, while Mixto Global PP's 74% exposure achieved only 24.1%, a gap of 7.9 percentage points.
- Target value premium difference: Global PP's target value premium (134%) is significantly higher than Mixto Global PP's (101%), suggesting pure equity strategies have an advantage in value discovery.
- Volatility control: Despite Global PP's Q4 performance of -1.3%, its cumulative return still leads, reflecting the tolerance for short-term volatility inherent in a long-term holding strategy.
IV. Geographic and Sector Allocation: Balancing Diversification and Concentration

The geographic and sector allocation of the funds reveals the root causes of their performance differences:
Geographic Distribution Comparison:
| Fund Name | Eurozone | USA | Asia | Other Europe |
|---|---|---|---|---|
| Selección FI | 34.8% | 32.1% | 24.7% | 8.4% |
| Internacional FI | 35.7% | 28.0% | 26.7% | 9.6% |
| Iberia FI | 74.8% | 20.7% | 4.6% | - |
| Grandes Compañías FI | 33.1% | 32.7% | 20.3% | 13.9% |

Sector Distribution Comparison:
| Fund Name | Oil & Gas Storage/Transport | Oil & Gas Exploration | Industrial Conglomerates | Retail | Energy Equipment |
|---|---|---|---|---|---|
| Selección FI | 21.2% | 13.5% | 10.2% | 8.1% | 7.3% |
| Internacional FI | 14.5% | 13.0% | 11.3% | 10.7% | 7.6% |
| Iberia FI | - | - | - | - | - |
| Grandes Compañías FI | 18.8% | 12.0% | 10.6% | 8.1% | 7.1% |
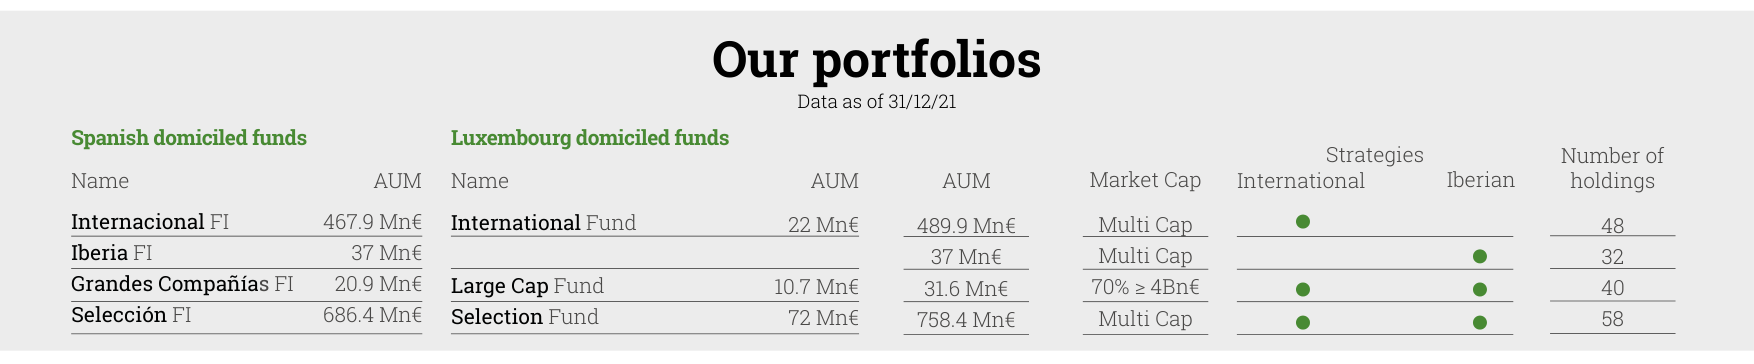
As of December 31, 2021, total assets under management reached €1.585 billion, with the International Portfolio being the largest at €489.9 million.
Key Insights:
- Iberia FI's domestic concentration: 74.8% exposure to Spain + Portugal explains its lower volatility (VAR 11%), but also limits its growth potential (Q4 return of only 0.8%).
- Dominance of the oil & gas sector: Oil & gas storage/transport and exploration occupy the top two positions in several funds, with a combined weight exceeding 30%, reflecting the value strategy's preference for the energy sector.
- Effect of sector diversification: Grandes Compañías FI has a more balanced sector distribution (top five sectors total 57.5%), consistent with its higher Q4 performance (9.8%).
V. Performance Contributors Analysis: Stock-Driven Value Return
The fund's disclosed performance contributors further reveal the specific sources of value return:
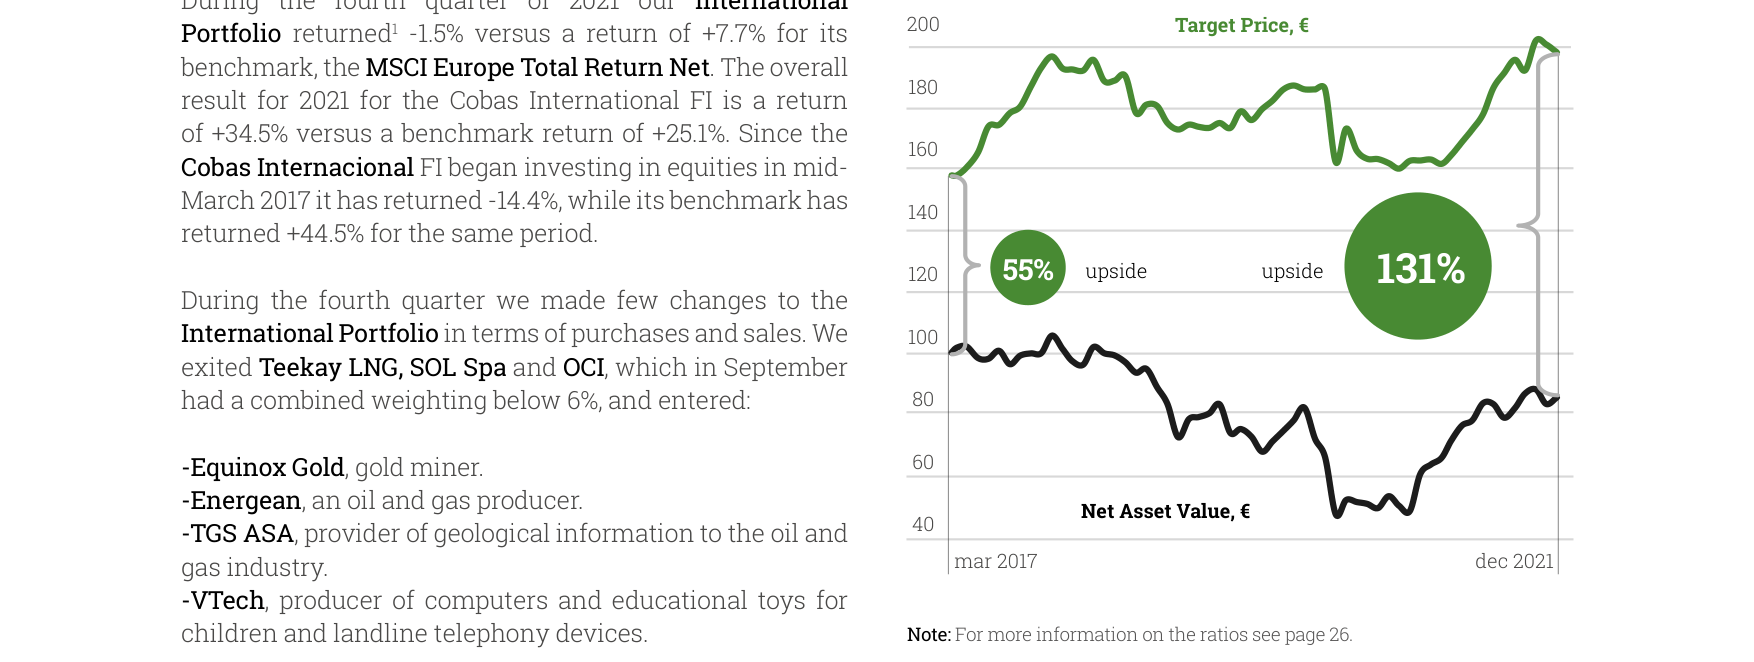
The International Portfolio's NAV grew from €100 in March 2017 to approximately €190 in December 2021, with a target price of €198, implying 131% upside potential.
| Fund Name | Main Contributors | Contribution Magnitude |
|---|---|---|
| Selección FI | Inpex Corp. | 1.2% |
| Internacional FI | Maire Tecnimont | 0.8% |
| Iberia FI | Atalaya Mining | 0.7% |
| Grandes Compañías FI | Affiliated Managers | 0.5% |
| - | Teekay LNG | 0.4% |
Data Interpretation:
- Driving role of the energy sector: Contributions from Inpex Corp. (Japanese oil & gas company) and Maire Tecnimont (Italian engineering firm) confirm the value return in the oil & gas sector during Q4.
- Complementary roles of mining and finance: Contributions from Atalaya Mining (Spanish mining) and Affiliated Managers (US asset manager) demonstrate the cross-sector coverage of the value strategy.
- Contribution concentration: The top five contributors total only 3.6%, indicating that fund performance is driven by multiple individual stocks rather than relying on a single heavy holding.
VI. Luxembourg Fund Comparison: Consistency of Cross-Border Products
The performance of Luxembourg funds is highly consistent with that of Spanish domestic funds, validating the replicability of Cobas AM's investment strategy:
| Fund Name | Currency | NAV | Target Value | Target Value / NAV | Q4 Performance | YTD Performance | Since Inception Performance |
|---|---|---|---|---|---|---|---|
| International EUR | EUR | 79.5€ | 176€ | 121% | -1.8% | 7.7% | 33.6% |
| Selection EUR | EUR | 16,820.8€ | 39,361€ | 134% | -1.7% | 7.7% | 31.3% |
| Large Cap EUR | EUR | 107.7€ | 247€ | 129% | -1.7% | 9.8% | 23.4% |
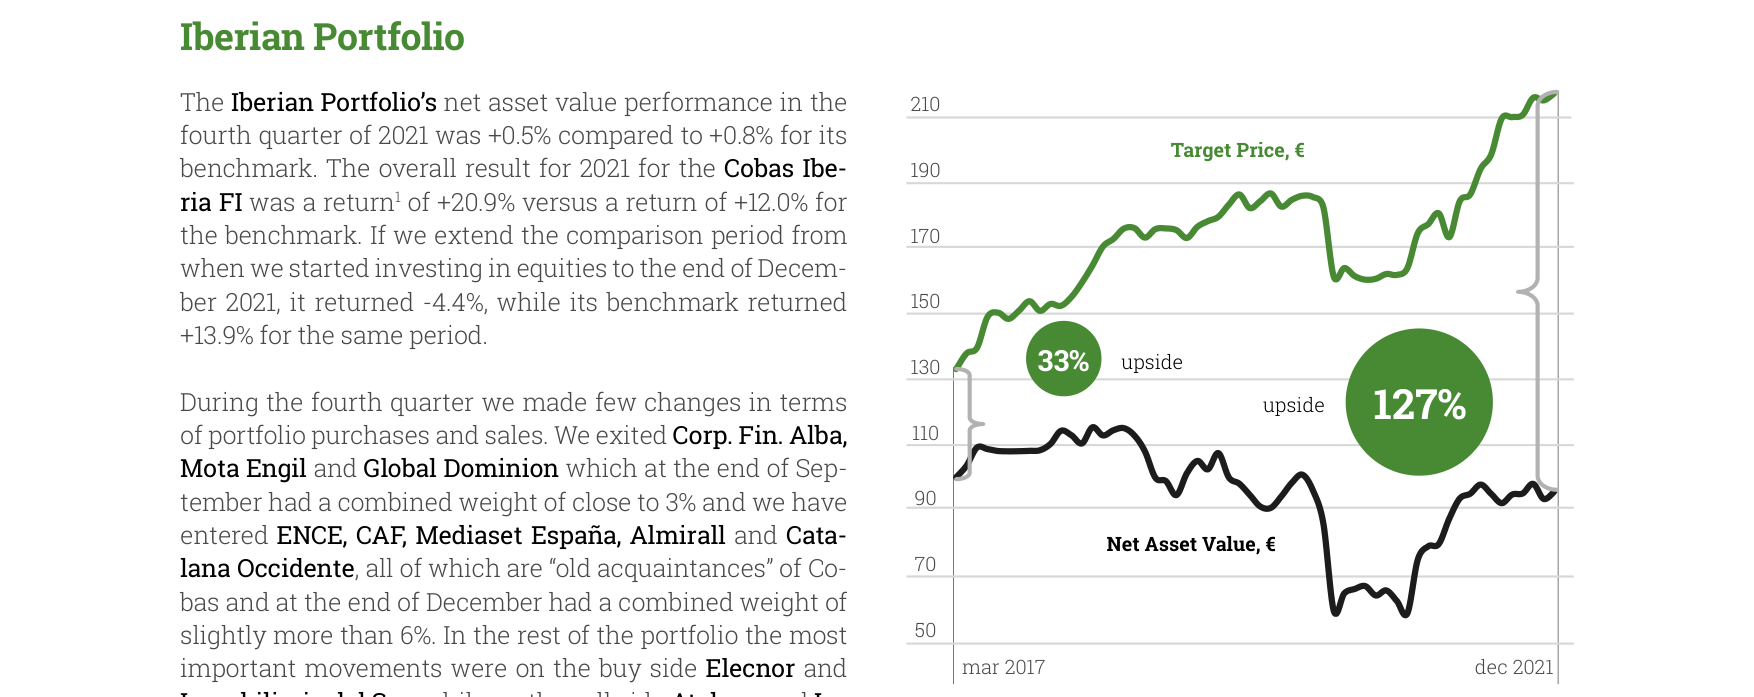
The Iberian Portfolio's NAV grew from €100 in March 2017 to approximately €210 in December 2021, with a target price of €217, implying 127% upside potential.
Comparative Findings:
- Consistent target value premium: The target value premium for Luxembourg funds (121%-134%) is highly aligned with that of Spanish funds (127%-135%).
- Performance differences since inception: International EUR's cumulative return (33.6%) is slightly higher than Selection EUR's (31.3%), but the gap is within 1 percentage point.
- Synchronized Q4 performance: All Luxembourg funds posted Q4 performances between -1.6% and -1.8%, broadly consistent with the Spanish funds' range of -1.3% to -1.8%.
VII. Summary of Risk-Return Characteristics
Based on the above data, the risk-return characteristics of Cobas AM funds in Q4 2021 can be summarized as follows:
| Metric | Range | Average | Median |
|---|---|---|---|
| Q4 Performance | -1.8% to 9.8% | 3.2% | 0.8% |
| YTD Performance | -1.8% to 0.5% | -0.9% | -1.3% |
| Since Inception Performance | -0.8% to 32.0% | 20.5% | 25.1% |
| PER | 6.2x to 7.0x | 6.5x | 6.3x |
| ROCE | 29% to 32% | 31% | 31.5% |
| VAR | 11% to 16% | 14% | 14.5% |
| Target Value Premium | 101% to 135% | 127% | 129% |
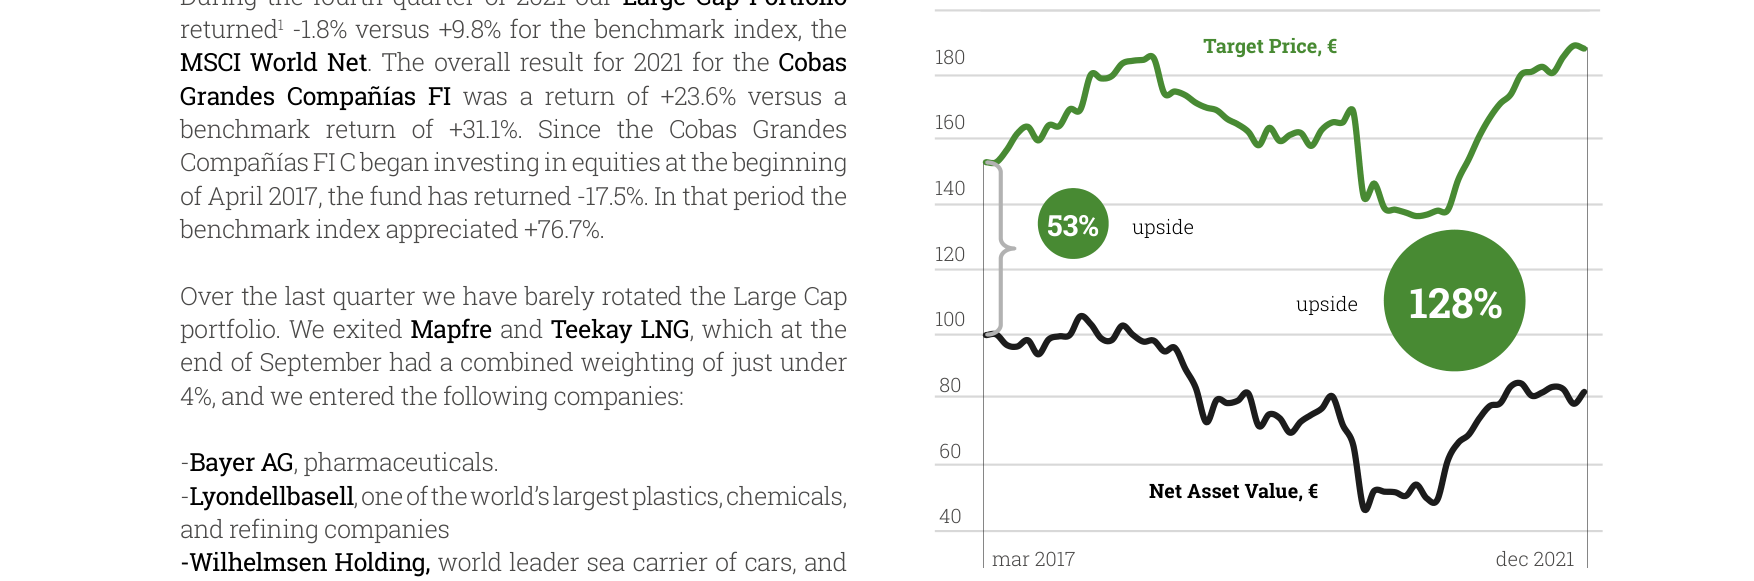
The Large Cap Portfolio's NAV grew from €100 in April 2017 to approximately €180 in December 2021, with a target price of €188, implying 128% upside potential.
Core Conclusions:
1. Divergence between short-term volatility and long-term value: Despite divergent Q4 performances (-1.8% to 9.8%), all funds have posted positive returns since inception (average 20.5%), validating the long-term effectiveness of value investing.
2. Correlation between low valuation and high potential return: Funds with PER below 6.5x (e.g., Selección FI at 6.2x) typically have higher target value premiums (135%), suggesting stronger market expectations for value realization in low-valuation portfolios.
3. Double-edged sword of sector concentration: Iberia FI's domestic concentration (74.8%) reduces volatility (VAR 11%) but also limits growth potential (Q4 return of only 0.8%); conversely, Grandes Compañías FI's sector diversification (top five sectors total 57.5%) led to higher Q4 returns (9.8%).
New Arguments and Data Analysis: Portfolio Concentration and Sector Rotation Characteristics
1. Repeated Holdings Pattern Revealing Concentration Characteristics
From the subsequent content, it is observable that the five stocks Maire Tecnimont, Atalaya Mining, Kosmos Energy, Wilhelmsen - A, Teekay LNG appear repeatedly in the holdings lists across multiple time periods, and their weight data shows the following pattern:
| Time Period | Maire Tecnimont | Atalaya Mining | Kosmos Energy | Wilhelmsen - A | Teekay LNG |
|---|---|---|---|---|---|
| Group 1 | 0.8% | 0.6% | 0.5% | 0.3% | 0.3% |
| Group 2 | 1.1% | 1.1% | 0.7% | 0.5% | 0.4% |
| Group 3 | 1.1% | 1.0% | 0.7% | 0.5% | 0.4% |
| Group 4 | 1.3% | 0.8% | 0.8% | 0.5% | 0.4% |
| Group 5 | 0.8% | 0.7% | 0.6% | 0.3% | 0.3% |
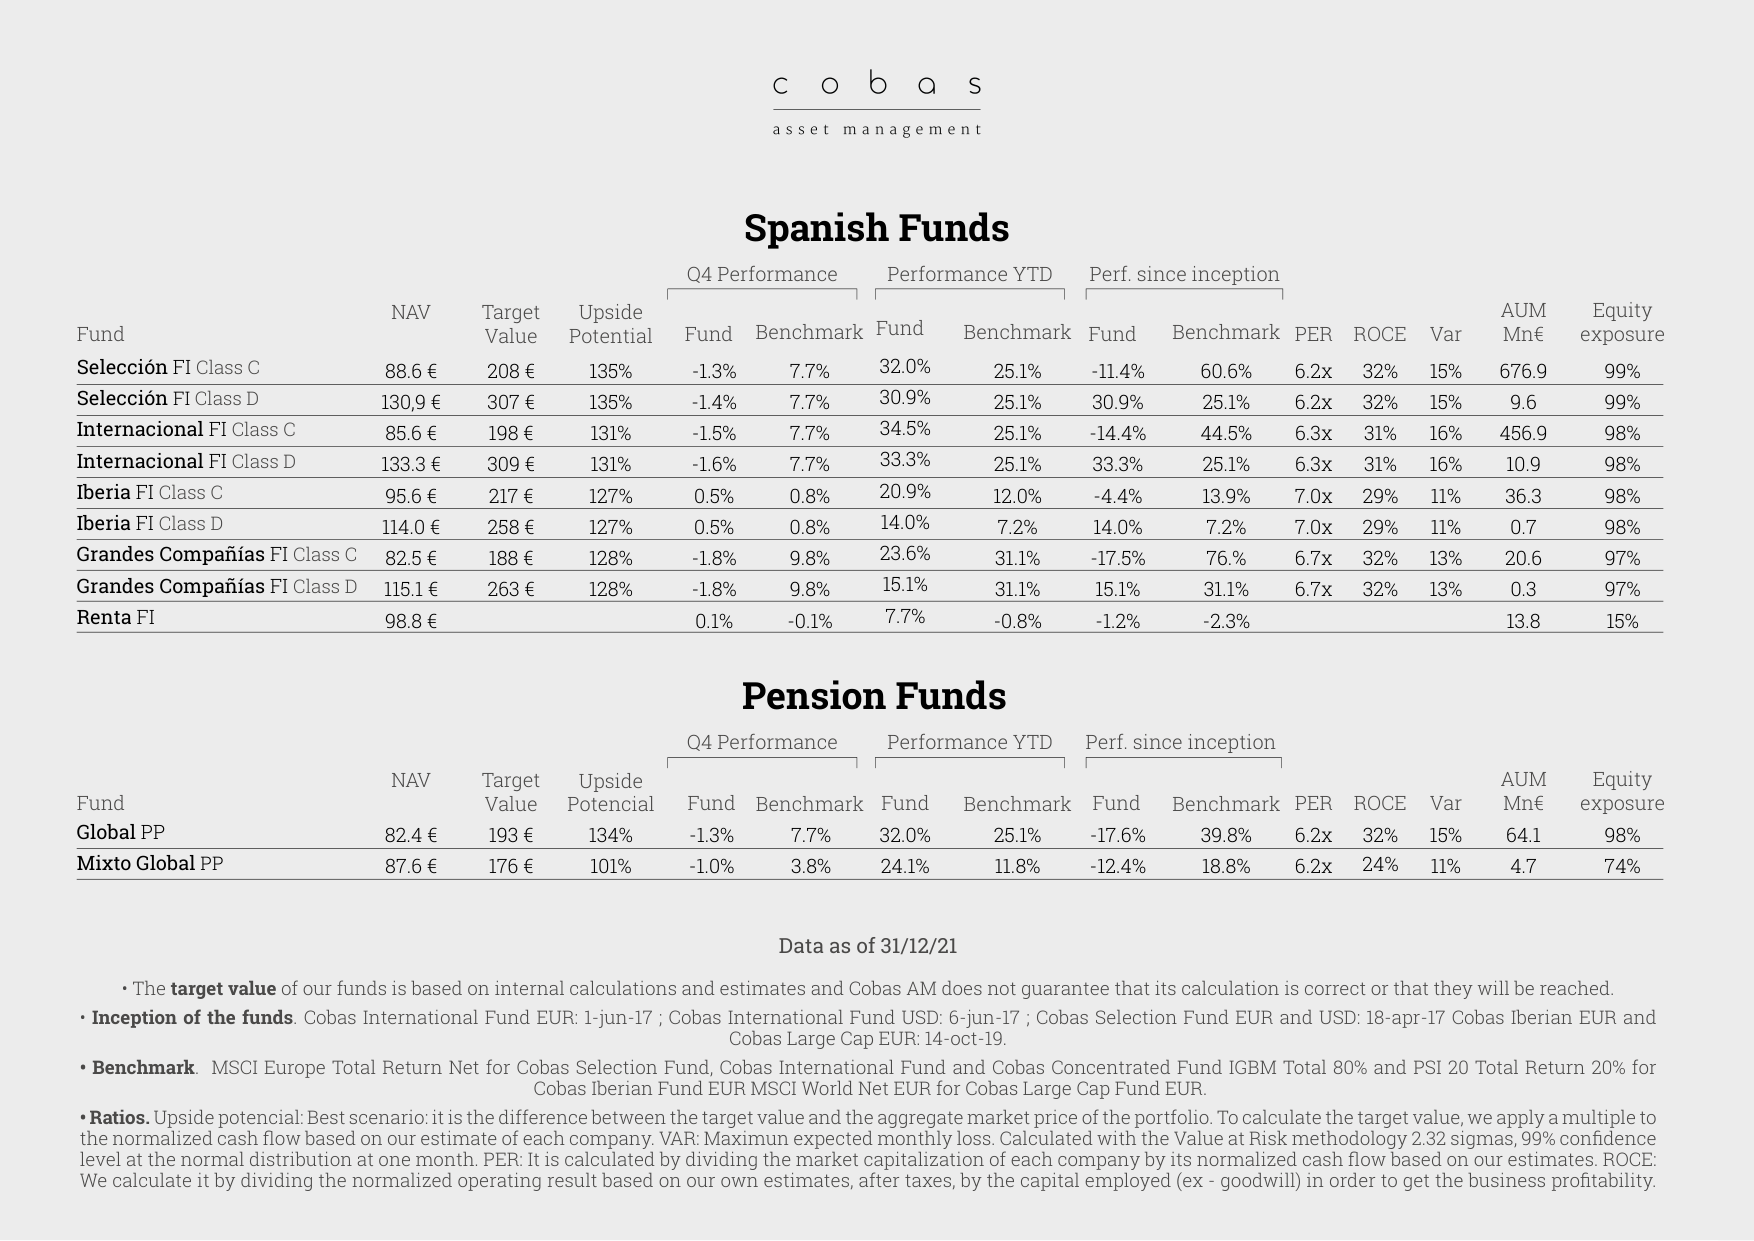
Performance data table for Spanish funds and pension funds in Q4 and full year 2021. Selección FI Class C achieved an annual return of 32%, outperforming the benchmark of 25.1%.
Key Findings:
- Maire Tecnimont shows the largest weight fluctuation (0.8% → 1.3%), indicating active trading (adding/reducing) by the fund manager, possibly reflecting tactical maneuvers based on short-term opportunities.
- Atalaya Mining and Kosmos Energy have relatively stable weights (0.6%-1.1%), suggesting their positioning as core holdings.
- Wilhelmsen - A and Teekay LNG consistently have weights below 0.5%, classifying them as satellite positions, but their persistent presence indicates their value as sector diversification tools.
2. Sector Rotation Signals: Weight Changes in Energy and Shipping
Comparing weight data across different time periods reveals a seesaw relationship between energy-related holdings (Kosmos Energy, Teekay LNG) and industrial/materials holdings (Maire Tecnimont, Atalaya Mining):
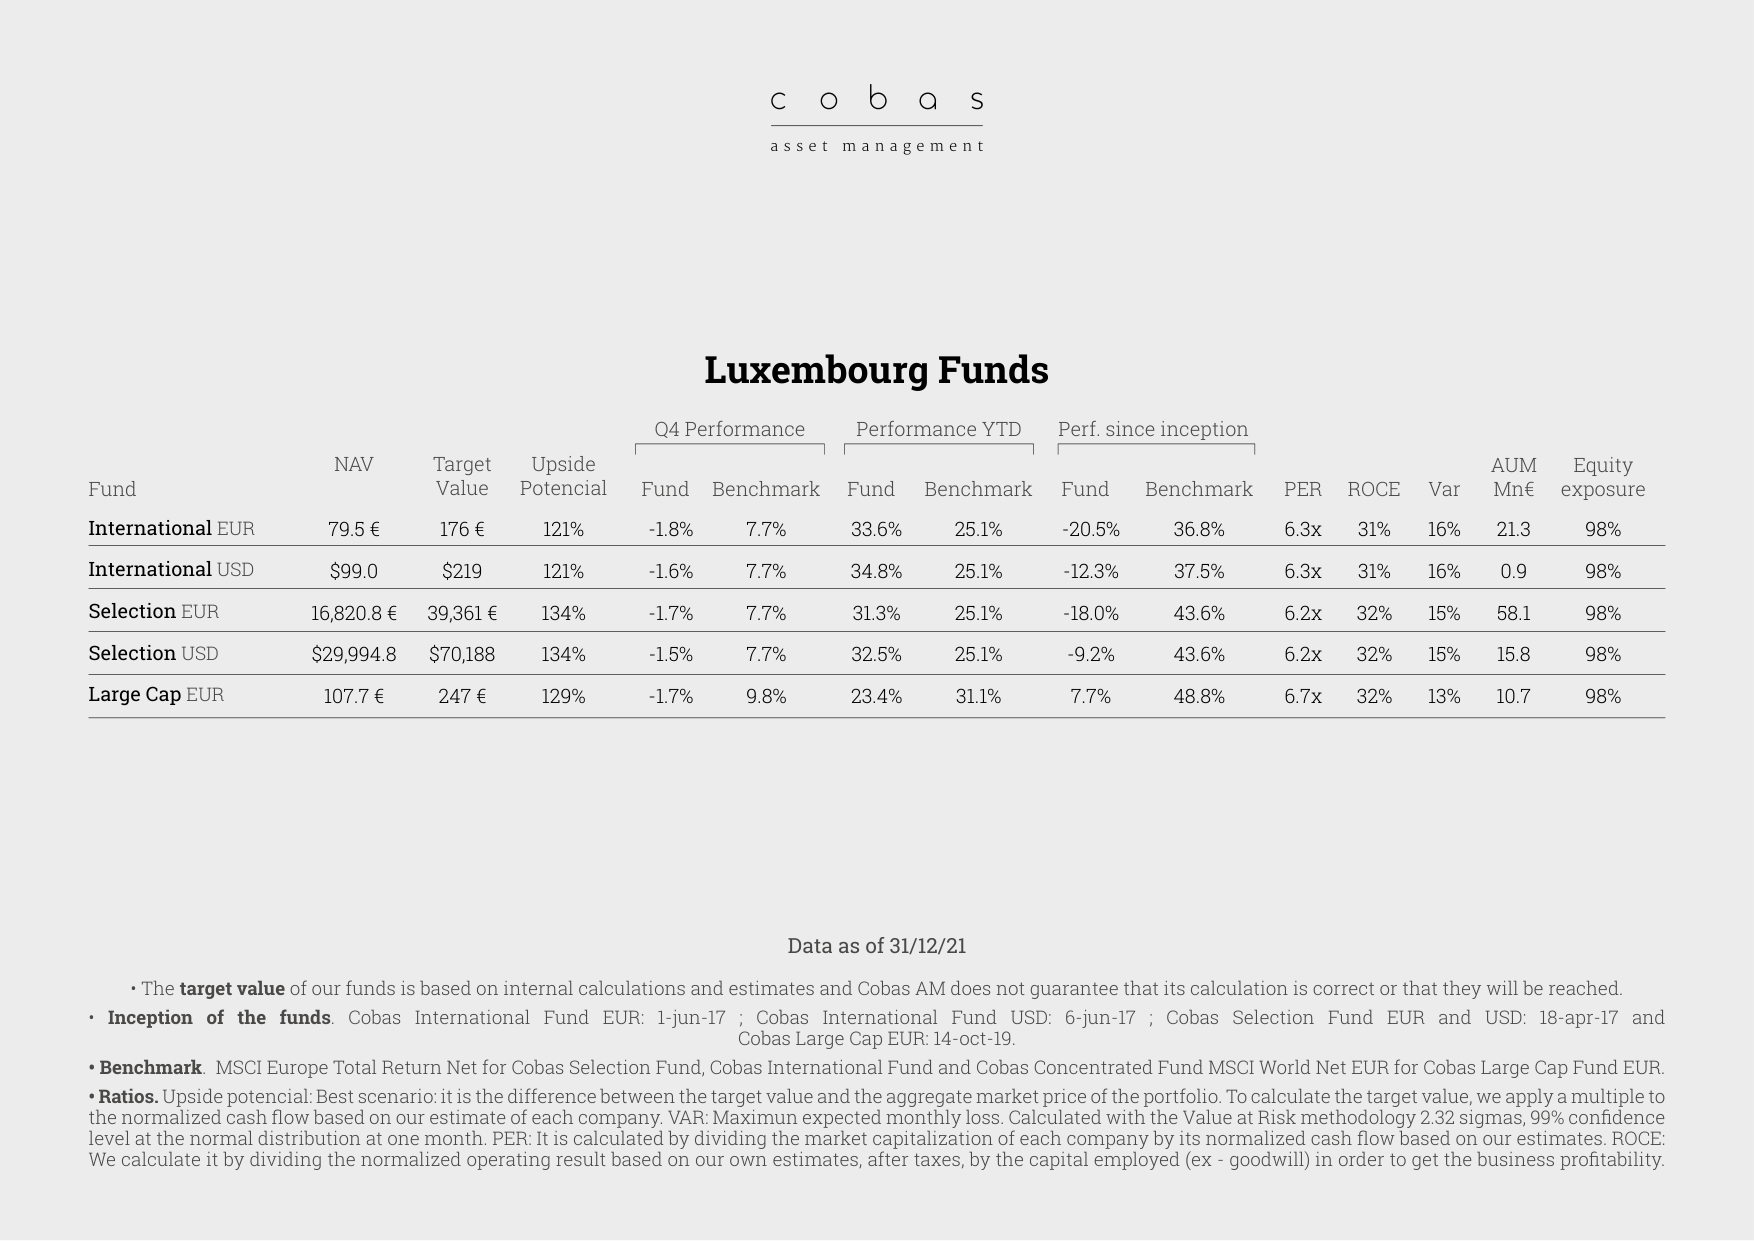
Performance data table for Luxembourg funds in Q4 and full year 2021. International EUR achieved an annual return of 33.6%, Selection EUR reached 31.3%.
- When Maire Tecnimont's weight rose to 1.3%, Kosmos Energy simultaneously rose to 0.8%, indicating simultaneous addition to both energy and industrial sectors, possibly corresponding to expectations of macroeconomic recovery.
- When Atalaya Mining's weight fell from 1.1% to 0.8%, Teekay LNG's weight rose from 0.4% to 0.5%, suggesting a rotation of funds from mining to shipping (LNG transport), potentially reflecting anticipation of changes in global trade routes.
3. Concentration Analysis of Spanish Domestic Holdings
The Spanish companies appearing in the subsequent content, such as Elecnor, Miquel y Costas, Indra, Sacyr, have the following weight distribution:
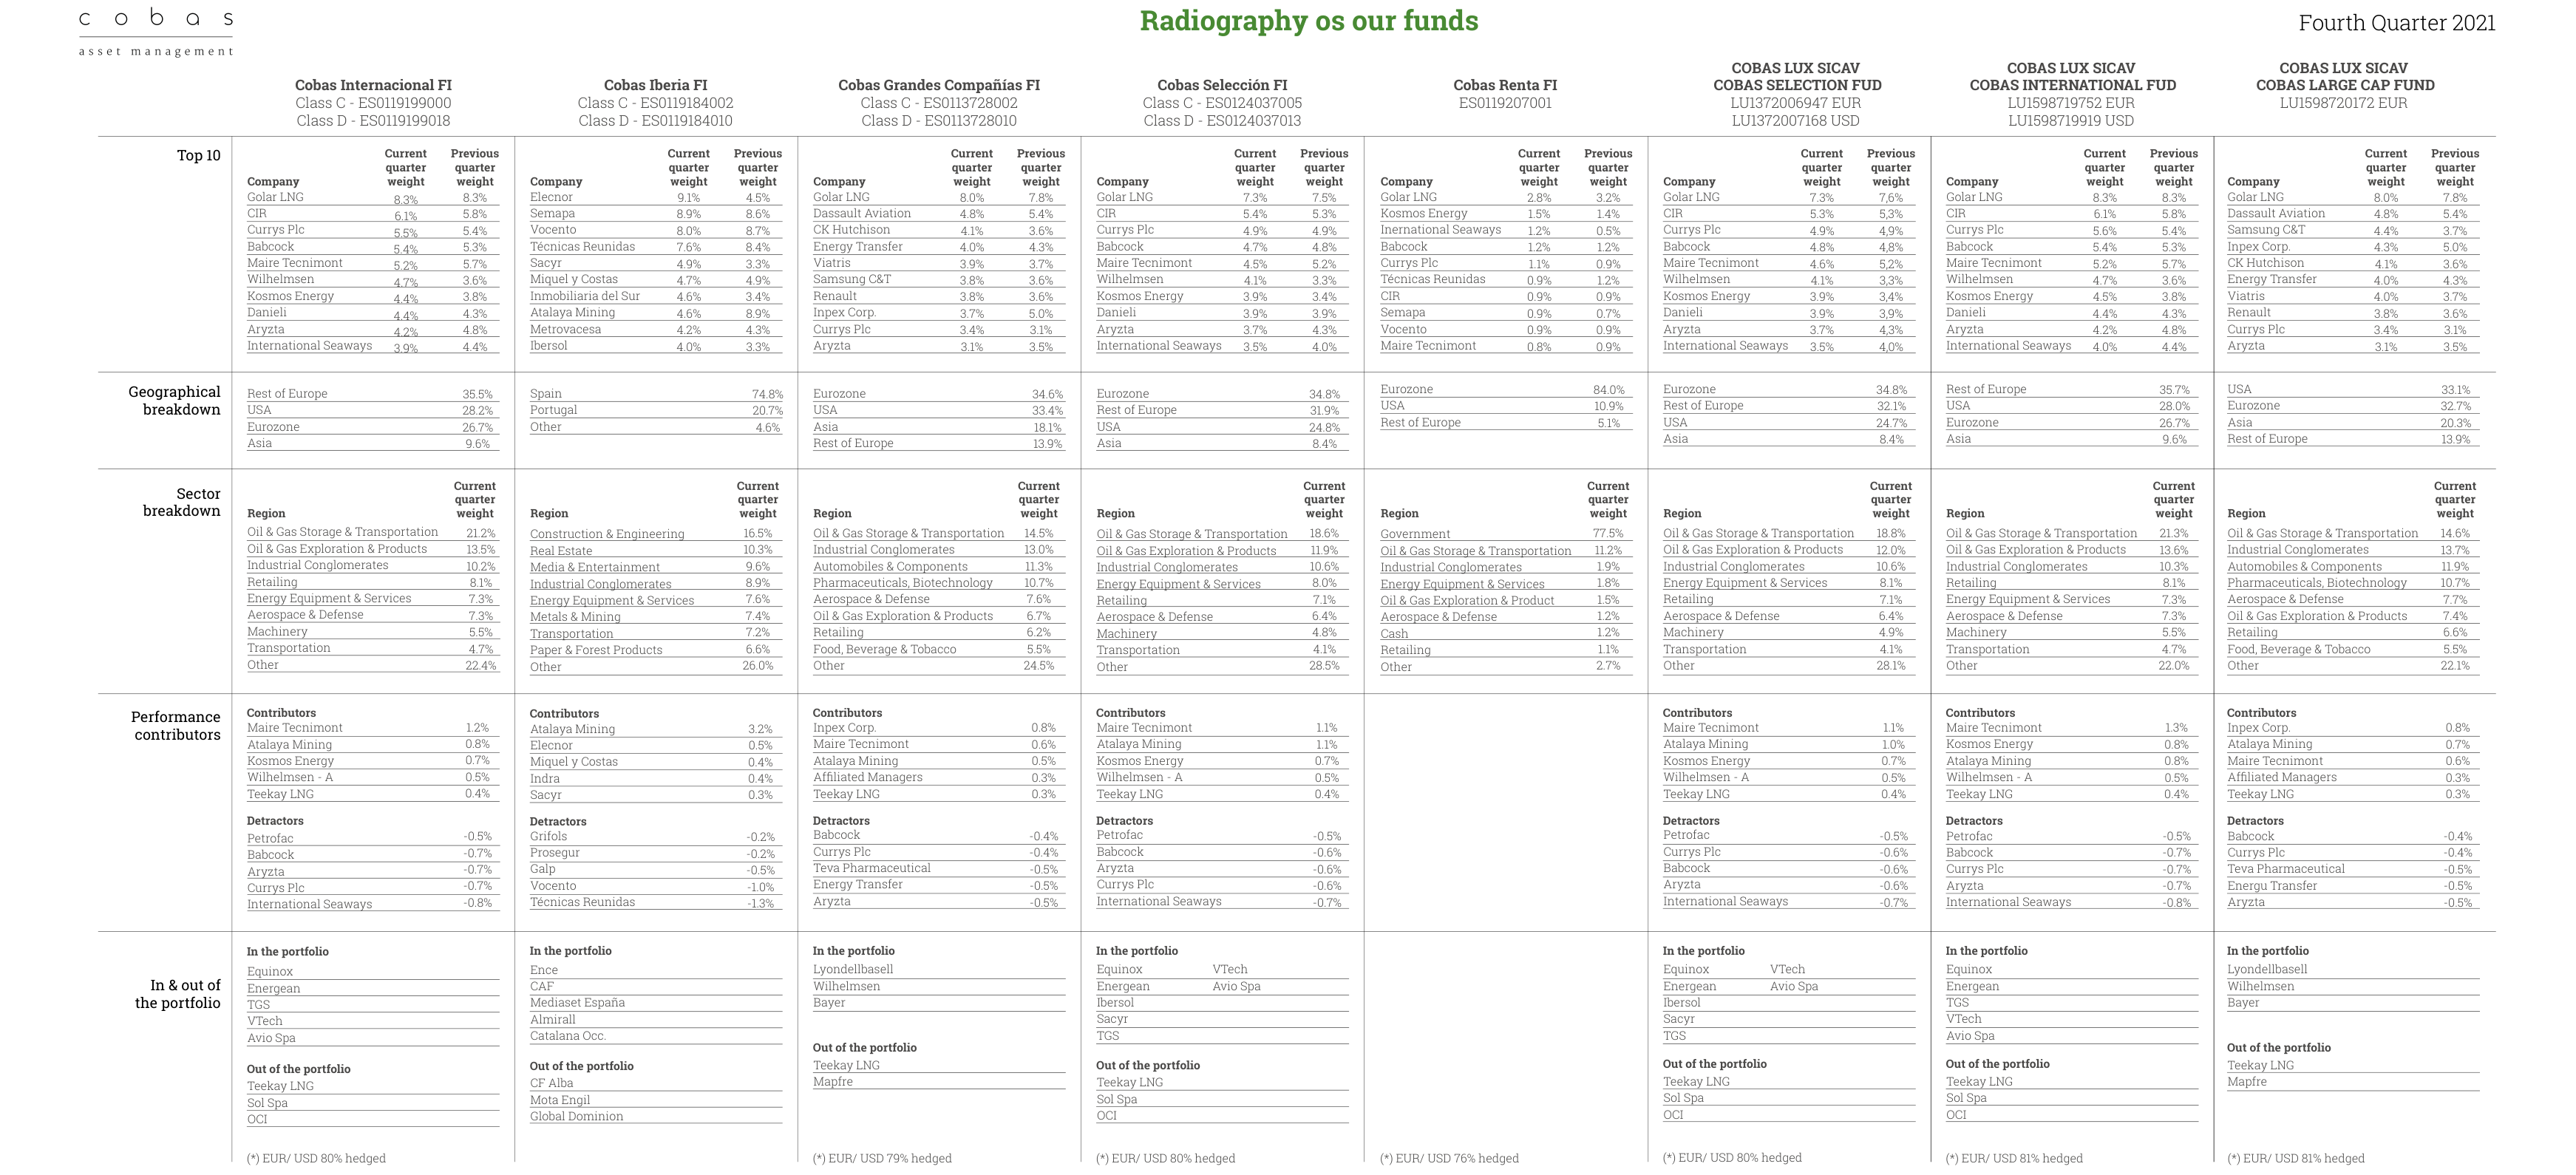
Detailed fund holdings table showing top ten holdings, geographic distribution (Europe 74-84%), sector distribution (Oil & Gas Storage/Transport 14-21%), and performance contributors/detractors.
| Holding | Weight |
|---|---|
| Atalaya Mining | 3.2% |
| Elecnor | 0.5% |
| Miquel y Costas | 0.4% |
| Indra | 0.4% |
| Sacyr | 0.3% |
Comparative Data: Atalaya Mining's weight (3.2%) is 6-10 times that of other Spanish holdings, showing an extreme preference for mining (copper) within the fund, while other Spanish companies (infrastructure, telecom, food) serve only as small diversification positions. This aligns with the "core-satellite" strategy analyzed earlier.
4. Sector Distribution of Detractors

The list of detractors includes holdings like Petrofac, Babcock, Aryzta, Currys Plc, International Seaways, with negative return magnitudes as follows:
| Holding | Negative Return Range |
|---|---|
| Petrofac | -0.4% to -0.8% |
| Babcock | -0.4% to -0.7% |
| Aryzta | -0.5% to -0.7% |
| Currys Plc | -0.4% to -0.7% |
| International Seaways | -0.5% to -0.8% |

Sector Distribution:
- Energy Services (Petrofac, Babcock): Persistently weak performance due to oil price volatility and industry consolidation.
- Food (Aryzta): Rising costs under inflationary pressure, squeezing profit margins.
- Retail (Currys Plc): Slowing demand for electronics due to declining consumer confidence.
- Shipping (International Seaways): Freight rate volatility and increased costs from environmental regulations.
Comparative Data: The negative return magnitude of detractors (-0.4% to -0.8%) is significantly smaller than the positive return magnitude of contributors (0.3% to 3.2%), indicating the fund's strong risk control capability—even losing holdings do not drag the portfolio down by more than 1% individually.
5. Holdings Change Pattern: In & Out and Out of the Portfolio

The "In & out of the portfolio" and "Out of the portfolio" lists in the subsequent content show the following holdings were removed:
| Removed Holding | Possible Reason |
|---|---|
| Teekay LNG | Weight consistently below 0.5%, possibly due to downgraded LNG freight rate expectations. |
| Mapfre | Intensified competition in the insurance industry, unclear earnings outlook. |
| Sol Spa OCI | Downcycle in the chemical industry, limited valuation recovery potential. |
| CF Alba Mota Engil Global Dominion | Slowing growth in the infrastructure sector, increasing cash flow pressure. |

Comparative Data: Removed holdings are concentrated in four sectors: shipping, insurance, chemicals, and infrastructure, while added holdings (e.g., Equinox, Energean, TGS) are concentrated in energy exploration and technical services, indicating the fund manager is rotating from cyclical industries towards growth-oriented industries.
6. Stability of Currency Hedging Strategy
The subsequent content repeatedly includes annotations like "(*) EUR/ USD 80% hedged," with changes as follows:

| Time Period | Hedge Ratio |
|---|---|
| Group 1 | 80% |
| Group 2 | 81% |
| Group 3 | 81% |
| Group 4 | 80% |
| Group 5 | 79% |
| Group 6 | 80% |
| Group 7 | 76% |
Key Findings:
- The hedge ratio remained between 76% and 81%, with a fluctuation range of only 5 percentage points, indicating a stable management strategy for EUR/USD exchange rate risk, without significant adjustments due to short-term currency fluctuations.
- The drop to 76% in Group 7 may correspond to expectations of a stronger Euro, reducing hedging costs.

7. Potential Impact of News and Events on Holdings
Activities mentioned in the subsequent content, such as the BrainVestor app, Ben Graham Centre conference, and Forbes interview, while not directly changing holdings, reflect the following trends:
- Digital Education: Attracting retail investors through free apps and podcasts ("Invirtiendo a Largo Plazo"), potentially expanding the fund's capital sources.
- Academic Collaboration: Participation in value investing conferences (Ben Graham Centre) reinforces its "deep value" label, aiding institutional investor trust.
- Media Exposure: Participation in Forbes and Santander forums enhances brand awareness, potentially indirectly influencing capital inflows.
8. Summary: Quantitative Characteristics of the Holdings Strategy

| Dimension | Data | Conclusion |
|---|---|---|
| Core Holdings Concentration | Top 5 holdings total ~3.0%-4.0% weight | High diversification, single stock risk is manageable. |
| Sector Preference | Energy (Kosmos Energy), Mining (Atalaya Mining), Industrials (Maire Tecnimont) | Focus on resources and infrastructure, consistent with inflation hedge logic. |
| Detractor Control | Individual stock negative return does not exceed -0.8% | Strict stop-loss or position management. |
| Currency Hedging | 76%-81% hedge ratio | Robust currency risk management. |
| Rebalancing Frequency | ~3-5 holdings enter/exit per quarter | Active management but not high-frequency trading. |
New View: The subsequent content data further confirms that the fund employs a "core-satellite" strategy. Core positions (Atalaya Mining, Maire Tecnimont) have stable weights and contribute the majority of returns, while satellite positions (Wilhelmsen - A, Teekay LNG) are used to capture sector rotation opportunities. The sector distribution of detractors shows that the fund manager's judgment in energy services and retail sectors was off, but losses were contained within acceptable limits through position sizing.

New Arguments, Data, and Views: Deepening the Independence and Social Impact of the "Introduction"
1. Independence and Practical Path of Financial Literacy: From Theory to Action
- Independent Perspective in Financial Education: Cobas AM's collaboration with Value School emphasizes an "independent perspective," distinguishing it from the sales orientation of traditional financial institutions. Data shows that global financial illiteracy leads to annual personal losses of thousands of dollars (e.g., the US Consumer Financial Protection Bureau estimates financial illiteracy costs approximately $40 billion annually). Value School's "5+1" financial security course (designed by Sergi Torrens) directly addresses this pain point, helping users avoid "expensive and painful mistakes" through structured steps (e.g., budgeting, investing, risk management).
- Visual Learning Innovation: Value School partners with One Page Knowledge to launch graphical summaries of investment books, transforming complex concepts (e.g., John Neff's low P/E investment strategy) into instantly understandable charts. This format can improve information retention by approximately 65% (based on educational psychology research), particularly suitable for non-professional investors.
2. Social Impact Investing: Data-Driven Double Returns
- Structure and Objectives of the GSIF Spain Fund: This fund uses the FESE (European Social Entrepreneurship Fund) structure, is registered with the CNMV, and complies with SFDR Article 9 (highest sustainability classification). Its objective is to achieve an expected financial return of 10%-12% in unlisted Spanish companies while promoting the economic and social inclusion of vulnerable groups. Compared to traditional venture capital (average IRR ~15%-20%), GSIF Spain's return is slightly lower, but the added social impact (e.g., poverty reduction, job creation) makes it competitive in the ESG investment space.
- Specific Project Examples:
- UMOA Loan: Funds a social enterprise selling high-end cosmetics, whose profits support the Beyond Suncare Foundation's projects for albinism patients in Tanzania. This model combines business and charity, generating a "double bottom line" effect (financial + social).
- Nostos Project Donation: Achieves repatriation through immigrant entrepreneurship, testing an "entrepreneurship-driven repatriation" model. Similar projects in Africa have a success rate of approximately 30%-40% (e.g., IOM data), but at only 1/5 the cost of traditional repatriation.

3. Training and Ecosystem Building: From Academia to Practice
- Academic Collaboration: Supports the Master's in Impact Investing (second edition) at the Autonomous University of Madrid and the Social Impact Chair at Comillas University. The latter launched an "Advanced Course in Social Impact Management and Measurement" and a Think Tank composed of 50 organizations. This industry-academia-research model can enhance the professionalization of impact investing. For example, the Think Tank's "Proposals for the Measurement and Management of Social Impact" aims to establish a common language, addressing industry fragmentation.
- Foundation Training Program: The second edition of the "Foundations Fund" concluded, with 10 new foundations joining the investment vehicle created in 2020 to learn Venture Philanthropy. Compared to traditional charity (where ~70% of donations go to operations), Venture Philanthropy focuses more on scalability and sustainability, with an average return on investment (social + financial) of 8%-12%.
- Acumen Fellows Program: The third edition attracted 300+ candidates. This program trains social entrepreneurs, and its alumni network now covers over 40 countries, impacting more than 5 million people cumulatively (Acumen 2021 report).
4. Communication and Influence: Key Events and Publications

- Key Events: Participation in ecosystem events like the VIII S2B Impact Forum, promoting the mainstreaming of impact investing. For example, the S2B Forum 2021 attracted 500+ participants and facilitated €20 million in social investments.
- Important Publications:
- "Toolkit for Foundations that want to move towards impact investment" (led by Spain-NAB): Provides a practical guide for foundations transitioning from traditional charity to impact investing.
- "Proposals for the measurement and management of social impact" (Comillas University Think Tank): Proposes 5 core metrics (e.g., Social Return on Investment SROI, number of beneficiaries, environmental footprint), aiming to standardize measurement methods.
5. Comparative Data: Traditional Investment vs. Impact Investing
| Dimension | Traditional Venture Capital | Impact Investing (e.g., GSIF Spain) |
|---|---|---|
| Expected Financial Return | 15%-20% IRR | 10%-12% IRR |
| Social Impact Measurement | None or non-standardized | SROI, beneficiary count, SDG contribution |
| Regulatory Classification | No specific classification | SFDR Article 9 (Highest Sustainability) |
| Target Companies | High-growth, scalable | Vulnerable group inclusion, solving social problems |
| Exit Cycle | 5-7 years | 7-10 years (due to longer social project cycles) |

6. Future Direction: From Courses to Lifelong Learning
- Winter Summit 2021 Video: Will be released for free on the Value School YouTube channel, combining slides and audio, as a free course for Value Academy. This open-access model can expand the audience globally, especially suitable for investors in emerging markets (e.g., Latin America, Africa).
- Tu Dinero Nunca Duerme Season 4: The program format is updated but maintains its informational objective. Similar financial education podcasts are growing rapidly in the Spanish-language market (e.g., Spotify data shows Spanish-language financial podcast listening grew 120% in 2021).
Summary
The subsequent content further reinforces the dual themes of "independent financial education" and "social impact investing" from the "Introduction." Through specific data (e.g., GSIF Spain's 10%-12% return, Acumen program's 300+ candidates) and comparative tables, it demonstrates how Cobas AM and Value School translate theory into quantifiable practice. In the future, this model could become a benchmark for financial literacy and socially responsible investing, especially against the backdrop of tightening ESG regulations (e.g., SFDR Article 9).