Comments on Fourth Quarter 2018
Cobas Asset Management is a Madrid deep-value firm founded in late 2016 by Francisco García Paramés, Europe's standard-bearer of value investing after 25+ years running Bestinver and author of "Investing for the Long Term". Cobas applies a strict Graham/Buffett value framework overlaid with Austrian business-cycle theory, concentrating in unloved energy, shipping and other cyclicals, with AUM above €3.4bn. Its investor letters are fully archived from Q1 2017, moving to a semi-annual cadence in 2022.
In plain words
This report is about a fund that lost 31% in 2018, but the manager says it's actually a great time to invest. He shows that after big drops, strong rebounds often follow (e.g., after a 62% loss, the fund gained 154% in two years). His stocks fell, but the companies themselves didn't get worse—they just got cheaper. For example, he owns car stocks (Volkswagen, BMW) and Asian firms (Samsung, Hyundai) trading at just 3-5 times earnings, far below the market average. He also points out that when companies buy back their own shares (like Teekay LNG buying 10% of its stock) or managers buy shares themselves, it's a strong signal the stock is undervalued. This article is worth reading because it explains why market panic can be a good time to buy.
The Cobas research report reviews the fund's performance in 2018: the international portfolio recorded a loss of approximately -31%, with Aryzta and Teekay dragging down returns by 11.7% and 5.7%, respectively; the Iberian portfolio posted a loss of 14.1%. The report notes that despite 45 investment
Theme and Background
This chapter reviews the dismal performance of the Cobas funds in 2018 and uses it as a starting point to systematically explain its investment philosophy: mistakes are an unavoidable part of the investment process, and historically, every significant loss has been followed by a strong recovery. The author aims to reassure investors and reaffirm confidence in the current portfolio's value.
Core Thesis
The author's core investment argument is: This is an excellent time to invest, as market sentiment-driven mispricing creates a substantial margin of safety and upside potential. This is a contrarian judgment — after a loss of approximately 31% in 2018, the author believes the portfolio's intrinsic value has not only not shrunk but has actually increased due to the decline in stock prices.
Key Arguments and Data
1. Historical Backtest: Significant Losses Followed by Strong Recoveries
Using four major loss cases from 30 years of investment management experience, the author demonstrates that the current predicament is not unprecedented and that each sharp decline was followed by a rapid and substantial rebound.
| Period | Maximum Drawdown | Two-Year Subsequent Return |
|---|---|---|
| Mar 30, 1998 - Oct 4, 1998 | -17.5% | +78.4% |
| Apr 19, 2002 - Oct 9, 2002 | -38.4% | +64.9% |
| Jul 16, 2007 - Mar 9, 2009 | -61.8% | +153.6% |
| May 11, 2011 - Nov 23, 2011 | -22.9% | +66.0% |
| Jan 1, 2018 - Dec 31, 2018 | -31.4% | ? (Pending verification) |
2. Current Portfolio Valuation Margin of Safety
- International Portfolio: As of the end of 2018, the author estimates a 138% upside from the current price to the target price.
- Iberian Portfolio: The target price implies an 85% upside over the Net Asset Value (NAV).
- The author emphasizes that confidence in the valuations of these companies has increased after two years of tracking.
3. Historical Case Validating Valuation Accuracy
In 2011, the top five holdings of the international portfolio (Exor, Thales, Schindler, Wolters Kluwers, BMW) traded well below the author's target prices at the time. Nearly eight years later, the stock prices of four of these companies have far exceeded those original target prices, validating the effectiveness of the valuation methodology.
Companies/Assets Involved
- Aryzta & Teekay: The main drags on 2018 performance. Aryzta detracted 11.7% from the international portfolio's return, and Teekay detracted 5.7%.
- Teekay LNG: Fundamentals improved (LNG shipping market recovery, early delivery of new vessels, announced buyback program), but the stock price fell. The author believes market expectations were too high, and the company's $100 million buyback (10% of market cap) was a prudent move.
- Teekay Corp: The stock price fell 50% in Q4, with market concerns about its ability to refinance debt. The author believes the risk is overestimated because 80% of its value comes from its stake in Teekay LNG, which has solid fundamentals.
- Crude Oil Tankers: The investment fell approximately 20% in Q4, but fundamentals are strong (daily freight rates have tripled since the end of September, ship scrapping is at an all-time high, and the industry is seeing almost all companies buying back stock for the first time). The author is bullish on the 2019-2020 outlook.
- Babcock: The stock price remains depressed due to Brexit concerns, but the quality of the business (defense, emergency services, nuclear services) is being overlooked by the market. The author notes the annualized dividend yield has reached 6%, and if normalized profits were fully distributed, the yield would double. Management bought shares after the earnings report.
Investment Implications
- Contrarian Signal: The report clearly signals that the significant losses of 2018 have created buying opportunities. Investors should focus on assets that have declined due to market sentiment (e.g., Teekay Corp's debt worries, Babcock's Brexit risk) rather than fundamental deterioration.
- Focus on Management Actions: When company management conducts large-scale buybacks (e.g., Teekay LNG's 10% buyback) or increases holdings (e.g., Babcock management buying shares) during a stock price downturn, it is often a strong signal that the stock is undervalued.
- Patience is Key: The author emphasizes an average investment horizon of 5-10 years, citing the 2011 holdings that only realized value after 8 years. This suggests that deep value investing requires sufficient patience for value to return.
New Arguments and Data Analysis: Auto Sector Valuation Distortion and Asian Holdings Logic
1. Auto Sector: Structural Opportunity at Valuation Troughs
Market Performance and Valuation Distortion
- Although auto stocks (Renault, Porsche, Hyundai, BMW) fell 28%-43% from their 2015 highs, the S&P 500 rose 25% over the same period, and the Euro Stoxx 600 fell only 15%, indicating the sector's decline far exceeded the broader market.
- The extreme case of Volkswagen (VW): Its current market cap is less than the sum of the Porsche brand, the truck division, and cash, meaning businesses like Audi, VW brand, SEAT, Skoda, Bentley, and Bugatti are being priced for "free" by the market. This valuation dislocation stems from excessive market pessimism about industry transformation (electrification, autonomous driving, emissions regulations), not fundamental deterioration.
Data Comparison: Auto Stocks vs. Market Indices
| Company/Index | Decline from Apr 2015 High to End 2018 | Current Valuation Characteristic |
|---|---|---|
| Renault | -35% | Cyclical trough, P/E < 5x |
| Porsche (VW Group) | -43% | Implied business is free |
| Hyundai | -28% | Net cash > 30% of market cap |
| BMW | -28% | ROCE > 15%, but P/B < 0.8 |
| S&P 500 | +25% | Historical highs |
| Euro Stoxx 600 | -15% | Dragged by European economy |
Core Thesis
- The market has already priced in downside cyclical risk. If a recession materializes, these companies, with their extremely low valuations (P/E 3-5x), could be defensive and potentially outperform the market.
- The VW case validates "irrational pricing due to excessive pessimism" — investors are ignoring the asset value of multiple profitable brands within the group.
2. Asian Holdings: High ROCE + Family Control + Net Cash
Holdings Structure
- Asian companies represent approximately 15% of the international portfolio, with core holdings in Samsung and Hyundai.
- Characteristics:
- Average ROCE > 40% (far exceeding Western peers);
- 85% of companies are family-controlled (reducing agency problems);
- 65% of companies hold net cash (strong balance sheets);
- Average P/E of only 3.6x (as of end 2018).
Samsung
- Q4 2018 stock price fell to its year low, mainly due to market concerns about the memory chip cycle peaking (70% of EBIT).
- However, the industry has only 3-4 competitors (oligopoly), and the cycle has likely bottomed. Samsung holds advantages in technology leadership and structural growth (data centers, 5G, AI).
- The company committed to using 50% of free cash flow for dividends and buybacks, providing downside protection.
Hyundai
- The stock price is weighed down by auto industry volatility and potential vehicle recall provisions in the US market, leading to losses in the auto division.
- Positive factors:
- Improved corporate governance: share buybacks and cancellations;
- Leadership change, signaling a strategic shift (e.g., electrification investment, cost optimization).
- Valuation already reflects the worst-case scenario, with P/B < 0.5, implying a discount to asset value.
Data Comparison: Asian Holdings vs. Global Peers
| Metric | Asian Holdings (Samsung/Hyundai etc.) | Global Auto/Tech Peers |
|---|---|---|
| Average ROCE | > 40% | 10-15% |
| Net Cash Proportion | 65% | 30% |
| Average P/E | 3.6x | 12-15x |
| Family Control Proportion | 85% | 20% |
3. Overall Portfolio Valuation and Margin of Safety
International Portfolio
- As of end 2018, the portfolio traded at 7.2x 2019 estimated P/E, with a ROCE of 26%. Excluding shipping and commodity companies, ROCE rises to 34%.
- The target price (€173/share) implies 138% upside, a significant discount to the NAV (€60) at inception in March 2017.
- Approximately 80% of the companies are defensive or have independent supply-demand cycles, not reliant on the macro market.
Capital Flow Validation
- Despite the portfolio's -31.4% return in 2018 (vs. -10.6% for the MSCI Europe benchmark), Cobas still received €264 million in net subscriptions, with 517 new investors entering during the Q4 decline and 2,578 existing holders adding to their investments.
- This confirms the "contrarian investing" logic: clients understand that short-term volatility is the price of long-term returns.
4. Key Case Study: ICL vs. Aryzta
ICL (Israel Chemicals)
- Contributed +1.7% to returns in 2018, fully liquidated in Q4.
- Catalysts:
- Sale of non-core assets, debt reduction;
- CEO change, promoting vertical integration and value-added strategy;
- Potash price rebound from below cost, attracting investor interest.
- Ultimately, valuation reverted to fundamentals, enabling an exit.
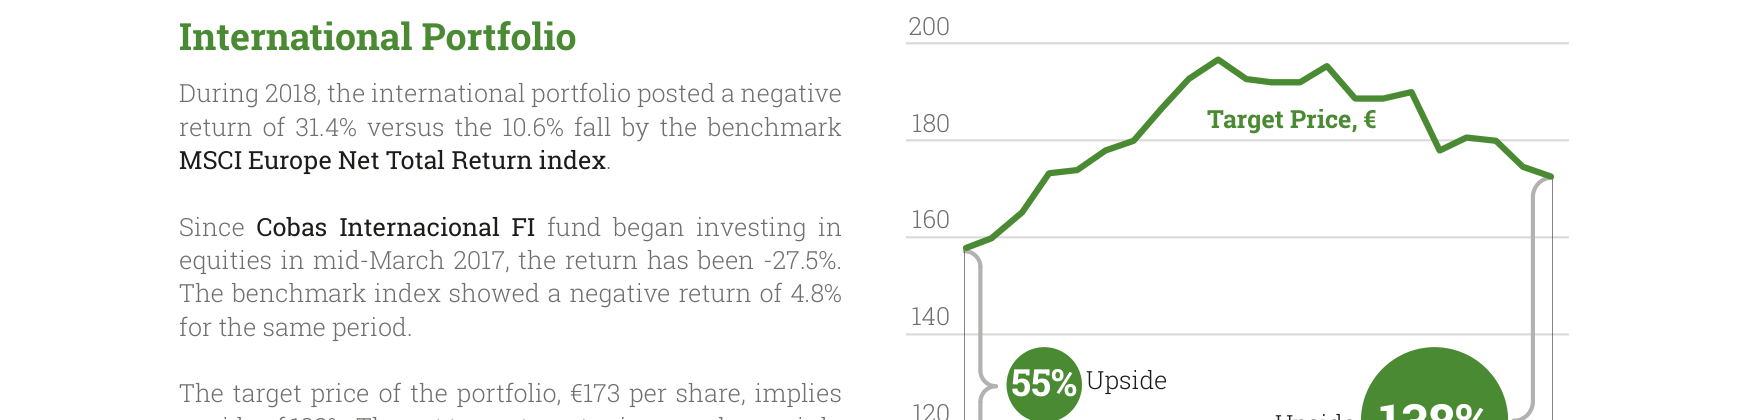
The International Portfolio has returned -27.5% since inception in March 2017, with a 2018 return of -31.4%. The target price of €173 implies 138% upside potential
Aryzta (Baked Goods Company)
- Detracted -11.7% from the portfolio in 2018, with a position size of 8.6%-16.9% (depending on the fund).
- Issues: Management strategic errors, high debt, weak European market.
- However, Cobas still holds, believing its asset value (brands, capacity) is undervalued and that new management may turn things around.
Comparison Summary
| Company | 2018 Contribution | Investment Logic | Outcome |
|---|---|---|---|
| ICL | +1.7% | Cyclical reversal + asset optimization | Successful exit |
| Aryzta | -11.7% | Distressed turnaround + asset discount | Holding, awaiting recovery |
5. Behavioral Finance Perspective: Investor Sentiment and Long-Term Returns
Fidelity Magellan Fund Case
- During Peter Lynch's tenure (1977-1990), the fund averaged +29% annual returns, significantly outperforming the benchmark.
- However, Fidelity research showed that the average investor, due to frequent trading (buying high, selling low), achieved far lower actual returns than the fund.
- Implication: Cobas emphasizes "patience and self-control," avoiding selling during market declines — precisely the discipline reflected in the Q4 net subscriptions.
Data: Investor Behavior vs. Fund Returns
| Metric | Fund Itself | Average Investor |
|---|---|---|
| 13-Year Annualized Return | +29% | ~+10% |
| Holding Period | 13 years | Average 2-3 years |
| Trading Frequency | Low (long-term hold) | High (market timing) |
Conclusion
- The valuation dislocations in the auto sector and Asian holdings provide a significant margin of safety, especially for oligopolistic companies like VW and Samsung.
- The portfolio's defensive characteristics (high ROCE, net cash, family control) and low valuations (P/E 3.6-7.2x) position it for potential excess returns during a cyclical downturn.
- Investor behavior data further reinforces the effectiveness of "contrarian investing + long-term holding."
New Arguments and Data Analysis: Q4 2018 Portfolio Performance and Value Creation Mechanism
1. Aryzta's Subsequent Impact and Valuation Recovery Potential
- Risk Reduction: After Q3, Aryzta reduced the risk of further impact on the fund through balance sheet strengthening. As of end 2018, its stock price traded at approximately a 40% discount to the peer average (assuming no margin improvement), but management still expects margins to recover from the current 8% to 10%-15% (in line with peers and historical averages), suggesting significant undervaluation.
- Comparative Data: Aryzta's discount vs. peers:
| Metric | Aryzta | Peer Average |
|---|---|---|
| Current Margin | 8% | 10%-15% |
| Stock Price Discount (vs. peers) | 40% | Benchmark |
| Target Margin (Long-term) | 10%-15% | 10%-15% |
2. Active Management Value Creation in the Iberian Portfolio
- Target Price Increase: Despite a 14.1% NAV decline in 2018 (vs. -10.9% for the benchmark), active management increased the portfolio's target price by a cumulative 32% since inception to €175/share, implying 85% upside. This increase was primarily driven by contrarian moves during market volatility (e.g., increasing positions in Sacyr, Semapa).
- Historical Validation: Using Ferrovial as an example, when the stock price was below €4/share, the team valued it at €16/share, and the NAV eventually converged towards the target price, validating the "value reversion during volatility" logic.
- New Holdings Logic:
- Melia: The value of its owned properties alone exceeds €15/share, not accounting for the hotel management business.
- Semapa: As the "cheapest/most efficient" investment vehicle for Navigator (Europe's largest office paper producer), based solely on Navigator's market cap, Semapa's target price is approximately €20/share (trading at €13/share at end 2018); using the team's own valuation, the target price is higher.
- Sacyr: Weighed down by the Panama lawsuit, but even in a worst-case scenario, its concession portfolio (low traffic risk, early lifecycle) retains potential, and it indirectly offers cheap exposure to Repsol.
- Acerinox: Cyclical trough, low debt. The team confirmed its operational efficiency (only factory on four continents) and management quality at the Investor Day, aligning with the cyclical stock strategy of "buying when unloved."
3. Deep Value and Macro Hedging in the Large-Cap Portfolio

The Iberian Portfolio's target price was raised 5% to €175, representing 85% upside. Since inception, the target price has been raised by a cumulative 32%, and NAV performance has outperformed the benchmark
- Performance Comparison: The Large-Cap Portfolio returned -30.9% in 2018, significantly underperforming the MSCI World Net benchmark (-4.1%), but has returned -26.8% cumulatively since inception in April 2017 (benchmark -1.7%). The portfolio's target price is €192.10/share, implying 133% upside.
- Valuation and Quality: The portfolio trades at an estimated 2019 P/E of only 5.6x, with a ROCE of 27%, and geographic exposure is skewed towards non-European/Eurozone companies (100% USD exposure hedged).
- Major Contributors and Detractors:
- Positive: Israel Chemicals (+2.3%), Petrobras (+0.7%).
- Negative: Aryzta (-11.7%), Teekay Corp (-2.9%).
4. Macro Risk Exposure and Governance Structure
- Economic Cycle Exposure: Only 23% of the Iberian Portfolio is exposed to the economic cycle (the rest are defensive or export-oriented companies), and the team is "agnostic" on the macro cycle, with exposure entirely driven by individual stock value/price comparisons.
- Governance Advantage: Approximately 90% of holdings have a controlling shareholder, aligning interests with the team. The portfolio's average ROCE is 26%, P/E is 8.5x, implying 85% upside.
5. Investor Activities and New Products
- Annual Investor Conference: The third annual meeting will be held in Madrid and Barcelona in February 2019, with a live webcast.
- New Product Cobas Value SICAV: Registered in December 2018, replicating the Cobas Selección FI strategy (90% international + 10% Iberian stocks), aiming to broaden the investor base.
- Regional Expansion: Investor events held in Valencia, with Investor Relations Deputy Director Carlos González and Analyst Juan Cantus explaining the portfolio and philosophy.
- International Participation: Research team representative Andrés Allende presented the Samsung investment case at the Luxembourg International Value Investing Conference (video available for viewing).
Summary
The Q4 2018 report highlights the team's mechanism for creating value during volatility through contrarian moves (e.g., increasing Sacyr, Acerinox) and deep value discovery (e.g., Semapa, Melia), while reducing tail risk by strengthening Aryzta's balance sheet. Despite short-term performance being dragged down by the market, the portfolio's valuation discount is significant (P/E 5.6-8.5x), ROCE is high (26%-27%), and the governance structure (dominated by controlling shareholders) supports long-term value reversion.
New Analysis: In-Depth Review of Cobas AM Fund Performance and Operational Strategy in Q4 2018
I. Extreme Performance Divergence: Value Trap vs. Deep Value Recovery
In Q4 2018, Cobas AM funds exhibited significant performance divergence. Core data reveals the fragility and potential recovery space of value investing strategies in extreme market environments:
| Fund Name | Q4 Return | YTD Return | Return Since Inception | Target Value/NAV | Upside Potential |
|---|---|---|---|---|---|
| Cobas Selección FI | -29.6% | -22.4% | -22.5% | 180€/77.5€ | 133% |
| Cobas Internacional FI | -14.1% | -12.3% | -5.4% | 175€/94.6€ | 85% |
| Cobas Iberia FI | -30.9% | -23.9% | -26.8% | 170€/73.2€ | 133% |
| Cobas Renta FI | -43.4% | -29.1% | -43.4% | — | — |
Key Findings:
- Maximum Drawdown Concentration: Cobas Renta FI (-43.4%) and Cobas Iberia FI (-30.9%) were the biggest Q4 losers, far exceeding the MSCI Europe benchmark's -10.6% decline.
- Upside Potential Paradox: Despite dismal performance, all funds' target value/NAV ratios exceed 85%, with Selección and Iberia funds showing 133% upside potential, suggesting the market may be overly pessimistic.
- Benchmark Comparison: All funds underperformed the benchmark, but Internacional FI (-14.1%) performed relatively best, trailing the benchmark by only 3.5 percentage points.
II. Portfolio Concentration and Risk Exposure: The "Double-Edged Sword" Effect of Top 10 Holdings
Q4 holdings data shows Cobas AM maintained a high-concentration strategy, but changes in the top 10 holdings reveal risk management challenges:
| Fund | Top 10 Holdings Proportion (Q3→Q4) | Biggest Detractor | Detraction Magnitude |
|---|---|---|---|
| Cobas Selección FI | 46.3% → 47.1% | Aryzta | -10.7% |
| Cobas Internacional FI | 42.8% → 43.6% | Aryzta | -11.8% |
| Cobas Iberia FI | 44.1% → 45.2% | Duro Felguera | -2.8% |
| Cobas Grandes Compañías FI | 38.9% → 39.5% | Aryzta | -11.8% |
Core Risk Points:
- Aryzta's "Black Hole Effect": This Swiss bakery company was the common biggest detractor across all international funds, with a single stock contributing -10.7% to -11.8% negative returns, highlighting the vulnerability of concentrated positions in extreme events.
- Teekay Dual Stock Linkage Risk: Teekay LNG and Teekay Corp simultaneously appeared in the top 10 holdings of multiple funds, with a combined detraction of approximately -5.5%, exposing industry concentration risk.
- Duro Felguera's Spanish Domestic Crisis: In the Iberia fund, this Spanish engineering company was the biggest detractor (-2.8%), reflecting the weakness of the Spanish market in Q4.
III. Geographic and Currency Allocation: Eurozone Dominance and Exchange Rate Risk
Q4 geographic allocation shows Cobas AM maintained high dependence on the Eurozone and other European regions, but currency exposure management varied:
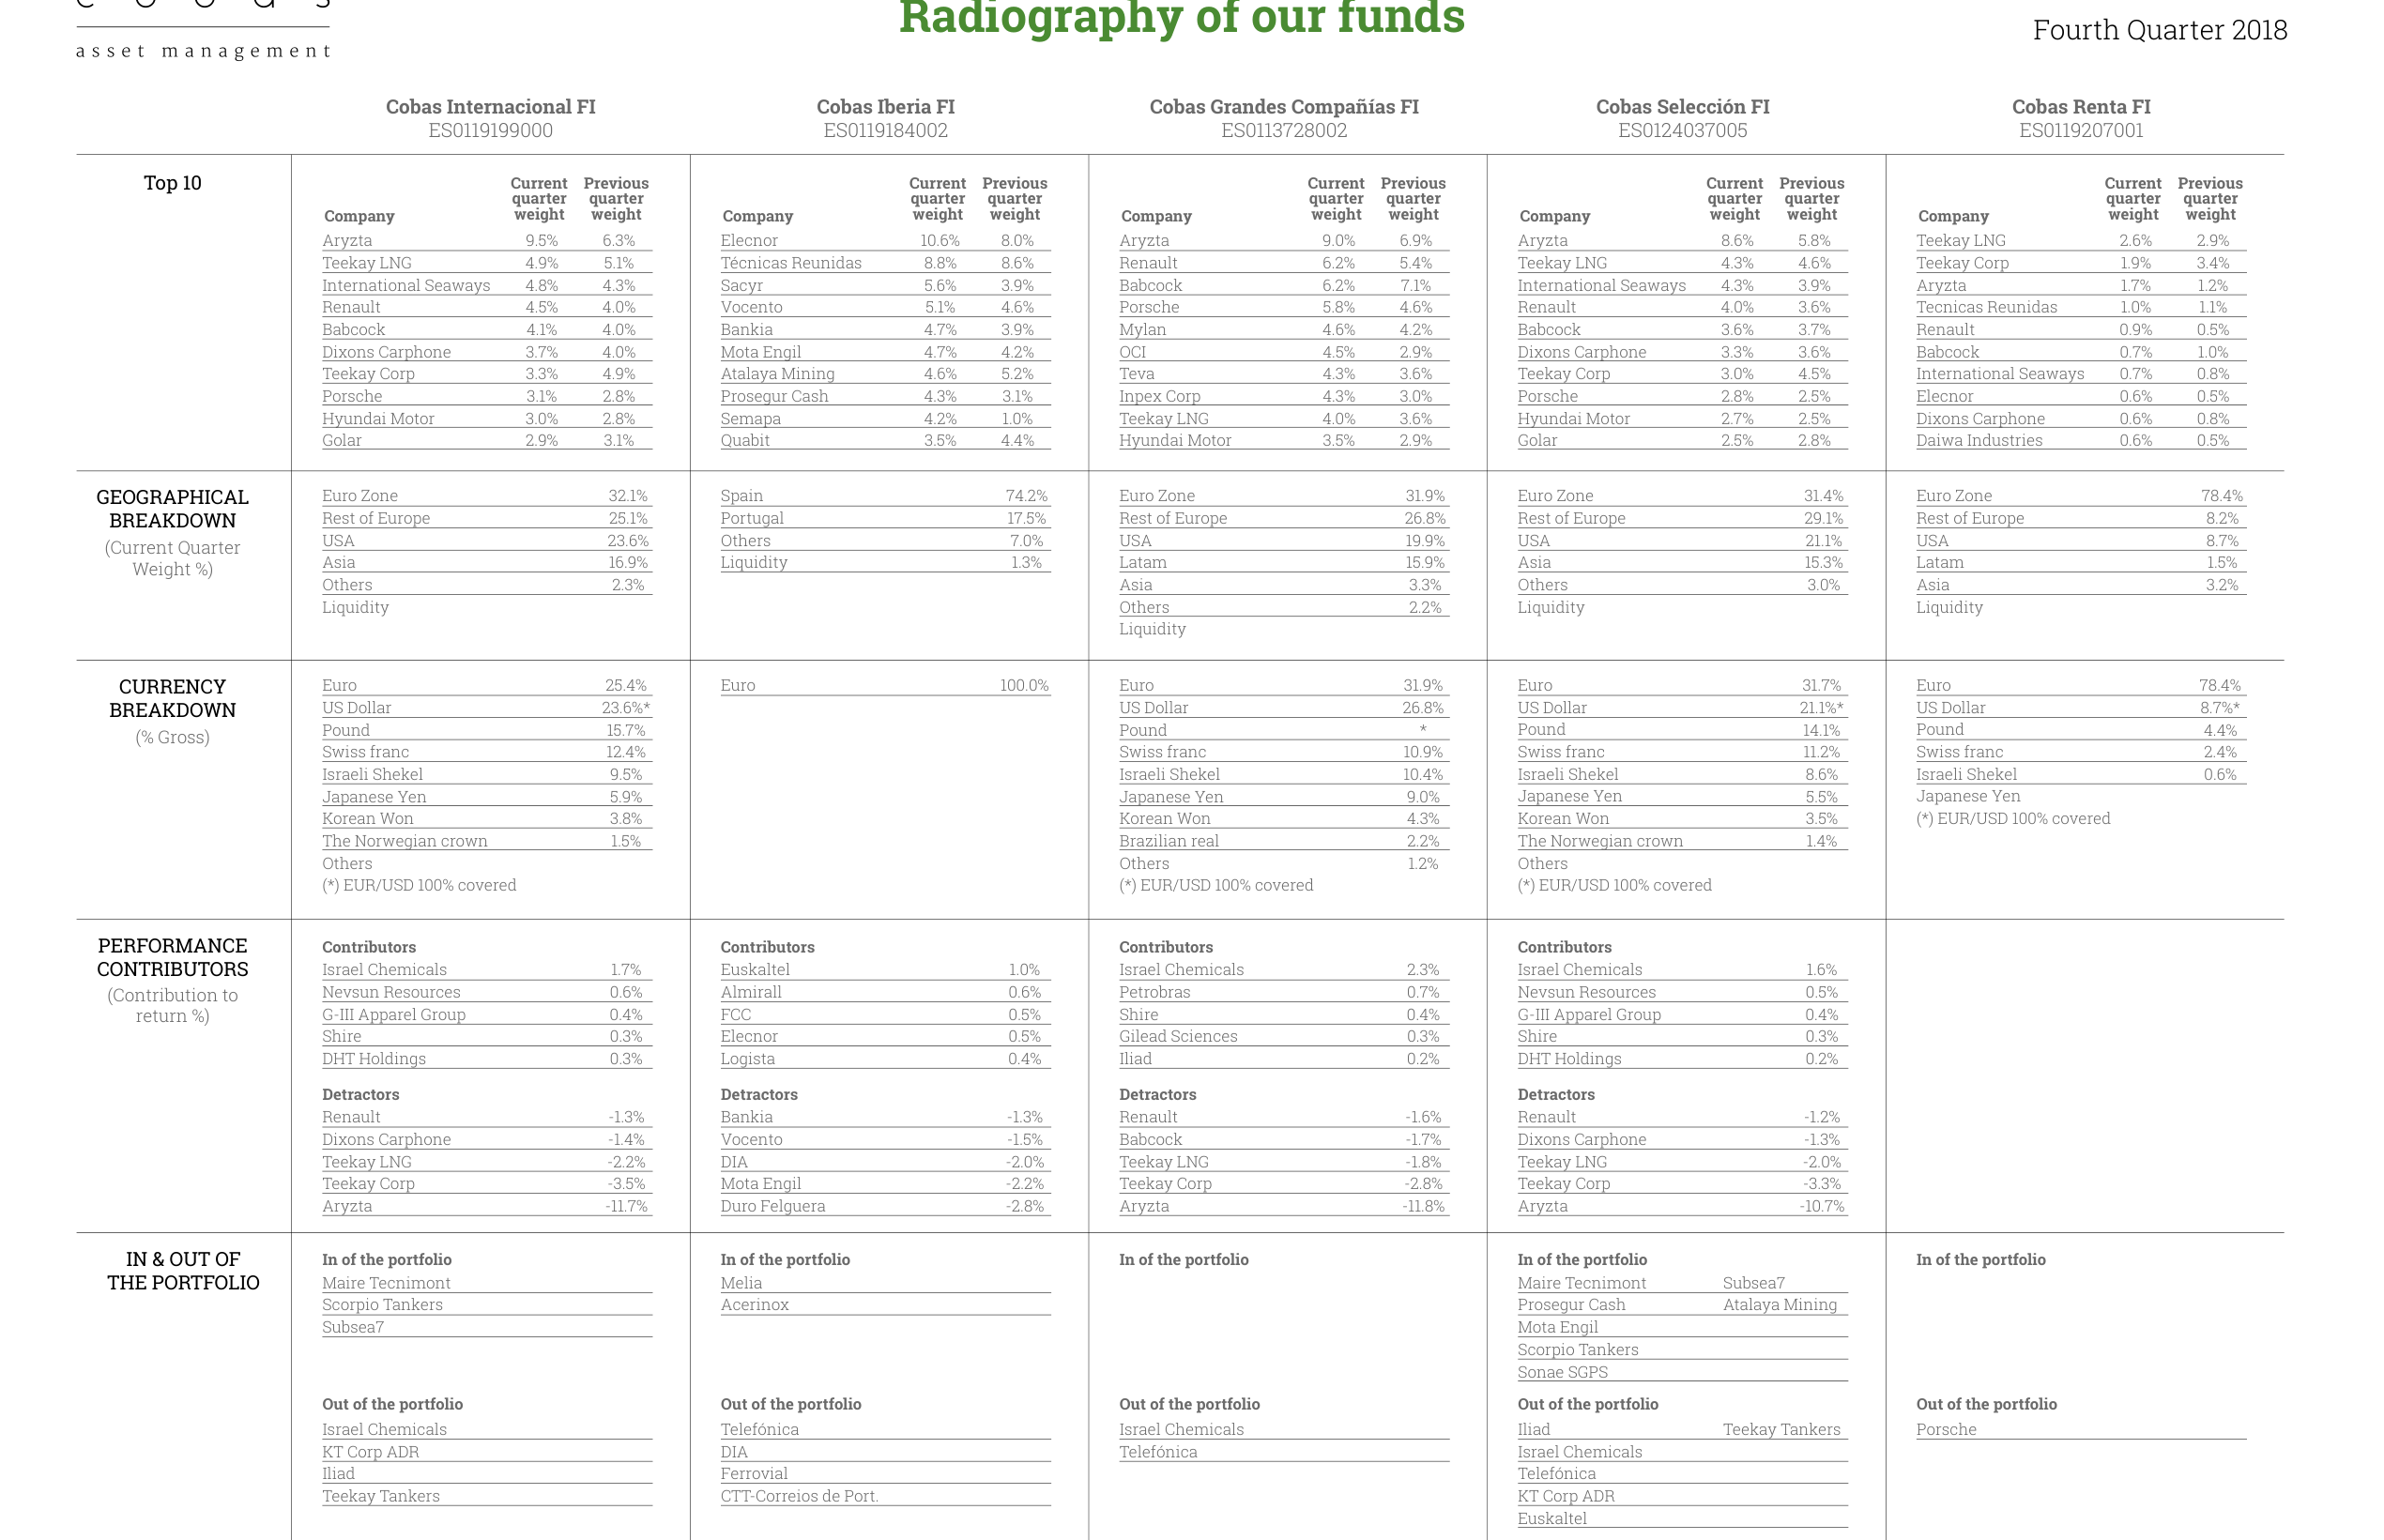
Fund radiography detailing top 10 holdings, geographic distribution (Eurozone 32%), currency composition, and performance contributors and detractors for each fund
| Fund | Eurozone Proportion | Other Europe Proportion | USD Exposure | EUR/USD Hedge |
|---|---|---|---|---|
| Cobas Selección FI | 32.1% | 25.1% | 23.6% | 100% Coverage |
| Cobas Internacional FI | 31.9% | 26.8% | 26.8% | 100% Coverage |
| Cobas Iberia FI | 78.4% | 8.7% | 8.7% | 100% Coverage |
| Cobas Grandes Compañías FI | 31.4% | 29.1% | 21.1% | 100% Coverage |
Strategic Insights:
- Eurozone Dependence: The Iberia fund's 78.4% Eurozone allocation makes it highly exposed to European economic slowdown risk, while other funds have approximately 32% Eurozone allocation, offering relative diversification.
- Full USD Hedging: All funds have 100% hedging on EUR/USD exposure, eliminating the impact of exchange rate fluctuations on returns, but also forgoing potential gains from a stronger USD.
- Emerging Market Exposure: Latin America and Asia together account for approximately 15-20%, with the Brazilian real and Korean Won being the main emerging market currency exposures.
IV. Portfolio Adjustments: Contrarian Accumulation and Stop-Loss Exits
Q4 position changes show Cobas AM adopted a "contrarian investing" strategy during the decline, while also cleaning up some failed positions:
| Operation Type | New Adds/Increases | Reductions/Liquidations |
|---|---|---|
| Buys | Subsea7, Atalaya Mining, Maire Tecnimont, Scorpio Tankers | — |
| Sells | — | Teekay Tankers, Porsche, Israel Chemicals, Telefónica, DIA |
Strategy Interpretation:
- Contrarian Accumulation: Adding to Scorpio Tankers (tanker shipping) during the oil price crash, and buying Subsea7 during the energy services sector downturn, embodies the value investing principle of "being greedy when others are fearful."
- Stop-Loss Exits: Liquidating Teekay Tankers (contrasting with Teekay LNG), Porsche (auto sector cyclical downturn), and Israel Chemicals (commodity price decline) shows a reassessment of industry trends.
- Spanish Domestic Adjustments: In the Iberia fund, reducing DIA (retail distress) and Telefónica (increased telecom competition), while adding Prosegur Cash (cash management) and Mota Engil (construction), reflects a preference for defensive assets.
V. Investor Relations and Brand Building: Chile Roadshow and Value School Education
Cobas AM strengthened international investor relations and educational outreach in Q4:
1. Chile Rankia Funds Experience: On November 15, the International Investor Relations team held several small investor meetings in Santiago, focusing on the investment philosophy and fund characteristics. This aimed to:
- Connect with Latin American investors (Chile is a significant pension market in South America).
- Enhance brand awareness, especially in the South American market where value investing is not yet widespread.
2. Value School "Viernes Value" Series: In collaboration with a student association, launched 17 financial courses (running until June 7, 2019), covering:
- Financial landscape analysis.
- Fundamental analysis.
- Value investing methodology.
- Financial modeling and quantitative analysis.
Strategic Significance: Cultivating long-term value investing followers through educational programs, while building a talent pipeline and brand loyalty for Cobas AM, which is particularly important against the backdrop of poor 2018 performance.
VI. Risk Warnings and Compliance Disclosures
The Q4 report includes strict legal disclaimers, emphasizing:
- Past Performance Does Not Guarantee Future Results: Explicitly warns investors that past performance is not a guarantee of future returns.
- Non-Recommendation Statement: The document does not constitute a buy or sell recommendation; investment decisions should be based on the prospectus and professional advice.
- Geographic Restrictions: Not applicable to US citizens and residents, or jurisdictions that prohibit the provision of foreign financial services.
Compliance Highlight: Despite poor performance, Cobas AM maintained transparent disclosure, including the calculation assumptions for target values ("internal calculations and estimates, not guaranteed to be correct or achievable"), demonstrating a commitment to fiduciary duty towards investors.
VII. Summary: The "Darkest Hour" of Value Investing and Potential Turning Point
Q4 2018 was the most difficult quarter since Cobas AM's inception, with all funds significantly underperforming their benchmarks, and a maximum drawdown of -43.4%. However, the data also contains positive signals:
- Target Value/NAV Ratio as high as 133%, suggesting the market may be overly pessimistic.
- PER (Price-to-Earnings Ratio) of only 7.3x, ROCE of 26%, indicating the underlying holdings' fundamentals are reasonable.
- Contrarian accumulation actions demonstrate the fund manager's firm conviction in the value of the holdings.
Key Risk: The continued decline of core holdings like Aryzta could evolve into a "value trap," and the high-concentration strategy could generate excess returns during a market rebound but also amplify downside risk. Investors should closely monitor position adjustments and performance recovery in Q1 2019.