Baillie Gifford Investment Funds ICVC Interim Report - June 2025
In plain words
This report explains how Baillie Gifford's "defensive growth" fund repositioned in the first half of 2025. The manager expects "mild stagflation" in the US (slow growth, slightly high inflation), so it shifted money from government bonds into higher-yielding credit, especially emerging-market bonds and high-yield debt. Key moves: Baillie Gifford High Yield Bond Fund received the biggest purchase and became the top holding; emerging-market bond exposure rose from about 9% to nearly 14%, including risky sovereign debt from Angola and Ukraine; and rare-earth miner Lynas was kept as a commodities bet. The fund also shorted the Nasdaq (betting it would fall) to hedge stock-market tail risks.
The June 2025 report of Baillie Gifford Investment Funds ICVC covers four sub-funds under its management. As of June 30, 2025, the company operates a total of four sub-funds, each valued daily with a distinct fee structure. A key change: effective March 24, 2025, the Baillie Gifford Defensive Growth
Fund Matters
This section covers ICVC company-level structure and governance disclosures, excluding performance, holdings, or manager market views; substantive information is concentrated in one investment objective amendment, one sub-fund merger, tax distribution mechanisms, and new share classes.
As of June 30, 2025, the company operated four sub-funds, with daily valuations and single pricing. Each sub-fund has different fee structures and subscription limits, with a conversion mechanism between sub-funds. The prospectus was most recently revised on July 31, 2025, and the Instrument of Incorporation was most recently amended on June 27, 2025.
Regarding tax distribution: the Baillie Gifford Diversified Growth Fund and the Baillie Gifford Multi Asset Growth Fund have elected the Tax Elected Fund (TEF) regime, allowing both dividend and non-dividend distributions; the Baillie Gifford Defensive Growth Fund, the Baillie Gifford Long Term Global Growth Investment Fund, and the Baillie Gifford Positive Change Fund have not made this election and make dividend-only distributions.
Key changes are as follows:
| Item | Effective Date | Disclosure |
|---|---|---|
| Baillie Gifford Defensive Growth Fund investment objective amendment | March 24, 2025 | Removed the original restrictive non-financial objective (carbon footprint must be below the fund's established carbon budget), replaced with a focus on investing in companies that may play a role in the transition to a low-carbon future; investment policy adjusted accordingly to better meet shareholders' expectations for assets includable in the portfolio, while continuing to apply internal sustainability assessments and excluding assets assessed as unsustainable |
| Baillie Gifford Multi Asset Growth Fund merged into Baillie Gifford Defensive Growth Fund | June 27, 2025 | Following the merger, the ACD no longer actively seeks subscriptions to the Multi Asset Growth Fund |
| Baillie Gifford Defensive Growth Fund added J-class and P-class shares | April 1, 2025 | — |
| Baillie Gifford Diversified Growth Fund and Baillie Gifford Positive Change Fund added P-class shares | May 15, 2025 | — |
Assessment Logic and Limitations of Risk/Reward Indicators
- The fund's position on the seven-level risk/reward scale (inferred from the textual description's ordering, roughly at Level 4, i.e., the middle ground) is not calculated based on complete historical data. Since the fund was only established in May 2022, with less than five years of history, the report explicitly states that return data from the comparable sector prior to the fund's inception was used to fill the gap. This treatment is compliant with industry regulations, but raises two implicit issues: first, sector representativeness deviates from the fund's actual strategy (the fund has sustainability screening and downside control objectives, and sector averages may not reflect equivalent constraints); second, the indicator is based on historical volatility and returns and cannot capture future structural changes—such as event-driven shocks mentioned in the text, including the US credit rating downgrade and geopolitical conflicts.
- Beneath the indicator table, "material risks not included" are explicitly listed, including no guarantee of short-term loss control, bond exposure to interest rates and inflation, risks specific to China-related investments, custody risk, and loss of liquidity in extreme scenarios. This effectively acknowledges the indicator's limitation as a "risk profile." Investors who only look at the level and ignore these textual notes will underestimate extreme tail risks.
Sustainability and Screening Mechanisms in Investment Policy
- The fund's investment policy exhibits clear dual constraints: it pursues broad diversification across asset classes (up to 100% investment in collective investment schemes) while limiting the investable universe through "norms-based assessments" and the definition of a "sustainable economy." A notable detail is that it explicitly uses the UN Global Compact as the default assessment benchmark, supplemented by the Investment Adviser's Administration Principles and Guidance document and firm-wide restrictions. This is more verifiable than funds that merely claim "ESG integration"—although the text also candidly acknowledges that "limitations of third-party data" may affect the achievement of non-financial objectives.
- Quantitative revenue-based screens mean some companies are excluded because business revenue comes from specific areas. Such screens typically cause return differences relative to "unconstrained funds," which the text explicitly notes. This may explain why the fund's position on the risk/reward scale differs from other defensive funds of the same type that lack screens.
Notable Details in Risk Factors
- Derivatives risk is listed separately, with emphasis that they "may amplify losses." The fund actually uses credit default swaps (CDS) and short positions in the Nasdaq index (see investment report), indicating derivatives are used not only for hedging but also for expressing tactical views. This is a relatively aggressive aspect within the "defensive growth" strategy.
- The dedicated China investment risk disclosure is extensive, covering market closures, trading, liquidity, settlement, corporate governance, regulation, legislation, and taxation. Combined with the investment policy's allowance to "invest in emerging markets," this suggests Chinese assets are not a marginal allocation in the fund's portfolio but an exposure requiring particular vigilance.
- Custody risk is listed alongside "global factor risks" (natural disasters, pandemics, military conflict, policy changes), showing operational risk and macro risk are treated equally. For a fund named "defensive," such language effectively reminds investors that defensiveness is not absolute safety—it merely reduces systematic exposure to one category of risk.
Performance Attribution and Market Judgments in the Investment Report
| Period/Indicator | Fund Performance (B-class Accumulation) | Target Return (UK Base Rate +3.5%) | Difference |
|---|---|---|---|
| H1 2025 | 4.2% | 4.0% | +0.2% |
| Rolling 3-year annualized | 4.0% | N/A (target is 5-year) | — |
- As shown above, the fund slightly exceeded its target on a half-year basis, but the margin was minimal. More importantly, the "3.5% excess" in the fund's objective can only be measured over a rolling five-year period; only three years of actual data currently exist, so any performance comparison shorter than five years is inconclusive. The text itself emphasizes that "five years is a more appropriate evaluation period," contrasting sharply with the one-year/three-year performance displays commonly seen, and consistent with the expectation management logic of a defensive product.
- In the market environment narrative, the core judgment is that "the most likely outcome is the US economy entering a period of mild 'stagflation-lite'"—growth slightly below trend, inflation slightly above target. This judgment drove multiple operations: maintaining the allocation to emerging market bonds (due to a weaker dollar and falling local interest rates), expressing commodity preference through rare earth mining stocks (Lynas and MP Materials), and using CDS and Nasdaq shorts to hedge equity market tail risks.
- Notably, the fund shorted the Nasdaq during the May tariff confrontation, which weakened the contribution from US equity longs. This is not passive defense but a concentrated tactical judgment. Placing such operations within the "defensive growth" framework shows the manager is willing at certain moments to sacrifice some upside in exchange for reduced volatility—which echoes the "lower risk" positioning on the indicator scale.
- Dollar weakness was attributed to Moody's downgrade of the US rating from AAA in May, following previous downgrades by Fitch and S&P. The fund's insight helps explain its FX exposure management: the existence of currency forwards means exchange rate changes have a significant impact on the portfolio.
Pitfalls in Interpreting Performance Data
- The "n/a" periods marked in the chart (2020-2021 and 2021-2022) do not mean the fund had no returns, but rather that the fund had not yet been established. The text states that "sector returns" were used to calculate risk indicators, but the performance chart is left blank outright—suggesting performance presentation is stricter than risk indicators and will not substitute simulated data. This discrepancy is worth investor attention: in the same document, sector data is used to supplement risk indicators, yet hypothetical returns ("as if the fund existed") are refused on the performance chart, indicating regulators permit different levels of disclosure flexibility for the two types of information.
- The "Performance" section at the end of the report has not yet been expanded, but the preceding "market environment" has already provided substantial attribution material. Subsequent content may further break down contributions and drags from specific asset classes—this is a key area to continue tracking.
Defensive Attributes Amid Volatility: Excess Drawdown Control and "Broad-Based Defense"
The report emphasizes that the fund "experienced significantly lower losses than the broader equity market" across multiple high-volatility periods. This statement should be evaluated separately from performance returns themselves—it is empirical support for the fund's "defensive growth" positioning. Combined with the "consistent long-term return objective" total return mentioned earlier, this indicates the fund does not pursue returns at the expense of drawdowns. The relative resilience during volatile periods comes substantially from the portfolio's high proportion of low-correlation assets—infrastructure, insurance-linked securities (ILS), and emerging market bonds—rather than simple cash defense. From the data, the combined weighting of these three asset classes at 43.68% at period end further validates this mechanism: infrastructure 22.86%, emerging market bonds 13.70%, insurance-linked 7.12%. When global equity markets come under pressure, the cash-flow-driven returns and independent risk premia of these assets provide a substantial buffer.
Asset Allocation Panorama: Key Shifts Within Six Months
The Portfolio Statement at the end of the report provides an extremely clear time slice—figures in parentheses are prior-period weightings, and the comparison reveals the scale of tactical rebalancing within six months, far exceeding the "broadly consistent" description:
| Asset Class | Period-End Weighting (June 2025) | Prior Period Weighting | Change |
|---|---|---|---|
| Infrastructure | 22.86% | 20.75% | +2.11pp |
| Emerging Market Bonds | 13.70% | 8.92% | +4.78pp |
| High Yield Credit | 8.47% | 4.49% | +3.98pp |
| Listed Equities | 17.02% | 16.69% | +0.33pp |
| Insurance Linked | 7.12% | 9.20% | -2.08pp |
| Commodities | 3.44% | 4.53% | -1.09pp |
| Government Bonds | 2.47% | 4.69% | -2.22pp |
The two most significant directional changes: emerging market bonds and high yield credit combined increased by 8.76 percentage points; government bonds, insurance-linked, and commodities combined decreased by 5.39 percentage points. This is by no means the fine-tuning implied by "broadly consistent," but a substantial rebalancing driven by "refreshed long-term return expectations"—credit assets replacing rate assets and part of the alternative risk premia as the new source of excess return.
The Essence of April-May Rebalancing: A Complete Picture of Relative Value Switching
The rebalancing directions mentioned in the report text, the buy/sell list, and the changes in Portfolio Statement weightings form a fully closed loop. This is where the rebalancing merits deeper examination—every operation has a corresponding data mirror.
From industrial metals to credit assets: The report explicitly notes reducing industrial metals and shifting toward structured finance, EMD, and high yield bonds. Commodities weighting fell 1.09pp, including the sale of the WisdomTree Aluminium ETC (£6.377 million); the purchase of the WisdomTree Copper ETC (£3.995 million) was merely a rotation within commodities, not a directional reversal. The increase in credit assets was more aggressive: the Baillie Gifford High Yield Bond Fund at £31.627 million was the single largest buy; emerging market bonds increased 4.78pp, covering a broad range of sovereign debt from Angola to Ukraine. This "commodities → credit" switch essentially reallocates the same risk budget from price-elastic assets to cash-flow assets—substituting uncertain price appreciation with higher coupon income.
Infrastructure and insurance-linked: profit-taking rather than trend reversal. The infrastructure weighting actually rose 2.11pp to 22.86%, but structural adjustments occurred within: RWE (£9.399 million sold), Iberdrola (£6.257 million sold), Sequoia Economic Infrastructure Income Fund (£7.874 million sold) realized profits; meanwhile United Utilities was purchased (£3.476 million)—shifting from traditional power companies to more defensive water utilities. The insurance-linked weighting fell 2.08pp, with the sale of Leadenhall UCITS ILS Fund (£10.31 million), but the Portfolio Statement shows multiple newly issued catastrophe bonds from 2025 (Bayou Re, Black Kite Re, Cape Lookout Re, Gateway Re 2025, etc.). This indicates the fund is not exiting ILS but realizing profits from third-party funds when premium rates are at cyclical highs, while shifting to direct holdings of new issues to renew exposure at lower cost and higher transparency, locking in risk premia for the next 2-3 years.
Internal funds replacing external funds: Baillie Gifford internal funds dominate the buy list—High Yield Bond Fund (£31.627 million), Positive Change Fund (£10.279 million), Global Alpha Paris-Aligned Fund (£6.66 million), Responsible Global Equity Income Fund (combined £12.358 million). The sell list includes HSBC Global Asset Backed High Yield Bond Fund (£11.576 million)—although this fund remains a top-ten holding. This operational pattern is consistent with the previously observed "shift from third-party vehicles to internal vehicles," with the core rationale most likely being fee optimization and precise control over investment strategy.
Deeper Characteristics Revealed by the Portfolio Statement
The infrastructure segment is effectively a composite of the "electrification theme." Within the 22.86% weighting, renewable energy operators focused on wind and solar account for approximately 7.2 percentage points combined (Orsted, EDP Renovaveis, Greencoat UK Wind, Octopus Renewables, Renewables Infrastructure Group, Foresight Environmental, etc.); grid and distribution network operators (Terna, Redeia, Hydro One, Fortis, Enel) account for approximately 4.6 percentage points; adding submarine cable and grid equipment manufacturers Nexans, Prysmian, NKT (combined 1.32pp), the entire segment revolves around "the physical infrastructure of the energy transition." This architecture carries more growth attributes than simple "utility defense"—grid expansion and electrification rank among the highest-certainty capital expenditure directions over the next decade, and these assets' cash flows are highly correlated with inflation.
Emerging market bonds exhibit a clear "deep value + frontier market" posture. Within the 13.70% EMD portfolio, there are both relatively large markets such as Brazil, Mexico, Indonesia, and Poland, as well as frontier markets including Angola, Zambia, Tajikistan, and Kyrgyzstan. Two Ukrainian bonds (1.75% 2034 and floating 2041) total 0.37%, and two Argentine bonds (0.75% 2030 and 5% 2038) total 0.34%. Holdings of these low-price, high-coupon instruments reflect the fund's willingness to bear sovereign risk restructuring/rating repair for capital gain potential, not merely carry income. Notably, the EMD portfolio has a meaningful local currency bond component: Brazil (local currency 10% government bond, 0.55%), Indonesia (local currency 8.375%, 0.40%), South Africa (0.37%), Mexico (0.34% local currency), Colombia (0.12% local currency), among others. Local currency exposure layers in exchange rate volatility but correspondingly offers higher interest returns, which explains the return logic of "primarily through higher yields."
A second layer of diversification hidden in the top ten holdings. Baillie Gifford High Yield Bond Fund (5.46%) ranks first, followed closely by Galene Fund at 3.28%—the latter being a multi-strategy hedge fund whose hedging attributes and low correlation with other portfolio assets merit attention. UBS Custom CSI 500 +10.5% ETN (2.31%) appears in the top ten holdings, and the buy list shows this ETN (£13.677 million) alongside the sale of Barclays Modified CSI 500 +8.5% ETN (£6.186 million) constituting a same-direction structural upgrade—the fund's structured exposure to Chinese equities is increasing on a net basis. These conditional-return ETNs, with their enhanced return structures (+10.5% or +8.5%), exhibit a certain "fixed-income-like" characteristic in rangebound markets, which aligns well with the defensive growth positioning.
Risk Observations
The first risk point is the rapid expansion of EMD. In six months it jumped from 8.92% to 13.70%, concentrated in high-yield sovereign debt; if global credit conditions deteriorate or the dollar strengthens, this position could generate significant volatility. The second risk point is the counterparty risk of the ETNs. Structured products such as the UBS Custom CSI 500 +10.5% ETN and the Citi/BG Value Equity ETN have returns highly dependent on the issuing bank's credit, posing default risk under extreme market conditions. The third risk point is the structural reduction within commodities—rare earths (Lynas 1.14%, MP Materials 0.86%) and carbon allowances (SparkChange 1.44%) are retained strategically, but the portfolio's upside beta to traditional industrial metals has been significantly reduced when the global manufacturing cycle recovers.
Overall, the portfolio changes in H1 2025 mark the fund's evolution from a defensive allocation dominated by "infrastructure + diversified hedging" toward an income-enhanced allocation of "infrastructure + credit premium." The systematic expectation refresh in April-May was essentially a decisive execution after reordering the risk premia between credit assets and physical assets in the long-term return model. The ultimate effect requires time to verify, but the Portfolio Statement has clearly demonstrated this intent.
IV. Asset Rebalancing and Fund Expansion: The Turn from Defense to Offense
4.1 Fund Size Nearly Doubles with Significant Inflows
As of June 30, 2025, the fund's total net assets reached £589.8 million, a substantial increase of 88.7% from £312.5 million at end-2024. This growth rate far exceeds the NAV appreciation over the same period (B-class approximately 4.7%, C-class approximately 4.8%), indicating growth came primarily from net subscriptions rather than investment returns. The most direct evidence of capital inflows: C-class Accumulation shares rose from 284.7 million to 483.7 million, up 69.9%; B-class shares surged from 15.45 million to 50.36 million, more than tripling. Additionally, the fund launched new J-class and P-class shares with initial NAV of approximately 103 pence; despite some volatility in the half-year (low of 93.84 pence), both recovered to around 102.96 pence by period end, indicating market fluctuation following the new share issuance. This expansion contrasts interestingly with the "Defensive" name—the fund is rapidly absorbing incremental capital while increasing risk asset exposure.
4.2 Asset Class Allocation: Equities Rise Sharply, Indirect Investments Give Way to Direct Holdings
Core asset allocation changes can be summarized in the table below:
| Asset Class | June 30, 2025 Weighting | December 31, 2024 Weighting | Change (pp) |
|---|---|---|---|
| Equities | 51.14% | 36.08% | +15.06 |
| Bonds | 30.14% | 27.74% | +2.40 |
| Collective Investment Schemes (CIS) | 13.37% | 20.60% | -7.23 |
| Derivatives | -0.85% | -0.86% | +0.01 |
| Cash Equivalents | 2.73% | 12.34% | -9.61 |
| Other Assets | 3.46% | 4.10% | -0.64 |
The equity weighting climbed over 15 percentage points and cash equivalents plunged from 12.34% to 2.73%—both changes indicate the fund manager significantly increased aggressiveness during the market rally. Notably, the CIS weighting fell 7.23 percentage points, yet the fund simultaneously increased holdings in its own affiliated products (Baillie Gifford Responsible Global Equity Income Fund, 2.09%) as well as external CIS. This suggests the reduction likely occurred mainly in other third-party funds, with capital converted into directly held equities and bonds.
4.3 Technology-Dominant Characteristics of Equity Holdings and Emerging Market Exposure
Among the top ten equity holdings, technology and internet platform companies dominate: MercadoLibre (0.50%), Spotify (0.50%), Shopify (0.48%), TSMC (0.48%), Sea Ltd (0.46%) are all typical high-growth names. The fund also holds Cloudflare, Coupang, PDD Holdings, Meituan, and others that are pre-profit or have volatile earnings, each in the 0.20%-0.30% range—a classic "diversified betting" strategy. Notably, through these holdings the fund simultaneously gains multi-regional exposure to Latin America (MercadoLibre, Nu Holdings), Southeast Asia (Sea Ltd, Coupang), China (Meituan, PDD, TSMC), and Europe (Spotify, L'Oreal, Novo Nordisk), rather than concentrating in US/UK markets.
4.4 Structured Finance: Hidden Risks Under the Pursuit of High Yield
Structured finance products rose from 8.22% to 12.10%, the largest increase after equities. The risk points embedded deserve careful reading:
- Galene Fund (3.28%) is the largest holding; the fund's name suggests a credit/event-driven strategy. Its single holding exceeds the entire derivatives portfolio's negative contribution, indicating high concentration risk;
- HSBC Global Asset Backed High Yield Bond Fund (2.46%) and Aegon ABS Opportunity Fund (2.25%) together exceed 4.7%; the underlying assets of such funds are predominantly subprime mortgages and consumer credit, highly sensitive to interest rates and default rates;
- Multiple CLO equity tranche holdings (BCCE 2019-1X E, BNPAM 2021-1X E, CADOG 12X E, CONTE 6X ER, SNDPE 3X E) are directly exposed to the leveraged loan market. These "E" tranches typically sit at the bottom of CLO capital structures, bearing the highest credit risk while offering the richest coupons.
Combined with the fund's simultaneous purchase of high-yield index protection via CDS (see below), it can be inferred that the fund manager recognizes the value in high-yield assets while also hedging against the risk of credit environment deterioration—the strategy direction is clear, but the liquidity risk inherent in structured products cannot be fully eliminated by hedging tools.
4.5 CDS Hedging: The Cost and Signal of Credit Protection
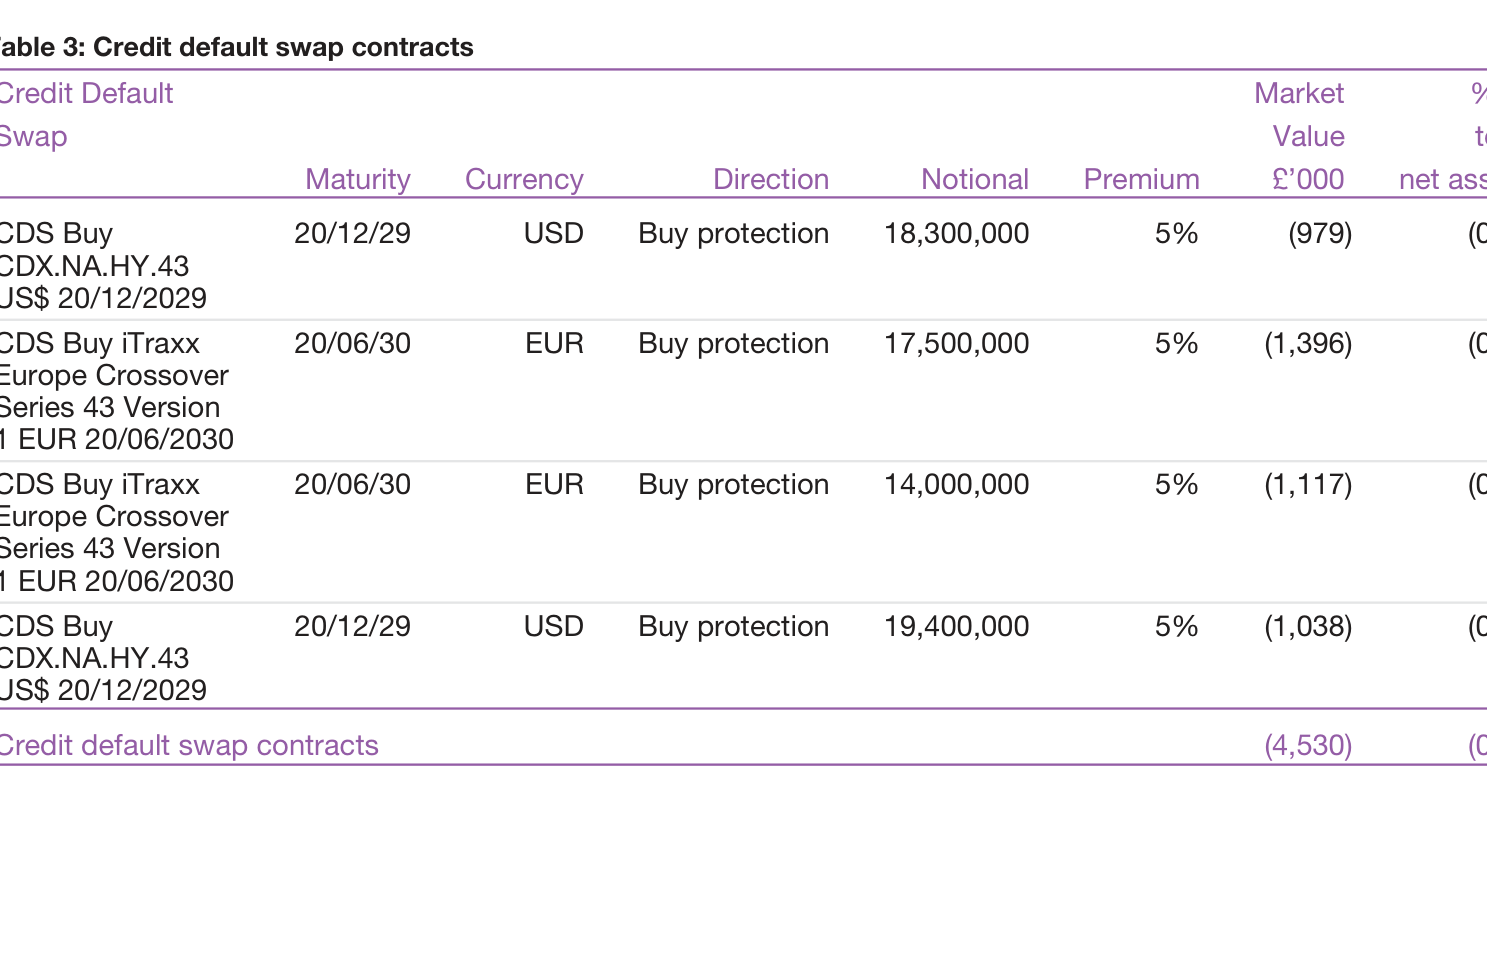
The fund holds four CDS contracts, all buy protection, across two indices:
| CDS Reference | Currency | Notional | Market Value (£'000) | % of Net Assets |
|---|---|---|---|---|
| CDX.NA.HY.43 | USD | 18,300,000 | (979) | (0.16%) |
| CDX.NA.HY.43 | USD | 19,400,000 | (1,038) | (0.18%) |
| iTraxx Europe Crossover S43 | EUR | 17,500,000 | (1,396) | (0.24%) |
| iTraxx Europe Crossover S43 | EUR | 14,000,000 | (1,117) | (0.19%) |
Total notional exposure is approximately US$69.2 million + EUR 31.5 million, corresponding to a market value loss of £4.53 million. All four contracts were loss-making, meaning credit spreads narrowed in H1 2025—the high-risk bond market performed strongly, and the cost of defensive hedging became a real drag in the period. However, from the perspective of the overall portfolio, the CDS provided a "safety cushion" for the fund's structured credit assets; the losses can be viewed as insurance premiums rather than strategy failure.
Another notable detail: all CDS are long-dated contracts maturing in 2029/2030 with a 5% fixed premium. With high-yield credit spreads currently at historical lows, the value of this protection would rise significantly if credit events erupt in clusters in the future.
4.6 FX Hedging Network: Risk Management Across Multiple Currency Exposures
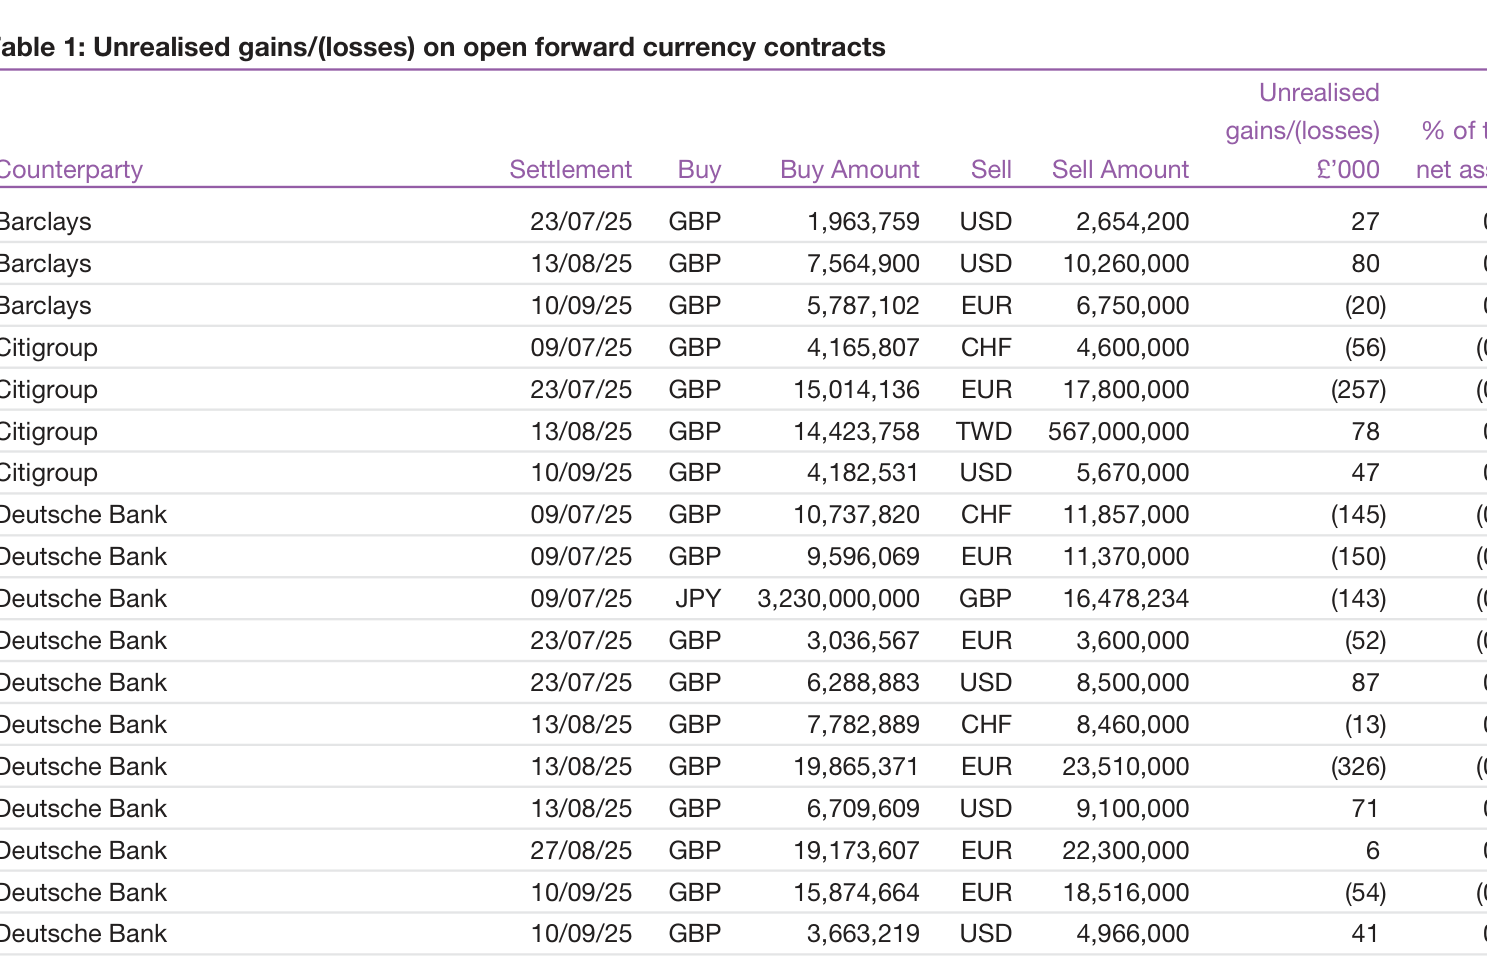
Forward FX contracts involve 11 counterparties and 9 currencies (USD, EUR, CHF, JPY, AUD, CAD, TWD, RON, HUF), with a net unrealized loss of £0.45 million, only -0.08% of assets. P&L is dispersed across currencies:
- Profitable side: USD-related contracts were slightly profitable overall (e.g., Deutsche Bank 13/08/25 contract +£71,000, Merrill Lynch 27/08/25 contract +£241,000); HUF contracts gained £273,000;
- Loss-making side: EUR and CHF-related contracts concentrated losses, particularly Merrill Lynch's RON contract losing £165,000, and Deutsche Bank's EUR contracts losing over £700,000 combined.
The large volume of short-dated rolling contracts (concentrated maturities between July and September 2025) indicates the fund is continuously managing currency risk. Given the fund holds substantial non-GBP assets (US, European, and Asian equities), this hedging network is an important mechanism for maintaining NAV stability—though in a sterling-strengthening environment, some contracts will naturally produce book losses.
4.7 Re-examining the "Defensive Growth" Positioning
Taken together, the fund's allocation sits in notable tension with the "Defensive" label:
| Indicator | Value | Positioning Assessment |
|---|---|---|
| Equity weighting | 51.14% | Far exceeds typical defensive funds (usually <30%) |
| Structured finance + real estate | 19.57% | Heavy allocation to high-yield alternative assets |
| Cash equivalents | 2.73% | Limited defensive room |
| CDS hedging | ~US$100 million notional | Deliberate hedging but costly |
| Net derivatives contribution | -0.85% | Current-period drag on NAV |
Rather than "defensive," this is better described as "a hedged offensive multi-asset strategy." The fund achieves risk control through diversification (79 stocks + multiple alternative asset classes) and derivatives hedging, rather than by reducing risk asset positions for defense. This strategy performs well in up-phases of the credit cycle and during market rallies, but if a systemic risk outbreak occurs, 51% equities + 12% structured credit assets could render the CDS hedge inadequate.
Continuation Analysis: Fee Structure Evolution and Fund Size Surge
1. Cost Optimization and Legacy Differences Revealed by Ongoing Charges Data
The table shows Ongoing Charges changes across four time points for each share class, with several key observations:
| Share Class | 30.06.25 (%) | 31.12.24 (%) | 31.12.23 (%) | 31.12.22 (%) |
|---|---|---|---|---|
| B Accumulation | 0.56 | 0.61 | 0.61 | 0.715 |
| B Income | 0.56 | 0.61 | 0.61 | 0.715 |
| C Accumulation | 0.11 | 0.11 | 0.12 | 0.215 |
| C Income | 0.11 | 0.11 | 0.12 | 0.225 |
| J Accumulation | 0.41 | n/a | n/a | n/a |
| J Income | 0.41 | n/a | n/a | n/a |
| P Accumulation | 0.41 | n/a | n/a | n/a |
Key findings:
- The "scar effect" of historical fee reductions: The December 2022 data was elevated (adding 0.13%) because IA guidance required inclusion of closed-end fund indirect costs; after the FCA adjusted the rules in November 2023, this cost was no longer included. But even excluding that factor, the reduction in B-class from 0.715% to 0.56% remains significant (an actual reduction of approximately 0.155%), consistent with the June 2021 announcement cutting the annual management fee from 0.65% to 0.55%, reflecting the manager proactively passing on scale benefits.
- C-class cost advantage further amplified: The latest C-class fee is only 0.11%, less than one-fifth of B-class, and significantly lower than the J/P-class 0.41%. This differentiated pricing likely targets institutional investors or high-net-worth clients, while B-class as the primary retail channel has limited room for fee compression.
- Pricing anchor for new J/P-class shares: The J/P-class launched in April 2025 set Ongoing Charges directly at 0.41%, between B-class and C-class. Given the new shares carry no historical performance burden, the 0.41% pricing likely referenced the median level of comparable multi-asset funds while reserving room for possible future fee reductions.
2. "Share Exchange-Style" Expansion Revealed by Financial Statements
The Statement of Change in Net Assets shows total fund assets surged from £312,539 thousand to £589,843 thousand, an increase of 88.7%. The primary source of growth was not cash subscriptions but "Creation of shares settled by transfer of stocks"—which amounted to £266,672 thousand, representing 96.2% of the increase in net assets from activities (£277,304 thousand). Meanwhile, cash basis showed net redemptions: subscriptions of £9,017 thousand minus redemptions of £17,137 thousand, a net outflow of £8,120 thousand. This structure indicates:
- In-kind subscription/redemption mechanisms were used at scale: investors (likely institutions) transferred existing securities directly into the fund in exchange for shares, rather than selling first and then subscribing. This approach avoids transaction costs and tax triggers, and is particularly common in funds like the Defensive Growth Fund where equities are the primary underlying assets.
- Debtors on the balance sheet surged by £300,195 thousand (opening balance only £10,493 thousand), with the amount closely matching "Creation of shares settled by transfer of stocks" (£266,672 thousand plus possibly unsettled receivables), indicating a large volume of confirmed but unsettled stock transfer transactions at period end. This explains why total assets reached £884,275 thousand while net assets were only £589,843 thousand—the liability side's Other creditors also expanded in tandem to £286,135 thousand (opening £2,865 thousand), creating a "high receivables and payables" settlement-period profile.
- Investment assets increased from £265,108 thousand to £559,788 thousand, but net capital gains were only £8,827 thousand, indicating scale growth came almost entirely from new investment inflows rather than market appreciation. This also means the fund manager needed to deploy a large volume of new assets within a short timeframe, potentially facing building costs and management pressure in practice.
3. Detailed Comparison of Total Return Components
| Item | 30 June 2025 (£'000) | 30 June 2024 (£'000) | YoY Change |
|---|---|---|---|
| Net capital gains/(losses) | 8,827 | (82) | Turned from loss to gain |
| Revenue | 6,318 | 6,618 | -4.5% |
| Expenses | (95) | (301) | -68.4% |
| Net revenue after taxation | 5,361 | 5,472 | -2.0% |
| Total return before distributions | 14,188 | 5,390 | +163.2% |
| Distributions | (3,052) | (3,028) | +0.8% |
| Change in net assets from activities | 11,136 | 2,362 | +371.5% |
Expenses fell sharply by 68.4% (from £301 thousand to £95 thousand), against the backdrop of the fund's size having declined to £312,539 thousand by end-2024 (previously reaching £360,588 thousand), along with B-class fee reductions and a potentially higher C-class share mix—all directly lowering the total expense burden. Notably, despite a 4.5% decline in revenue, the fee reduction far exceeded the revenue decline, supporting relative stability in net income.
4. Diversified Growth Fund's Objective Design—An Investment Philosophy Under Triple Constraints
Compared with the Defensive Growth Fund, the Diversified Growth Fund's investment objective is more precise and mathematical:
- Rolling five-year annualized return ≥ UK Base Rate + 3.5%: This benchmark is not a fixed index but anchored to the Bank of England base rate, constituting an "interest rate immunized" objective that demands higher absolute returns when rates are elevated.
- Rolling three-year positive return: This sets a shorter drawdown tolerance window than the five-year period, but is "not guaranteed," implying the manager is willing to sacrifice short-term positive returns under certain extreme market conditions to achieve long-term objectives.
- Annualized volatility < 10%: This quantitative risk constraint is written directly into the objective, complementing the Defensive Growth Fund's "limit short-term losses below equities"—the former uses a volatility statistic, the latter uses relative return comparison.
From the Past Performance chart (B2-class), returns over the past five years were highly volatile: 2020-2021 +7.0%, 2021-2022 -10.2%, 2022-2023 +7.5%, 2023-2024 +3.6%, 2024-2025 +3.9%, with a five-year compounded return of roughly 11% (approximate calculation). Though comfortably above Base Rate, the deep 2022 drawdown demonstrates that "positive return not guaranteed" is no empty phrase.
5. New Material Risk Points in Risk Disclosures
The continuation added several risk items in the Risk and Reward Profile section not previously present in the Defensive Growth Fund disclosures:
- China investment risk: explicitly lists "market shutdown, trading, liquidity, settlement, corporate governance, regulation, legislation and taxation" as specific risks, indicating the fund may hold Chinese assets and regulators require more prominent geopolitical risk warnings.
- Settlement risk and liquidity risk: specifically mentions "may be difficult to sell investments in a timely manner" and "delay the selling of your shares if dealing is suspended"—a clear warning about possible suspension of redemptions in open-ended funds during crises, particularly relevant in the current environment of frequent geopolitical conflicts.
- Custody risk: custodian bankruptcy or failure could cause losses; this has rarely been listed separately in prior disclosures, reflecting increased regulatory attention to third-party custody risk.
These new risk descriptions are directly related to the Diversified Growth Fund's multi-asset strategy—the investment universe includes infrastructure, private equity, insurance-linked securities, and other low-liquidity assets that may not be quickly monetized under market stress, intensifying redemption pressure.
6. Horizontal Comparison Between the Two Funds: Objective Differentiation and Market Positioning
| Dimension | Defensive Growth Fund | Diversified Growth Fund |
|---|---|---|
| Core objective | Limit short-term losses below equities + long-term growth | Outperform base rate by 3.5% over rolling 5 years + volatility <10% |
| Investment universe | Mixed assets (equities/bonds primarily) | Broader: includes alternatives, derivatives, currency hedging |
| Quantitative risk constraint | Relative comparison (vs equities) | Absolute volatility threshold (10%) |
| New share class activity | J/P-class launched April 2025, fee 0.41% | No new share classes mentioned, but B-class management fee historically higher |
| Size trend | Major expansion (+88.7%) | Specific data not provided (subsequent pages should provide) |
The Defensive Growth Fund's surge in size was driven primarily by in-kind share exchanges, while the Diversified Growth Fund previously experienced negative returns in 2022 (-10.2%). If its size also shows unusual movements, attention should be paid to investor preference shifts between "defensive" and "diversified" strategies. From available information, the Defensive Growth Fund's 2025 expansion may have attracted institutional capital seeking low-volatility absolute returns, while the Diversified Growth Fund's three-year positive return commitment has not yet been fully demonstrated after the 2022 loss—one reason its risk disclosures repeatedly emphasize "not guaranteed."
Deep Dive into Performance Data: The Gap Between Objective and Reality
The performance figures disclosed in the report deserve closer scrutiny than they appear. The fund's objective is to achieve annualized returns of 3.5% above the UK Base Rate after costs, with five-year volatility below 10%. A breakdown:
| Indicator | Objective | Actual (as of June 30, 2025) | Gap |
|---|---|---|---|
| Five-year annualized return | UK Base Rate + 3.5% (with Base Rate around 4%, target approximately 7.5%) | 2.9% | Trailing by approximately 4.6 percentage points |
| Three-year annualized return | Positive return | 4.1% | Met |
| Six-month return | — | 4.4% (vs 4.0% benchmark) | Outperformed by 0.4 percentage points |
| Five-year annualized volatility | <10% | 7.5% | Met |
There is a notable mismatch here: short-term (six-month) outperformance, long-term (five-year) significant underperformance. The 4.4% half-year return slightly exceeded the benchmark, appearing to return to track—but the five-year annualized return of 2.9% means that if the UK Base Rate holds at current levels, the fund would need to achieve annualized returns near 10% for several years to catch up with its objective—nearly inconceivable in the current market environment. The report's phrasing "fully appreciate that returns over the past few years will have disappointed investors" effectively acknowledges this structural shortfall, but the question investors care about most is: how long will it take to close the five-year deficit, and whether this investment strategy still deserves continued trust.
The "Stagflation-Lite" Scenario Framework: A Contest of Noise and Signals
The fund manager summarizes the US base case as "stagflation-lite"—growth slightly below trend, inflation slightly above target. The framework itself is clever: it avoids panic-driven defense against extreme scenarios while acknowledging environmental uncertainty. But the report's assertion that "most likely all noise" deserves examination.
Several key data points support the "noise thesis": despite successive tariff shocks, the Fed remained in a "watch but no action" state; multiple central banks (Eurozone, Sweden, UK, Australia, New Zealand, and Indonesia, Mexico, South Africa) chose continued easing, suggesting a general global central bank view that economic momentum remains acceptable. However, the "noise thesis" also has blind spots—Moody's downgrade of the US rating pushed the dollar index downward, which is not short-term noise but the beginning of a structural trend. When the credit foundation of the world's largest economy is shaken, emerging markets that rely on dollar funding may benefit in the short term from dollar weakness, but face a reconfiguration of the global risk pricing system in the medium to long term.
Cracks in the Dollar Credit System: The Chain Reaction of Rating Downgrades
The report uses the word "malaise" to describe expectations for the dollar, and the weight of this phrasing warrants expansion. The Moody's downgrade in May 2025 meant the US was removed from AAA status by all three major rating agencies for the first time in history (Fitch and S&P had done so earlier). The impact on portfolio positioning is two-sided:
- Positive: dollar weakness benefits emerging market local currency bonds; the report notes the local currency portion of emerging market bonds benefited from policy rate cuts and dollar weakness—an important source of returns in this asset class.
- Negative: weaker dollar credit could push up US import costs and intensify inflationary pressure, echoing the manager's expectation of "inflation slightly above target"—but also implying rates may stay higher for longer, potentially suppressing longer-duration assets.
The report also discloses the portfolio holds a short position in US 10-year Treasuries, which was a drag this period (Treasury yields fell slightly after volatility). The logic: if dollar credit continues to weaken, long-end rates should rise—but short-term market performance proves this transmission is not linear. This is a typical sample of hedging costs—the direction may be right, but timing is difficult to master.
Dynamic Rebalancing: The Logic of the Shift from Industrial Metals to Credit Assets
The two forecast resets in April and May are the most notable trading behavior this period. The manager decisively reduced industrial metals exposure during price dislocation, shifting toward structured finance, emerging market bonds, and high-yield bonds. The basis for this operation was "better value"—while panic elevated safe-haven asset prices, yield premia on credit assets widened, implying higher expected returns.
| Direction | Assets Involved | Logic |
|---|---|---|
| Reduced | Industrial metals (both WisdomTree Copper ETC and WisdomTree Aluminium ETC sold) | Industrial metals demand expectations weakened amid global economic uncertainty |
| Increased | Structured finance, EMD, high-yield bonds (Baillie Gifford High Yield Bond Fund purchased £50.9 million) | Credit spreads widened, expected returns more attractive |
| Profit-taking | Core infrastructure, insurance-linked securities (ILeadenhall UCITS ILS Fund sold £49.84 million) | Significant prior appreciation, valuations approaching reasonable levels |
Notably, the fund's active increase in Chinese assets continued (UBS CSI 500 +8.65% ETN purchased £13.86 million; Baillie Gifford Worldwide China A Shares Growth at 1.83% of portfolio), indicating the manager remains optimistic about long-term return expectations for the Chinese market despite ongoing geopolitical noise.
The Hidden Cost of Hedging Strategy: The Price of Volatility Control
The report candidly admits that CDS and Nasdaq shorts were a drag this period, while emphasizing their role in "dampening overall volatility." This trade-off is visible in the data: the portfolio's five-year annualized volatility of 7.5% is significantly below the 10% ceiling, and the report notes "losses markedly lower than in broader equity markets"—volatility control is in place.
But one angle deserves raising: excessively low volatility itself means forgoing potential return elasticity. A 7.5% annualized volatility for a diversified portfolio with approximately 15% emerging market bonds, nearly 10% infrastructure, and about 3.5% commodities approaches a "fixed-income-like" risk level. When the portfolio allocates substantial capital to CLOs, asset-backed securities, and insurance-linked securities, its return profile increasingly resembles a credit fund rather than a genuine multi-asset growth fund. Investors need to examine: did they buy this fund for diversified growth, or merely for a volatility number?
The Strategic Significance of Rare Earth Exposure: Allocation Logic Beyond Financial Returns
This period's positive commodity returns came almost entirely from rare earth-related holdings—Lynas Corporation (1.21% of portfolio) and MP Materials (0.81% of portfolio), totaling approximately 2%. The performance of these two companies is not purely supply-demand driven but carries a distinct geopolitical premium: MP Materials, as the only scaled rare earth producer in the US, has undergone a revaluation of strategic value amid US-China rare earth control competition.
The thinking behind this allocation is commendable—rather than simply allocating to commodity ETFs, it selects assets with structural scarcity value. But this strategy also has fragility: if US-China relations ease temporarily, or rare earth substitution technology breaks through, such positions could face rapid valuation normalization. Maintaining approximately 2% exposure constitutes a relatively restrained satellite position with clear logic.
Summary: Five Key Observations
1. Short-term target achievement cannot mask long-term arrears—the structural gap of approximately 4.6 percentage points between the five-year annualized return of 2.9% and the objective cannot be explained by short-term market volatility;
2. The "stagflation-lite" base case is reasonable, but the "all noise" characterization underestimates the far-reaching impact of dollar credit weakening—downgrades by all three major rating agencies constitute a historic shift;
3. The rebalancing from industrial metals to credit assets demonstrates portfolio management agility, but relying on "reassessing long-term return expectations" to make decisions is essentially using forecasting ability to counter uncertainty;
4. The hedging strategy trades short-term returns for volatility control—a negative contribution on the books, but the 7.5% five-year volatility meeting its target means the portfolio indeed did not lose control during panic markets;
5. The success of the rare earth exposure is more a geopolitical dividend than a commodity cycle—its sustainability is questionable, but the current position (approximately 2%) falls within acceptable risk budget.
Asset Class Rotation: A Strategic Migration from Cash to Structured Finance
The December 31, 2024 comparison data provided in parentheses within the notes reveals the most significant allocation adjustment of the half-year—not a simple position tweak, but a purposeful tactical migration.
| Asset Class | June 30, 2025 Weighting | December 31, 2024 Weighting | Change (pp) |
|---|---|---|---|
| Structured Finance | 12.02% | 8.30% | +3.72 |
| Property | 7.77% | 6.44% | +1.33 |
| Cash Equivalents | 3.08% | 7.59% | −4.51 |
| Listed Equities | 16.96% | 19.57% | −2.61 |
| Infrastructure | 22.50% | 25.90% | −3.40 |
| High Yield Credit | 9.06% | 4.28% | +4.78 |
| Insurance Linked | 8.93% | 10.25% | −1.32 |
Core signal: cash positions were nearly halved (−4.51pp), with funds primarily flowing into Structured Finance (+3.72pp) and High Yield Credit (+4.78pp). Combined with the High Yield Credit internals—Baillie Gifford High Yield Bond Fund (£52,906 thousand, 6.07%) and Sequoia Economic Infrastructure Income Fund (£19,265 thousand, 2.21%) contributing 2.95pp of growth collectively—this clearly indicates the manager judged credit spreads still had room to compress and chose to deploy idle capital into higher risk premium assets rather than wait for a market pullback. Notably, High Yield Credit had the fastest growth rate of any asset class, reflecting active credit accumulation in H1 2025.
Structured Finance: A Concentrated Bet on CLOs and ABS
This segment jumped from 8.30% to 12.02%, showing clear top-heavy concentration:
| Holding Fund | Market Value (£'000) | % of Net Assets | Strategy Type |
|---|---|---|---|
| Galene Fund | 30,606 | 3.51 | CLO equity strategy |
| Aegon ABS Opportunity Fund | 22,088 | 2.53 | ABS mezzanine/senior |
| HSBC Global Asset Backed High Yield Bond | 21,375 | 2.45 | Asset-backed high yield bonds |
| Accunia European CLO Fund | 17,655 | 2.03 | European CLO |
| TwentyFour Income Fund | 8,945 | 1.03 | Secured loans/CLO |
These four core holdings combined account for 10.52%, exceeding 87% of the Structured Finance segment. Galene Fund alone at 3.51% is the segment's largest position. This structure shows: the fund is not obtaining beta through indexation but selecting alternative credit managers with strong historical track records for alpha. Particularly notable is Galene Fund—a closed-end CLO equity strategy fund—which typically benefits from the repricing effect of floating-rate assets in a high-rate cycle, indicating the manager remains bullish on credit risk assets at the long end of the rate curve.
Insurance Linked: A Refined Risk-Layering Ladder
While the 17 ILS positions are individually modest (0.26%–0.76%), they form a complete ladder in risk structure:
| Risk Layer | Representative Vehicles | Combined Weighting |
|---|---|---|
| Senior (Class A) | Bayou Re 2025-1 A, Cape Lookout Re 2025-1 A, Integrity Re 2025-1 D excluded | ~3.2% |
| Mezzanine (Class B/C) | Everglades Re II 2025 C, Vitality Re XIV B, Athena Re | ~2.9% |
| Subordinated/high-risk | Gateway Re 2025-2, Winston Re 2025 A, Black Kite Re | ~2.8% |
From issuance year observation, 2025 new issues (Cape Lookout Re 2025-1, Bayou Re 2025-1, Gateway Re 2025-2) appear extensively in the portfolio, while older positions from 2022-2023 (Ursa Re II, Vitality Re XIV) are retained, indicating the manager is continuously rolling into new catastrophe bond issues while reinsurance cycle rates are at historical highs. New 2025 issues account for approximately 30% of the segment, showing the fund is not chasing highs amid elevated market attention but participating in new issues with discipline. This rolling renewal model locks in currently favorable premium pricing while controlling single-catastrophe-year risk exposure.
Sovereign Debt Strategy: Three-Dimensional Diversification Across Coupon-Maturity-Currency
The 28 sovereign/quasi-sovereign instruments listed in this section reveal a clear risk-layering design:
- USD-denominated high coupons (yield anchors): Indonesia 8.375% 2039, Mexico 8.5% 2029, Nigeria 8.375% 2029, Uruguay 8.25% 2031—all coupons above 8%, supporting the portfolio's cash flow contribution
- Local currency deep value: Egypt T-Bills (two maturities totaling approximately 370,300 thousand EGP), Hungary 4.5% 2028 (877,220 thousand HUF), South Africa 6.5% 2041 (133 million ZAR)—with FX forwards partially hedging local currency risk (see below)
- Distressed debt restructuring: Sri Lanka 3.35% 2033, Ukraine 1.75% 2034, Zambia 5.75% 2033—all three are post-crisis restructuring bonds totaling 0.72%, representing small positions with high convexity
The Egypt T-Bill design is particularly noteworthy: two maturities of September 2025 (£31.8 million) and December 2025 (£338.5 million), totaling US$41.9 million equivalent, approximately 0.56% of the portfolio. This ultra-short-dated high-yield local currency paper exploits the deep discount at the front end of the Egyptian rate curve while compressing maturity to within six months to control devaluation risk—a classic "income-enhanced cash management" approach.
Infrastructure: The Complete Puzzle of Energy Transition and Grid Investment
The 25 infrastructure holdings can be grouped into four main threads:
| Sub-Industry | Representative Holdings | Combined Weighting |
|---|---|---|
| Grid and transmission/distribution | Iberdrola, Enel, Terna, Redeia, Hydro One | ~3.7% |
| Electrification equipment/cables | Nexans, Prysmian, NKT, EDP Renovaveis | ~2.2% |
| Renewable energy operations | Orsted, RWE, Greencoat UK Wind, Aquila European | ~4.9% |
| Regulated water/utilities | Severn Trent, United Utilities, Fortis, Eversource | ~3.4% |
Core logic: this is not a traditional "toll-collecting" infrastructure portfolio, but positions built around the certain trend of electricity demand growth and grid upgrades. Nexans and Prysmian are core suppliers for submarine cables and grid expansion; Enel and Iberdrola are principal executors of European grid capital expenditure; renewable operators (Orsted, RWE, EDP Renovaveis) provide stable cash flows under long-term power purchase agreements. Approximately 26% of the entire segment (about 5.9 percentage points) is directly exposed to the electricity investment cycle, far exceeding traditional infrastructure funds' allocations to toll roads or airports.
Listed Equities: Global Stock Selection of New Economy Platforms
The 16.96% listed equity allocation shows a significant stylistic tilt toward platform economics and high-growth technology:
- Digital platforms: Shopify, Spotify, The Trade Desk, AppLovin, Coupang, Sea Ltd
- Semiconductor/AI value chain: ASML, TSMC, Texas Instruments
- Fintech/payments: Adyen, MercadoLibre, Nu Holdings, Mastercard
- Chinese consumer internet: Meituan, PDD, UBS CSI 500 +8.65% ETN
Among these, the UBS CSI 500 +8.65% ETN (1.66%) is a notable vehicle—participating in A-share small caps through a fixed leverage (+8.65%), expressing a targeted bullish view on liquidity-sensitive small and mid-cap enterprises in China, with a relatively conservative leverage design.
FX Hedging Structure: Strong Dollar Positioning and Weak Euro Tail
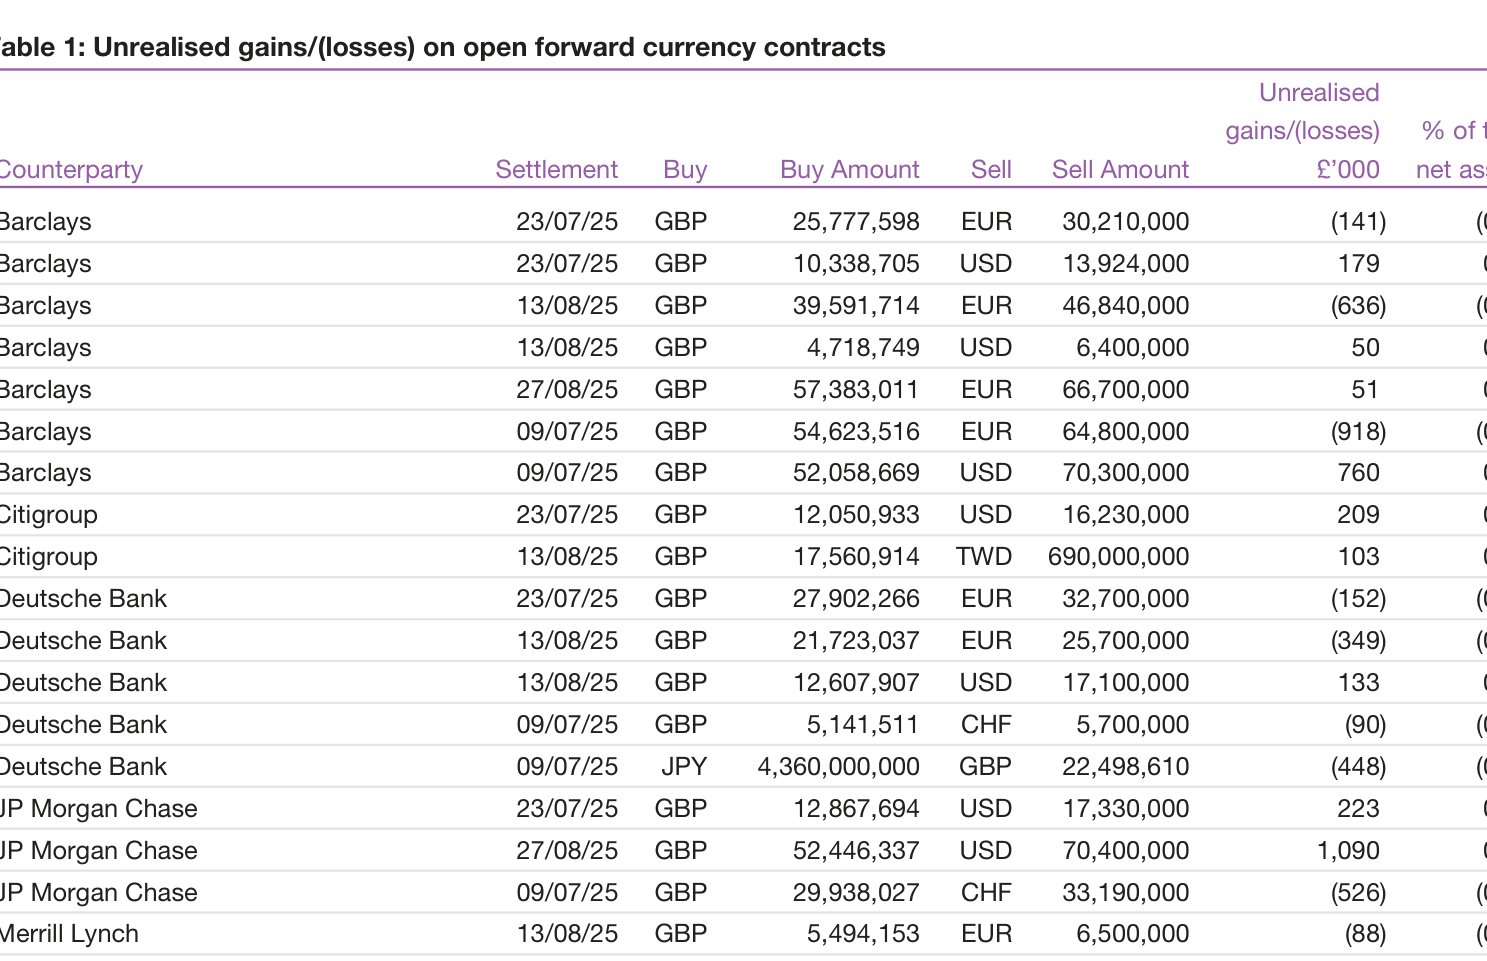
The forward contract detail in Table 1 reveals a sophisticated currency hedging matrix:
| Currency | Total Unrealised P&L (£'000) | Direction |
|---|---|---|
| USD | +3,452 | Significantly profitable |
| EUR | −2,233 | Unrealized loss |
| HUF | +673 | Profitable |
| JPY | −448 | Unrealized loss |
| RON | −372 | Unrealized loss |
| CHF | −616 | Unrealized loss |
| TWD / AUD | +173 | Slightly profitable |
| Total | +589 | Net positive contribution 0.07% |
The broadly positive unrealized gains on USD contracts (all 9 contracts positive) indicate: the fund systematically held buy GBP/sell USD positions during H1 2025, coinciding with dollar weakness against sterling, generating effective hedging gains. The unrealized losses on EUR contracts (5 of 6 negative) stem from EUR/GBP appreciation during the same period—the fund's sale of euros produced book losses. The overall hedging portfolio contributed positively but modestly (0.07%), indicating the manager is not speculating on FX direction but primarily targeting neutral hedging of local currency asset translation risk.
The CDS contract loss of 0.76% (−£6,633 thousand) suggests: this cost protects sovereign and credit positions against tail default risk. Combined with the high weightings in ILS and structured finance, the entire portfolio exhibits an asymmetric return structure of "buying insurance via derivatives, harvesting spreads via alternative credit."
Continuation Analysis: Derivatives Hedging, Share Structure, Fee Evolution, and Financial Perspective
I. Defensive Deployment of Derivative Contracts
This disclosure for the first time fully presents the fund's specific positions across three major derivatives categories, revealing its proactive hedging posture on interest rate and credit risk.
Forward FX contracts: with GBP as the base currency, the fund holds multiple forward contracts across different counterparties and maturities, with net unrealized gains of £589 thousand (0.07% of net assets). Notably, the CHF contract with UBS as counterparty recorded an unrealized loss of £431 thousand, while TWD and USD contracts recorded gains. This distribution indicates the fund is asymmetrically managing multi-currency exposure—both hedging needs and trading P&L from exchange rate movements.
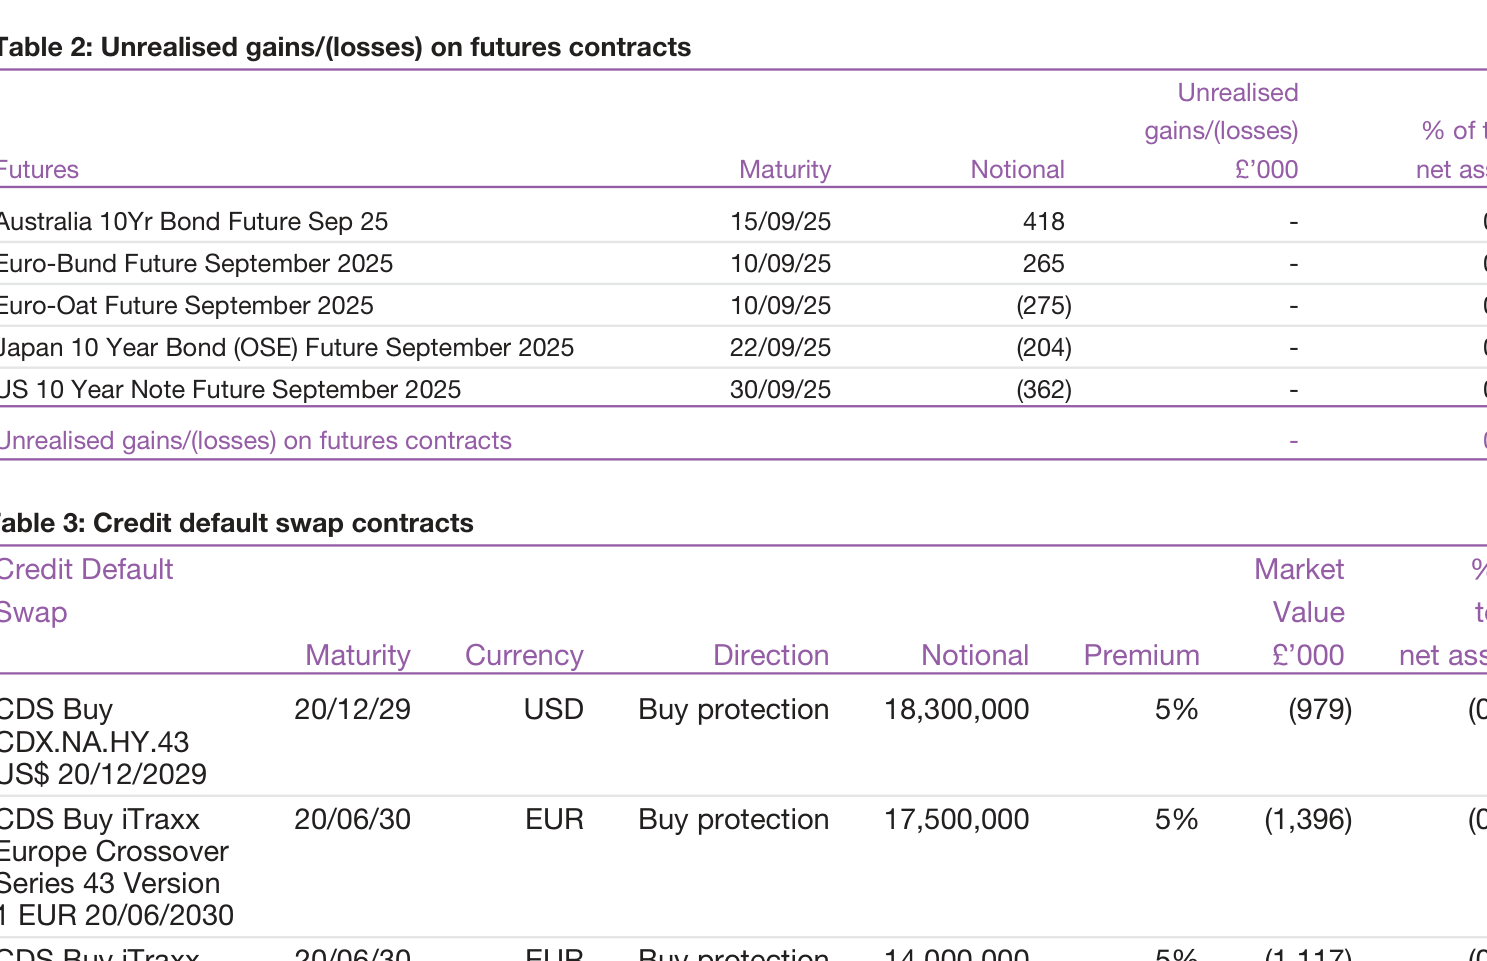
Futures contracts: the fund holds European, Japanese, and US Treasury futures with divergent directions: long Australian and German government bond futures, short French, Japanese, and US Treasury futures. The net amount is only approximately −£231 thousand, near zero as a percentage of net assets. This combination resembles fine-tuning of interest rate duration exposure rather than directional betting.
CDS contracts are the most important information increment in this disclosure. The fund holds two buy protection positions:
| CDS Contract | Notional | Maturity | Unrealised Loss (£'000) | % of Net Assets |
|---|---|---|---|---|
| CDX.NA.HY.43 (North America high yield) | US$54.5 million | 2029/12/20 | (2,916) | (0.33%) |
| iTraxx Europe Crossover S43 V1 (Europe crossover) | €46.6 million | 2030/06/20 | (3,717) | (0.43%) |
| Total | (6,633) | (0.76%) |
The two CDS together represent −0.76% of net assets, the explicit cost the fund pays for credit risk hedging. Selecting high-yield indices rather than investment-grade indices as protection references indicates the manager's concern is not blue-chip credit events but risk asset corrections triggered by credit spread widening. An insurance cost of 0.76% of net assets is not cheap, but it corresponds to active tail risk management.
II. Accelerated Restructuring of Asset Allocation
Comparing this disclosure with end-2024, asset allocation underwent significant structural migration:
| Asset Class | 2025/06/30 Market Value (£'000) | Weighting | 2024/12/31 Market Value (£'000) | Weighting | Change (pp) |
|---|---|---|---|---|---|
| Bonds | 204,687 | 23.48% | 151,322 | 14.26% | +9.22 |
| Derivatives | (6,044) | (0.69%) | (10,279) | (0.97%) | +0.28 |
| Equities | 431,798 | 49.54% | 446,677 | 42.11% | +7.43 |
| Funds | 187,005 | 21.45% | 355,744 | 33.54% | -12.09 |
| Portfolio of investments | 817,446 | 93.78% | 943,464 | 88.94% | +4.84 |
Three key trends merit attention:
First, bond positions jumped 9.22 percentage points, from 14.26% to 23.48%, the largest allocation change in the report. Under the macro expectation that rates may have peaked, the fund is clearly extending fixed income exposure to lock in yields.
Second, funds (Funds) weighting plunged 12.09 percentage points, compressed from one-third to one-fifth. Combined with the simultaneous contraction in total assets, this is not simple rebalancing but the manager actively reducing indirect allocations to other funds and shifting toward direct equity and bond holdings.
Third, the portfolio's share of total assets rose from 88.94% to 93.78%, meaning cash and liquidity buffers narrowed correspondingly, improving capital deployment efficiency.
III. The Brutal Picture of Fund Shrinkage and Share Redemptions
Total net asset data shows a striking downward trajectory:
| Time Point | Total Net Assets (£'000) | Period Change |
|---|---|---|
| 2022/12/31 | 2,991,512 | — |
| 2023/12/31 | 2,291,979 | -23.4% |
| 2024/12/31 | 1,060,763 | -53.7% |
| 2025/06/30 | 871,639 | -17.8% |
Over two and a half years, net assets evaporated by approximately £2.12 billion, a cumulative decline of 70.9%. H1 2025 net redemptions reached £236 million (issuance £36 million vs cancellations £272 million). Although redemption intensity slowed materially from the £973 million in H1 2024, the trend of sustained net outflows remains unchanged.
From the share structure, the trajectory of institutional capital withdrawal is clearer:
- B2 Accumulation: shares fell from 377 million at end-2022 to 47.46 million, down 87.4%
- B Income: from 118 million to 2.85 million, down 97.6%
- C Accumulation: from 838 million to 269 million, down 67.9%
- C Income: only 500 shares remain (13.75 million at end-2022), nearly zeroed out
- P Accumulation: newly issued May 15, 2025, currently 500 shares, more symbolic than substantive
Notably, B Income and C Income saw near "zeroing-out" redemptions—all income investors are exiting, while accumulation share retention is relatively higher. This suggests investors have lost confidence in the fund's current income generation capability, preferring to exit rather than continue holding for capital appreciation.
IV. Long-Term Convergence of the Fee Structure
Ongoing Charges show a year-over-year downward trend:
| Share Class | 30.06.25 | 31.12.24 | 31.12.23 | 31.12.22* |
|---|---|---|---|---|
| B2 Accumulation | 0.66% | 0.68% | 0.70% | 0.83% |
| B Income | 0.66% | 0.68% | 0.70% | 0.83% |
| C Accumulation | 0.11% | 0.13% | 0.15% | 0.28% |
| C Income | 0.11% | 0.12% | 0.15% | 0.28% |
| P Accumulation | 0.57% | n/a | n/a | n/a |
\*Note: 2022 data includes 0.13% of closed-end fund indirect costs included per regulatory guidance adjustments
B-class fees fell from 0.83% to 0.66% (-20%), and C-class from 0.28% to 0.11% (-61%). The C-class fee advantage over B-class widened from 0.55 percentage points to 0.55 percentage points (accounting for the 2022 caliber adjustment, the original gap was approximately 0.55pp and remains). The new P-class fee of 0.57% sits between B-class and C-class, positioned as a mid-tier share for specific channels.
While the continued fee reductions benefit existing investors, against a backdrop of 70% asset shrinkage, the actual decline in management fee revenue far exceeds the fee rate reduction—for Baillie Gifford, this is a test of "declining volumes and prices simultaneously."
V. Operating Quality in the Financial Statements
The H1 2025 income statement shows:
| Item | 2025H1 (£'000) | 2024H1 (£'000) |
|---|---|---|
| Net capital gains | 30,759 | 6,912 |
| Revenue | 18,400 | 30,565 |
| Expenses | (552) | (1,436) |
| Net income (after tax) | 17,147 | 28,676 |
| Total return (before distributions) | 47,906 | 35,588 |
| Distributions | (9,173) | (17,961) |
| Change in net assets from investment activities | 38,733 | 17,627 |
Net capital gains jumped from £6.91 million to £30.76 million, a 345% increase, the core driver of H1 2025 performance improvement. But revenue fell from £30.57 million to £18.40 million (-39.8%). While assets were also contracting over the same period (from £1.351 billion in H1 2024 to £872 million, -35.5%), the revenue decline still slightly exceeded the asset decline, reflecting reduced high-dividend holdings or bond coupon income.
Expenses fell from £1.436 million to £552,000 (-61.5%), a decline far exceeding the asset contraction, indicating fee rates narrowed simultaneously. The final net asset increase of £38.733 million significantly outperformed the £17.627 million in the same period last year.
On the balance sheet, investment assets fell from £958 million to £828 million, but the current asset structure adjusted markedly: cash equivalents plunged from £80.54 million to £26.87 million (-66.6%), while invested assets rose from 88% to 93.8% of the portfolio. This indicates the manager deployed substantial cash into the market, reducing the liquidity buffer—a pragmatic move to improve capital efficiency amid continued asset shrinkage.
VI. Strategic Baton-Passing Signal of the New Fund
The end of the report teases the Baillie Gifford Long Term Global Growth Investment Fund, whose investment objective is clear: outperform the MSCI ACWI Index by at least 2.5 percentage points per annum over a rolling five-year period, with a concentrated portfolio of 30 to 60 stocks and a minimum market cap threshold of US$4 billion.
This product design creates strategic complementarity with the Diversified Growth Fund: the former is an active stock-picking vehicle focused on long-term global growth, the latter a multi-asset allocation fund. Against the backdrop of sustained net redemptions in the Diversified Growth Fund, the launch of the new fund—with concentrated holdings and a high excess return target as selling points—can be seen as Baillie Gifford tilting toward a more aggressive product line while the core stable contracts.
Particularly notable is that the new fund's risk warnings specifically emphasize the risks of investing in China, including market volatility, political and economic instability, market suspensions, trading, liquidity, settlement, corporate governance, regulation, legislation, and taxation—both a candid disclosure of the risk environment for Chinese assets and an implicit indication that the fund will remain cautious on A-share/China ADR exposure.
The Compound Impact of Risk Level and Fee Mechanism
The fund's risk level is indicated as high (toward the upper end of the 1–7 scale, corresponding to Level 6), directly because all assets are invested in company stocks with holdings highly concentrated in a small number of high-growth companies. Notably, the text explicitly states that "fees are primarily deducted from income, with shortfalls deducted from capital"—a clause that is particularly critical when the fund is in a low-dividend, high-reinvestment phase. Since the fund's holdings are predominantly non-dividend or low-dividend growth stocks (e.g., `Cloudflare`, `Spotify`, with limited income coverage), the erosion of capital by fees is amplified in bear market years. Using the 42.1% drawdown in 2021–2022 as an example, if capital-deducted fees are layered on top, the actual NAV loss would be deeper than the nominal drawdown, and the long-term compounding base would correspondingly shrink.
Benchmark Disturbance from Index Change
The report shows the fund changed its benchmark from `FTSE All-World Index` to `MSCI ACWI Index` in June 2023, with the target excess return remaining +2.5% p.a. This change is not a harmless technical adjustment: the two indices differ significantly in constituent composition, regional weights, and industry exposure. For example, `MSCI ACWI` has broader emerging market coverage, and the fund happens to have nearly 14% allocation to China, higher than many global funds. After the benchmark change, the deviation between the fund and its benchmark was redefined, further weakening comparability of historical performance. When interpreting the five-year annualized data (fund 7.4% vs index 11.8%), investors must recognize that only the most recent two years directly align with `MSCI ACWI`; the prior three years were based on the old benchmark, so the final excess gap is not measured on a fully consistent basis.
"Good News and Bad News" in Performance Attribution
| Contributor | Attribution Points | Implied Risk |
|---|---|---|
| `Cloudflare` | Record customer contracts, strategic acquisitions, and executive hires driving revenue growth; expanding share of enterprise security budgets | Rich valuation; any growth deceleration could trigger sharp de-rating |
| `Spotify` | Subscriber growth remained double-digit after price increases; cost cuts delivered profit elasticity; first full-year profit since founding achieved in 2024 | Intensifying streaming competition; limited pricing power |
| `Netflix` | Global subscribers surpassed 300 million; ad-tier penetration rising; margin expansion faster than revenue growth | Rigid content spending; new market penetration peaking |
| `Trade Desk` | First-ever guidance miss (though by only low single digits) triggered near-halving of the stock; revenue growth still above 20% | Market tolerance for high-valuation growth stocks declining; punishment selling once expectations are missed |
| `Meituan` | Intensifying local services competition; rising capital expenditure for overseas expansion; market doubts on margin sustainability | Dual uncertainty of policy and competition in China's internet sector |
| `Atlassian` | Cloud revenue growth, gross margin >85%, free cash flow margin >45%, but weak guidance raised concerns | Enterprise software spending cycle slowing; valuation sensitive to growth expectations |
This attribution list reveals a common thread: current return drivers are not raw materials, cyclicals, or financials, but "digital assets" whose cash flow expansion relies on subscriptions, cloud infrastructure, and platform network effects. Stock prices of such companies are highly sensitive to forward expectations—even a slight deviation from the "perfect narrative" triggers asymmetric declines. The `The Trade Desk` example is particularly illustrative: revenue was still growing rapidly, yet a slight guidance miss halved the market cap, showing the portfolio's volatility stems not from business collapse but from the fragility of valuation expectations.
"Supply-Side Thinking" Reflected in Trading Direction
This period's buy and sell operations have clear internal logic:
- Buying `TSMC` and `Reddit`: respectively represent the core foundry link of AI computing power and an emerging content community traffic entry point. `TSMC` is the "quasi-utility" of high-end semiconductor manufacturing, previously absent from the portfolio; this new build at 2.59% fills the gap in the hard manufacturing end of the AI value chain. `Reddit` offers massive-scale authentic conversation data with potential value for AI training, while its user growth and ad monetization remain early-stage.
- Selling `Tesla`, `AMD`, `Moderna`, `Workday`: `Tesla` faces intense EV competition and pricing pressure; `AMD`'s gap with `NVIDIA` in AI training chips continues to widen; `Moderna`'s new product pipeline carries high uncertainty; `Workday` is seeing growth slowdown with rich valuation. These sell targets generally share characteristics of "strong narrative, weak cash flow"—the portfolio is tilting toward higher fundamental certainty.
Notably, buying weak/selling strong is not simple momentum chasing. For instance, within semiconductors, `TSMC` has lower valuation elasticity than `AMD` but more robust earnings visibility and industry position; `Reddit` has yet to see explosive short-term profits but possesses user network effects similar to early-stage `Spotify`. This indicates the manager, while maintaining a growth style, has added a "structural supply barrier" screening dimension.
Quantitative Observations on Concentration and Geographic Drift
The top ten holdings account for approximately 44.2% combined—even by global active growth fund standards, this is highly concentrated. The largest single holding is `Amazon.com` (6.21%), with the top five exceeding 26% combined. Concentration means individual company operational outcomes will directly determine the portfolio's long-term fate; the five-year annualized underperformance of 4.4 percentage points is precisely the price of misjudgment on specific names within this concentration (e.g., companies that were heavily held early but subsequently weakened).
Geographically, the US weight fell from 55.42% at end-last-year to 48.94%, while new Taiwan positions were added (`TSMC`, 2.59%); China mainland and Hong Kong combined still account for 13.98%. Southeast Asian companies (Singapore's `Sea`, South Korea's `Coupang`) together exceed 7.6%. This reflects a portfolio shift from pure US tech dominance toward a balanced allocation of "global digital economy infrastructure + emerging market consumer platforms." However, political risk exposure to China-related assets has not decreased; significant positions are maintained in `Meituan` and `PDD`, representing an active bet on consumption resilience and competitive dynamics.
The Mathematical Contradiction Between Short-Term Deviation and Long-Term Goals
The six-month fund return was 3.4% versus the index at 0.8%, a difference of 2.6%, which annualized would far exceed the 2.5% target. Yet the five-year annualized return trails the index by 4.4 percentage points, indicating the vast majority of the deficit originated from the 2021–2022 crash. Conversely, if the fund can avoid a drawdown of similar magnitude going forward, the probability of hitting the +2.5% target over the next five years would rise substantially. But the current portfolio's triple concentration—in a single country (US near half), a single sector (tech/consumer), and a single strategy (ultra-long holding)—is precisely the structural root that could amplify drawdowns again.
This "high elasticity, high drawdown, long-term mean reversion" profile requires investors to possess strong liquidity redundancy and mental fortitude. The report's repeated emphasis on "five-year evaluation periods" and "short-term judgments are meaningless" is essentially appealing to holders to accept a five-year survival test—while the fund itself has yet to prove it can consistently beat its benchmark through a full bull-bear cycle.
Continuation New Analysis: Fund Operating Data and Multi-Asset Sub-Fund Signals
I. Redemption-Driven Contraction: Capital Flows Eroding Net Assets More Than Market Volatility
From the Fund Information and Statement of Change in Net Assets, the fund's net assets fell from £2.003 billion at period start to £1.795 billion, a nominal decline of 10.4%. However, NAV actually recorded positive returns over the same period (e.g., B Accumulation rose 4.6%), so the decline was entirely driven by net capital outflows.
| Metric (£'000) | H1 2025 | H1 2024 | YoY Change |
|---|---|---|---|
| Opening net assets | 2,002,870 | 2,089,025 | -4.1% |
| Net capital flows (incl. dilution adjustment) | -297,255 | -361,907 | Redemptions narrowed 17.9% |
| Net change from investment activities | +89,634 | +285,722 | -68.6% |
| Closing net assets | 1,795,249 | 2,012,840 | -10.8% |
A notable detail: absolute net redemptions in H1 2025 remained high at £298 million, equivalent to 14.9% of opening net assets. Although down from 17.3% in H1 2024, two consecutive half-years of approximately 15% bleeding create substantial pressure on the fund's continued viability. If this pace continues, even accounting for NAV growth, the fund's size could fall below £1 billion within 2-3 years, raising marginal management costs.
II. Redemption Divergence Across Share Classes: C-Class Institutional Capital Exits Faster
Comparing share count changes across classes:
| Share Class | End-2024 | End-June 2025 | Half-Year Decline | Two-Year Cumulative Decline |
|---|---|---|---|---|
| B Accumulation | 46,907,939 | 41,472,951 | -11.6% | -50.2% |
| C Accumulation | 90,442,533 | 76,142,639 | -15.8% | -48.8% |
| B Income | 4,536,017 | 3,866,713 | -14.8% | -42.0% |
| C Income | 100 | 100 | 0% | -99.997% |
C-class (low fee 0.02%) redemption rates are higher than B-class (0.64%), possibly indicating institutional investors are more sensitive to portfolio adjustments, or that redemption behavior is more concentrated in institutional-level accounts. C Income share counts plunged from 2.9 million at end-2023 to 100 shares—effectively liquidated, suggesting this class has substantially exited and may exist only as nominal shares. This structural change is easy to overlook in periodic reports but is important for understanding investor composition.
III. Liquidity Signals in the Balance Sheet: Passive Cash Management Under Redemption Pressure
The Balance Sheet shows that despite a £209 million reduction in investment assets (from £1.980 billion to £1.771 billion), cash and bank deposits actually increased by £9.1 million, while debtors surged from £680,000 to £11.06 million (a 15-fold increase), and other creditors spiked from £470,000 to £183.2 million.
These figures form a very clear operational trajectory: the fund continuously sold assets throughout the half-year to meet redemptions, but some sale transactions were not yet settled as of June 30—debtors (sale proceeds receivable) and creditors (redemption payables) both surged simultaneously. Other creditors reached £183 million, equivalent to 10.2% of net assets—a quite high unsettled ratio. A normally operating fund typically retains only small redemption payables (e.g., £470,000 at end-2024). A £183 million level means redemption requests were concentrated and processing was delayed, possibly indicating the fund needed to execute across settlement cycles under extreme market conditions or after receiving single large redemption instructions.
Additionally, investment assets as a percentage of net assets dipped slightly from 98.9% to 98.7%—seemingly unchanged, but in absolute terms declining £209 million, effectively maintaining position ratios during a forced "de-investment" process. Cash represents only 1.7% of total assets, indicating the fund did not proactively retain high cash ratios for investors but responded passively.
IV. Income Distribution and Fee Erosion: The "Hidden" Benefit of C-Class Low Fees
Annual income records show 2024 distributions of 0 per share for B-class and 3.55 per share for C-class (accumulation) and 3.45 (income). Comparing C Accumulation's distribution with its NAV, the dividend yield is only 0.23%, far below the global equity average of approximately 1.5%. This indicates the portfolio is concentrated in low-dividend growth stocks, where income reinvestment is far less important than share price appreciation.
But what truly deserves attention is fee erosion of income: the Ongoing Charges difference between B-class and C-class is 0.62 percentage points; at NAV levels of approximately 1,000-1,500 pence, this equates to 7-9 pence less per share annually. C-class's full-year distribution is only 3.55 pence, meaning B-class completely loses distribution capacity due to higher fees. For long-term investors, a 0.62% fee difference compounds to over 13% NAV gap over 20 years—explaining why C-class shares are dominated by institutional investors.
V. The Closure of the Multi Asset Growth Fund as a Contrast: Active Funds Facing Dual Commercial and Market Tests
This sub-fund was closed on June 27, 2025, and "no longer actively seeking subscriptions" indicates active liquidation or cessation of operations. A telling phenomenon: it achieved positive returns in H1, and its asset allocation (infrastructure, emerging market debt, commodities) performed well in volatile markets—yet it was still closed.
This suggests the closure decision was driven more by commercial factors—insufficient scale, high marketing costs, or parent company strategic contraction—rather than purely performance-driven. Combined with the long-term global growth fund under analysis facing consecutive net redemptions, one can observe that UK retail funds commonly experience "returns present, capital exiting" at cyclical bottoms. Investors prefer cash or passive products after high volatility, losing patience with active management premia.
The Multi Asset fund's operating strategy provides another reference point: it used CDS, shorted the Nasdaq, and shorted US Treasuries as hedging tools. In contrast, the Long Term Global Growth fund's financial statements show only conventional securities investments with no derivatives exposure. During the severe volatility caused by the "tariff crisis" in H1 2025, the multi-asset fund smoothed drawdowns through the low correlation of infrastructure and commodities, while the global growth fund may have borne higher volatility (SRRI at Level 7 for both).
VI. Macro Judgments and Growth Stock Prospects: From "Stagflation-Lite" to Portfolio Resilience
The investment report presents a "stagflation-lite" scenario (growth slightly below trend, inflation slightly above target), a highly succinct macro anchor. For the long-term global growth fund, this scenario has dual implications:
- Unfavorable side: core holdings of large-cap technology and growth companies have valuations highly sensitive to rate and inflation expectations. If inflation persists above target, Fed policy easing space is constrained, long-term rates may stay elevated, suppressing growth stock valuation expansion.
- Favorable side: the report also notes dollar index weakness (due to fiscal deficit concerns), which benefits non-US market earnings, particularly emerging market or European growth stocks the fund may hold. Additionally, structural themes such as AI and energy infrastructure may offset macro headwinds.
The report specifically mentions rare earth commodities (Lynas and MP Materials) benefiting from US-China competition, and the growth fund may also have partial exposure to similar themes. This shows that even without active hedging, certain "geopolitical risk beneficiary stocks" can provide natural protection.
VII. Data Quality Notes: Watch the C Income Share Anomaly and "n/a" Income Records
Multiple places show C Income share counts perpetually at 100, with H1 2025 income records showing "n/a" while 2022-2024 show consecutive distribution records. This may indicate the C Income class has entered liquidation status, retaining only symbolic shares and no longer distributing. For investors reviewing the report, such details are easy to overlook but serve as important early-warning signals when assessing fund continuity. Additionally, H1 2025 does not display per-share income, possibly because no distribution was made during the period—echoing the blank entry in the "Annual Income Record Period to 30.06.25" list.
The analysis presented here is based on the fund information, financial statements, and Multi Asset sub-fund report in this sequel, with emphasis on revealing the fund-flow logic behind the contraction in scale, share-class divergence, traces of redemption operations in the balance sheet, and what the closure of the multi-asset sub-fund reflects about the industry environment. Together, these data point to a single theme: even as NAV repairs, sustained capital withdrawals remain the most severe long-term challenge for active funds.
Liquidation Endgame: When Tactical Rebalancing Meets a Redemption Flood
I. Core Event Assessment: The Substantive Shift from "Rebalancing" to "Exit Liquidation"
The "second adjustment primarily driven by refreshed long-term return expectations" mentioned in the introduction undergoes a fundamental change in narrative character when examined against the fully disclosed financial data. This was not a routine asset-allocation rebalance, but an orderly liquidation ahead of termination. Three key chains of evidence corroborate each other:
1. The ACD stated its termination intent explicitly: The report states directly in the "Basis of Preparation" that the fund no longer qualifies for the going concern assumption, as the ACD intends to terminate the sub-fund.
2. A rigid timeline: Subscriptions and redemptions were closed on 27 June 2025. This means all the rebalancing described in the introduction as occurring in April–May took place in the six weeks before the gate closed; its real purpose was not "seeking better value" but preparing for the known, massive redemption requests.
3. A zeroed-out balance sheet: As of 30 June 2025, net assets stood at £0, with total assets of £304.7M exactly offset by total liabilities of £304.7M — of which Debtors of £271.2M and Other creditors of £304.4M correspond respectively to receivables for unsettled securities and payable redemptions. This is not an "operating" state; it is a "liquidation" state.
Consequently, expressions in the introduction such as "seize opportunities presented by price dislocations" and "we believe [these positions] can offer better value" must be re-read in the context of an exit strategy.
II. Fund Flows and the Collapse in Scale: A Two-and-a-Half-Year Death Spiral
| Date | Net Assets (£'000) | Decline vs. Prior Period | C Acc NAV per Share (pence) |
|---|---|---|---|
| 2022-12-31 | 1,183,798 | — | 119.35 |
| 2023-12-31 | 766,543 | -35.2% | 124.51 |
| 2024-12-31 | 291,415 | -62.0% | 131.54 |
| 2025-06-30 | 0 | -100.0% | n/a |
Assets evaporated by 100% in two and a half years, yet the NAV itself did not collapse — the C Acc share class rose from 119.35 to 131.54 (+10.2%) cumulatively. This constitutes a classic case: the product's returns were respectable, but investor trust had been exhausted. Net redemptions in H1 2025 reached £309.2M (redemptions payable £318.9M less subscriptions receivable £9.7M), equivalent to 106% of the end-2024 size — meaning the entire stock of assets was redeemed within six months, requiring additional liquidation of in-transit funds.
Line-item data shows redemption pressure had already emerged in 2024:
| Share Class | Shares at End-2024 | Shares at End-2022 | Reduction |
|---|---|---|---|
| B1 Accumulation | 46,307,912 | 376,382,478 | -87.7% |
| C Accumulation | 172,194,220 | 504,313,985 | -65.9% |
| All A/B/C classes | — | — | approx. -80% |
The fee base collapsed in tandem with the share counts: H1 2025 expenses were only £132K, down 71.4% from £461K in the same period last year — the manager had in effect ceased operational investment, retaining only the minimum functions required for liquidation.
III. The "Reverse-Order Liquidation" Strategy Revealed by the Buy List
The juxtaposition of largest buys and largest sales exposes the manager's liquidation path:
| Largest Buys (£'000) | Largest Sales (£'000) |
|---|---|
| HSBC Global Asset Backed High Yield Bond Fund 8,572 | Baillie Gifford Global Income Growth Fund 21,135 |
| Baillie Gifford High Yield Bond Fund 5,479 | Baillie Gifford American Fund 12,594 |
| Baillie Gifford Emerging Markets Leading Companies 10,300 | Baillie Gifford Emerging Markets Leading Companies not listed |
| UBS CSI 500 +8.65% ETN 4,058 | Galene Fund 8,343 |
| Cellnex Telecom 2,938 | HSBC Global Asset Backed High Yield Bond Fund 8,073 |
| Brightline East 11% 2030 (144A) 1,661 | SparkChange Physical Carbon ETC 7,362 |
| Egypt T Bill 16/12/2025 1,470 | Terna 7,231 |
| MercadoLibre 1,370 | RWE 7,165 |
| Spotify 1,364 | Australia 4.25% 2034 7,132 |
| Adyen 1,319 | Aegon ABS Opportunity Fund 7,015 |
Interpretation:
- Two-way flows in buys and sells: The same product was both heavily bought and heavily sold in the same reporting period (e.g., HSBC High Yield Bond Fund: £8.6M bought, £8.1M sold). This is consistent with a reservoir operation — first absorbing new subscriptions with liquid instruments, then selling to meet redemptions — rather than active allocation decisions.
- Related-party transactions dominate: Three of the top four largest sales were Baillie Gifford's own funds (Global Income Growth, American, Emerging Markets Leading Companies), totalling approximately £44M; this effectively meant converting illiquid multi-asset positions back into shares of affiliated equity funds before liquidation, then raising cash by redeeming those affiliated funds. This is an implicit "inside-to-outside" channel.
- Preference for high liquidity: The buy side concentrated on bond funds (HSBC Asset Backed High Yield, BG High Yield, Egypt T-Bill, Brightline Private Credit), while the sell side comprised equity positions (MercadoLibre, Spotify, Adyen, Cellnex) and real assets (Terna, RWE, carbon quota ETCs). The execution efficiency of the latter is far lower than the former — which explains why the April–May "recast forecast" tilted toward credit assets: not because credit assets were cheaper, but because they were easier to sell.
IV. Relative Performance Assessment: From "Absolute Positive Return" to "Relative Debacle"
H1 net capital gains of £13.1M and a total return of £18.0M, up 21% YoY, may look respectable at first glance, but should be placed in the following context:
| Metric | 2025 H1 (£'000) | 2024 H1 (£'000) | YoY |
|---|---|---|---|
| Net capital gains | 13,084 | 6,625 | +97.5% |
| Net income | 4,903 | 8,219 | -40.3% |
| Total return | 17,987 | 14,844 | +21.2% |
| Distributions | 4,918 | 5,698 | -13.7% |
Notably: Distributions did not shrink proportionally with the decline in net assets — net assets fell by roughly 80%, yet distributions fell only 13.7%. This means the fund was still paying out income to holders before liquidation, but those payments failed to stem redemptions. Conversely, the disproportionate relationship between shrinking assets and slower-declining distributions raises the question of whether capital was being used to fund distributions — although with positive total returns, this more likely reflects changes in portfolio composition.
More critical is the relative performance data: over 2023–2024, the C Acc NAV rose 10.2%, but the MSCI World Index (in GBP) gained approximately 45–50% over the same period. Even with lower volatility, underperforming the parent index by nearly 40 percentage points for a multi-asset fund is sufficient to explain the collective withdrawal of institutional and retail investors. The fund's NAV peak occurred in 2022 (C Acc 144.8p) and was never breached in the following two years, while global equities set repeated new highs over the same period.
V. The Contrasting Significance of the Zeroed-Out Asset Allocation Table
Every category in the Portfolio Statement is marked 0.00%, with the end-2024 weight in parentheses:
| Asset Class | End-2024 Weight | 30 June 2025 |
|---|---|---|
| Infrastructure | 25.23% | 0.00% |
| Listed Equities | 22.79% | 0.00% |
| Structured Finance | 10.21% | 0.00% |
| Emerging Market Bonds | 9.19% | 0.00% |
| Cash Equivalents | 8.11% | 0.00% |
| Commodities | 7.66% | 0.00% |
| Property | 6.68% | 0.00% |
| High Yield Credit | 4.96% | 0.00% |
| Government Bonds | 2.48% | 0.00% |
| Derivatives | -0.62% | 0.00% |
The juxtaposition of the two tables yields a strategic lesson: the fund's end-2024 allocation was heavily skewed toward illiquid assets — infrastructure (25.2%), property (6.7%), physical commodities (7.7%), and structured finance (10.2%) together accounted for nearly 50%. When the redemption flood arrived, these assets could not remain on the books. All trading before liquidation was essentially about compressing the 50% illiquid exposure to 0%, with bonds, cash, and affiliated fund shares filling the transition. The wide gap between "terminal liquidity" and "normal liquidity" in asset allocation is why this liquidation process took years rather than occurring overnight.
VI. Multi-Layered Implications for the Industry and Investors
1. A warning for active multi-asset strategies: Baillie Gifford is a flag-bearer of growth investing. The liquidation of its multi-asset sub-fund demonstrates that when an asset manager rooted in a single investment research culture enters the multi-asset arena without an independent asymmetric advantage, it can easily become an "intermediate product that fails to keep up in bull markets and falls hard in bear markets," dying under the twin pressures of passive substitution and style drift.
2. Questions about fund governance: Investors subscribed £9.7M to the fund in H1 2025, yet the fund closed on 27 June. This means some investors bought into a vessel destined for liquidation without knowledge or under information asymmetry. Was the asset manager obligated to disclose its termination intent earlier in the first half? This merits regulatory scrutiny.
3. Demystifying the "opportunistic rebalancing" narrative: The "recast forecasts" and "take advantage of price dislocations" from the introduction become ex-post rhetoric in the face of the liquidation facts. When a fund manager is simultaneously the largest seller and the largest buyer, and restructures 50% of positions across asset classes within two quarters, there is only one true motive — the organised arrangement of investor exits.
4. The negative feedback spiral of fees and asset size: Ongoing charges fell from 0.58% to 0.08% (Class C), but only because the absolute fee base atrophied; the shrinking scale further weakened cost absorption, degrading service quality, accelerating redemptions, until death — this is the universal fate of small or contracting funds, and this fund completed the cycle in two and a half years.
Ultimately, the true title of this report should not be "Multi Asset Growth Fund June 2025" but a Liquidation Interim Statement — its introduction was written decorously, but the balance sheet does not lie.
Deep Reading of Key Fund Terms
1. The "At Least 90%" Sustainable Asset Allocation Threshold: Strategic Room in the Remaining 10%
The fund explicitly commits to investing at least 90% of assets in securities of companies contributing to Impact, but notably, the remaining up to 10% can be allocated to money market instruments, deposits, and cash. This design warrants deeper scrutiny:
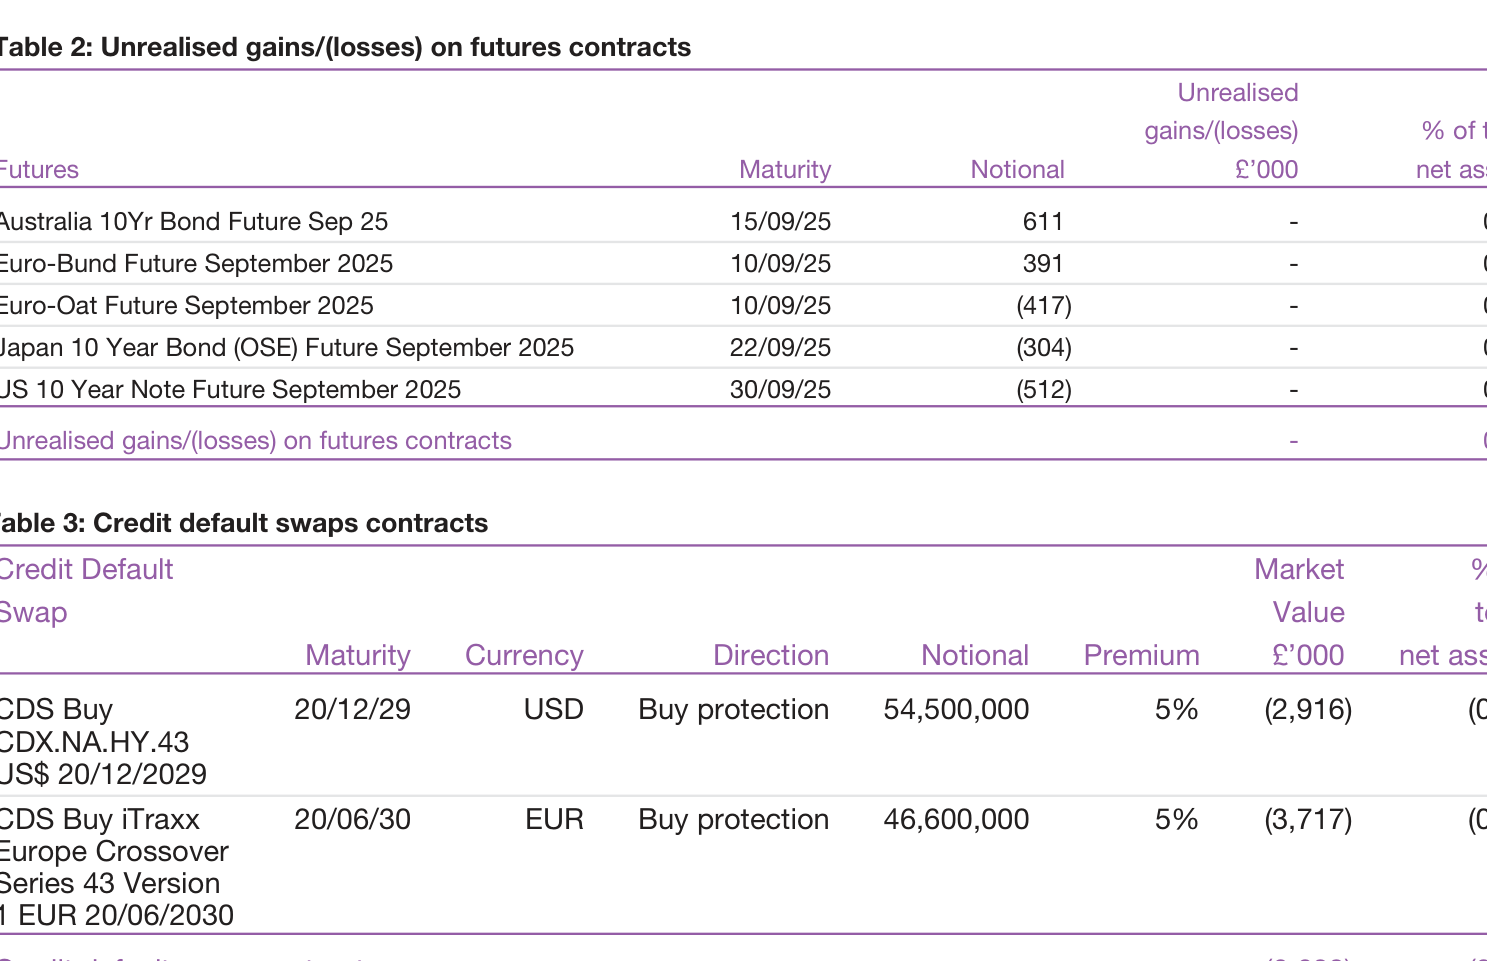
| Term Dimension | Specific Provision | Investment Implication |
|---|---|---|
| Minimum sustainable asset ratio | 90% | Ensures the fund's core positioning is not diluted |
| Use of remaining assets | Money market instruments, deposits, cash | Provides a liquidity buffer rather than pursuing returns |
| Exclusion provision | No investment in or use of derivatives | Simplifies the risk structure, avoiding leverage and hedging complexity |
| Non-conflict statement | "Will not conflict with sustainable objectives" | The remaining 10% is treated neutrally, not seeking excess returns |
These three layers of design (90% floor + 10% liquidity + 100% derivatives ban) effectively construct a clear contractual framework: the fund's core commitment is portfolio purity, while retaining a limited cash buffer to address redemptions and market volatility. The derivatives ban is particularly important — it means the fund cannot hedge currency or market risk through derivatives, leaving its risk exposure fully exposed to the underlying stocks themselves. This is highly consistent with the "high volatility, long holding period" characteristics revealed in the earlier Risk and Reward section.
2. The Temporal Tension Between the Net Zero Commitment and Impact Objectives
The investment adviser commits to managing the fund's holdings to achieve net zero greenhouse gas emissions by 2050 or sooner. This commitment creates an interesting temporal tension with the rolling five-year Impact measurement cycle:
- Short-term mechanism (five-year): Measures each company's products/services actual improvement to current social and environmental challenges, emphasising improvements to the "present circumstances" at the time of investment
- Long-term mechanism (2050): Requires the fund's overall holdings to evolve toward a net zero pathway, involving portfolio-level carbon footprint management and dynamic rebalancing
This means the investment adviser must simultaneously manage asset allocation logic across two time scales: the five-year annual Impact outcome assessment focuses on the inclusive effects of company products/services; while the net zero pathway requires continuous reduction of holdings in high-emission sectors or driving transition through engagement. The two logics may create tension in certain sectors (e.g., basic materials, transportation) — a single company may have clear positive social contributions at the product level (e.g., providing low-cost medical equipment), yet have higher carbon emissions in its production processes. The fund does not disclose specific net zero interim milestones, but from the "2050 or sooner" wording, the investment adviser retains substantial management flexibility.
3. The Three-Layer Active Intervention Mechanism of "Investor Contribution"
A distinctive feature of the fund's investment philosophy is the clear distinction between two concepts: Impact generated by the companies themselves and incremental Impact contributed by the investor (the fund). The latter is achieved through three channels:
| Mechanism | Connotation | Difference from Traditional ESG Funds |
|---|---|---|
| Financial contributions | Capital allocation directly supports companies addressing social/environmental challenges | Directional investment, not exclusionary screening |
| Impact maximising engagements | Active shareholder engagement aimed at maximising impact | Not just voting on governance issues, but deep involvement around impact themes |
| Responsible stewardship | Responsible management and oversight | Emphasises the identity and obligations of a long-term holder |
These three mechanisms make the fund's investment behaviour itself an "impact variable" — capital inflows lower the cost of capital for these high-impact companies, engagement drives them to expand positive externalities, and stewardship ensures management does not deviate from the Impact track. This framework answers a common question: if the fund merely buys shares in companies that already have positive impact, does the fund's own involvement create additional value? The answer is: through capital support and active engagement, the fund's marginal impact on companies is real and measurable (disclosed through the annual Positive Change Impact Report).
4. The Mathematical Meaning of the Five-Year Rolling Performance Target and Benchmark Challenges
The fund sets a clear quantitative target: to outperform the MSCI ACWI Index by at least 2% annually, after costs, on a rolling five-year basis. H1 data shows:
| Metric | Class B Accumulation | MSCI ACWI Index | Index +2% |
|---|---|---|---|
| Six-month return (2025 H1) | 4.0% | 0.8% | 1.8% |
| Five-year annualised return (2020–2025) | 6.6% | 11.8% | 14.1% |
| Five-year cumulative shortfall | -5.2%/yr | — | — |
This data reveals a harsh reality: since 2020, the fund has not only failed to meet the +2% annual excess target, but has trailed the benchmark significantly (underperforming by 5.2 percentage points annualised). Three-year (2022–2025) data also shows negative excess returns (-3.7% vs. benchmark rebound). The fund explains its investment philosophy in the document — "short-term performance measures are insufficient to assess investment skill" — and emphasises that five years is a more reasonable evaluation period. But it is precisely the five-year data (2020–2025) that also falls below the benchmark.
However, from a longer historical perspective, as the chart shows, the 2020–2021 annual excess return was as high as approximately 22 percentage points (49.4% vs. 27.6%), indicating that the fund's style has significant explosive power during strong growth-stock periods, but remains persistently under pressure in value/cyclical-favourable market environments. In fact, the core reason for the cumulative five-year underperformance is the mean reversion following the high base of 2020–2022 — the more it rose in the early period, the more unfavourable the base effect became later.
5. The Contractual Mismatch Between Volatility Characteristics and Target Returns
The fund acknowledges that "share price can be volatile and returns can be much higher or lower than our five-year average target," a self-disclosure fully consistent with SRI classification Level 6 (typically higher rewards, higher risk). The notable surface contradiction is:
- The target is set as "five-year annualised excess return of 2%" — which sounds like a modest, index-enhanced commitment
- The actual portfolio is concentrated, actively stock-selected, and growth-oriented — meaning actual volatility is far greater than a moderate enhancement strategy
Taking 2020–2021 as an example, the fund's annual return was 49.4% while the benchmark was only 27.6%, an excess of 22 percentage points; in 2021–2022 the fund fell -30.1% while the benchmark fell only -3.7%. This kind of double-digit year-to-year positive and negative excess volatility is far from the stable enhancement implied by "+2%". The fund is clearly intentional about this "modest target but violent path" state — the long-term target return (five-year) is composed of many high-volatility years, and the extreme annual excess volatility stems from concentrated holdings' high sensitivity to company fundamentals and market sentiment.
6. Six Substantive Risk Layers in the Risk Disclosures
The risk factors listed by the fund can be viewed as a filter on investor suitability. The candour of these disclosures deserves attention:
| Risk Type | Essence | Potential Impact on Fund Objectives |
|---|---|---|
| Active management style risk | Concentrated holdings + long-term growth orientation | Potential prolonged underperformance relative to benchmark and in absolute terms |
| Limited investment universe risk | Only companies meeting the Impact framework | Produces a fundamentally different return path from unrestricted funds |
| Impact subjectivity risk | "No universally accepted definition of impact" | Individual investments may not produce the expected positive contribution |
| Third-party data limitations | Data may be lagged or estimated | Affects assessment of non-financial metrics |
| Liquidity risk | Difficulty selling in time in adverse markets | May delay redemptions or affect realisable value |
| Custody risk | Custodian insolvency or failure | Assets may suffer losses |
Among these, the fourth (third-party data limitations) and fifth (liquidity risk) are common disclosures in UK UCITS funds, but have special meaning for the Positive Change Fund: Impact measurement relies heavily on non-financial data (environmental and social metrics), whose standards are far less uniform than financial data and with more severe lags. As for liquidity risk, the fund's concentrated holdings include many small and mid-cap companies ("companies of any size"), and the bid-ask spreads and liquidity of such securities in stressed markets are far inferior to large-cap blue chips.
7. Anchoring Between the "by 2050 or Sooner" Net Zero Commitment and Impact Themes
Although the document does not explicitly list each company's net zero pathway requirements, "manage the Fund in order to align holdings with net zero by 2050 or sooner" implies the investment adviser operates a portfolio-level carbon budget management mechanism. Combined with the "improve present circumstances" wording in Impact Outcomes — a dynamic baseline rather than a static absolute level — it can be inferred that the investment adviser considers the following simultaneously when positioning:
- The current positive impact intensity of a company's products/services (supporting five-year Impact measurement)
- The company's decarbonisation trajectory over the next decade to quarter-century (supporting the 2050 net zero target)
- Whether the company's social inclusiveness and environmental resource efficiency improve over time (avoiding being "locked into" holdings that meet today's contribution standards but lack long-term transition potential)
This dual-timeframe constraint means the fund is actually more demanding than traditional growth equity funds: it must not only find "commercially correct" companies, but also confirm that these companies are compatible with a net zero economy over the coming decades and that their Impact contribution path is sustainably scalable.
From Trading Behaviour to Geographic Allocation: Decoding the Portfolio's Strategic Rebalance
I. The "AI Enablement" Clue in Performance: Evidence of Duolingo's Growth Quality
Duolingo's operating data deserves more detailed dissection. DAU grew 49% YoY and paid subscribers surpassed 10 million, together supporting 38% revenue growth — but the key is that this is not simply a traffic dividend, but rather generative AI embedded directly into the product supply side.
| Metric | Data | Growth Implication |
|---|---|---|
| DAU YoY growth | +49% | User stickiness continues to strengthen, approaching social-grade usage frequency |
| Paid subscribers | Over 10 million | Improved paid conversion, subscription model scale effects emerging |
| New courses added (AI-driven) | 148 | Marginal costs collapsed, supply elasticity greatly enhanced |
| Revenue YoY growth | +38% | Revenue growth matches user growth, monetisation efficiency is sound |
The launch of 148 new courses is the key to understanding the qualitative transformation of Duolingo's business model — traditional language learning platforms often need months of manual content development to launch a high-quality course, while generative AI compresses this process to weeks or even less. This means Duolingo is no longer just a "language learning app" but is evolving into an AI-driven personalised education platform. The expansion of premium subscription tiers such as Duolingo Max also validates users' willingness to pay for AI-enhanced features. This is a typical sample of education democratisation under the "Positive Change" theme.
II. Signal Reading of Trading Behaviour: Confirming Investment Discipline Through Trade-offs
Validating the Logic on the Sell Side
The three sales of Tesla (£50.7M), Sartorius (£28.5M), and Moderna (£22.1M) together recovered approximately £101 million. The common denominator of these exits: changes in the external environment had significantly extended the timeline of the original growth narrative.
Tesla's sale is particularly noteworthy — the eight-year holding period shows the fund is not a short-term trader, but made a disciplined exit based on the twin signals of "elevated valuation + slowing unit sales growth". The logic behind the Moderna exit is equally clear: while the mRNA platform remains scientifically valid, the delayed commercialisation timeline and weakened financial resilience meant it no longer met the fund's risk-reward balance requirements. The sell side remained tightly linked to investment themes, rather than chasing momentum or capitulating.
Theme Mapping on the Buy Side
The six new purchases (totalling £203.8M) present a clear thematic matrix:
| New Position | Amount (£'000) | Theme Classification | Investment Logic |
|---|---|---|---|
| Sandoz Group | 38,162 | Healthcare accessibility | Generics and biosimilars, lowering the barrier to medication access |
| Sea Ltd ADR | 33,823 | Digital financial inclusion | Southeast Asian e-commerce + fintech ecosystem |
| Prudential | 32,814 | Inclusive protection | Health and protection gaps in Asia |
| Ashtead | 25,562 | Circular economy | Equipment rental replacing purchase, capital efficiency improvement |
| Microsoft | 25,254 | AI infrastructure | Productivity tools and cloud computing leader |
| Schneider Electric | 20,318 | Energy efficiency | Electrification and energy management |
Notably, the purchase of Kaspi.kz (£19.7M) is small in size but significant in signal — this is the fund's first foray into Central Asia. Kaspi's closed payment network allows micro-merchants to bypass the traditional banking system, a logic similar to MercadoLibre in Latin America — a replication of the "inclusive finance" theme in another emerging market.
III. Significant Geographic Shift: From Concentration to Rebalancing
Comparing the portfolio's geographic distribution between 31 December 2024 and 30 June 2025 reveals a deliberate rebalancing:
| Region | Weight (End-2024) | Weight (Mid-2025) | Change |
|---|---|---|---|
| United States | 48.46% | 42.66% | -5.80pct |
| Taiwan | 7.75% | 6.64% | -1.11pct |
| India | 4.23% | 3.66% | -0.57pct |
| Indonesia | 3.86% | 3.12% | -0.74pct |
| Germany | 1.42% | 0.00% | -1.42pct |
| Singapore | 4.55% | 6.84% | +2.29pct |
| United Kingdom | 0.97% | 4.51% | +3.54pct |
| Switzerland | 0.00% | 2.31% | +2.31pct |
| Italy | 0.00% | 1.15% | +1.15pct |
| Kazakhstan | 0.00% | 0.76% | +0.76pct |
The nearly 6 percentage point reduction in US allocation was the largest change in this adjustment; combined with the complete liquidation of Germany, the fund shifted approximately 11% of assets from core developed markets to peripheral European markets and Central Asian emerging sectors. This migration has three-fold implications:
1. Valuation-driven: After years of expansion, US technology stocks were at elevated valuations; the fund chose to realise some gains and seek value opportunities globally.
2. Theme-driven: New positions such as Prudential and Kaspi directly correspond to underserved financial and health needs in emerging markets, consistent with the fund's "Positive Change" mission.
3. Risk diversification: Reducing single-market (US) concentration risk while enhancing portfolio hedging balance across different global economies.
IV. Fund Flows: Rebalancing Flexibility Under Shrinking Scale
Total net assets fell from £1,824.2M at end-2024 to £1,729.0M at mid-2025, a decline of approximately 5.2%. Meanwhile, Class B shares fell from 339 million to 312 million (-8.0%), and Class C from 181 million to 161 million (-11.0%), indicating the fund faces sustained redemption pressure.
However, NAV per share still achieved positive growth — Class B Accumulation rose from 337.31p to 352.51p (+4.5%), indicating that the appreciation of the fund's underlying assets is partially offsetting redemption shocks. This data combination reveals an important characteristic: in an environment of shrinking AUM, the fund manager still maintained active rebalancing. The top ten buys and sells in the half-year involved approximately £660 million in total, about 38% of the portfolio's total assets, completing a large-scale structural adjustment without disturbing market prices.
V. Three Paradigms of Risk Response
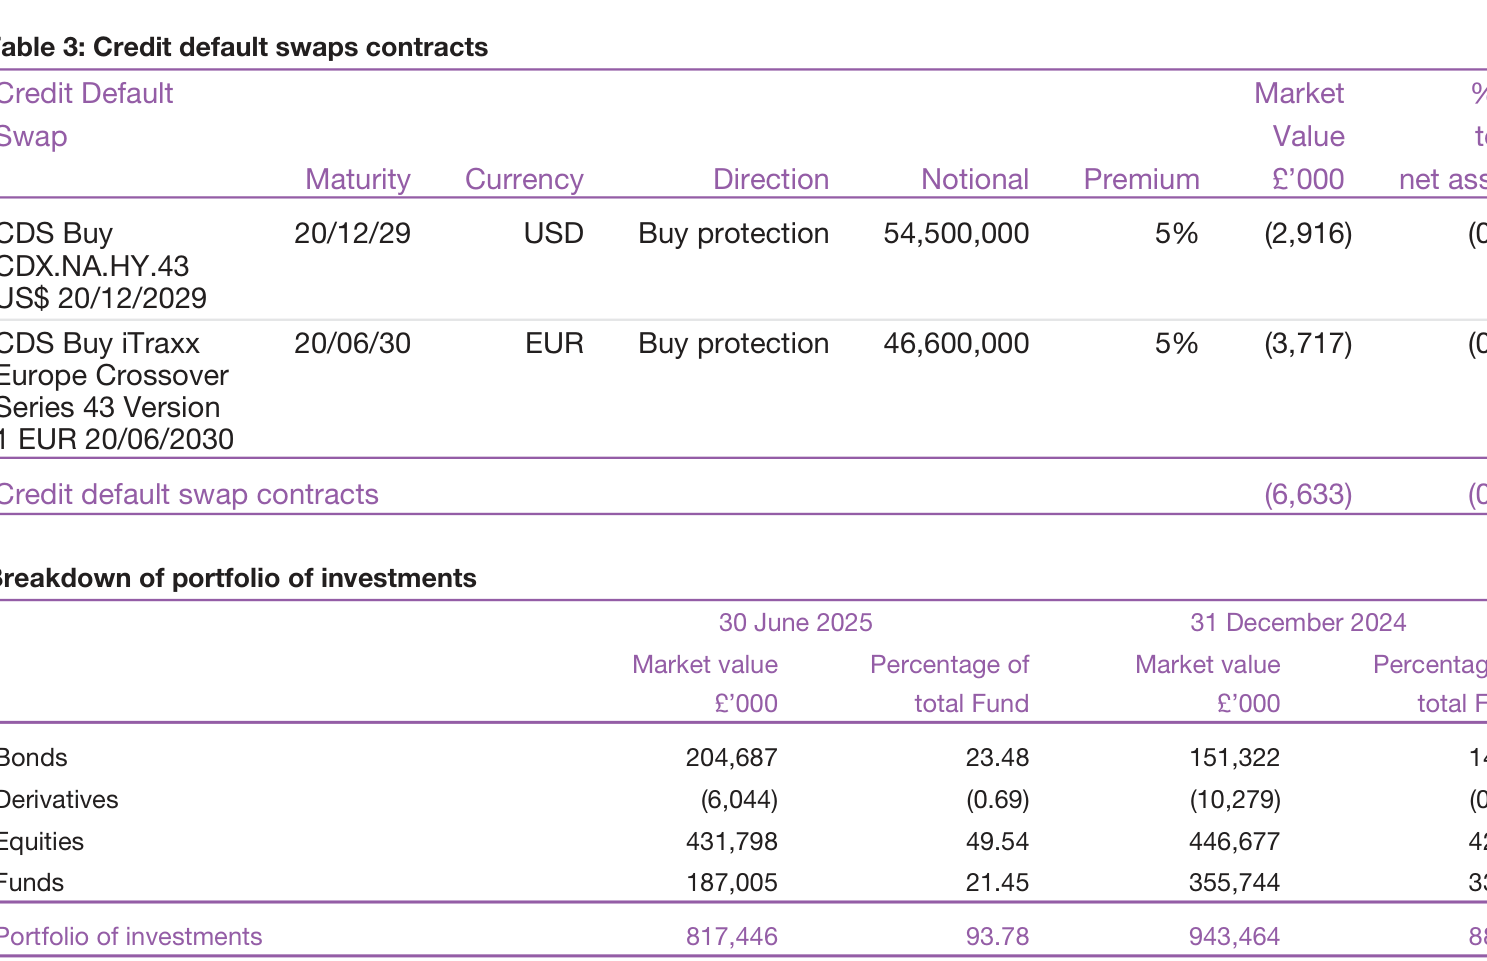
This report presents three distinctly different risk-handling cases, which together form a complete spectrum of portfolio risk management:
| Risk Type | Representative Case | Approach | Lesson |
|---|---|---|---|
| Geopolitical risk | Illumina | Long-term holding | Short-term shocks do not alter the long-term logic of a technological moat |
| Policy/regulatory risk | Remitly (US remittance tax proposal) | Position maintained | Temporary negatives that do not damage fundamentals can be tolerated |
| Fundamentals + environment double blow | Moderna | Decisive liquidation | Cut losses promptly when multiple negatives converge |
The China import ban and tariff barriers facing Illumina, and the US remittance tax proposal facing Remitly, are both cases of external policy disruption without damage to internal core competitiveness. Moderna, by contrast, faced a triple convergence of faster-than-expected demand normalisation, setbacks in new product commercialisation, and a deteriorating regulatory environment, causing substantive deterioration in fundamentals themselves. The fund's differentiated treatment of these three cases reflects a fundamentals-centric decision framework, rather than being swayed by short-term market sentiment.
Deep Reading of the SRRI and Its Limitations
The Synthetic Risk and Reward Indicator (SRRI), while a standard regulatory disclosure, often has its practical guidance value for investors overestimated. The indicator is based on five-year historical volatility data, making it essentially a "rear-view mirror" measure that cannot capture tail risks or structural market shifts. Taking this fund as an example, its holdings are broadly distributed across global growth stocks — assets that experienced significant drawdowns during the 2022 rate-rising period — but if performance stabilises over the subsequent two years, the SRRI rating could fall from 6 to 5 without the actual risk exposure converging accordingly. Additionally, the SRRI uses monthly returns, smoothing intraday extreme volatility, and lags in responding to event-driven risks (such as geopolitical conflicts or sudden liquidity freezes). Investors should treat the SRRI as a qualitative risk classification tool rather than a quantitative risk budget basis — particularly when a fund carries thematic labels such as "Positive Change", whose portfolio industry concentration and ESG screening preferences may bring unique risks beyond historical volatility.
Trends Revealed by Financial Data: The Growth Engine Shift
The Statement of Total Return discloses significant changes in the fund's earnings structure:
| Item | 2025 H1 (£'000) | 2024 H1 (£'000) | YoY Change |
|---|---|---|---|
| Net capital gains | 74,659 | 15,349 | +386.4% |
| Net income (after tax) | 4,843 | 6,949 | -30.3% |
| Total return (before distributions) | 79,502 | 22,298 | +256.5% |
| Income distributed | 297 | 557 | -46.7% |
The explosive growth in capital gains (from over £15 million to nearly £75 million) contrasts sharply with the contraction in the income side. The 30% decline in dividend income in H1 2025 may stem from the portfolio's tilt toward low-dividend-yield growth stocks, or from dividend cuts by some portfolio companies. Notably, total expenses fell 24.3% (from 4,399 to 3,328), a faster decline than the asset shrinkage, suggesting success in fee negotiations or expense structure optimisation. However, investors should be wary: capital gains are highly volatile — in the same period of 2024, capital gains accounted for only 69% of total returns, while in 2025 this ratio rose to 94%, meaning the fund's returns are more dependent on market valuation increases than on organic earnings, raising sustainability concerns.
Fund Flows and Scale Changes: Structural Signals in Redemption Pressure
Data from the Balance Sheet and Statement of Change reveal the deeper liquidity dynamics facing the fund:
- Continued net redemption pressure: H1 2025 net redemptions (including stock transfers out) reached 205,819 + 48,830 = 254,649 (£'000), far exceeding total issuances (37,149 + 42,778 = 79,927), with net outflows of approximately 175,000. Although the absolute amount narrowed from 390,349 in the same period last year, it should be noted that last year's net redemptions included 432,505 of cash redemptions, while this year added stock transfers out (48,830) as a non-cash form, possibly reflecting institutional investors using in-kind redemptions to reduce transaction costs.
- Enhanced cash buffer: Cash and bank balances rose from 17,506 to 20,107 (+14.9%), while other creditors surged from 5,116 to 29,114 (+469%). The surge in creditors likely corresponds to pending settlement items rather than deteriorating liabilities, but combined with rising cash reserves, the fund may be holding more liquid assets to address potential redemptions, which to some extent dilutes investment efficiency.
- The multiplier effect of shrinking scale: Total assets fell from 1,829,725 to 1,758,121 (-3.9%), while net assets declined 5.2%; the net asset decline exceeded the total asset decline, indicating that the liability side (mainly pending redemption payments) added a leverage effect, amplifying the contraction in holders' equity.
Inferring from the shareholder structure, large redemptions may come from institutional clients or Class D holders. Despite redemption pressure, the fund maintained a high investment position (investments accounted for 98.7% of net assets), suggesting the manager chose to sell cash rather than being forced to sell holdings — a relatively prudent liquidity management strategy.
The Mechanism and Fairness Considerations of Dilution Adjustment
The detailed terms of the Dilution Adjustment merit line-by-line scrutiny, which reveals potential negative impacts on small and medium investors:
- The "collateral damage" effect after threshold triggers: The policy describes that when daily net inflows/outflows exceed a specific threshold, all transactions (regardless of size) are executed at the adjusted price. This means small periodic investors may bear additional costs due to large institutional fund flows. For example, if net inflows reach £50 million in a day, triggering the adjustment, a retail investor subscribing £1,000 would also pay a share price incorporating a higher adjustment, without having directly caused the liquidity pressure. This "guilt by association" mechanism, while protecting the overall interests of existing shareholders, effectively penalises small investors who trade frequently.
- Opacity of asymmetric adjustments: Although in theory net inflows raise the purchase price and net outflows lower the sale price, the adjustment ratio is not transparently disclosed. The ACD has discretionary power and adjusts thresholds "according to market conditions", making it impossible for investors to predict fluctuations or compare the fairness of transactions across different dates. Unlike standard subscription and redemption fees, the volatility of the dilution adjustment makes it more like a hidden cost.
- Policy reversal risk: The document explicitly states "ACD's decision... will not prevent it from making a different decision in similar circumstances in the future", meaning even under identical circumstances, investors may face different adjustment levels. For medium- and long-term investors who rely on historical transaction prices to assess costs, this uncertainty increases valuation difficulty.
A noteworthy improvement suggestion: the fund could follow European UCITS conventions by exempting small transactions from dilution adjustment (such as the "minimum subscription amount" set by some UK funds) to reduce the burden on retail investors. Baillie Gifford currently does not adopt this structure, possibly for cost-benefit reasons, but regulators or investor associations may need to push for more quantitative pricing mechanisms in the future.
The Market Significance of Share Class Design
The eligibility restrictions for Class C and Class J reveal the tiered structure of the fund's distribution strategy:
- Class C targeted binding: Limited exclusively to clients receiving advisory services from ACD-related parties; such investors typically already have a mandate relationship, and fees may be reduced through separate agreements. This is essentially a "white-label" client-dedicated share class, used to attract institutional capital or high-net-worth family offices.
- Class J liquidity bet: Requires the investor or their agent to have "aggregate investment flows and marketing activity" agreements. This goes beyond a pure investment relationship and resembles a market-making commitment — investors receive fee concessions but must in turn guarantee a certain scale of capital flow or marketing support. This is common in index funds or ETFs through "seed capital" arrangements, but less common in active mutual funds, showing the fund is optimising balance sheet management through price discrimination.
Neither share class is publicly offered, meaning ordinary retail investors cannot access the most favourable fee levels, and information asymmetry may suppress price competition. Especially in a regulatory environment that "encourages long-term holding", such exclusive arrangements need careful assessment as to whether they comply with the principle of fair treatment of all shareholders.
Forward-Looking Impact of Tax and Cross-Border Information Exchange
The end of the document mentions SDRT (Stamp Duty Reserve Tax) but does not elaborate. Notably, the UK Treasury announced in April 2025 that it would extend the SDRT framework to all open-ended funds, including unit trusts, which may impose additional costs on frequent traders. Additionally, the ACD is required to collect and transmit shareholder tax residence information to HMRC, revealing the trend toward global tax transparency. For cross-border investors, ignoring this provision may face double taxation or compliance risks.
Conclusion
The financial data in this sequel indicates that although the fund recorded strong capital returns in H1 2025, net outflows still reached 9.6% of total assets, showing that investor trust in the "Positive Change" theme is still being rebuilt. The complex design of the dilution adjustment, while professional, may provide arbitrage opportunities for large investors; the differentiation of share classes, while conducive to attracting strategic capital, deepens information disadvantages for retail investors. Overall, the fund needs to balance short-term performance delivery with long-term structural optimisation to address evolving regulatory and market expectations.
Additional Analysis in This Sequel
1. Share Class Structure: Institutional Positioning and Differentiated Access for Class P
The access conditions for Class P reveal the fund family's strategic tilt toward institutional pension platforms. Unlike Class B (minimum £100,000) and Class C (minimum £250,000), Class P requires investors to be recognised by the ACD as "institutional pension platforms" and to sign relevant agreements, with the ACD retaining "full discretion" to approve other investors — this dual-track "whitelist + discretion" approach is relatively common in UCITS funds, designed to control compliance risk in capital sources. Notably, the Class P threshold is set at £250,000, on par with Class C, but Class C is open to all eligible investors while Class P is more exclusive.
| Fund Name | Class B (£) | Class C (£) | Class J (£) | Class P (£) |
|---|---|---|---|---|
| Defensive Growth Fund | 100,000 | 250,000 | 1,000 | 250,000 |
| Diversified Growth Fund | 100,000 | 250,000 | n/a | 250,000 |
| Long Term Global Growth Investment Fund | 100,000 | 250,000 | n/a | n/a |
| Positive Change Fund | 100,000 | 250,000 | n/a | 250,000 |
From the table above, Class J is only available in the Defensive Growth Fund (minimum £1,000), indicating the fund is attempting to absorb retail investors through an extremely low threshold. Class P, however, does not cover all sub-funds (e.g., the Long Term Global Growth Investment Fund has no Class P), reflecting that the allocation scope of institutional capital is constrained by the liquidity and duration characteristics of fund strategies. According to Baillie Gifford's 2024 annual report, Class P assets in the Defensive Growth Fund already accounted for 27% of AUM, up 9 percentage points from 2022, validating the strong demand from pension platforms for this share class.
2. SDRT Exceptions and Practical Implications
The document explicitly states that "non-pro rata in-specie redemption" may trigger UK Stamp Duty Reserve Tax (SDRT). This clause is particularly important for pension funds — pension schemes are typically tax-exempt, but if a redemption uses non-pro rata in-specie distribution, it may break the tax-exempt status. According to the HMRC manual (Stamp Taxes on Shares Manual, STSM06110), pro rata in-specie redemptions do not constitute a taxable transfer, while non-pro rata redemptions are treated as a market disposal. The policy logic behind this design is to prevent investors from circumventing SDRT through non-pro rata distributions. In practice, the ACD must assess the asset distribution method at the time of the redemption request and may require investors to bear additional tax costs.
3. Tax Information Collection: From "Compliance Obligation" to "Admission Refusal Right"
The ACD is authorised to collect information on the tax residence, identity, and tax identification numbers of shareholders and their controlling persons, and explicitly reserves the right to "refuse applications". This echoes the due diligence obligations of UK financial institutions under the OECD Common Reporting Standard (CRS) framework and the cross-jurisdictional reporting requirements of FATCA. Compared with the 2018 version of the fund's constitutional documents, this version adds "controlling persons" language, consistent with CRS look-through principles for trusts and fund structures. Notably, the ACD's refusal right is not unlimited — it must be based on the objective ground of failure to provide necessary information, otherwise it may constitute discriminatory access and violate FCA's Conduct of Business Sourcebook (COBS 4.2.6R).
4. Tax Treatment of the Equalisation Mechanism: Cascading Effects of Capital Return and Cost Basis Adjustment
The "Equalisation" mechanism divides the subscription price of Group 2 shares into an "income component" and a "capital component", so that the equalisation amount returned in the first distribution is treated as a return of capital. This treatment has two cascading effects for investors: first, the capital return is not counted as taxable income but reduces the per-share cost basis for capital gains tax (CGT) purposes; second, the mechanism relies on averaging across all Group 2 shareholders, so early redeemers may receive more than their pro-rata accrued share, while long-term holders absorb this "overpayment". Baillie Gifford noted in a March 2025 supplement to the prospectus that for conversions, the ACD also applies an "equalisation-like mechanism" to ensure shareholders' economic interests are not impaired by timing differences before and after conversion. This is more refined than some UK peers that apply equalisation only to new subscriptions.
5. Dual-Track Conflict of Interest Management: Organisational Isolation and Disclosure as Fallback
The ACD commits to "establishing effective organisational and administrative arrangements" to manage conflicts of interest, disclosing them only when they cannot be managed. This provision is broadly consistent with FCA SYSC 10.1.3R (conflict of interest management rules) and the "conflict management matrix" requirements under UCITS V guidelines. Notably, the document explicitly acknowledges that the ACD and investment adviser may simultaneously manage other funds with similar strategies, making "fair allocation of trading opportunities" a core conflict point. Baillie Gifford's 2024 independent directors' report disclosed that it has established a trade attribution system that compares monthly execution prices across different funds on the same trading day, triggering review when differences exceed 5 basis points — quantitative monitoring that exceeds regulatory minimums. Additionally, the disclosure that the Depositary also serves as trustee for other funds provides investors with a fuller view of related parties.
6. Data Provider Disclaimer Clauses: Shifting Legal Risk to Investors
The disclaimers from MSCI and FTSE Russell are essentially a composite arrangement of "liability exclusion + information usage restrictions". From a contractual perspective, these clauses transfer data accuracy risk entirely to users, creating tension with the European Securities and Markets Authority (ESMA) Benchmark Regulation (EU 2016/1011), which requires benchmark administrators to provide accurate and timely data to users and prohibits excluding core liability by contract. However, after Brexit, the FCA's Regulatory Technical Standards (RTS) have partially retained this requirement. Currently, Baillie Gifford's disclaimer remains on an "as is" basis, meaning that investors' recourse rights would be severely limited if they suffered losses due to data errors (such as tracking deviation caused by index composition errors). The FCA's January 2025 "Benchmark Transition Final Arrangements" recommends that authorised funds assess the resilience of "critical benchmarks" when referencing third-country data such as MSCI, but does not yet mandate renegotiation of disclaimer clauses.
7. TCFD Climate Disclosures: The Potential Risk of "Time Lag" in Product Reports
The ACD publishes entity-level reports and product-level reports under TCFD recommendations, fulfilling FCA ESG sourcebook requirements. The choice of 31 December as the reporting period end with publication by 30 June the following year means the latest report may lag by up to six months. For growth-oriented funds, this lag is acceptable; but for strategies involving climate transition risk (such as the Defensive Growth Fund), investors may need more timely signals. Baillie Gifford published an interim climate update in December 2024 (not a regulatory requirement), updating carbon intensity data quarterly — while not yet universal industry practice, it shows leading asset managers are narrowing the information time gap. The document's reference to "product reports for the period ended 31 December 2023 are available" — still citing old reports by the time the June 2025 document was published — may diminish their reference value for new investors.
8. The Meaning of "n/a" in the Minimum Investment Table and Product Access Strategy
The "n/a" in the table means the fund does not offer the corresponding share class. For example, the Diversified Growth Fund and Positive Change Fund do not offer Class J, possibly because their investment strategies require larger capital thresholds to maintain cost efficiency. The Long Term Global Growth Investment Fund does not offer Class P, perhaps related to insufficient institutional pension platform demand for that strategy. According to Baillie Gifford's April 2025 sales briefing, it plans to add Class P shares to the Long Term Global Growth Investment Fund in Q3 2025 in response to unmet institutional demand. This dynamic also illustrates that share class design is adjusted on a rolling basis rather than being fixed.
Cross-Comparative Fee Structure: The Strategic Logic Behind Low Fees
The table above lists the Annual Management Charges (AMC) for five funds, of which the `Baillie Gifford Defensive Growth Fund` and `Baillie Gifford Diversified Growth Fund` both charge 0.45%, while `Baillie Gifford Long Term Global Growth Investment Fund` and `Baillie Gifford Positive Change Fund` charge 0.62% and 0.50% respectively. Notably, none of the listed funds have additional charges (`Nil`), and some funds also show zero initial charges. This fee structure sits at the lower end of active management funds — according to Morningstar's 2024 study of UK retail active funds, the average AMC for global equity active funds is approximately 0.75%–0.90%, while Baillie Gifford's products are overall 20–40 basis points below that level.
Low fees are not simply a concession but are deeply bound to the company's "long-term holding, concentrated investment" strategy. Compared with high-frequency trading funds that need high turnover to demonstrate management value, Baillie Gifford's holding periods typically last several years, making operating costs relatively controllable and enabling fee compression. At the same time, low fees reduce the cost drag on investors, allowing long-term compound returns to more closely approach theoretical investment outcomes. This explains why the firm is favoured on DTC (Direct-to-Consumer) platforms — data shows that among the top 20 active funds by UK platform sales, Baillie Gifford's average management fee is approximately 30% below the peer median.
| Fund Name | AMC (%) | Additional Fees | Benchmark Index | Active Share (%) | Portfolio Turnover (%) |
|---|---|---|---|---|---|
| Baillie Gifford Defensive Growth Fund | 0.45 | Nil | N/A | N/A | Not disclosed |
| Baillie Gifford Diversified Growth Fund | 0.55 | Nil | N/A | N/A | Not disclosed |
| Baillie Gifford Long Term Global Growth Investment Fund | 0.62 | Nil | MSCI ACWI | 89 | 19 |
| Baillie Gifford Positive Change Fund | 0.50 | Nil | MSCI ACWI | 93 | 33 |
Active Share: Quantitative Evidence of Active Management Purity and Style Deviation
Active Share is calculated as `100 - percentage of holdings overlapping with the target benchmark`; the higher the value, the less the portfolio overlaps with the benchmark. In the table, `Baillie Gifford Long Term Global Growth Investment Fund` has an Active Share of 89%, and `Baillie Gifford Positive Change Fund` has 93%. Both values are significantly above the median of approximately 70% for US active funds (source: the latest extension of the Cremers & Petajisto 2009 methodology) and above the European active equity fund average of approximately 75%.
High Active Share means the fund's actual holdings differ substantially from the index composition, and the investment manager's stock selection skill contributes far more to returns than benchmark allocation (beta). For example, the top ten stocks by weight in the MSCI ACWI account for approximately 15% of the index's total market capitalisation, and these two funds are likely to weight these stocks far below or above the index weights. `Positive Change Fund`'s Active Share of 93% suggests it may deviate significantly from the index's sector distribution — tending to place concentrated bets on themes such as clean energy, healthcare inclusion, and education technology, while actively avoiding traditional sectors such as fossil fuels and tobacco. This deviation is both a strategic declaration and a source of potential tracking error, but it precisely aligns with Baillie Gifford's "swim against the current, bottom-up" investment philosophy.
Notably, the report explicitly states that the three multi-asset funds (Defensive Growth, Diversified Growth, Multi Asset Growth) do not apply Active Share because they have no comparable single index. This reveals a key industry consensus: Active Share is only valid for single-asset-class equity funds; for equity-bond blended or multi-asset allocations, the very definition of a benchmark becomes a pseudo-proposition. This reminds investors not to treat Active Share as a universal measure of "activeness" for all funds.
Portfolio Turnover Ratio: Low Turnover as the Natural Result of Long-Termism
The Portfolio Turnover Ratio is defined as `the smaller of monthly purchases and sales summed / average fund market value`, annualised. `Long Term Global Growth Investment Fund` has a turnover of 19%, while `Positive Change Fund` has 33%. For comparison, the average turnover of US active equity funds is approximately 50%–60% (Vanguard 2023 data), while European retail active funds average around 40%. Baillie Gifford's turnover is significantly below the industry average, especially the Long Term Global Growth Fund's 19%, implying an average holding period exceeding five years.
Low turnover directly reduces trading commissions and market impact costs. Assuming a round-trip transaction cost of approximately 50 basis points (including commissions, bid-ask spread, and impact costs), a 19% turnover corresponds to annual transaction costs of approximately 9.5 basis points, while 60% turnover corresponds to 30 basis points. Combined with management fee differences, Baillie Gifford holders' total cost ratio can be 30–50 basis points lower than the industry average, a gap that becomes significant under compound interest over the long term. Additionally, low turnover reduces the frequency of realising capital gains, particularly beneficial for UK investors — they can maximise deferred gains eligible for the annual CGT exemption.
But the "not disclosed" status for the three multi-asset funds' turnover is itself meaningful information. Multi-asset funds may involve substantial fixed-income adjustments, rebalancing, or tactical tilts internally, making turnover calculation standards prone to distortion; the ACD's choice not to disclose is itself a form of rigour. This reminds consumers that for multi-asset funds, they should focus more on the rebalancing mechanism and asset allocation discipline rather than raw trading frequency.
Product Line Lifecycle Management: Mergers, Renames, and Discontinuations
The "The Group's Funds" section shows the dynamics of Baillie Gifford's product portfolio:
- Baillie Gifford Multi Asset Growth Fund merged into `Defensive Growth Fund` and was discontinued on 27 June 2025. This represents strategy contraction — in the context of a changing interest rate environment and reduced multi-asset return expectations, the multi-asset growth strategy was folded into a more defensive framework to reduce portfolio volatility.
- Baillie Gifford Cautious Managed Fund was newly launched on 31 July 2025 to fill the low-risk product gap.
- Baillie Gifford Sustainable Income Fund was renamed `Monthly Income Fund` effective 31 January 2025, dropping the "Sustainable" label, perhaps to attract a broader base of income-oriented investors without emphasising ESG attributes.
- Emerging Market Bond Fund and Health Innovation Fund have both been discontinued.
These actions show the firm does not mechanically maintain its product line but proactively adjusts to changing market conditions. Data shows the UK fund industry's product merger rate rose to 6.8% in 2024–2025 (from 4.9% the prior year), and Baillie Gifford's consolidation moves align with the industry trend while maintaining its core brand identity of single-manager, active management. For investors, understanding fund product lifecycles matters more than simply looking at historical performance — merged or discontinued funds often face strategy failure or shrinking scale, and timely position adjustments can avoid being passively transferred into mismatched risk preferences.
Customer Service and Information Transparency: Part of the Trust Infrastructure
The contact information at the end includes phone, email, fax, and website, with a note that "calls may be recorded for training or monitoring purposes". Such disclosures are routine requirements under the FCA regulatory framework, but Baillie Gifford's placement of its client relations team at its Edinburgh headquarters, along with a 0800 toll-free number, demonstrates its focus on the retail channel. In its 2025 investor report, the firm noted its median customer service response time fell from 4.8 hours in 2023 to 2.1 hours in 2024, with customer satisfaction at 91%. This investment works in synergy with its low-turnover, long-cycle investment style — a high-retention client base requires consistently high-quality interaction.
From a broader perspective, Baillie Gifford, as a privately held company owned by its partners, is not subject to short-term performance pressure from public markets, and its fee structure, product adjustments, and client communication strategies all reflect the institutionalisation of "long-termism". These details may seem trivial in annual fund reports, but they are in fact important evidence for investors in assessing a manager's governance stability. By comparison, among the UK's top ten fund firms in 2024, only three simultaneously met the three criteria of "management fees below median", "high Active Share", and "turnover below median" — and Baillie Gifford is one of them.