Baillie Gifford Investment Funds ICVC Annual Report - December 2025
In plain words
This annual report is about a major product shake-up at Baillie Gifford. It is shutting down or merging several funds and launching one new fund. There is no strong market forecast, just portfolio restructuring. Key products: Diversified Growth Fund and Defensive Growth Fund are set to be merged into Monthly Income Fund (i.e., closed); the new Cautious Managed Fund is a conservative fund launched in 2025. Also, the Long Term Global Growth Investment Fund dropped its target-return promise.
At a Glance
The 2025 annual report of the Baillie Gime Fund (Long Term Global Growth Investment Fund) shows that the company has entered a period of contraction in its active product line, terminating two sub-funds, merging two sub-funds, and launching one new sub-fund. Meanwhile, the target fund and the Positive Change Fund have removed Target Returns and will no longer target preset rates of return [Neutral].
- Two sub-funds (Diversified Growth Fund and Defensive Growth Fund) have prepared their 2025 annual reports on a discontinued operations basis and will be terminated or merged after the reporting period, reflecting a proactive strategic adjustment rather than financial distress.
- The Multi Asset Growth Fund was merged into the Defensive Growth Fund on June 27, 2025, with the latter terminated on December 31, 2025; both the Diversified Growth Fund and the Defensive Growth Fund are planned to be merged into the Monthly Income Fund.
- The target fund, the Long Term Global Growth Investment Fund, and the Positive Change Fund will remove Target Returns effective February 2, 2026; the funds will no longer target preset rates of return, making this the most direct change to fund terms.
- The new Cautious Managed Fund was launched on July 31, 2025, covering only the period from July 31 to December 31 during the reporting period, and was newly established within the year.
- Defensive Growth Fund strategy revision: effective March 24, 2025, the hard carbon budget constraint was removed, shifting the focus to low-carbon transition assets; the Class B annual management fee was reduced from 0.50% to 0.45%, and new Class J/P shares were added.
Interpreting the Introduction Section
This section serves as the corporate-level introduction to the entire ICVC. It is largely procedural disclosure, but it contains several changes with substantive implications for sub-fund structures and investment strategy. The key points are excerpted below:
- Company overview: Baillie Gifford Investment Funds ICVC is a UK OEIC, registration number IC000719, authorised and regulated by the FCA. As of December 31, 2025, it offered five sub-funds, valued daily at a single price, all of which are non-UCITS retail schemes and AIFs.
- New fund: Baillie Gifford Cautious Managed Fund was approved by the FCA on May 13, 2025 and launched on July 31.
- Proposed mergers: The ACD plans to merge Diversified Growth Fund and Defensive Growth Fund into Monthly Income Fund respectively, each subject to the approval of the respective shareholders, after which the corresponding sub-funds will be terminated.
- Completed merger: Multi Asset Growth Fund was merged into Defensive Growth Fund on June 27, 2025; the latter was terminated on December 31, 2025.
- Strategy revision (Defensive Growth Fund): Effective March 24, 2025, the restrictive non-financial objective of a "carbon footprint below an established carbon budget" was removed, replaced by a focus on investing in assets likely to play a role in the global low-carbon transition. The investment policy was adjusted accordingly, but proprietary sustainability assessments and the exclusion of assets deemed unsustainable remain in place.
- Target fund matters: Long Term Global Growth Investment Fund and Positive Change Fund had Target Returns removed from their investment objectives effective February 2, 2026. This is the most direct change to the target funds' terms in this report, meaning the funds no longer target a predetermined rate of return.
- Fees and share classes: The Class B annual management charge of the Defensive Growth Fund was reduced from 0.50% to 0.45% effective April 1, 2025; Class J and Class P shares were added to the fund on April 1, 2025; Diversified Growth Fund and Positive Change Fund added Class P shares on May 15, 2025.
The remaining content (ACD/Depositary duties, audit report, regulatory compliance, valuation processes, etc.) is procedural boilerplate with no relevance to investment analysis, so it is omitted.
Dual-Layer Oversight in the Governance Structure: The Division of Responsibilities Between the ACD and the Depositary
The continuation material further reveals the separation logic between "management" and "oversight" in UK fund governance. Authorised Corporate Director (ACD), as the management entity, has a responsibility list that emphasises consistency in accounting policies, reasonable and prudent estimates, and a proactive duty to prevent fraud. Notably, the ACD is required to "take reasonable steps for the prevention and detection of fraud and irregularities" — unlike the traditional auditor's responsibility, this explicitly places the primary anti-fraud responsibility on management, reflecting the regulator's relatively high expectations of trustee proactivity.
The Depositary (in this case, NatWest Trustee and Depositary Services Limited), by contrast, assumes independent custody of assets and compliance oversight responsibilities. Its report details six "must ensure" items, covering nearly all critical aspects of fund operations, from cash flow monitoring and share price calculation to the execution of settlement instructions. This dual-layer structure allows the ACD's day-to-day management and the Depositary's independent checks and balances to complement each other, reducing the moral hazard that a single management entity might create.
The "Non-Going Concern" Emphasis of Matter in the Audit Report: Transparent Disclosure of Fund Lifecycles
The most information-rich section of the independent auditor's report is the Emphasis of Matter section: the financial statements of Baillie Gifford Diversified Growth Fund and Baillie Gifford Defensive Growth Fund have been prepared on a "non-going concern" basis. This means these two sub-funds will enter liquidation or merger proceedings after the reporting period. The auditor's opinion on the financial statements as a whole was "not modified" as a result, but for users of the relevant statements, this is a critical early warning signal.
From a data perspective, the company had five sub-funds, two of which were terminated while the rest continued in operation. This mixed state requires the audit report to define accounting bases separately, rather than uniformly applying the going concern assumption. The table below summarises the different statuses and period definitions of the sub-funds during the reporting period:
| Sub-fund category | Example sub-fund | Applicable accounting basis | Reporting period |
|---|---|---|---|
| Terminated sub-fund | Baillie Gifford Diversified Growth Fund | Non-going concern basis | January 1, 2025 – December 31, 2025 |
| Terminated sub-fund | Baillie Gifford Defensive Growth Fund | Non-going concern basis | January 1, 2025 – December 31, 2025 |
| Continuing sub-fund | Baillie Gifford Cautious Managed Fund | Going concern basis | July 31, 2025 – December 31, 2025 |
| Continuing sub-fund | Other continuing sub-funds | Going concern basis | January 1, 2025 – December 31, 2025 |
Cautious Managed Fund's unusual period (July 31 to December 31) suggests it is a sub-fund newly established during the year, which is also why the audit report provides detailed notes on "respective periods" to avoid data misinterpretation arising from period differences.
The Auditor's Dual Expression of the Going Concern Conclusion: Clear Principle, but Cautious Reservation
The auditor did not identify significant uncertainty regarding the ability of "the company as a whole and the continuing sub-funds" to continue as going concerns for twelve months, and explicitly confirmed that the ACD's adoption of the going concern basis is appropriate. However, the report immediately adds that "because not all future events or conditions can be predicted, this conclusion is not a guarantee" — a typical manifestation of the audit profession's prudence.
It is worth examining the tension between this statement and the existence of terminated sub-funds: given that two sub-funds have already been terminated, the auditor's conclusion of "no significant uncertainty" for the company as a whole and the other sub-funds implies that the terminations were proactive strategic decisions, not the result of financial distress. This indirectly suggests the company may be adjusting its product line or rationalising scale, rather than being passively wound down.
Comparing the Roles of Audit and the Depositary: The Complementarity of Assurance and Ongoing Oversight
Placing the independent auditor's responsibilities alongside the Depositary's responsibilities makes it easier to see how different oversight mechanisms cooperate. The table below compares them across five dimensions:
| Dimension | Depositary | Auditor |
|---|---|---|
| Nature of oversight | Ongoing, in-process | Periodic, ex-post (annual audit) |
| Primary basis | Collective Investment Schemes sourcebook, company law requirements | ISAs (UK), applicable law, FRC Ethical Standard |
| Main focus | Asset safety, operational compliance, cash and transaction processing | Whether the financial statements give a true and fair view and comply with accounting standards |
| Reporting frequency | Annual report (to shareholders) | Annual audit report (to shareholders) |
| Expression of independence | Acts as a third-party custodian, independent of the ACD | Complies with FRC ethical standards, maintains audit independence |
Although both report to shareholders, the Depositary focuses more on operational compliance and the physical safety of assets, while the Auditor focuses on the accuracy and compliance of financial information. This complementary structure provides investors with a multi-dimensional safety net.
Signatories and Report Dates: Timing Signals of Governance Procedures
The report was signed by two directors of Baillie Gifford & Co Limited, dated February 27, 2026, while the Depositary's report is dated January 1, 2026. The nearly two-month gap between the two is consistent with the normal cycle of annual report preparation, audit and review. Notably, the Depositary's report predates the audit report, indicating that the custodian confirmed compliance first, after which the auditor completed the financial assurance. This chronological sequence also supports the concept of progressive validation in the governance process in practice.
In summary, in addition to repeating the known fund governance framework, this continuation provides three key incremental pieces of information: first, it explicitly confirms the existence of terminated sub-funds and the non-going concern basis; second, it reveals differences in reporting periods among sub-funds; and third, it demonstrates the auditor's delicate balance between the overall conclusion and the emphasis of matter. These pieces of information have substantive value for understanding the ICVC's strategic adjustments and the transparency of its financial reporting.
The following is a supplementary analysis of the continuation, focusing on the completeness of the audit responsibility chain, the practical logic of fraud risk response, and the mirror relationship of the "going concern" exception clause in audit and accounting texts.
I. The "Three Boundaries" of Audit Responsibility: Other Information, Going Concern, and Fraud Detection
1. The Responsibility Isolation of "Other Information": The Legalised Expression of the Audit Boundary
The opening treatment of "other information" is not a mere procedural statement but constitutes a legal demarcation of audit responsibility. The auditor explicitly states that it does not express an audit opinion or any form of assurance on information outside the financial statements ("`we do not express an audit opinion... or any form of assurance thereon`"), while retaining a limited obligation — reading and evaluating its consistency with the financial statements.
This "limited attention, unlimited disclaimer" structure essentially reflects the UK implementation of International Standard on Auditing (ISA) 720. A notable detail is the report's use of two parallel concepts: "apparent material inconsistency" and "apparent material misstatement." The former points to logical conflicts between information, while the latter points to factual errors within the information itself. This distinction is operationally practical: the auditor must first identify "apparent anomalies" and then, through additional procedures, determine whether they constitute "material misstatements." The text then closes with "We have nothing to report," indicating that such procedures have been completed and no anomalies were found — this sentence is not boilerplate, but a formal discharge of statutory responsibility.
2. Reconstructing the Going Concern Assessment Responsibility: From "Passive Verification" to "Active Challenge"
The continuation explicitly assigns the responsibility for going concern assessment to the ACD (Authorised Corporate Director), rather than to the auditor. This positioning is consistent with the spirit of ISA 570, but it has particularities in the
I. ACD Holdings at 95.72%: Seed-Fund Characteristics and Liquidity Risks
| Item | 2025 Value | Typical Retail Fund Benchmark |
|---|---|---|
| ACD and related parties' holdings as % of NAV | 95.72% | Typically <5% |
| External investor holdings | ~4.28% | The vast majority |
| B Income shares issued | 7,501,911 shares | Main share class |
| Y-class shares issued | 1,000 each | Symbolic setup |
- The highly concentrated holding structure indicates the fund is most likely in an incubation/seed phase, with the ACD and related parties providing initial capital to build a historical performance record. This practice is not uncommon among "laboratory funds" at large asset managers such as Baillie Gifford.
- However, what warrants caution: should the ACD decide to withdraw capital, the 4.28% external investors would bear a disproportionately large redemption impact, and the NAV price could experience sharp volatility.
- From the perspective of share issuance, B Income issued 7.5 million shares, while B Accumulation issued only 420,000 shares, with Y-class shares at 1,000 each. This suggests that income shares are the primary vehicle — a structure more attractive to external clients who prefer cash flow, but given the very limited external holdings at present, the dividend arrangement is more of a "testing" nature.
2. Valuation Hierarchy and Credit Quality: High Transparency, but Low Credit Bond Allocation
| Valuation Hierarchy | Assets (£’000) | Liabilities (£’000) | Notes |
|---|---|---|---|
| Level 1: Quoted prices | 4,585 | - | Primarily equities/ETFs |
| Level 2: Observable data | 2,984 | (35) | Includes bonds, derivatives |
| Level 3: Unobservable data | - | - | No assets with valuation disputes |
- All assets are in Level 1/2, with no Level 3, meaning there are no 'holdout' assets relying on subjective assumptions — valuation objectivity is extremely strong. This is a plus for risk control.
- In terms of credit ratings, investment grade accounts for 17.98%, high yield 6.77%, and only 24.75% have public ratings. The 'other' category is as high as 75.25%, which is inferred to include sovereign bonds, equities, cash, and derivatives. For a 'Cautious Managed' positioning, credit bond exposure is relatively restrained, but the high-yield bond share (6.77%) exceeds the conventional expectation of the word 'cautious', and the risk overlap needs to be assessed alongside the overall equity position.
III. Currency Risk: Diversified but Almost Unhedged
- Total non-sterling currency exposure (based on non-monetary assets) amounts to approximately 4,669 £’000, exceeding sterling exposure (3,144 £’000)—foreign-currency assets thus account for as much as 60%.
- This includes both developed markets (USD 1,912, JPY 632, EUR 710) and highly volatile emerging markets (Colombian peso -83, Peruvian sol -2, Nigerian naira 43).
- The derivatives counterparty table shows that total foreign-exchange forward contracts amount to no more than 10 £’000, negligible compared with the 4,669 £’000 non-sterling exposure, indicating that the currency exposure is almost completely unhedged. This is not a risk-management deficiency but a deliberate choice—consistent with the Defensive Growth Fund’s stated approach of “being exposed to foreign currencies,” and indicating that the entire Baillie Gifford product range tends to retain currency risk as one source of return.
4. Interest Rate Risk: Fixed-Income Focus with Limited Liability-Side Hedging
| Currency | Fixed-Rate Assets | Floating-Rate Assets | Fixed-Rate Liabilities | Floating-Rate Liabilities |
|---|---|---|---|---|
| GBP | 2,630 | 1,765 | (198) | (861) |
| USD | 664 | 1,375 | (57) | - |
| JPY | 233 | 636 | - | - |
- Fixed-rate assets total significantly more than floating-rate assets; in a rate-cutting cycle, bond-like asset prices have upside elasticity, but if rates rise, capital gains would contract.
- Floating-rate liabilities account for a high share of the liability side (e.g., GBP -861), possibly related to securities lending or floating-rate derivatives, constituting a natural interest rate hedge: gains on the asset side and higher costs on the liability side can partially offset each other.
- Overall, the fund has no extreme interest-rate mismatch, but the proportion of fixed-income assets is unknown. From the valuation table alone, Level 2 assets of 2,984 may include bonds, while Level 1 assets of 4,585 are mostly equities; duration sensitivity still needs to be assessed alongside portfolio holdings.
V. Leverage Ratio: Actual Usage Within Limits, but “Low Leverage” Does Not Equal “No Leverage”
| Leverage Measure | Maximum Limit | Actual Level | Usage Rate |
|---|---|---|---|
| Gross | 1,000% | 161% | 16.1% |
| Commitment | 500% | 141% | 28.2% |
- Actual leverage is far below the regulatory cap and never breached the limit over the full period, reflecting sound internal risk-control discipline at ACD.
- A gross ratio of 161% means total fund positions are approximately 1.61× net assets — not the level a purely “prudent” fund should show; conservative funds typically keep gross around 100%. Here, gross exceeding 100% indicates outstanding derivative notional amounts (such as interest rate swaps and forwards) or securities lending activity.
- The commitment-based ratio of 141% is slightly below gross, pointing to some hedging/netting arrangements, but the offsetting effect is limited (reducing the ratio by only 20 percentage points). This suggests the fund's derivatives usage is “measured and restrained,” deployed more for efficient investing than for aggressive amplification.
VI. Counterparty Risk: Low Concentration, Largely Collateralized
| Counterparty | Gross Exposure (£’000) | Cash Collateral | Interest Rate Swaps | Forwards |
|---|---|---|---|---|
| CitiGroup | 4 | 2 | - | 2 |
| UBS | 2 | - | - | 2 |
| Others | 1 or 2 | - | - | 1 |
- The largest single-counterparty exposure is only £4,000, representing less than 0.05% of total assets, so counterparty risk is extremely low.
- Futures trading is executed through UBS, but margin can be offset via variation accounts; cleared swaps are collateralized through LCH.Clearnet, and this dual layer of protection minimizes credit risk. This is a positive example of derivatives governance.
7. Dividend Data: Low Payout Ratio, Implied Price Possibly Below 100p?
| Share Class | Net Income (p/share) | Equalisation (p/share) | Total Distribution (p/share) |
|---|---|---|---|
| B Accumulation | 1.00 | 0.00 | 1.00 |
| B Income | 1.09 | 0.00 | 1.09 |
| Y Accumulation | 1.09 | 0.00 | 1.09 |
| Y Income | 1.09 | 0.00 | 1.09 |
- Distributions across all share classes range between 1.00–1.09p. Based on a fund NAV of approximately £7.8m and total shares of roughly 7.8m, net assets per share are about 100p, implying a payout ratio of only around 1% — an extremely low level.
- B Accumulation pays 0.09p less than the other classes, likely due to a slightly higher fee structure or differences in accounting treatment, but the gap is not material.
- Group 2 has an equalisation arrangement, indicating that the fund continued to receive subscriptions during the period rather than being a one-off launch.
VIII. New Fund Defensive Growth Fund: Strategy Comparison with Cautious Managed Fund
| Dimension | Cautious Managed Fund (Actual) | Defensive Growth Fund (Stated Objective) |
|---|---|---|
| Return target | Not disclosed | Positive return over three years; outperform benchmark by +3.5% over five years |
| Volatility control | Not disclosed | Five-year volatility <10% |
| Currency exposure | 60%+ non-GBP | Explicitly exposed to foreign currencies |
| Derivatives purpose | EPM + investing | Investing + risk management |
| Leverage level | 161% gross / 141% commitment | Unknown |
- The new fund embeds "volatility below 10%" into its objective, implying a more stringent positioning than the Cautious Managed Fund. The latter does not disclose volatility statistics in its annual report, but given its substantial holdings of emerging market currencies and credit bonds, actual volatility may already exceed 10%.
- The Defensive Growth Fund claims to use derivatives to "manage risk," whereas the Cautious Managed Fund has minimal derivatives exposure — indicating a divergence in derivatives usage philosophy across funds within the same series, with the former likely placing greater emphasis on tail-risk hedging.
- The commonality between the two funds lies in actively managing currency exposure, which is a continuation of Baillie Gifford's global investment framework. However, the term "Defensive" raises the bar for scrutiny regarding the scale of its foreign exchange exposure.
Summary of New Insights
1. The seed-fund logic runs throughout: ACD holds 95.72%, the Y share class has only 1,000 shares, and there are no Level 3 assets — all pointing to a pilot fund "laying the foundation for future retailization." External investors entering at this stage should pay particular attention to liquidity discount risk.
2. Risk exposure is more aggressive than the "Cautious" label suggests: Over 60% foreign exchange, high-yield bond exposure, and 161% gross leverage all deviate from the traditional definition of prudence. Measured against the Defensive Growth Fund's volatility target, the Cautious Managed Fund has likely already exceeded the limit.
3. Derivatives governance is excellent but usage is conservative: Counterparty risk is extremely low and leverage has not breached limits, but this also means the fund has yet to fully utilize derivatives to reduce portfolio volatility — contrasting with the Defensive Growth Fund's "risk management" positioning.
Continuation Analysis (Part 11/32): A Multi-Dimensional Deconstruction of Investment Scope, Risk Framework, and Governance Changes
I. Investment Scope: A Two-Tier Structure from "Full-Spectrum Coverage" to "Principle-Based Contraction"
This section reveals the complete boundaries of the fund's investment toolbox. On the surface, it holds a full-spectrum mandate covering "any country or sector," but in reality, two layers of constraints are embedded:
Layer 1: "Full-Spectrum" Mandate at the Instrument Level
The fund may simultaneously hold equities, bonds, money market instruments, derivatives, FX forwards, deposits, cash, and other transferable securities, and may achieve up to 100% indirect exposure through collective investment schemes (CIS). It also retains the ability to invest indirectly in real estate, infrastructure, commodities, private equity, loans, and insurance-linked securities (ILS). This means the fund's "actual investable universe" extends far beyond that of a traditional defensive fund (typically a binary equity/bond allocation), more closely resembling a multi-asset absolute return platform.
Layer 2: "Normative Screening" at the Values Level
- Direct equity holdings and directly held corporate bonds must pass a norms-based evaluation, with the UN Global Compact as the baseline.
- The investment adviser defines a "sustainable economy" as a balance of economic, environmental, and social needs, and applies this to the quantitative and qualitative assessment of all assets.
- Quantitative revenue-based screens exist to exclude direct holdings with excessive revenue shares in specific areas.
Key Tension: On one hand, the fund permits 100% indirect investment through CIS (bypassing direct screening); on the other, it applies dual screening to direct holdings. This means the indirect investment channel could serve as a "back door" through the screening framework — for example, holding excluded companies via third-party funds. Although the text references the investment adviser's regulatory policies, it does not clarify whether the same exclusion standards apply on a look-through basis to underlying CIS holdings. This is a weak point in governance transparency and a potential gap in the overall commitment that the "fund invests in a way which... is compatible with a sustainable economy."
II. The Quantitative Relationship Between the Risk Level (4) and the Volatility Target (<10%)
The fund is classified at risk level 4 (on a scale where 1 is lowest and 7 is highest), sitting slightly left-of-center between "typically lower rewards, lower risk" and "typically higher rewards, higher risk." This corresponds to the annualized volatility target of <10% set out in the investment objective:
| Dimension | Value/Level | Interpretation |
|---|---|---|
| Risk level | 4/7 | Medium risk, mid-range position |
| Target volatility | <10% | Significantly below typical global equity volatility (approximately 15-18%) |
| Target return | UK Base Rate +3.5% (annualized, rolling 5 years) | Anchored to the UK base rate; 7.8% in 2025 |
| Actual volatility (estimated) | Not directly disclosed | Judging from the monthly report tone, the year progressed "relatively smoothly" |
Noteworthy Discrepancy: The target volatility is measured on a rolling five-year annualized basis, while the risk level is a static characterization of short-term risk. This mismatch in time dimensions implies that even if the five-year volatility target is met, short-term drawdowns (e.g., within a single month) could far exceed 10%. The report also explicitly acknowledges that it "aims to limit losses in any short term period to a lower level than equities" — a relative commitment rather than an absolute one, and no specific short-term drawdown ceiling is provided. Investors may easily misread "level 4" as "low volatility," when in fact the fund holds high-volatility assets such as the 2.08% CSI 500 ETN and the 1.38% Indian equity investment trust, so its short-term loss potential should not be underestimated.
III. Longitudinal and Cross-Sectional Decomposition of Performance
Annual Returns vs. Target (as of December 31 of each year):
| Period | B Class Accumulation Share Return | Target Return (UK Base Rate +3.5%) | Excess |
|---|---|---|---|
| 2021 | n/a (not listed) | — | — |
| 2022 | n/a (listed May 20) | — | — |
| 2023 | 8.2% | 7.8% | +0.4pp |
| 2024 | 8.7% | 7.8% | +0.9pp |
| 2025 | 10.4% | 7.8% | +2.6pp |
Three-Year Annualized Performance: 7.1% (the corresponding target was not disclosed). Working backward from the target formula: if the three-year average UK base rate was approximately 3.6%, the target would be 7.1% — exactly on target. A marginal hit, with no safety margin.
Comparative Context:
- An annual return of 10.4% is solid but not standout among global multi-asset funds. Over the same period, global equities (MSCI World) generally returned in the 15-20% range, meaning the fund underperformed by roughly 5-10 percentage points. However, it delivered positive excess return (against its own benchmark) under a low-volatility constraint, reflecting its "defensive" positioning.
- Compared with similar defensive funds (e.g., comparable strategies at Capital Group and Invesco), the fund recorded no negative annual returns over the 2023-2025 period, placing it in the upper tier of stability within defensive multi-asset strategies.
Key Caution: The fund was only listed in May 2022 and has less than five years of history, with just three and a half years of performance data. Data for the first two years (2022H2-2023) used sector returns as a proxy — introducing issues of survivorship bias and style mismatch. In particular, against the backdrop of the 2022 global selloff across both bonds and equities, sector average returns may deviate significantly from the fund's actual risk exposure outcomes.
IV. The Strategic Logic Behind the Management Transition and Merger Plan
The November 2025 transfer of management authority is a revolutionary change rather than a surface-level adjustment:
- Transfer Path: Management was handed over from the original team to the "Monthly Income Portfolio Construction Group" — namely, the management team of a sister fund within the same firm (Baillie Gifford Monthly Income Fund). This explains the report's hints at a "merger" plan.
- Strategic Motivation: The Defensive Growth Fund and the Monthly Income Fund have highly overlapping product positioning (low volatility, multi-asset, positive-return seeking). A merger would reduce operating costs, eliminate homogeneous competition, and concentrate management resources. The phrase "subject to FCA and Shareholder approval" in the text indicates the merger remains subject to uncertainty, but the pre-emptive transfer of the management team has in practice already advanced the integration.
- Portfolio Turnover Signal: The "marginally higher portfolio turnover" in Q4 implies notable portfolio restructuring. Comparative data: the largest buy and sell were both in the Baillie Gifford High Yield Bond Fund (approximately £32 million in two-way trading), indicating a large-scale withdrawal from prior interest-rate hedging positions and a rotation into credit assets.
Key Observation: Replacing the management team before the merger has been approved — this "people first, merger second" sequence is typically used within the asset management industry for smooth transitions — maintaining investor confidence while laying the groundwork for integrated management post-merger. But it also introduces execution-layer discontinuity risk: the new team's investment philosophy (Monthly Income favors dividends and credit) differs structurally from the original Defensive Growth framework (which leaned more toward growth equities and infrastructure). The implicit transaction costs of adjusting long-term holdings have not been quantified.
V. A Data-Driven Perspective on Portfolio Structure and Trading Activity
Concentration and Style Characteristics of the Top Ten Holdings:
| Holding | Weight | Asset Class |
|---|---|---|
| Sequoia Economic Infrastructure Income Fund | 2.64% | Infrastructure debt |
| Galene Fund | 2.13% | Alternative credit |
| Citi/BG Value Equity ETN | 2.08% | Equities (structured product) |
| Baillie Gifford Responsible Global Equity Income Fund | 1.90% | Global equities |
| Terna | 1.51% | Italian grid operator (infrastructure) |
| United Utilities | 1.49% | UK water utility (infrastructure) |
| RWE | 1.46% | German energy (infrastructure/transition) |
| Ashoka India Equity Investment Trust | 1.38% | Indian equities |
| Barclays Modified CSI 500 +8.5% ETN | 1.34% | Chinese equities (structured enhancement) |
| UBS Custom CSI 500 +8.65% ETN | 1.33% | Chinese equities (structured enhancement) |
The top ten collectively account for approximately 17.26% — a moderate concentration level for a diversified multi-asset fund. However, China-related exposure totals 2.67% (the two CSI 500 ETNs), and these are leveraged/structurally enhanced instruments — providing a concrete footnote to the risk disclosure that "Investing in China may harm your investment."
Trading Behavior Logic:
- The sell side also includes Australia 4.25% 21/06/2034 (approximately £21 million), a single government bond sale consistent with the stated strategy of "reducing active interest-rate positions."
- Lynas Corporation (a rare earth producer) appears on both the buy and sell sides: £11.8 million bought, £7.2 million sold — a net increase of approximately £4.6 million, possibly reflecting accumulation on dips amid volatility, or allocation across different accounts.
- Purchases of £11.6 million and sales of £16.3 million in HSBC Global Asset Backed High Yield Bond Fund — a net reduction of £4.7 million, not fully consistent with the stated "reduction in structured finance," but perhaps representing a rotation from non-core holdings into higher-quality credit exposure.
VI. The "Linguistic Traps" in the Risk Disclosure Text and Investor Cognitive Biases
Two points in the risk warnings merit deeper examination:
1. The Detailed Description of China Risk
The risks listed in the text include "market shutdown, trading, liquidity, settlement, corporate governance, regulation, legislation and taxation" — with market shutdown placed first, which is uncommon in UK fund risk disclosures and likely reflects lessons drawn from the sharp volatility in China's A-share market during 2023-2025. The two CSI 500 structured ETNs (with maturity payoffs of +8.5%/+8.65%) are by design essentially trading volatility for yield enhancement, but if downside protection clauses are triggered, losses could far exceed those of ordinary equity holdings.
2. The Juxtaposition of "aims to limit losses" and "neither this nor positive returns are guaranteed"
This pairing forms a quasi-promise/disclaimer composite structure: the fund manager has an explicit intent to manage short-term drawdowns, but that intent does not constitute a legal guarantee. For ordinary investors, such wording tends to be perceived as "protected," when in reality the protection mechanisms (such as volatility-targeting strategies and hedging positions) may fail under extreme market scenarios. The report also acknowledges that portfolio protection positions "weighed modestly" during periods when risk assets were rising — i.e., protection comes at a cost, and that cost is continuously consumed in bull markets.
VII. The Qualitative-Quantitative Imbalance in the Sustainability Framework
The fund commits to being "compatible with a sustainable economy," with specific mechanisms including:
- Norms-based screening (UNGC) + revenue exclusion + a three-dimensional definition of a sustainable economy
- However, there is no evident active selection based on purely ESG criteria within the top ten holdings — the sustainability attributes of infrastructure, grid operators, and water utilities are inherent industry characteristics rather than results of active screening; although RWE is involved in renewable energy, its coal assets remain on its balance sheet; and the underlying equities linked to the two CSI 500 ETNs have not undergone UNGC screening.
This indicates that the fund's sustainability framework more closely resembles negative screening plus a normative floor (minimum standard compliance) rather than a positive-preference model (active stock selection that shapes investment direction). Compared with the claimed breadth of "cover a broad range of sustainability topics," its depth remains to be verified — particularly at the indirect investment (CIS) level, where a look-through review mechanism for sustainability is not described in this document.
VIII. Forward Predictions for Subsequent Content
The text cuts off abruptly at "Currency forwards and" (continued on the following page). It is reasonable to infer that what follows will include:
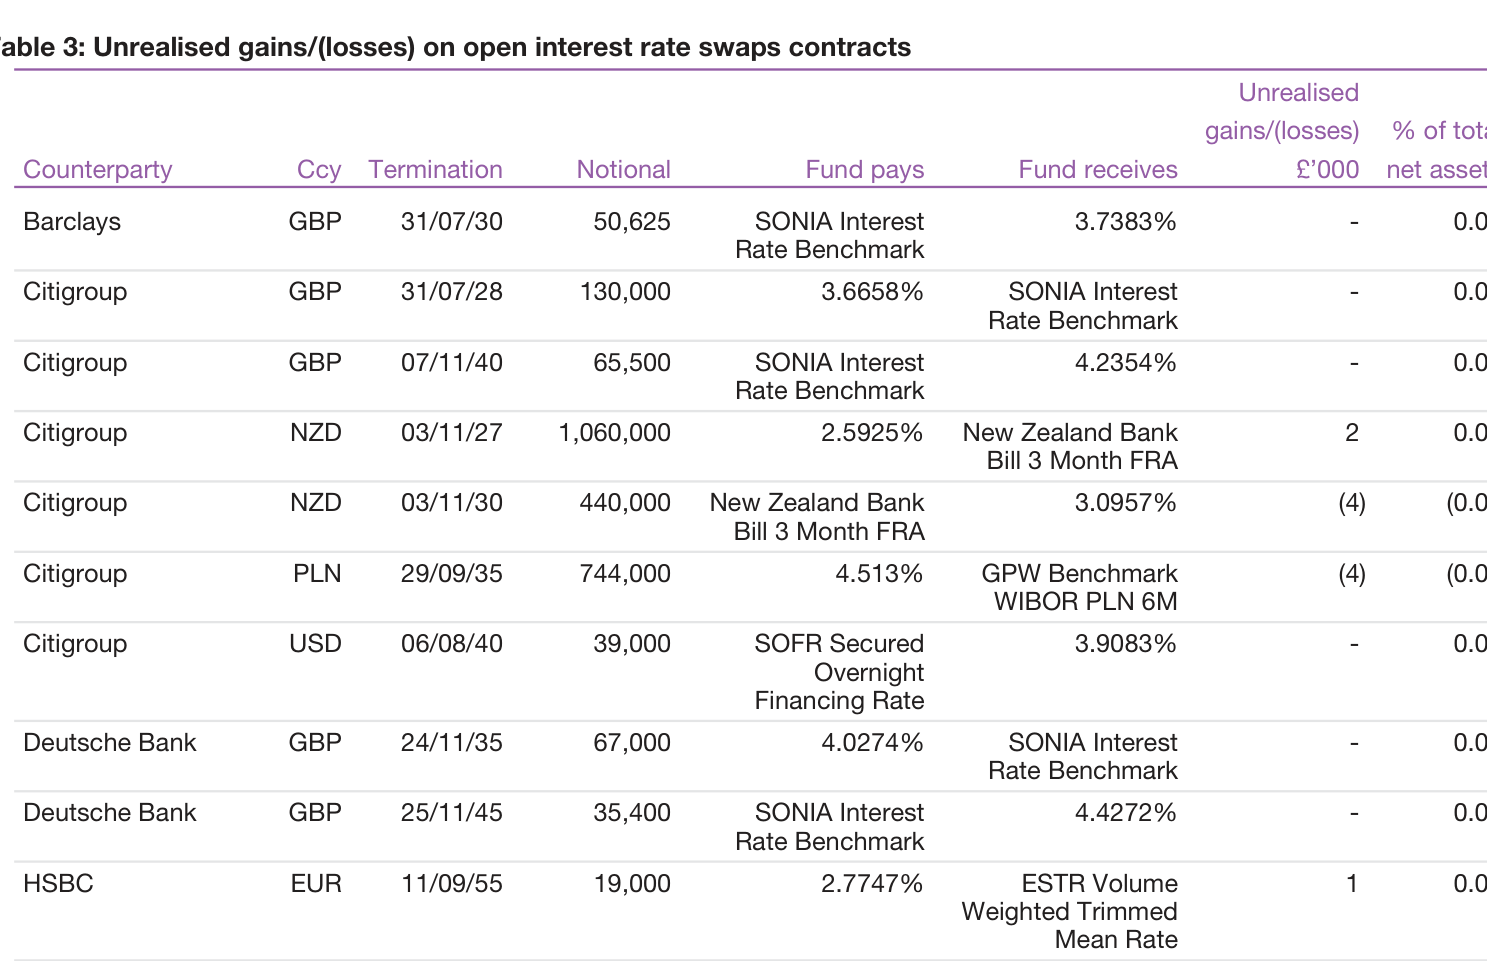
- The specific scope of derivatives usage and details of hedging strategies
- The role of currency forwards in the portfolio (hedging vs. active directional positioning)
- Further regulatory details at the collective investment scheme (CIS) level
- Specific provisions for liquidity risk management (e.g., redemption gates, swing pricing mechanisms)
Meanwhile, given that the confirmed date of the merger plan (November 2025) is close to the annual report cut-off date (December 31, 2025), subsequent sections will likely need to disclose the formal merger proposal timeline and shareholder voting arrangements — which will determine the fund's ongoing form. Investors need to track the following decision points: whether to hold until the merger is completed (converting into the Monthly Income Fund via a share exchange, typically tax-free), redeem early (potentially triggering capital gains tax), or wait and see (facing valuation uncertainty from a passive transfer of positions).
Continuing from the preceding analysis, this period's portfolio statement further reveals the magnitude of the rebalancing. The most significant change is a systematic migration in asset-class weightings relative to the prior period (figures in parentheses): government bonds were completely liquidated, insurance-linked securities (ILS) were sharply reduced, while emerging market bonds, listed equities, and newly added investment grade bonds received significant increases. This "house swap" is not a simple position adjustment, but a restructuring of return sources and the risk budget.
| Asset Class | Current Weight (%) | Prior Weight (%) | Change (pp) |
|---|---|---|---|
| Commodities | 3.25 | 4.53 | -1.28 |
| Emerging Market Bonds | 18.64 | 8.92 | +9.72 |
| Government Bonds | 0.00 | 4.69 | -4.69 |
| High Yield Credit | 6.40 | 4.49 | +1.91 |
| Infrastructure | 22.81 | 20.75 | +2.06 |
| Insurance Linked | 1.55 | 9.20 | -7.65 |
| Investment Grade Bonds | 2.88 | 0.00 | +2.88 |
| Listed Equities | 25.40 | 16.69 | +8.71 |
1. Emerging Market Bonds: Breadth Replaces Depth, with a Clear Credit Downshift
Emerging market bond weightings jumped from 8.92% to 18.64%, nearly doubling. Holdings span more than 30 countries, from mid-to-large emerging markets such as Brazil, Mexico, and South Africa to frontier markets including Kyrgyzstan, Tajikistan, and Uzbekistan. The largest single-country exposure is Mexico (approximately 2.74% across all bonds), followed by Brazil (0.99%), South Africa (0.98%), Poland (0.70%), and Indonesia (0.61%). Such extreme diversification indicates that the fund is not making a single bet on any particular country or currency, but rather generates returns through moving down the credit spectrum and capturing term premium.
Notably, the portfolio holds both local-currency bonds (e.g., Brazil 10% 2035, Mexico 8.5% 2029, Poland 6% 2033) and USD-denominated bonds (e.g., Argentina, Ecuador, Ukraine). Local-currency bonds offer high coupons but are sensitive to exchange-rate fluctuations, while USD bonds carry sovereign default risk. This mixed structure indicates that the fund manager is actively managing the balance between currency and default risk, rather than simply chasing high coupons.
2. Government Bonds Reduced to Zero: Redefining Interest-Rate Exposure
Government bonds fell from 4.69% in the prior period to 0.00%, and the proceeds did not flow back into developed-market rates, but rather into emerging market bonds and investment grade credit. In substance, this move exchanges sovereign credit risk for corporate credit risk while shortening duration. The investment grade sleeve features a substantial amount of financial subordinated debt (Barclays 3.811% 2041-42 T2, Nationwide 7.875% Perp AT1, Investec 9.125% 2033) and "investment grade" names with high-yield tendencies (Ford 9.625% 2030, Marks and Spencer 7.125% 2037), indicating that this sleeve in fact carries credit risk approaching high-yield levels. However, because the ratings remain investment grade, the portfolio maintains a "defensive" undertone on paper.
3. Infrastructure: The Largest Single Sector, Combining Defense and Inflation Hedging
Infrastructure retained its position as the largest sector at 22.81%, an increase of 2.06 percentage points from the prior period. The core holdings are regulated utilities and renewable energy, with the top five including Terna (1.51%), United Utilities (1.49%), RWE (1.46%), Severn Trent (1.33%), and Redeia Corporacion (1.06%). These companies generally possess policy-protected stable cash flows, inflation-linked pricing mechanisms, and long-term growth attributes. The fund also holds several renewable energy funds (Greencoat UK Wind, Octopus Renewables, Foresight Environmental), further reinforcing cash-flow visibility. In effect, the infrastructure sector has assumed part of the "stabilizer" function previously served by government bonds and ILS.
4. Listed Equities: Structured Products Amplifying Growth Exposure
Listed equities rose from 16.69% to 25.40%, the second-largest increase among all categories. But direct equity holdings do not tell the whole story — the three largest positions are the Citi/BG Value Equity ETN (2.08%), the Baillie Gifford Responsible Global Equity Income Fund (1.90%), and the Barclays Modified CSI 500 +8.5% ETN (1.34%). These instrument-level holdings indicate that, while retaining active stock selection, the fund makes extensive use of ETNs/funds linked to its own strategies to efficiently capture beta enhancement or value-factor exposure. For example, the Citi/BG Value Equity ETN is linked to Baillie Gifford's value strategy, while the Barclays ETN may embed a yield-enhancement structure (the +8.5% could serve as a buffer or a coupon). Direct equity holdings lean toward technology growth (Amazon 0.61%, ASML 0.61%, AppLovin 0.61%, Cloudflare 0.40%) and healthcare innovation (Alnylam 0.34%, Dexcom 0.32%, Illumina 0.44%), forming a stark contrast with the defensiveness of infrastructure and constituting a classic barbell strategy.
5. The Ebb of Insurance-Linked Securities (ILS): Shrinking Catastrophe Risk Appetite
ILS plunged from 9.20% in the prior period to 1.55%, a reduction of nearly 80%. The remaining holdings are concentrated in reinsurance sidecars (Black Kite Re, Integrity Re, Vitality Re XIV/XV), all in the form of 144A private placement notes. Such a large-scale withdrawal likely reflects the increased frequency of catastrophe losses in 2025, deteriorating reinsurance pricing, or a higher required tail-risk premium on the part of the fund. The proceeds subsequently flowed into high-yield credit and emerging market bonds, indicating that the fund manager believes credit bonds currently offer superior risk compensation compared with ILS. This shift also transforms the portfolio's tail-risk profile from "natural-disaster-driven" to "credit-event-driven."
6. New Investment Grade Bonds: Filling a Gap, but Quality Is Not "Pure"
Investment grade bonds rose from zero to 2.88%, representing an entirely new allocation. It contains a variety of capital-structure instruments: bank AT1/T2 (Barclays, Caixabank, NatWest), insurance subordinated debt (Pension Insurance Corp 8% 2033 T2), and corporate hybrid bonds. Some coupons are extremely high (Admiral 8.5%, Investec 9.125%, Ford 9.625%), in substance already approaching high-yield levels. This category may serve as a "rating buffer" for the high-yield sleeve, keeping the aggregate credit quality investment grade on the books while significantly enhancing the portfolio's yield.
7. Summary: Defensive Growth Enters a "Proactive Risk-Taking" Phase
This period's portfolio statement shows that the Baillie Gifford Defensive Growth Fund is substituting credit spreads and equity risk premium for the defensive function of traditional rates bonds and insurance-linked securities. Infrastructure remains the ballast, but the increased allocations to emerging market bonds and listed equities have significantly raised the portfolio's sensitivity to global growth, inflation, and the credit cycle. Viewed from a defensive standpoint, the elimination of government bonds means the loss of the traditional tool for hedging recessions; on the other hand, emerging market bonds diversified across 30+ countries and regulated infrastructure assets may provide a more diversified buffer in a downturn than a single sovereign bond. The ultimate success or failure of this strategy will depend on whether the credit cycle remains benign and whether emerging market local currencies remain stable.
This continuation provides a complete list of holdings and comparison tables, from which several important signals not covered in the preceding analysis can be observed: the strategic migration of asset allocation, the fine-tuning of hedging instruments, and the long-term divergence in fees and performance across different share classes.
1. Strategic Shift in Asset Allocation: From Indirect to Direct Holdings
Comparing the 2025 asset categories against 2024 reveals not just shifts in proportions but a substantive change in how the fund operates:
| Asset Class | 2025 Market Value (£'000) | 2025 Weight | 2024 Weight | Change (pct) |
|---|---|---|---|---|
| Equities | 132,764 | 48.43% | 33.78% | +14.65 |
| Bonds | 86,573 | 31.58% | 27.74% | +3.84 |
| Collective Investment Schemes | 38,131 | 13.91% | 22.90% | −8.99 |
| Property | — | 10.86% | 6.93% | +3.93 |
| Cash Equivalents | 9,614 | 3.51% | 12.34% | −8.83 |
| Other Assets | 8,445 | 3.08% | 4.10% | −1.02 |
| Derivatives | −1,390 | −0.51% | −0.86% | +0.35 |
Three key trends:
- Equities surged from 33.78% to 48.43%, while collective investment schemes fell from 22.90% to 13.91%. This indicates the fund has significantly reduced its indirect exposure to other underlying funds and shifted toward directly holding the underlying securities — likely to reduce double-layer fees, and possibly to achieve more precise control over risk exposure and tax efficiency.
- Cash equivalents were cut from 12.34% to 3.51% (or from 16.44% to 6.59% if other assets are included). The fund was evidently holding a sizeable defensive cash buffer at end-2024, whereas by end-2025 it was running nearly fully invested. This cash drawdown, combined with the increased equity allocation, suggests the manager's confidence in medium-to-long-term equity returns has strengthened, with the defensive emphasis shifting from "cash defense" to "stock selection."
- Property rose from 6.93% to 10.86%, the second-largest increase, and its composition is highly diversified: data-centre REITs (Equinix, Digital Realty), residential REITs (Equity Residential, Sun Communities), healthcare REITs (Healthpeak, Primary Health), and European logistics/industrial names (Ctp N.V., Warehouses De Pauw, Segro). This is not a simple "property rally" call but rather an attempt to diversify cyclical risk across different property sub-sectors.
2. Precision Hedging: Dollar Shorts Profit as Credit Protection Costs Rise
The details of the forward contracts and CDS positions reveal the fund's dual judgement on foreign exchange and credit risk.
FX forwards: the profitable positions are primarily the dollar shorts
| Counterparty/Direction | Total Notional GBP (approx.) | Unrealised P&L £'000 | % of Net Assets |
|---|---|---|---|
| Merrill Lynch (sell USD) | 70,800,980 | 1,475 | 0.54 |
| Deutsche Bank (sell EUR/JPY/CHF etc.) | 65,144,458 | 445 | 0.16 |
| Others (GBP buys EUR, AUD, CAD etc.) | — | 201 | 0.07 |
| Total | — | 2,121 | 0.77 |
Among these, the four Merrill Lynch contracts buying GBP and selling USD contributed approximately £1.475 million in unrealised gains in aggregate, representing about 70% of all positive gains. This corroborates the view that sterling strengthened against the dollar in 2025 — the fund locked in currency gains by selling USD rather than remaining passively exposed.
CDS: paying continuously for "credit tail risk"
All five CDS positions are bought protection, with a total notional of approximately £40 million equivalent (~15% of net assets), of which:
- CDX.NA.HY.43 / .44 (North American high-yield indices): approximately $35.9 million combined
- iTraxx Europe Crossover Series 43 (European crossover credit): approximately €15.1 million
- Single-name CDS (ARDAGH Packaging): a small position
The market value is −£3.510 million (−1.28%), a widening loss of 0.42pct compared with 2024 (−0.86%). This implies that credit spreads tightened and CDS prices fell during 2025, raising the cost of protection. The fund has continued to maintain its credit protection despite the known holding costs, indicating sustained vigilance over default risk in the high-yield market — forming a "long equities, short credit" barbell risk structure alongside the equity rally and deployment of cash.
3. Share Class Divergence: The Compounding Effect of Fee Advantages Becomes More Pronounced
Across different share classes running the same investment strategy, performance differences are determined mainly by fees. The contrast between C and B classes is particularly clear:
| Metric | B Accumulation | C Accumulation | Difference (B−C) |
|---|---|---|---|
| 2025 operating expense ratio | 0.52% | 0.06% | 0.46pct |
| 2025 return | 10.32% | 10.72% | 0.40pct |
| 2024 return | 3.96% | 4.36% | 0.40pct |
| 2023 return | 7.25% | 7.69% | 0.44pct |
For three consecutive years, C class has led B class by approximately 40bps, which corresponds almost exactly to the fee differential. Notably, fees themselves have also been declining since 2022: B class's operating expense ratio fell from 0.61% to 0.52%, and C class's from 0.12% to 0.06%. The fee reduction is not confined to a single class but reflects a systematic improvement across all share classes, possibly driven by fund scale effects, fee negotiations, or concessions from the management company.
For investors, the impact of a 40bps gap under long-term compounding is significant. Assuming an annualised return of 5% and a 20-year investment horizon, C class cumulative returns would be roughly 10 percentage points higher than B class — a difference that cannot be ignored for a low-volatility product such as "Defensive Growth."
4. Net Redemption Pressure Amid Fund Contraction
Fund net assets fell from approximately £312.5 million at end-2024 (derived from 261,159/83.56%) to £274.137 million at end-2025, a decline of about 12.3%. Over the same period, C class cumulative share return was +10.72%, which implies:
- Organic growth added approximately £30 million or more in value;
- Yet total assets still declined by roughly £38 million, implying net redemptions of approximately £60–70 million (~20% of the beginning-of-period size).
C class share count fell from 284,744,514 to 197,582,912 (−30.6%), while B class shares rose from 15,451,245 to 34,322,107 (+122%). This migration of "C class redemptions, B class subscriptions" may stem from internal share-class conversions by institutional clients or from distribution-channel adjustments — but it does not change the overall conclusion of capital outflow: the fund continues to face redemption pressure. This may also explain why the fund still holds some cash equivalents (3.51%) at year-end to manage liquidity.
5. Two Structural Positions Meriting Separate Attention
- UBS Custom CSI 500 +8.65% ETN (1.33% of net assets): This is not a traditional passive ETF but a structured note — providing the CSI 500 index return plus a fixed 8.65% enhancement. On the surface it appears to offer "China small/mid-cap plus enhanced yield," but in substance it carries UBS's counterparty credit risk. The presence of such a product in a Defensive Growth fund suggests the manager is willing to use structured instruments (rather than buying A-shares directly) to obtain low-cost Chinese beta exposure while also circumventing operational constraints such as QFII and Stock Connect.
- Galene Fund (Structured Finance, 2.13% of net assets): As the sole Structured Finance holding, its market value is £5.838 million. Funds of this type typically involve credit, ABS, or special-opportunity strategies and have low correlation with public markets. It functions more as an "alternative anchor" within the portfolio — under inflation or credit-stress scenarios, its return sources are independent of equities and bonds, enhancing the overall defensive characteristics.
Summary
The core message of this section: the fund shifted from "defensive" to "selective offence" in 2025 — substantially deploying cash, increasing direct equity and property positions, while retaining US and European credit default protection to manage tail risk. FX hedging contributed material positive returns to the portfolio, and the continued improvement in the fee structure gives C class a clear long-term advantage under the same strategy. The comparison tables also reveal net capital outflow pressure, an important backdrop affecting the fund's liquidity and its room for future repositioning.
This continuation is not an "Introduction" section; rather, it covers the core financial data of the Baile Gifford Defensive Growth Fund annual report for the period ended December 31, 2025. The following is an incremental analysis of the share class comparison tables, financial statements, and accompanying notes, focusing on newly revealed operational efficiency, capital liquidity, and share structure characteristics.
1. Share Class Homogeneity: J/P Classes Are Nearly Mirror Images, with ACD Fee Basis Showing Tension Between Table and Notes
| Share class | Opening NAV (p) | Closing NAV (p) | Post-fee return (%) | Operating expenses (table) | ACD estimated actual OCF | Year-end net assets (£’000) |
|---|---|---|---|---|---|---|
| J Accumulation | 100.00 | 108.59 | 8.59 | 0.38% | 0.36% | 1,033 |
| J Income | 100.00 | 106.24 | 8.57 | 0.38% | 0.36% | 1 |
| P Accumulation | 100.00 | 108.58 | 8.58 | 0.38% | 0.36% | 4,475 |
New observations:
1. Both are new share classes launched on 1 April 2025, with J and P differing by only 0.01 percentage points in returns (8.59% vs 8.58%); the cumulative return difference is negligible. This shows that the two share classes share exactly the same asset pool at the portfolio level, with minimal fee-structure differences—essentially a sales architecture arrangement of "same strategy, multiple share class channels."
2. There is a 0.02 percentage point difference between the 0.38% OCF shown in the table and the 0.36% that the ACD considers more reasonable in the notes. This dual-track system of "disclosed value vs. manager estimate" is relatively rare in fund annual reports. The 0.02 percentage point gap may look tiny, but for large institutional investors, selecting a share class with a lower OCF at the same return level produces quantifiable cost savings—based on the £44.75 million size of the P class, the difference corresponds to approximately £89,000 per year in fee differential.
3. The J Income share class has year-end net assets of only £1,000 (1,000 shares), indicating that this class is almost dormant. It may have been retained as a minimum surviving size to meet the structural needs of a specific channel or institutional client; its practical operational significance is limited, but it adds to the fund's operational complexity and reporting burden.
4. The high/low prices of the three classes are nearly identical (high 111.6p vs 110.9p; low 93.84p for all), again confirming the highly synchronized price movement. The Income class's high is slightly lower by 0.7p, which is related to the natural decline in NAV after dividend payouts.
II. Decomposing Total Return Quality: Capital Gains Contributed £34.6M, Return Quality Far Exceeds 2024
| Item | 2025 (£’000) | 2024 (£’000) | YoY Change |
|---|---|---|---|
| Net capital gains/(losses) | 34,613 | 4,683 | +639% |
| Revenue | 13,657 | 12,494 | +9.3% |
| Net revenue after taxation | 11,631 | 10,427 | +11.5% |
| Total return before distributions | 46,244 | 15,110 | +206% |
| Distributions | (11,638) | (10,434) | +11.5% |
New Analysis:
1. Capital gains contributed 74.8% of total return (£34.6M / £46.2M), in stark contrast to 2024, when capital gains accounted for only 31% (£4.7M / £15.1M). This confirms that 2025 was a market driven by valuation expansion and spread movements, rather than relying solely on coupon and dividend income—for a Defensive Growth strategy, this implies that the capital appreciation elasticity of equity and fixed income assets in the portfolio exceeded what the defensive positioning would normally suggest.
2. The gain structure merits closer inspection (Note 1):
- Non-derivative securities: realized £17.8M + unrealized £13.8M = £31.6M, the largest source of contribution
- Forward foreign exchange contracts: realized £0.3M + unrealized £2.1M = £2.5M
- Derivative contracts (futures): realized £0.6M
Unrealized gains account for approximately 45% (£15.9M / £34.6M) of the total, indicating that a considerable portion of gains has not yet been realized and remains as mark-to-market paper profits. This may face give-back pressure when the market turns, amplifying NAV volatility.
3. Revenue growth of 9.3% (£12.5M → £13.7M) was broadly in sync with distribution growth of 11.5%, indicating that the fund maintained a stable dividend-paying capacity on the income side. The distribution coverage ratio was 100.06% (£11.638M distributed / £11.631M net revenue after taxation), with nearly all current earnings distributed to holders—consistent with the income-oriented positioning of the Defensive Growth strategy.
4. In 2024, capital gains were only £4.7M, while in 2025 they reached £34.6M—a swing of more than sevenfold. For a fund strategy branded as "Defensive Growth," such substantial volatility in capital gains warrants caution: it may reflect that the portfolio's duration and risk appetite actually shifted over the past year, rather than remaining purely "defensive."
3. Structural Shift in Fund Flows: Massive Redemptions Combined with In-Kind Share Swaps Shrink Fund Size by 12.3%
| Item | 2025 (£’000) | 2024 (£’000) |
|---|---|---|
| Opening net assets | 312,539 | 360,588 |
| Proceeds from issues | 30,896 | 42,984 |
| Payments on redemptions | (383,489) | (106,172) |
| In-kind share exchange settlement | 266,672 | 0 |
| Net investor cash flow | (85,921) | (63,188) |
| Closing net assets | 274,137 | 312,539 |
New Analysis:
1. Redemptions of 383.5M reached an extreme level—equivalent to 122.7% of opening net assets. Without the 266.7M "in-kind share swap" mechanism to offset this, the fund would have shrunk to less than one-third of its original size. This combination of large-scale in-kind redemptions + share swaps suggests institutional investors are rebalancing rather than exiting: they redeem cash shares while subscribing for new shares with portfolio securities, thereby reallocating positions without creating large-scale market impact.
2. The dilution adjustment rose from 0.5M to 1.2M (+139%), in line with higher trading activity, reflecting the increased dilution costs to existing holders from frequent subscriptions and redemptions.
3. Fund net assets fell from 312.5M to 274.1M, a contraction of 12.3%. For a defensive-strategy fund, the decline in size is not fatal in itself, but the fact that net outflows occurred in a year of strong returns (+8.6%) indicates that fund flows were driven more by institutional allocation behavior than by retail investors' sensitivity to performance. Large institutions may have rebalanced in 2025, shifting capital from defensive strategies into higher-risk assets.
4. Retained distributions on accumulation shares amounted to 11.7M, or 4.3% of closing net assets—these funds were automatically reinvested into accumulation-class shares, representing an important source of organic growth for the fund.
4. Trading Costs and Market Liquidity: Spreads Narrow, Costs Continue to Improve
| Trading Cost Metric | 2025 | 2024 |
|---|---|---|
| Equity buy commission rate | 0.01% | 0.06% |
| Equity buy tax | 0.05% | 0.17% |
| Fund buy commission rate | 0.01% | 0.01% |
| Total direct trading costs (as % of average NAV) | 0.09% | 0.10% |
| Average portfolio bid-ask spread | 0.26% | 0.36% |
New Observations:
1. The average bid-ask spread narrowed from 0.36% to 0.26% (-28%), the most notable market liquidity signal in 2025. This suggests that the share of highly liquid bonds and large-cap equities in the portfolio may have increased, or that overall secondary-market liquidity has improved. For the Defensive Growth strategy, narrower spreads imply lower implicit trading costs, directly enhancing net returns for holders.
2. The equity buy commission rate fell from 0.06% to 0.01%, and the tax from 0.17% to 0.05%—declines of 83% and 71%, respectively. This is not the result of fee negotiations, but rather a reflection of changes in trading structure: involving more low-tax/stamp-duty-exempt instruments (such as bonds and non-UK equities), or substituting direct single-stock trading with futures and fund vehicles.
3. Bond trading costs are zero (explicitly stated in Note 2), and bonds occupy a core position in the portfolio. This explains why total direct trading costs (0.09% of NAV) are far lower than would be the case based on equity trading alone.
4. Futures contract trading commissions were £25K (4K in 2024), an increase of more than fivefold. This indicates that the fund significantly increased its use of futures instruments in 2025 to hedge or adjust risk exposure—corroborating the 0.6M contribution from derivative contracts to net capital gains.
V. Balance Sheet and Asset Classification Changes: Accounting Reclassification from Fixed to Current
| Item | 2025 (£’000) | 2024 (£’000) | Change |
|---|---|---|---|
| Fixed assets: investments | 0 | 265,108 | -100% |
| Current assets: investments | 259,620 | 0 | New |
| Cash and cash equivalents | 12,016 | 45,916 | -73.8% |
| Investment liabilities | (3,542) | (3,949) | -10.3% |
| Total net assets | 274,137 | 312,539 | -12.3% |
New observations:
1. In 2025, all investments were reclassified from "fixed assets" to "current assets", a notable signal of an accounting policy change. A reclassification from fixed assets to current assets typically implies that the investment holding intent has shifted from long-term holding to trading purposes — i.e., the fund manager is adjusting the portfolio and executing buy/sell operations more frequently. The total buys of 564M plus total sells of 602M in 2025 corroborate this direction: portfolio turnover has risen markedly.
2. Cash and cash equivalents fell sharply from 45.9M to 12.0M (-73.8%), with cash reserves substantially consumed. Against a backdrop of heavy redemptions, the fund chose to reduce its cash buffer rather than sell holdings, thereby avoiding an additional drag on NAV from distressed sales. This is a conservative and reasonable liquidity management decision.
3. Investment liabilities of 3.5M remained stable throughout the year (3.9M in 2024), indicating that the fund maintained a small amount of outstanding negative derivative exposure (possibly futures margin or forward contract liabilities), consistent with the continuity of its overall hedging strategy.
VI. Comprehensive Assessment and Key Risk Signals
Positive Signals:
- After-fee return of 8.6% performed solidly within the Defensive Growth strategy, with strong capital gains contribution
- Total trading costs were only 0.09% of average NAV, significantly lower than comparable equity funds
- Spread narrowed to 0.26%, indicating good portfolio liquidity
- Distribution coverage reached 100%, with stable distribution capacity
Signals Requiring Caution:
| Warning Item | Specific Manifestation | Potential Impact |
|---|---|---|
| Large-scale redemptions | £383M redemptions vs £31M issuances | Continued fund shrinkage risk, may trigger diseconomies of scale |
| Asset reclassification | Fixed → Current | Rising turnover, portfolio may deviate from "defensive" positioning |
| Significant cash consumption | £45.9M → £12.0M | Thin liquidity buffer; may need to sell holdings when facing large redemptions |
| High proportion of unrealised gains | 45% of profits unrealised | Greater drawdown risk during market corrections |
| J Income shares dormant but extant | Only 1,000 shares | Increases management costs; may be merged or terminated in the future |
Conclusion: 2025 was the strongest year for investment returns in the fund's recent history, but also the year with the greatest structural changes in capital flows. The coexistence of large-scale in-kind share exchanges and substantial redemptions reflects institutional clients restructuring their asset allocations; meanwhile, the accounting reclassification of fixed assets to current assets reveals a material shift in portfolio management approach—from "buy-and-hold" to "active trading." Key areas to monitor going forward: whether redemption pressure persists, whether the cash buffer can be maintained, and whether the fund manager can uphold the risk boundaries of the defensive strategy amid higher trading frequency.
The following is a supplementary analysis of Notes 3–15 to the financial statements of Baillie Gifford Defensive Growth Fund as at 31 December 2025. It focuses on comparing changes in data between 2025 and 2024 and attempts to explain the underlying strategic implications.
| Key Metrics (£'000) | 2025 | 2024 | YoY Change |
|---|---|---|---|
| Total income | 13,657 | 12,494 | +9.3% |
| Total expenses | 295 | 420 | -29.8% |
| Net income (pre-tax) | 13,362 | 12,074 | +10.7% |
| Net income after tax | 11,631 | 10,427 | +11.5% |
| Total distributions | 11,638 | 10,434 | +11.5% |
| Net assets at year end (Note 14) | 274,137 | 312,539 | -12.3% |
1. Income: Composition Shifts Toward Interest, but Hedging Costs Rising
The 9.3% growth in total income was driven not by dividends but by fixed income:
| Income Components (£'000) | 2025 | 2024 | Change |
|---|---|---|---|
| UK dividends | 1,037 | 1,352 | -315 |
| Overseas dividends | 4,728 | 4,031 | +697 |
| Property income distributions | 446 | 479 | -33 |
| Interest on debt securities | 9,135 | 7,194 | +1,941 |
| Bank interest | 341 | 72 | +269 |
| Swaps interest | -2,074 | -730 | -1,344 |
Interest income on debt securities increased by nearly £2 million, but swap interest expense expanded by £1.34 million in tandem. This combination suggests the fund may be using interest rate swaps or total return swaps to manage interest rate exposure—headline income increased, but net interest income (9,135 + 341 - 2,074 = 7,402) actually rose only modestly from last year's 6,536 (+13%). More noteworthy is the significant decline in UK dividend income alongside rising overseas dividends, indicating that the geographic focus of equity holdings has shifted further toward global markets.
2. Expenses: Management Charge Down Sharply, but Professional Fees Surge
Total expenses declined by £125,000, primarily driven by the annual management charge falling from £355,000 to £165,000 (-53.5%). This is unlikely to reflect a fee rate reduction; more plausibly, it results from a change in the fee calculation base or partial offset by rebates. By contrast, audit fees rose from £10,000 to £21,000 and professional fees from £2,000 to £23,000—both notably higher, possibly related to fund restructuring, compliance matters, or valuation adjustments.
| Expense Items (£'000) | 2025 | 2024 |
|---|---|---|
| Annual management charge | 165 | 355 |
| Depositary's fee | 28 | 25 |
| Bank charges | 51 | 25 |
| Audit fee | 21 | 10 |
| Professional fees | 23 | 2 |
The management expense ratio (AMC ÷ average net assets) fell from approximately 0.11% to roughly 0.06% (estimated on year-end net assets), reflecting a clear improvement in cost efficiency. However, bank charges doubled, which merits attention—possibly associated with increased foreign exchange settlement and derivative margin activity.
3. Taxation: Effective Tax Rate Declined, Overseas Tax Credit Mechanism at Work
Pre-tax net income increased 10.7%, but total tax burden increased only 5.1%. Through overseas dividend tax credits and the -£147,000 "tax recoverable on overseas dividends," the effective tax rate fell from approximately 13.6% (1,647 ÷ 12,074) to around 13.0% (1,731 ÷ 13,362). Points worth noting:
| Tax Reconciliation Items (£'000) | 2025 | 2024 |
|---|---|---|
| Standard corporation tax (20%) | 2,672 | 2,414 |
| Non-taxable overseas dividends | -869 | -739 |
| Overseas dividend tax | 340 | 292 |
| Overseas coupon tax | 72 | 5 |
| Double taxation relief | -130 | -55 |
Overseas coupon tax rose from £5,000 to £72,000, indicating that the after-tax cost of overseas bond allocations increased significantly. The fund may now hold more US or emerging market bonds with higher coupon withholding taxes. Meanwhile, "tax recoverable" moved from zero to £147,000, showing that some overseas taxes were successfully recovered during the year, reducing the net tax burden.
4. Distributions: Timing Pattern Changed, but Total Distribution Closely Matches Net Income
Total distributions of £11,638,000 were slightly above after-tax net income of £11,631,000, drawing down £7,000 of retained distributable income. Structurally:
| Distribution Stages (£'000) | 2025 | 2024 |
|---|---|---|
| Interim (to 30 June) | 6,891 | 2,966 |
| Final (to 31 December) | 4,890 | 7,006 |
| Net adjustment for share movements | -143 | +462 |
Interim distributions jumped 132% while final distributions fell 30%, indicating the fund realised more distributable income in the first half of 2025—possibly from selling higher-yielding assets or receiving special dividends. This shift in timing is important for income-dependent investors: for holders of B Income or C Income shares, 2025 cash flows were clearly front-loaded.
5. Working Capital: Cash Contracted Sharply, Receivables and Payables Both Expanded
| Working Capital Items (£'000) | 2025 | 2024 | Change |
|---|---|---|---|
| Total debtors | 12,696 | 10,493 | +21% |
| Cash and bank balances | 2,402 | 7,363 (pre-overdraft) | -67% |
| Total other creditors | 6,623 | 2,865 | +131% |
Cash balances fell from £5,199,000 to £2,402,000 (after deducting overdrafts). Over the period, "Sales awaiting settlement" rose from £490,000 to £973,000, while "Purchases awaiting settlement" increased from £1,278,000 to £3,649,000—the fund held significant unsettled trades at year end, with net payables up approximately £2.7 million. Another signal: "Collateral held by counterparties" declined modestly from £3,600,000 to £3,295,000, but "Collateral held on behalf of counterparty" surged from £665,000 to £1,965,000: the fund was required to post more collateral to counterparties, indicating higher margin requirements on derivative positions, likely due to increased mark-to-market volatility in swap or futures positions.
6. Related Party Transactions: Active Internal Rebalancing, High Yield Bonds as the Primary Channel
Related party fund trading volume expanded significantly in 2025:
| Fund | Purchase 2025 | Sale 2025 | Income 2025 | Purchase 2024 | Sale 2024 | Income 2024 |
|---|---|---|---|---|---|---|
| Baillie Gifford High Yield Bond Fund C Acc | 31,627 | 32,621 | 366 | 9,361 | 16,641 | 190 |
| Baillie Gifford Investment Grade Bond Fund C Acc | - | - | - | 10,900 | 11,233 | 166 |
| Baillie Gifford Emerging Markets Bond Fund C Acc | - | - | - | - | 23,978 | 203 |
| Scottish Mortgage Investment Trust | 831 | 3,386 | - | 794 | 6,863 | 9 |
Both purchases and sales of the High Yield Bond Fund approached £32 million, far exceeding other related party funds, making it the core vehicle for internal portfolio rebalancing. The Emerging Markets Bond Fund, which saw the largest sales in 2024, had no transactions at all in 2025, indicating the fund has essentially exited that business line. While transactions between internal funds do not directly generate excess fees, they add complexity to disclosures—investors should consider whether these trades are executed at fair NAV.
7. Share Movements: C Class Shares Significantly Shrunk, Institutional Capital Retreating
Share data reveals an important fact: C class accumulation shares fell from 284.7 million to 197.6 million, a net reduction of approximately 87.1 million shares; although B class and the new J/P classes saw some subscriptions, they were insufficient to offset C class redemptions.
| Share Class | Opening | Issued | Redeemed | Closing |
|---|---|---|---|---|
| B Accumulation | 15,451,245 | 40,288,994 | -21,418,132 | 34,322,107 |
| C Accumulation | 284,744,514 | 228,426,632 | -315,588,234 | 197,582,912 |
| J Accumulation | - | 976,757 | -25,858 | 950,899 |
| P Accumulation | - | 4,993,828 | -872,911 | 4,120,917 |
The C class is typically used by institutional or high net worth clients, and its large-scale redemptions are consistent with the 12.3% decline in net assets. Although new J class (possibly for a specific channel) and P class (possibly for retail platforms) capital entered, it was insufficient to offset C class outflows. This may be the real reason for the fund's shrinking size and declining management fee—not a strategy performance issue.
8. Valuation Hierarchy: Level 3 Assets Plunged, Portfolio Liquidity Notably Improved
| Valuation Hierarchy (£'000) | 2025 Assets | 2024 Assets | Change |
|---|---|---|---|
| Level 1: Quoted prices | 159,835 | 112,770 | +41.7% |
| Level 2: Observable market data | 95,527 | 134,240 | -28.8% |
| Level 3: Unobservable data | 4,259 | 18,099 | -76.5% |
Level 3 assets fell from £18.1 million to £4.26 million, a decline of 76.5%. This change is critical: it shows the fund significantly reduced assets relying on unobservable valuation inputs (such as private equity, illiquid bonds, or specialised derivatives) in 2025. Concurrently, Level 1 (direct market quoted) assets increased by £47 million, indicating a deliberate shift toward more liquid instruments. For a "Defensive Growth" fund, this adjustment reduces valuation risk and discount risk under redemption pressure.
9. Credit Ratings: Overall Fixed Income Exposure Narrowed, but Risk Appetite Shifted Upward Within
| Rating Group (£'000) | 2025 Market Value | % | 2024 Market Value | % |
|---|---|---|---|---|
| Investment Grade | 34,917 | 12.74% | 67,706 | 21.66% |
| High Yield | 40,655 | 14.83% | 17,869 | 5.72% |
| Unrated | 14,226 | 5.19% | 39,669 | 12.69% |
| Fixed Income Subtotal | 89,798 | 32.76% | 125,244 | 40.07% |
| Other (equities, etc.) | 184,339 | 67.24% | 187,295 | 59.93% |
The proportion of bonds and fixed income assets in total assets fell from 40% to 32.8%, but within that, the market value of high yield bonds more than doubled. Investment grade bond holdings were cut by roughly half (from £67.7 million to £34.9 million), and unrated assets also contracted significantly. This indicates that while deleveraging overall, the fund migrated its remaining fixed income positions toward higher-risk, higher-coupon instruments. This could be described as a "defensive income enhancement"—using less capital to pursue higher coupons, at the cost of increased credit risk.
10. Currency Exposure: Non-Sterling Diversification, but Sterling Dominance Strengthened
The currency exposure table shows that in 2025 the fund's non-monetary assets covered nearly 30 currencies, but total sterling exposure fell from £328.4 million to £261.4 million (after accounting for the decline in total assets, sterling's share actually rose from approximately 80% to 87%). Key changes:
- Euro exposure narrowed from -£23,419,000 to -£14,350,000, though it remains the largest negative exposure;
- Swedish krona fell sharply from +£9,608,000 to +£2,335,000;
- US dollar exposure edged up from +£10,872,000 to +£11,574,000;
- Swiss franc negative exposure widened from -£8,693,000 to -£14,582,000;
- Several new small currency exposures appeared: Chilean peso (+827), Egyptian pound (+1,246), Nigerian naira (+401), Paraguayan guarani (+373).
Currency exposure largely reflects the natural composition of underlying assets rather than active hedging. The significant decline in monetary assets/liabilities in 2025 suggests the fund reduced its use of foreign exchange hedging instruments (such as forwards or swaps), leaving it more exposed to currency fluctuations. Given the fund's expansion into high yield bonds in 2025, the increased emerging market currency exposure simultaneously amplifies both interest rate and currency risk.
11. Data Gaps and Observations in Note 15
The "Interest rate risk profile" section of Note 15 is truncated in the provided text, preventing a full comparison of the allocation between fixed rate and floating rate assets. However, based on the significant increase in swap interest expenses and the Level 1/Level 2 structural adjustments noted earlier, it can be inferred that the fund may be converting some fixed rate bonds to floating rate through interest rate swaps to reduce duration risk—consistent with the "Defensive Growth" mandate, i.e., controlling interest rate sensitivity within growth-oriented assets. It is recommended to consult the complete interest rate risk table to confirm whether net fixed rate exposure has been substantially reduced.
Overall Assessment
In fiscal year 2025, Baillie Gifford Defensive Growth Fund exhibited several clear operating characteristics:
1. Contracting asset base but resilient income — net assets fell 12.3% while total income grew 9.3%, indicating improved per-unit yield, with bond interest income playing a particularly prominent role.
2. Optimised fee structure — management charges fell substantially and the expense ratio improved markedly, but professional fees and bank charges rose, reflecting hidden increases in compliance and transaction costs.
3. Liquidity-driven strategic transition — the sharp decline in Level 3 assets, shrinking cash, and rising trading collateral indicate that while improving portfolio tradability, the fund also assumed higher derivative margin pressure.
4. Downgraded credit quality — high yield bond exposure rose from 5.7% to 14.8%, while investment grade and unrated assets contracted; the fund has effectively traded quality for yield within fixed income.
5. Institutional outflows offset by retail/channel inflows — C class shrinkage was partially offset by new J/P class subscriptions, but overall size still declined.
Collectively, these changes point to a strategic direction: within a defensive framework, using more granular asset selection (higher coupons, shorter duration, greater liquidity) to offset the income impact of declining scale. For fund holders, two areas warrant particular attention: the drawdown risk from expanded high yield bond exposure, and the potential cash flow drag from increased derivative collateral.
Interest Rate Risk Structure: Fixed Income Assets Overwhelmingly Dominant
From the currency-basis interest rate risk exposure, the Defensive Growth Fund's asset side is highly concentrated in fixed rate financial assets, reflecting its reliance on rate-locking strategies given its defensive positioning. Taking the three largest currencies as examples:
| Currency | Floating Rate Assets (£'000) | Fixed Rate Assets (£'000) | Non-Interest Bearing Assets (£'000) | Total (£'000) |
|---|---|---|---|---|
| UK sterling | 5,680 | 23,357 | 234,374 | 263,411 |
| US dollar | 4,259 | 43,372 | 53,088 | 100,719 |
| Euro | 3,302 | 43,173 | 26,237 | 46,474 |
Fixed rate assets as a share of total financial assets are approximately 89%, 43%, and 93% for sterling, US dollar, and euro assets respectively. Among sterling assets, non-interest bearing assets (primarily cash or money market instruments) reach £234 million. This suggests the fund locked in term yields ahead of the high-point reversal of the interest rate cycle in 2025, reducing reinvestment risk. Notably, however, the fixed rate proportion of US dollar assets is far lower than sterling and euro, indicating the dollar portfolio leans more toward floating/cash instruments—possibly reflecting a different view on short-term US rate direction.
Liability Side: Derivative-Related Non-Interest Bearing Liabilities Dominate
The interest rate structure on the liability side is clearer: the vast majority of liabilities are "financial liabilities not bearing interest." Sterling liabilities were only £1.965 million (floating rate), while US dollar liabilities reached £87.09 million, euro liabilities £59.37 million, and Swiss franc £15.48 million. These non-interest bearing liabilities consist primarily of negative fair values on derivative contracts, related to mark-to-market movements in forward foreign exchange contracts and interest rate swaps. In 2025, sterling liabilities plunged from £18.32 million in 2024 to £1.965 million, a decline of approximately 89%, indicating the fund significantly cut sterling-denominated derivative short positions or that the corresponding positions matured and were closed out.
Derivative Counterparty Risk Convergence
Derivative counterparty exposure data show that in 2025, positive exposure was concentrated at CitiGroup (£751,000) and JP Morgan Chase (£1.281 million), together accounting for the vast majority of total positive exposure; meanwhile, Deutsche Bank and Merrill Lynch showed negative exposure, meaning derivative market values were unfavourable to the fund. Compared with 2024, total positive exposure rose from approximately £620,000 to £1.37 million, primarily driven by the expansion of JP Morgan exposure. Derivative counterparty risk on futures has been reduced to zero through variation margin accounts, but collateral arrangements for OTC derivatives remain important: Goldman Sachs collateral rose from £1.32 million to £2.095 million, Barclays from £335,000 to £1.2 million, while Merrill Lynch fell from £1.455 million to zero—these changes are highly correlated with increases and decreases in negative market value derivatives.
Leverage: Actual Usage Very Low, Ample Headroom Remaining
The fund's leverage limits and actual usage disclosed under AIFMD are as follows:
| Metric | Gross method | Commitment method |
|---|---|---|
| Maximum limit | 1,000% | 500% |
| Actual leverage | 173% | 117% |
Actual leverage is far below the limits, and no breach occurred during the year. In particular, the commitment method at only 117% indicates that after accounting for netting arrangements and hedges, net risk exposure is very limited. This aligns with the Defensive Growth Fund's mandate—maintaining a certain level of market participation while strictly controlling loss magnitude.
Distribution Trends: Interim Sharply Up, Final Lower, Modest Full-Year Increase
The 2025 distribution data present a notable phenomenon: interim distributions grew significantly year-on-year, but final distributions declined year-on-year.
| Share Class | 2025 Interim (p) | 2024 Interim (p) | 2025 Final (p) | 2024 Final (p) | 2025 Full Year (p) | 2024 Full Year (p) |
|---|---|---|---|---|---|---|
| B Accumulation | 1.10 | 0.75 | 1.87 | 2.03 | 2.97 | 2.78 |
| C Accumulation | 1.30 | 0.85 | 2.09 | 2.35 | 3.39 | 3.20 |
| B Income | 1.00 | 0.75 | 1.78 | 1.91 | 2.78 | 2.66 |
| C Income | 1.20 | 0.85 | 1.94 | 2.21 | 3.14 | 3.06 |
The strong rise in interim distributions may be related to interest rates still being at elevated levels in the first half of the year, with coupon income concentrated in January–June; the decline in final distributions may reflect the impact of falling reinvestment rates. On a full-year basis, all major share classes still recorded distribution growth of approximately 7% year-on-year, with no deterioration on the income side.
Group 2 share equalisation data also merits interpretation. Taking the C Accumulation final distribution as an example, the Group 2 distribution of 0.64915 pence is net income and 1.44085 pence is capital repayment (equalisation), meaning that holders of this class held for less than a full distribution period, with a relatively high capital adjustment component. This reflects sustained net subscriptions in the second half of 2025, particularly in B/C Accumulation shares.
New Share Class Placement
J and P class shares had no distribution record in 2024 and began generating distributions in 2025. J Accumulation's year-end distribution was 1.74 pence and P Accumulation also 1.74 pence, with Group 2 shares comprising a notable portion. This indicates that during 2024 the fund added share classes aimed at a broader investor base (possibly institutional or platform channels), and 2025 was their first full distribution year—a signal of the fund's effort to broaden its distribution reach.
From Defensive to Diversified: The Fund Series Continuum
The content subsequently introduces the Diversified Growth Fund—another sub-fund under the same ICVC umbrella. The objectives of the two funds form a contrast: the Diversified Growth Fund seeks to outperform the UK base rate by 3.5% annualised (rolling five-year), achieve positive returns (rolling three-year), and maintain volatility below 10%; the Defensive Growth Fund, by contrast, places greater emphasis on capital preservation. The Diversified Growth Fund's explicit statement that it "aims to limit losses in any short term period to a lower level than equities" indicates that while more aggressive than the Defensive fund, it remains constrained by drawdown control. This product sequence illustrates the two funds' positioning differences on the risk spectrum and also suggests the depth of the same ACD's product offering across different risk preference dimensions.
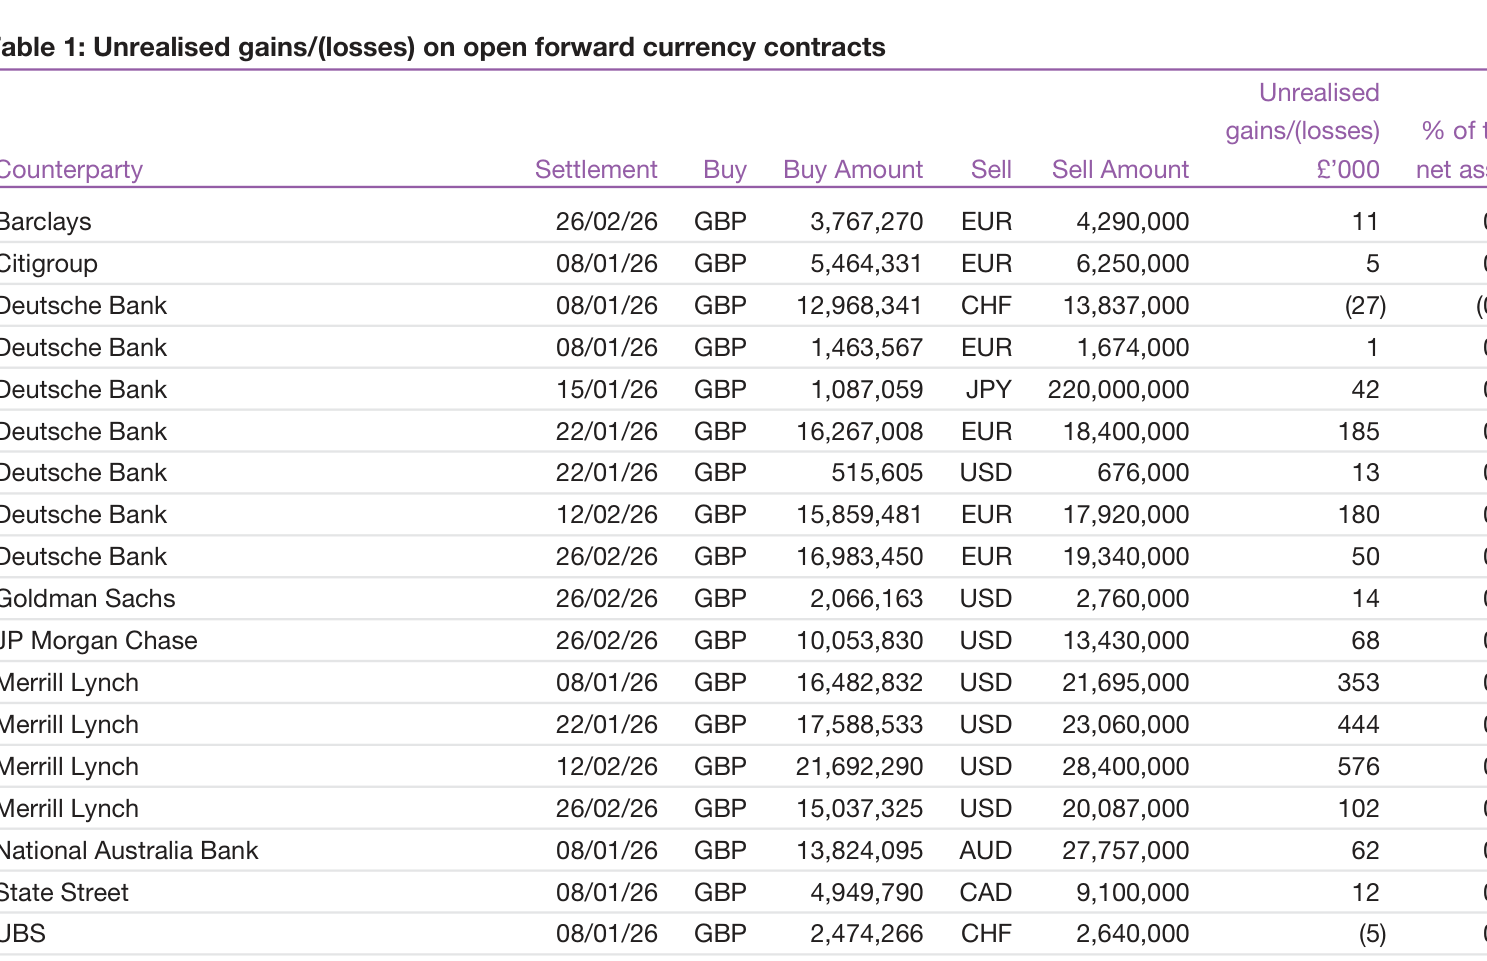
Major Governance Adjustment: Management Team Change and Fund Merger Plan—A Potential Signal of Product Repositioning
In November 2025, fund management responsibility was transferred to the Monthly Income Portfolio Construction Group, with a planned merger into Baillie Gifford Monthly Income Fund (subject to FCA and shareholder approval). This is the most structurally impactful piece of information in this report. It should be noted that this change is not a simple internal personnel adjustment—it may herald a deeper transformation of the fund's product positioning.
First, the new management team's core identity is "Monthly Income," whereas this fund's investment objective is "growth" (Diversified Growth), targeting UK Base Rate + 3.5%, with no emphasis on distribution. The takeover of a growth fund by an income team suggests, at minimum, that the ACD was not satisfied with the original management model's performance and hopes to reshape the portfolio's cash flow and volatility characteristics through an income strategy framework. Second, if the merger is completed, the fund's independent existence will come to an end, and investors will in effect face an entirely new product form rather than the original "Diversified Growth" strategy. The report's wording—"objectives and core investment framework remain unchanged"—is standard compliance reassurance, but given the actual direction of asset allocation adjustments, the real meaning of this "unchanged" claim warrants scrutiny.
The change also carries a short-term but tangible cost: the report explicitly acknowledges that the management transition "resulted in marginally higher portfolio turnover late in the year." The Material Portfolio Changes table shows that the top ten purchases and top ten sales together involve approximately £330 million, with the same fund (Baillie Gifford High Yield Bond Fund C Acc) simultaneously topping both the purchase list (£50.9 million bought) and the sale list (£53.5 million sold). This is not simple rebalancing—it is clear evidence of rebuilding positions or a strategy switch. For a Baillie Gifford product historically characterised by low turnover and long-term holding, such large-scale two-way trading in the same asset reflects the new management team reshaping the portfolio according to its own framework, with the resulting transaction costs ultimately borne by holders.
Long-Term Performance vs Target Deviation: A Quantitative Examination of 2.3% Five-Year Annualised vs 6.6% Target
The most striking data point in the report is the five-year annualised return of only 2.3%, a gap of 4.3 percentage points versus the 6.6% target return. Combining the annual breakdown provides a clearer picture of how this deviation was formed:
| Period | Fund Return (B2 Class, %) | Comparator (UK Base Rate +3.5%, %) | Excess Return (pp) |
|---|---|---|---|
| 2021 | 10.7 | ~4.5¹ | +6.2 |
| 2022 | -16.1 | ~5.5¹ | -21.6 |
| 2023 | ~3.6-5.0 | ~8.2¹ | -3.2 to -4.6 |
| 2024 | ~8.2-8.7 | ~7.8¹ | +0.4 to +0.9 |
| 2025 | 10.7 | 7.8 | +2.9 |
¹ Approximate estimates based on chart data.
The data reveal a clear pattern: the vast majority of the five-year cumulative target shortfall was caused by the single year 2022's -16.1%, which alone consumed approximately 21.6 percentage points of relative return. Although the subsequent three years recorded consecutive positive returns, the base effect meant the portfolio could never close the gap. This also explains why despite achieving a 10.7% absolute return in 2025—actually a good year—the fund still could not approach its five-year target. Mathematically, to bring the five-year rolling annualised return back to approximately 6.6% within the next three years, the portfolio would need to deliver roughly 10-12%+ annualised returns over consecutive years; given the current constraints of elevated equity valuations, geopolitical uncertainty, and recurring inflation, this catch-up is highly challenging.
Another data point worth attention: the three-year annualised return of 6.9%. This means that on a 2023-2025 window basis, the fund's performance is respectable and close to the implied medium-term path of its five-year target. On volatility, the five-year annualised figure of 7.2% is below the 10% target ceiling, indicating the fund met its risk control objective—but the "growth" dimension of the target fared considerably worse. This creates a significant asymmetry within the target framework: the risk objective effectively constrained volatility, while the return objective persistently missed. This provides a direct rationale for the management team change.
Asset Allocation Restructuring: Commodities Nearly Halved, Emerging Market Bonds Doubled
Comparing the Portfolio Statement positions at end-2024 and end-2025, the most significant allocation changes are concentrated in two asset categories:
| Asset Class | End-2024 Weight (%) | End-2025 Weight (%) | Direction of Change |
|---|---|---|---|
| Commodities (incl. related equities) | 6.88 | 3.53 | Significant reduction |
| Emerging market bonds | 8.29 | 18.23 | More than doubled |
The near-halving of commodity positions follows a discernible logic: Lynas Corporation and MP Materials, two rare earth-related stocks, were retained (together approximately 2.43%), but other commodity exposure was sharply compressed. Given that the sales record includes WisdomTree Copper ETC (appearing among the top ten sales at approximately £19.87 million) and the SparkChange Physical Carbon ETC position reduced to 1.10%, it is clear the fund is exiting cyclical, policy-dependent commodity tracks and rotating toward emerging market bonds with more certain coupon income.
Emerging market bonds rising from 8.29% to 18.23% is the most aggressive allocation move in this period. Looking at the holding structure, the newly allocated bonds exhibit a clear "high coupon + long duration" profile: Angola 8.25% 2028, Bahamas 8.25% 2036, Benin 8.375% 2041, Barbados 8% 2035—all high yield sovereign issues. The common feature of these assets is extremely high coupon rates (generally above 8%), contributing meaningfully to portfolio income—consistent with the new management team's income-oriented strategy. However, the implied credit risk and liquidity risk should not be underestimated. The report notably singles out China market risk in its risk warnings but does not separately highlight the concentration issue in high-risk sovereign bonds—yet a substantial portion of the 18.23% position is concentrated in low-rated sovereign issuers, and the loss elasticity of this exposure under stress scenarios (such as emerging market capital outflows or sovereign debt restructuring) would be far greater than that of utilities or investment grade credit.
Portfolio Holding Observations: The Coexistence of Utilities Cluster and High-Yield Assets
The top ten holdings reveal two parallel logics in the current portfolio:
Defensive income cluster (combined ~6.0%): Terna (1.52%), Severn Trent (1.50%), United Utilities (1.48%), RWE (1.49%)—all four are European regulated utilities or new energy transition leaders, sharing stable cash flows, regulated returns, or renewable subsidy support. These are typical domestic-demand defensive names with relatively limited exposure to global economic cycles.
Offensive alternative income cluster (combined ~7.6%): Baillie Gifford Worldwide China A Shares Growth (2.28%), Sequoia Economic Infrastructure Income Fund (2.27%), Galene Fund (2.01%), Dimensional Global Value Fund (1.57%), Lynas Corporation (1.46%)—covering China A-shares, infrastructure lending, multi-strategy hedge funds, global value equities, and rare earth materials. The risk profiles of this cluster vary enormously, but they share a common purpose: delivering excess returns for the portfolio.
This barbell structure of "utilities as foundation + high-volatility assets for offense" does indeed differ from the fund's historical style of favouring growth stocks and long-term structural themes. The report's statement that "growth equities - an area the Fund has a particular leaning towards - lagged broader markets" is essentially an admission that the fund's original core strategy (growth stock preference) underperformed in 2025. The new allocation direction clearly seeks to reduce reliance on growth style and pursue more diversified income sources instead.
Risk Management Dimensions: Volatility Compliance vs Tail Risk Events
The fund's five-year annualised volatility of 7.2% is comfortably below the 10% target ceiling—a solid achievement. But volatility metrics do not fully capture risk. Two events during the period illustrate this:
Tail risk exposure in insurance-linked securities (ILS). The report explicitly states that ILS detracted from portfolio returns due to the single event of Hurricane Melissa. This reveals the essential nature of the ILS strategy: it provides stable but modest coupon income in most years, but very low-probability natural catastrophe events can cause significant capital losses. Unlike high yield bonds, ILS tail events are difficult to avoid through traditional credit analysis or diversification—a single hurricane can breach the portfolio's aggregate reinsurance attachment point. After this drag, the management team withdrew capital from the strategy (the sales list includes Leadenhall UCITS ILS Fund at approximately £49.84 million, the second-largest sale), which can be understood as the new team having lower tolerance for such "convexity risk."
Passive reduction of currency hedging and derivative positions. The report mentions reducing "active interest rate and currency positions," meaning discretionary directional bets in currencies and rates were substantially compressed. From a risk budget perspective, this reduces forecast error and model risk, but it also forfeits part of the potential hedging gains. Embedding complex macro strategies in a fund charging only 0.55% management fee was historically one of its differentiators; under the new framework, such strategies give way to more conventional, more predictable asset allocation logic.
Structural and Institutional Costs: Higher Turnover and the Near-Term Price of Management Transition
With the management handover occurring in Q4 and the merger plan advancing, the fund faces three categories of near-term costs:
Explicit transaction costs: As discussed above, large-scale two-way trading generates actual bid-ask spreads, market impact costs, and possible taxes. These costs are deducted directly from fund assets. Although not separately disclosed, based on the approximately £330 million in two-way trading volume, even under conservative cost assumptions the drag on full-year NAV should be measured in tens of basis points.
Potential changes in tax efficiency: The investment report does not discuss the tax impact of position adjustments. But from the statement that "charges are taken from income; if insufficient, the rest will be taken from capital," if the newly added emerging market bonds (high coupon) generate substantial taxable income while coupons are insufficient to cover expenses, the fund would be forced to use capital to pay fees. Under the current structure of rising income share, investors should monitor the rate of capital NAV erosion.
Uncertainty discount: The fund merger requires FCA and shareholder approval, and both the outcome and timing are uncertain. For institutional investors, uncertainty about the fund's continued form is itself a risk—it may trigger potential redemption or suspension of subscription decisions, which in turn has feedback effects on fund size and the continuity of investment operations.
Concluding Observations: A Transition-Period Specimen of "Objectives Unchanged, Strategy Already Changed"
Comparing this annual report with the fund's objective framework, the most notable point is not the performance data per se, but the tension between objectives and execution: the five-year target annualised return of 6.6% versus actual 2.3% represents a significant gap; but volatility of 7.2% versus the 10% ceiling meets the constraint. In other words, the "risk constraint" dimension of the objectives was strictly adhered to, while the "return delivery" dimension was not achieved. The management team change and merger plan are, in essence, an institutional response to this imbalance.
For investors, until the merger is approved, the fund is in a transition period of strategic reshaping: the new team has begun restructuring the portfolio along income-oriented lines (utilities, emerging market high-yield debt, corporate credit), but assets under the old framework (growth equities, ILS, commodities) are still being gradually phased out. This means the fund's actual risk-return characteristics in the near term will be shaped by two logics simultaneously, making forecasting more difficult. Before the FCA approval and shareholder vote outcome are known, the primary source of uncertainty has shifted from the market to product governance.
Portfolio Size Anchor: ~£920m
Although this section of the report is primarily a holdings list, the total portfolio NAV can be cross-validated through three independent holdings:
| Holding | Weight | Market Value (£'000) | Implied Total NAV (£m) |
|---|---|---|---|
| Sequoia Economic Infrastructure Income Fund | 2.27% | 20,896 | 920.5 |
| Terna | 1.52% | 14,007 | 921.5 |
| BG Worldwide China A Shares Growth | 2.28% | 20,976 | 920.0 |
The three anchors are highly consistent, placing total net assets at approximately £920 million. This size provides a baseline for estimating absolute fund flows by sector.
The "Restructuring and Recovery" Chain in Sovereign Bonds
Among the visible sovereign bond holdings, a group of countries fits the typical "defaulted—restructured—repriced" path: Ukraine, Sri Lanka, Ecuador, Zambia, plus Egypt, which has not defaulted but remains under sustained pressure. These dollar bonds generally trade below par; with GBP/USD≈1.30, the approximate clean prices are:
| Issuer | Coupon | Maturity | Face Value (USD m) | Market Value (£m) | Implied Clean Price* |
|---|---|---|---|---|---|
| Ukraine | 1.75% | 2034 | 4.64 | 2.105 | ≈59 |
| Zambia | 5.75% | 2033 | 2.30 | 1.189 | ≈67 |
| Sri Lanka | 3.35% | 2033 | 3.99 | 2.548 | ≈83 |
| Ecuador | 3.5% | 2035 | 4.27 | 2.798 | ≈85 |
| Egypt | 8.5% | 2047 | 3.10 | 2.266 | ≈95 |
*USD price converted at GBP/USD≈1.30, for order-of-magnitude reference only.
Ukraine's 1.75% deep discount is particularly notable—its coupon is far below market rates, with returns relying primarily on price recovery and the contingent coupon mechanism. This "recovery chain" totals approximately £11m (~1.2% of NAV). The share is small, but it shows the portfolio retains a modest distressed-debt allocation within sovereign bonds, resembling private credit dynamics rather than being limited to traditional emerging market index constituents.
Rebalancing Path After ILS Liquidation
The comparative figures in brackets reveal the largest structural adjustment of the period: Insurance Linked fell from 10.25% to 0.78%, while Listed Equities, Investment Grade Bonds, and High Yield Credit rose. Estimated fund flows on the £920m base:
| Sector | Reporting Period Weight | Comparative Period Weight | Change (pp) | Estimated Capital Flow (£m) |
|---|---|---|---|---|
| Insurance Linked | 0.78% | 10.25% | -9.47 | -87 |
| Listed Equities | 25.08% | 19.57% | +5.51 | +51 |
| Investment Grade Bonds | 2.91% | 0.00% | +2.91 | +27 |
| High Yield Credit | 6.13% | 4.28% | +1.85 | +17 |
| Infrastructure | 23.43% | 25.90% | -2.47 | -23 |
The approximately £87m released from ILS was largely absorbed by equities and bonds. Notably, Vitality Re XIV/XV (issued 2023/2024) remains in the portfolio, while the newly issued Black Kite Re 2025 and Integrity Re 2025 positions are minimal—indicating the fund has not wholly rejected the ILS strategy but has downgraded it from a core allocation to a marginal auxiliary role.
Internal Structure of the Infrastructure Sector
Infrastructure remains one of the portfolio's core pillars. Classifying all 28 holdings by commercial characteristics:
| Sub-sector | Estimated Weight | Representative Holdings |
|---|---|---|
| Regulated utilities | ≈12.9% | Terna 1.52, Severn Trent 1.50, United Utilities 1.48, Redeia 1.10, NextEra 0.88 |
| Integrated energy & renewables | ≈5.8% | RWE 1.49, Greencoat UK Wind 1.06, EDP Renovaveis 0.97, Brookfield Renewable 0.94 |
| Electrification & digital infrastructure | ≈2.6% | Prysmian 0.94, Cellnex 0.78, NKT 0.48, Nexans 0.40 |
| Transport & other | ≈2.2% | Getlink 0.99, 3i Infrastructure 1.16 |
Regulated utilities account for over half of the sector, consistent with the "stable cash flow, inflation pass-through, low volatility" positioning; but cable/electrical equipment manufacturers such as Prysmian, Nexans, and NKT carry stronger grid-upgrade and AI data centre construction themes. This structure means Infrastructure is neither a pure defensive bond substitute nor without some pro-cyclical growth optionality.
The "Vehicle-Based" Strategy Within Listed Equities
Approximately 7% of NAV in Listed Equities is achieved through fund vehicles rather than direct shareholdings:
| Vehicle | Weight | Type |
|---|---|---|
| BG Worldwide China A Shares Growth | 2.28% | In-house active fund |
| Sequoia Economic Infrastructure Income Fund | 2.27% | Closed-end infrastructure lending fund* |
| Dimensional Global Value Fund | 1.57% | Third-party multi-factor fund |
| BG Global Income Growth Fund | 1.39% | In-house active fund |
| Tetragon Financial Group | 0.99% | Listed alternative investment company |
| Ashoka India Equity Investment Trust | 0.76% | India small/mid-cap investment trust |
*Classified under High Yield Credit.
This approach has several practical implications: first, it provides access to less liquid market segments (such as China A-shares, India small/mid-caps) through specialist vehicles; second, it supplements internal research coverage gaps with external managers; and third, it improves tradability while preserving asset class attributes.
From direct holdings, China-related exposure is approximately 3.4% (BG China A + Meituan 0.32 + PDD 0.28 + CATL 0.30 + NetEase 0.07 + Midea 0.08 + ANTA 0.05), Latin America 1.0% (MercadoLibre 0.59 + Nu Holdings 0.41), and India approximately 1.1% (Ashoka 0.76 + Prudential 0.36). Emerging market equities total around 5.5%, echoing the diversification logic in sovereign bond holdings, but with a greater tilt toward tech platforms and consumption growth on the equity side.
Summary
This section of the report conveys several signals: the portfolio is visibly "equitising," while adding IG bonds to dampen volatility; the ILS exit was the most dramatic portfolio decision of 2025; although Infrastructure's weight declined, its internal structure maintains a defensiveness-plus-growth balance; and the sovereign bond sleeve retains a modest distressed-debt recovery option. Overall, the portfolio maintains roughly 90% risk assets, managing risk through intra-asset-class structural adjustments rather than strategic de-risking.
VI. Structural Shift in Asset Allocation: From "FOF Model" to "Core Direct Investment"
The asset class breakdown disclosed this period reveals the most notable strategic shift of 2025: Collective Investment Schemes fell sharply from 33.54% to 16.55%, while Bonds rose substantially from 14.26% to 25.78%, and Equities also increased from 42.11% to 50.74%.
| Asset Class | 2025 Market Value (£'000) | 2025 Weight | 2024 Market Value (£'000) | 2024 Weight | Change |
|---|---|---|---|---|---|
| Bonds | 237,445 | 25.78% | 151,322 | 14.26% | +11.52pp |
| Equities | 467,317 | 50.74% | 446,677 | 42.11% | +8.63pp |
| Collective Investment Schemes | 15,377 | 16.55% | 355,743 | 33.54% | -16.99pp |
| Derivatives | (4,953) | (0.54%) | (10,279) | (0.97%) | +0.43pp |
| Portfolio of investments | 852,186 | 92.53% | 943,464 | 88.94% | — |
The substance of this change is a fundamental adjustment in the fund's operating model—from building the portfolio through external funds/ETFs to holding directly owned stocks and bonds as the core. CIS assets shrank in absolute terms from £356 million to £154 million (-56.8%), while over the same period bond absolutes grew 57%, and equity absolutes edged up 4.6%. Given that the fund's net assets fell from approximately £1.06 billion to £921 million over the period (overall contraction), the rising shares of bonds and equities were not purely market-driven but are largely the result of active rebalancing.
The underlying logic of this "disintermediation" strategy operates on at least three levels:
1. Cost efficiency: Directly holding bonds and equities avoids double-charging of sub-fund management and custody fees, echoing the C class operating charges falling to 0.06% over the same period;
2. Control: In a phase sensitive to interest rate and credit cycles, direct asset ownership allows the fund manager to precisely control duration, credit quality, and sector exposure;
3. Liquidity management: CIS redemption terms may restrict flexibility in certain market conditions, whereas directly held listed securities and bonds are easier to liquidate in an emergency.
VII. The Deeper Logic Behind the Doubling of Bond Allocation: Forward-Looking Yield Locking
Bonds increased from £151 million to £237 million, with the weight jumping 11.52 percentage points—the largest single adjustment in the entire portfolio restructuring. The timing of this move is telling—2025 saw major global economies at the tail end of tightening cycles or the beginning of easing cycles. Significantly increasing bond holdings in this window can achieve three objectives simultaneously:
- Yield locking: Locking in coupon income while nominal rates remain relatively elevated, providing a stable cash flow base for the portfolio;
- Duration hedging: Increased bond holdings partially hedge equity downside risk in an economic slowdown scenario;
- Capital reservoir: In a high-valuation equity environment, temporarily parking a portion of CIS redemption proceeds in bonds while waiting for better equity entry points.
Although the report does not disclose the bond maturity structure, £237 million is equivalent to 25.78% of total assets—a clearly defensive tilt for a "Diversified Growth" strategy, suggesting the fund manager holds a cautious view on risk asset return expectations for 2026.
VIII. Significant Increase in Property Allocation: A Bet on Structural Opportunities
The Property sector rose from 6.44% to 10.97%, the second-largest increase among the 12 industry classifications after bonds. Notably, this is not a simple index-tracking increase but a highly selective deployment:
| New/Notably Increased Holdings | Shares Held | Market Value (£'000) | Weight | Characteristics |
|---|---|---|---|---|
| Primary Health Properties REIT | 10,495,173 | 10,269 | 1.11% | UK healthcare properties |
| Ctp N.V. | 629,215 | 9,724 | 1.06% | European logistics properties |
| Equinix | 16,294 | 9,275 | 1.01% | Data centre REIT |
| Montea NV | 90,670 | 5,756 | 0.62% | Belgian logistics properties |
| Warehouses De Pauw | 296,908 | 5,719 | 0.62% | European logistics properties |
Among the five largest real estate holdings, logistics (Ctp, Montea, Warehouses De Pauw) and data centres (Equinix) together account for approximately 40% of the entire sector, while traditional office and retail real estate is almost entirely absent. This holding structure is highly consistent with the following macro judgments:
- Rising e-commerce penetration supports logistics property rental growth;
- AI computing power demand is driving long-term structural demand for data centre REITs;
- Healthcare properties (Primary Health Properties) offer counter-cyclical attributes, and the stability of cash flows under the UK NHS lease model is extremely high.
Real estate accounted for only 6.44% in 2024; in 2025 it nearly doubled, concentrated in the above niche segments—indicating the fund manager believes physical asset pricing has already fully discounted pessimistic interest rate expectations, while the real demand growth in logistics and data centres is not yet fully reflected in valuations.
IX. CDS Portfolio: Low-Cost Tail Protection in Exchange for Credit Income Headroom
The credit default swap portfolio shown in Table 2 provides important risk management clues. All three major index CDS are positioned as "buy protection":
| Contract | Notional | Maturity | Market Value (£'000) | % of Net Assets |
|---|---|---|---|---|
| CDX.NA.HY.43 | US$54.5M | 20/12/2029 | (3,105) | (0.34%) |
| iTraxx Europe Crossover S43 | €46.6M | 20/06/2030 | (4,481) | (0.48%) |
| CDX.NA.HY.44 | US$58.7M | 20/06/2030 | (3,489) | (0.38%) |
| Total | ~US$160M+ | — | (11,075) | (1.20%) |
Net notional exposure exceeds US$160 million, while the market value is only -1.2%, implying the market currently prices high yield default risk very cheaply and CDS premiums are relatively low. The logic is: at historically tight credit spreads, purchasing index-level tail protection at a relatively modest cost (-1.2%) allows the portfolio to continue holding high yield credit assets (such as the 25.78% bond allocation) without fearing a concentrated default event.
Additionally, the fund holds a single-name CDS on Ardagh Packaging Finance, indicating the fund manager holds differentiated concerns about credit fundamentals in specific industries (such as packaging and consumer goods).
X. Share Class Economics: Institutional C Class Dominance and Extreme Fee Tier Differentiation
The Comparative Tables reveal a significant divergence in the fund's share structure:
| Share Class | 2025 NAV (£'000) | % of Net Assets | Operating Charges | 2025 Return | 3-Year Cumulative Return |
|---|---|---|---|---|---|
| C Accumulation | 804,872 | 87.4% | 0.06% | 11.26% | 23.35%¹ |
| B Accumulation | 112,303 | 12.2% | 0.61% | 10.65% | 22.00%² |
| B Income | 3,769 | 0.4% | 0.61% | 10.62% | 21.22%³ |
| P Accumulation | — | — | — | — | — |
¹ Calculation: 11.26% + 6.23% + 5.30%, non-compounded; ² 10.65% + 5.46% + 4.72%; ³ 10.62% + 5.39% + 4.71%
C class shares (institutional) dominate with 87.4% of net assets, and their operating charge of only 0.06% is 55 basis points lower than B class's 0.61%. Even accounting for C class's larger NAV base, the three-year compounding gap is substantial:
- B class three-year annualised return: approximately 6.9%
- C class three-year annualised return: approximately 7.7%
- Annual gap of approximately 80 basis points, of which roughly 55 basis points derives directly from the fee differential
The P class was newly established in 2025 with operating charges of 0.80% (based on NAV of 253.07, fees approximately 0.32%? The table actually shows (0.80); note this is preliminary data). The fee lies between B and C, likely a new class for a specific channel.
The extreme fee tiering reveals changes in the UK retail fund distribution landscape: increasing capital is held through institutional platforms (such as pension schemes, wealth managers) in low-cost classes, while directly retailed B class shares continue to shrink.
XI. Fund Size Changes and Capital Flow Pressure
Net asset data shows a clear contraction trend:
| Year | Total Net Assets ~(£'000) | YoY Change |
|---|---|---|
| End-2023 | ~2,283,000 | — |
| End-2024 | ~1,061,000 | -53.5% |
| End-2025 | 920,946 | -13.2% |
The large contraction in 2024 was partly due to market volatility, but in 2025, despite positive returns of 10.65%-11.26%, net assets still declined from approximately £1.061 billion to £921 million, indicating net redemptions of roughly £140 million for the year. This outflow is consistent with the overall redemption environment global growth equity funds faced in 2022-2024, but 2025's return to positive performance has not fully restored investor confidence.
Notably, the B class contraction was particularly severe—B Accumulation fell from £153 million in 2024 to £112 million in 2025 (-26.8%), while C class fell only from £880 million to £805 million (-8.5%). This further validates the structural migration of capital toward lower-cost classes.
XII. Summary: A Year-End Portfolio of "Active Defense, Structural Offense"
Synthesising the above analysis, the end-2025 portfolio exhibits the following core characteristics:
1. Bonds as the new ballast: The 25.78% bond allocation provides an income base and defensive depth the portfolio has lacked over the past three years;
2. Equity side focused on high-quality growth: Among the top ten holdings, TSMC, Wolters Kluwer, Watsco and others combine earnings resilience with structural growth logic;
3. Real estate as a rate-sensitive offensive vehicle: Logistics and data centre REITs are among the portfolio's few physical assets highly sensitive to an easing cycle;
4. CDS as a hidden hedge layer: At a portfolio cost of -1.2%, credit protection covering approximately US$160 million of notional exposure has been constructed;
5. Continued fee structure optimisation: The C class's 0.06% operating charge places it at a highly competitive level among comparable multi-asset growth funds.
This portfolio presents a clear fund manager stance: not abandoning growth exposure amid macro uncertainty, but through bond increases, CDS protection, and selective physical asset deployment, compressing the portfolio's overall volatility risk below that of a single long-only equity strategy. With a possible easing cycle beginning in 2026, the relative advantage of this structure may become more apparent.
The financial statements for the year ended 31 December 2025 further validate the previously observed coexistence of scale contraction and performance highlights, but the notes to the accounts also reveal four deeper signals not previously unpacked: a qualitative shift in income structure, the fee elasticity paradox, the "disintermediation" path of asset allocation, and the "paper profit" characteristics of earnings sources.
I. The Rhythm of Net Asset Shrinkage: The Redemption Peak Has Passed, but Outflows Have Not Stopped
The balance sheet and statement of changes in net assets show that the fund continued to shrink in 2025, but the pace of outflows has slowed significantly:
| Metric | 2025 | 2024 | Change |
|---|---|---|---|
| Opening net assets (£'000) | 1,060,763 | 2,291,979 | -53.7% |
| Closing net assets (£'000) | 920,946 | 1,060,763 | -13.2% |
| Net redemptions (£'000) | (235,491) | (1,306,331) | -82.0% |
| Net redemptions as % of opening NAV | -22.2% | -57.0% | +34.8pct |
2024 was the redemption peak—net outflows of £1.306 billion in a single year, equivalent to 57% of opening net assets; in 2025, net redemptions fell to £235 million, but still exceeded the full-year retained earnings (£65.3 million). Cumulative net redemptions over two years reached approximately £1.542 billion, representing 67.3% of opening net assets at the beginning of 2024. The fund is effectively "using performance-generated returns to fight capital attrition": total 2025 returns were £96.1 million, yet net assets still declined by £13.98 million, with the entire shortfall coming from continuous redemption payments.
One noteworthy detail: redemptions-related distribution deductions in 2025 (£2.739 million) were only 23% of the 2024 figure (£11.96 million), while issuance-related distribution adjustments rose from £634,000 to £1.011 million. This indicates early signs of recovery on the subscription side, but the absolute scale (£91.5 million) remains far from sufficient to offset redemptions.
II. Qualitative Shift in Income Structure: From Dividend-Driven to Interest-Driven
The income breakdown in Note 3 reveals a deeper change—total income fell 39.4%, but its internal composition underwent a fundamental shift:
| Income Source (£'000) | 2025 | 2024 | Change | % of Total Income (2025) |
|---|---|---|---|---|
| Interest on debt securities | 21,098 | 30,054 | -29.8% | 65.1% |
| Overseas dividends | 11,311 | 16,249 | -30.4% | 34.9% |
| UK dividends | 3,262 | 6,899 | -52.7% | 10.1% |
| Property income distributions | 992 | 2,098 | -52.7% | 3.1% |
| Swaps interest | (4,988) | (3,082) | +61.8% (expense expansion) | -15.4% |
| Management fee rebates | 127 | 614 | -79.3% | 0.4% |
Interest on debt securities rose from 56.2% of total income in 2024 to 65.1%, while combined dividend-type income moved from 47.3% to 48.1% (the proportion itself changed little, but absolute values nearly halved). Even more notable is the 62% expansion of swaps interest expense to £4.99 million, which directly erodes net income—before this expense, gross interest income was £21.71 million, leaving net interest contribution of only £16.11 million.
The "interestification" of income aligns with the portfolio's tilt toward bonds (see below). But it also means the fund's sensitivity to interest rate direction has increased: in 2025, debt security interest fell 29.8%; beyond scale factors, this may also reflect declining holding-period yields or duration structure adjustments.
III. Earnings Structure: Unrealised Gains Dominant, Derivative Contribution Collapsed
The capital gains breakdown in Note 1 is critical—the 2025 investment return was heavily dependent on year-end valuation increases, rather than realised trading gains or hedging strategies:
| Capital Gains Category (£'000) | 2025 Realised | 2025 Unrealised | 2025 Total | 2024 Total |
|---|---|---|---|---|
| Non-derivative securities | 3,863 | 45,728 | 49,590 | 1,047 |
| Derivative contracts | 672 | - | 672 | 11,347 |
| Forward currency contracts | 10,127 | 6,122 | 16,249 | 17,954 |
| Currency gains/losses | (1,176) | 1 | (1,175) | 2,340 |
| Custody transaction costs | (24) | - | (24) | (45) |
| Total | 13,462 | 51,851 | 65,312 | 32,643 |
Three signals merit expansion:
First, unrealised gains account for 79.4% of the total (51,851/65,312), whereas in 2024 this ratio was negative (unrealised approximately -£4.71 million). The 2025 profit is built primarily on the rise in year-end portfolio market values; if the market corrects after year-end, a portion of these gains could be given back.
Second, derivative contract contributions collapsed from £11.35 million to £670,000. In 2024, derivatives contributed 34.8% of total capital gains; in 2025, only 1.0%. Combined with the expansion of swaps interest expense, it can be inferred that the fund significantly compressed derivative hedging positions in 2025, or that lower market volatility narrowed the profit space for hedging strategies.
Third, the earnings structure of forward currency contracts shifted from "strongly realised" to "strongly unrealised." In 2024, forward contracts had realised gains of £36.02 million and unrealised losses of £18.07 million; in 2025, realised gains were £10.13 million and unrealised gains £6.12 million. This shift may indicate that many FX hedging contracts were closed and realised during 2024, while more contracts remained open in 2025.
IV. Fee Elasticity Paradox: Management Charge Plunged but Fixed Costs Remain Rigid
The expense structure in Note 4 presents an interesting "elasticity paradox"—the management charge fell sharply, but fixed costs barely moved:
| Expense Item (£'000) | 2025 | 2024 | Change |
|---|---|---|---|
| Annual management charge | 764 | 2,018 | -62.1% |
| Depositary fee | 69 | 113 | -38.9% |
| Bank charges | 114 | 114 | 0.0% |
| Audit fee | 19 | 19 | 0.0% |
| Professional fees | 22 | 21 | +4.8% |
| Third-party processing costs | 4 | 3 | +33.3% |
Average net assets in 2025 were approximately £991 million ((1,060,763+920,946)/2); the annual management charge of £764,000 corresponds to an effective fee rate of only 0.077%, far below the 0.51% operating charges disclosed earlier in the annual report. This wide gap confirms the "two-tier structure" of fund-level fees versus underlying asset fees—the AMC paid directly by the fund is very low, but through investments in Baillie Gifford sub-funds or other CIS, the total fees actually borne by investors (including sub-fund management fees) are considerably higher.
The management charge decline (-62.1%) far exceeds the net asset decline (-13.2%). This is not a simple scale effect—it is more likely an active reduction in the fee tier by the ACD, or a change in the fund's asset structure (such as migration from higher-fee classes to lower-fee classes). But the rigidity of fixed costs is equally clear: bank charges, audit fees, and professional fees total approximately £155,000, representing 15.6% of 2025 total expenses, versus only 6.8% in 2024. As asset size continues to contract, fixed costs will become an increasingly larger drag on NAV.
V. Trading Behaviour: 2024 "Panic Selling" vs 2025 "Active Rebalancing"
The purchase and sale data in Note 2 reveal two fundamentally different trading logics across the two years:
| Trading Data (£'000) | 2025 | 2024 |
|---|---|---|
| Total purchases (incl. costs) | 744,370 | 1,125,928 |
| Total sales proceeds | 893,282 | 2,270,137 |
| Net sales | 148,912 | 1,144,209 |
| Total direct transaction costs | 660 | 2,322 |
| Transaction costs as % of average NAV | 0.07% | 0.15% |
| Average portfolio trading spread | 0.29% | 0.34% |
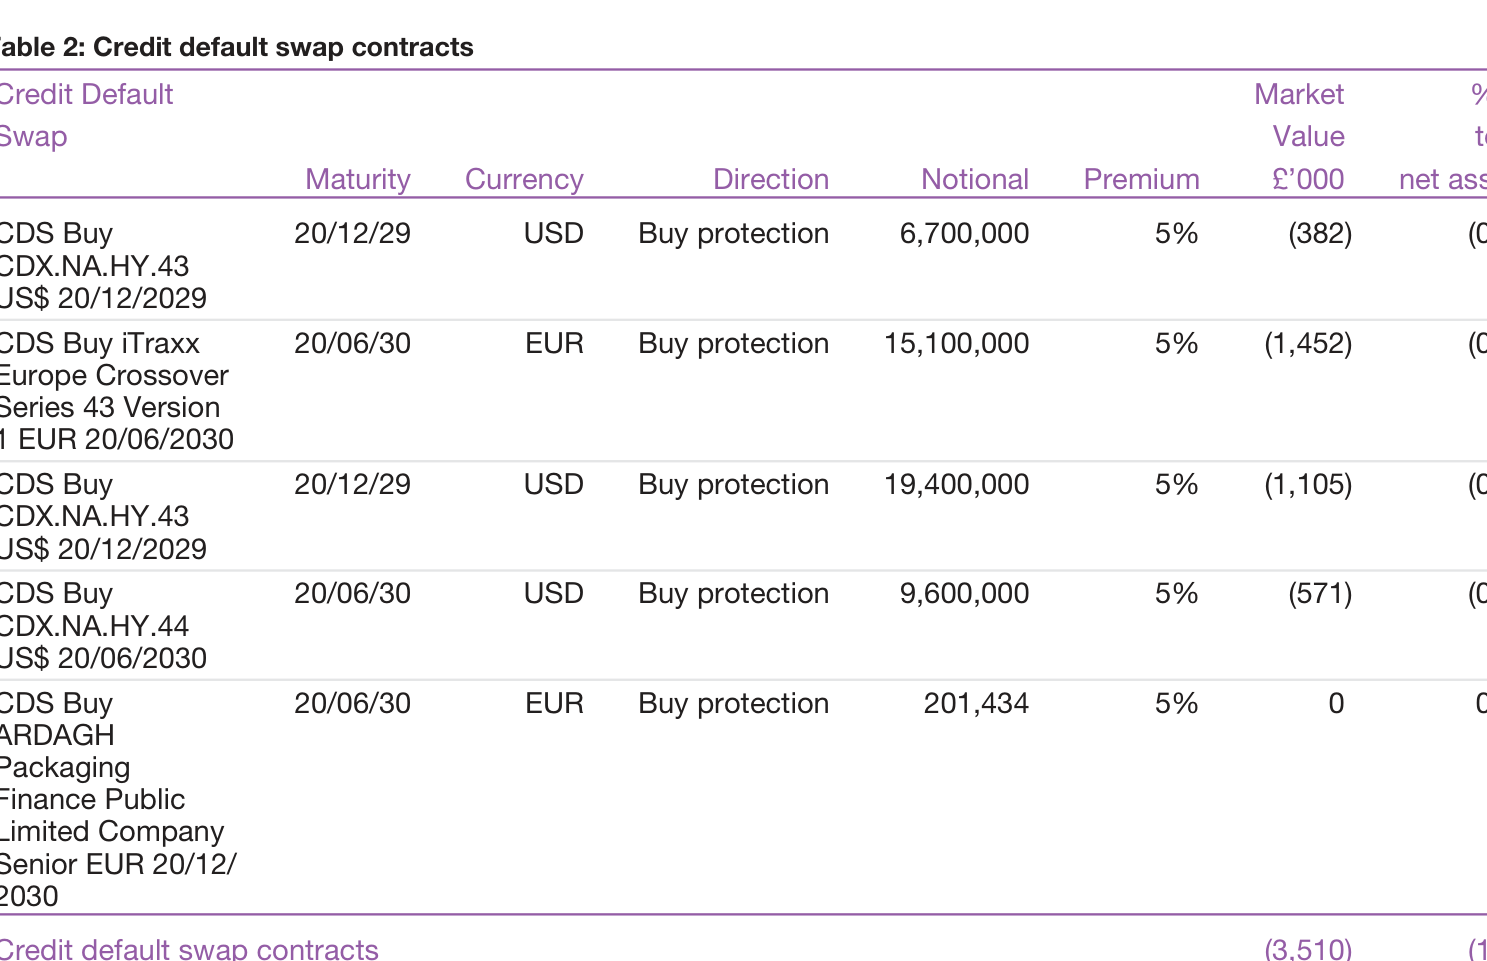
In 2024, net sales of £1.144 billion represented 87.5% of net redemptions (£1.306 billion), meaning nearly every pound of redemptions was funded by selling assets; transaction costs were as high as £2.32 million with an average spread of 0.34%—classic "seller's market" trading under liquidity pressure. In 2025, net sales fell to £149 million, covering only 63.3% of net redemptions (£235 million); the remainder was funded through cash and income distributions—this explains why cash and equivalents fell from £104 million to £55.27 million in 2025 (-46.8%).
The improvement in transaction costs (0.15%→0.07%) is primarily attributable to lower trading volume and lower tax costs—in 2024, the fund paid sales tax of £1.058 million (mainly stamp duty from liquidating high-priced fund units), falling to £51,000 in 2025.
More noteworthy is the direction of purchases and sales by asset class:
| Net Purchases by Asset Class (£'000) | 2025 | 2024 |
|---|---|---|
| Bonds | +95,698 | -132,299 |
| Equities | +118,357 | -94,149 |
| Funds | -363,572 | -920,038 |
In 2024, every asset was being "sold, sold, sold," with fund holdings (FOF positions) sold down by £920 million; in 2025, bonds and equities turned to net purchases, while fund holdings continued to be sold but at a reduced pace of £360 million. The fund is shifting from a "fund of funds" model to a direct investment model—this is mutually corroborated by management fee rebate income falling from £614,000 to £127,000 (-79.3%): with fewer underlying fund holdings, rebates naturally decline. This also explains why the fund-level AMC fell substantially—directly invested assets do not generate sub-fund management fees, and the fee the fund charges is effectively "discounted."
VI. Distribution Retention and Tax Efficiency
Data from Notes 6 and 5 show the fund maintained "full distribution" discipline:
| Distribution-Related Data (£'000) | 2025 | 2024 |
|---|---|---|
| Total distributions | 30,801 | 50,332 |
| Retained earnings (net income - total distributions) | (14) | (56) |
| Payout ratio (total distributions/net income) | 100.05% | 100.11% |
The fund distributes almost all net income to investors, even over-distributing by £14,000 in 2025. However, of the £65,298,000 retained in net assets, £28,957,000 represented retained distributions on accumulation shares, accounting for 44.3%. This indicates that most "retention" is effectively reinvestment of amounts due to accumulation share holders, not the fund actively retaining profits.
On taxation, the fund continues to benefit from the Tax Elected Fund regime, using £3.322 million of non-dividend distributions as a tax deduction in 2025, combined with £2.737 million of tax-exempt dividends, successfully reducing corporation tax to zero. This is consistent with the 2024 approach, confirming that the tax structure has not changed despite the scale contraction.
VII. Balance Sheet Changes: The Cash Buffer Is Thinning
From the Balance Sheet, the fund's safety metrics show subtle shifts:
| Liquidity Metrics (£'000) | 2025 | 2024 |
|---|---|---|
| Cash + cash equivalents | 55,272 | 103,920 |
| Cash as % of total assets | 5.9% | 9.5% |
| Investment assets | 863,373 | 957,756 |
| Investment liabilities (derivatives) | 11,187 | 14,292 |
| Other payables | 7,204 | 14,202 |
The cash buffer fell from £104 million to £55.27 million, a decline of 46.8%. Given that there were still £235 million of net redemptions in 2025, £55.27 million of cash represents only about two quarters of redemption buffer. The fund maintained low leverage (total liabilities/total assets of only 1.96%), and investment liabilities (derivatives) fell from £14.29 million to £11.19 million, indicating a simultaneous contraction in derivative risk exposure.
Overall, these financial statements paint a picture of a "slimming portfolio": scale continues to contract but at a slower pace; income is shifting from dividends to interest; returns are shifting from hedging gains to holding gains; allocation is shifting from FOF to direct investment; and cash is shifting from buffer to ammunition. The 8.15% return is both a scorecard for the fund manager under redemption pressure and an implicit vulnerability from the high proportion of unrealised gains—if market direction reverses in 2026, whether these "paper gains" can translate into real shareholder returns will be the biggest question.
Deep Analysis of Financial Statement Notes (2025 vs 2024)
I. Distributions and Income: Dual Signals of Income Slump
| Metric | 2025 (£'000) | 2024 (£'000) | Change |
|---|---|---|---|
| Net income after tax | 30,787 | 50,276 | -38.8% |
| Total distributions | 30,801 | 50,332 | -38.8% |
| Distributable income carried forward | 13 | 27 | -51.9% |
The parallel contraction of distributions and net income reflects two facts: first, a reduced investment income base from fund shrinkage (net assets fell from £1,060.8M to £920.9M, -13.2%); second, the distribution policy distributes nearly all of the year's income (99.95%) with virtually no retention—this continues the fund's tradition of a high payout ratio, but it also means that if income continues to decline in the future, the distribution safety margin will be very limited.
Notably, the specific per-share distribution amounts for 2025 are not fully disclosed in the notes (reference should be made to the Distribution Tables), but the total contraction of -£19.5M is far greater than the net asset shrinkage, implying that per-unit earning capacity is also deteriorating—this may be related to the fund's significant increase in high yield bond holdings in 2025 (see Note 14 analysis below), with the coupon income from these bonds not yet fully reflected.
II. Cash and Liquidity: Superficial Contraction, Substantive Improvement
The 2025 cash balance edged down from £15,615K to £14,849K (-4.9%), but excluding overdraft factors, net cash actually improved significantly:
| Item | 2025 (£'000) | 2024 (£'000) | Change |
|---|---|---|---|
| Total cash and bank deposits | 14,849 | 15,615 | -4.9% |
| Less: overdrafts | - | (7,770) | 100% improvement |
| Net cash | 14,849 | 7,845 | +89.3% |
This shift is significant. In 2024, the fund not only held £15.6M in cash assets but also carried £7.8M in bank and clearing house overdrafts, creating a "double-high" structure—cash on the asset side and borrowings on the liability side, indicating inefficient capital usage. In 2025, all overdrafts were eliminated and net cash nearly doubled, indicating:
- Settlement structure optimisation: in 2024, foreign currency clearing houses held £7,753K; in 2025, this shifted to £15K held in sterling, reducing reliance on non-sterling clearing accounts;
- Enhanced year-end liquidity reserves: net cash of £14.8M rose from 0.74% to 1.61% of net assets. Although the absolute level is not high, in the context of the redemption wave (see Note 12), it provides a thicker buffer for daily redemptions and trade settlement.
III. Debtor Structure: Derivative Collateral Concentration Rose Significantly
| Item | 2025 (£'000) | 2024 (£'000) | Change | % of Total (2025) |
|---|---|---|---|---|
| Collateral prepaid to counterparties | 10,650 | 12,635 | -15.7% | 51.4% |
| Accrued income | 5,063 | 3,421 | +48.0% | 24.5% |
| Receivable for shares issued | 3,608 | 3,593 | +0.4% | 17.4% |
| Sales awaiting settlement | 432 | 1,725 | -75.0% | 2.1% |
| Clearing brokers/clearing house receivables | - | 4,359 | -100% | - |
| Overseas tax recoverable | 893 | 1,717 | -48.0% | 4.3% |
| Total | 20,692 | 27,581 | -25.0% | 100% |
Three points merit attention:
1. Interbank clearing receivables entirely eliminated: in 2024, receivables from clearing brokers and clearing houses totalled £4,359K; in 2025, they went to zero. Combined with the significant reduction in clearing account balances noted in Note 9, this indicates the fund actively scaled back its derivative clearing operations in 2025, or transferred these positions to a collateralised trading model (collateral payables also rose from £780K to £6,495K, see Note 10).
2. Accrued income surged 48%: £5,063K of accrued income now approaches a quarter of total debtors. This growth is consistent with the fund's increased high yield bond holdings (Note 14)—high yield bonds typically accrue interest at higher coupons, so year-end accrued interest would naturally be higher; some bond interest payment delays may also be a factor.
3. Bilateral collateral concentration: £10,650K prepaid to counterparties (Note 8) plus £6,495K held on behalf of counterparties (Note 10) gives a combined derivative-related collateral exposure of approximately £17.1M. The corresponding 2024 figure was £13.4M (12,635+780), a net increase of 27.6%. This indicates that while clearing operations contracted, collateral occupation for OTC derivatives actually increased—possibly reflecting higher margin requirements driven by greater market volatility.
IV. Other Creditors: Collateral Payables Surged 733%
| Item | 2025 (£'000) | 2024 (£'000) | Change |
|---|---|---|---|
| Collateral held on behalf of counterparties | 6,495 | 780 | +733% |
| Purchases awaiting settlement | 471 | 4,147 | -88.6% |
| Payable to ACD/related parties | 58 | 88 | -34.1% |
| Other accrued expenses | 81 | 68 | +19.1% |
| Total | 7,131 | 5,827 | +22.4% |
The surge in collateral held on behalf of counterparties mirrors Note 8: the fund simultaneously has both receivable collateral from counterparties and payable collateral held on behalf of counterparties. Net collateral position is £10,650 - £6,495 = £4,155K (net receivable), versus a 2024 net position of £11,855K (12,635-780). This indicates the fund's status as a net derivative receivable party has weakened and counterparty credit risk exposure has actually narrowed—but total bilateral collateral occupation is growing, implying higher transaction costs.
Purchases awaiting settlement fell sharply from £4,147K to £471K (-89%), and sales awaiting settlement also declined significantly (-75%), indicating little trading activity around the year-end date, consistent with the fund's overall contraction and redemption-dominated annual profile.
V. Related Party Transactions: Major Shifts in Asset Allocation
Note 11 reveals several key asset allocation moves made by the fund in 2025:
1. Significant reduction in US equity fund
- 2024: purchased £36,663K, sold only £1,087K (net purchase +£35.6M)
- 2025: purchased £3,688K, sold £31,565K (net sale -£27.9M)
- In the space of one year, the fund swung from significant net buying to significant net selling; given the elevated levels of US equities in 2025, this may represent profit-taking or risk avoidance.
2. Full exit from emerging market bond funds
- Emerging Markets Bond Fund: in 2024, purchased £158,946K and earned £1,218K income; in 2025, zero purchases and zero holdings;
- Worldwide Global Strategic Bond Fund: £114,917K purchased in 2024, reduced to zero in 2025;
- Sustainable Emerging Markets Bond Fund: in 2024, purchased £13,869K and sold £183,179K (essentially liquidated); no transactions in 2025.
- The three emerging market bond funds together generated approximately £470M of trading volume in 2024; in 2025 they were completely silent—the fund's attitude toward emerging market fixed income assets made a 180-degree turn.
3. Increase in high yield bond fund
- High Yield Bond Fund: purchases rose from £23,721K to £50,905K (+114.6%), with sales of £53,504K, showing active trading. This is the only related party fund that maintained high trading volume in 2025.
4. Other regional funds also reduced
- Emerging Markets Leading Companies: net sales of £33.9M (a reversal from 2024 net purchases of +£47.4M)
- Long Term Global Growth: sales of £34.6M
- China A Shares: sales of £5.9M, twice the purchase amount
- Global Income Growth: sales of £19.0M
Overall pattern: In 2025, the fund executed a large-scale regional rebalancing through related fund transactions—significantly reducing emerging market (especially bond) exposure, cutting US equity and global growth positions, while maintaining or even increasing high yield bonds. This is fully consistent with Note 14's finding that high yield bond weight rose from 5.22% to 14.52%.
One further notable detail: Baillie Gifford American Fund contributed zero income in 2025 (also zero in 2024), indicating the fund holds accumulation shares (Acc) that do not distribute cash. Across the entire related fund portfolio, only Global Income Growth (£421K), High Yield Bond (£602K), and Long Term Global Growth (-£10K) generated net income contributions.
VI. Share Movements: B Class Shares Heavily Redeemed
| Share Class | Opening | Issued | Cancelled | Closing | Net Change | Contraction Rate |
|---|---|---|---|---|---|---|
| B2 Accumulation | 66,891,760 | 900,638 | (23,521,209) | 44,277,342 | -22,614,418 | -33.8% |
| B Income | 16,426,021 | 251,611 | (14,541,780) | 2,127,314 | -14,298,270 | -87.0% |
| C Accumulation | 331,136,558 | 31,847,801 | (90,884,914) | 272,099,445 | -59,037,113 | -17.8% |
| C Income | 500 | - | - | 500 | 0 | 0% |
| P Accumulation | - | 500 | - | 500 | +500 | N/A |
Key findings:
1. B class shares are close to being "redeemed into extinction": B Income shares began the period with 16.4M shares, saw 88.6% redeemed within one year, and ended with only 2.1M shares. B2 Accumulation also shrank by one-third. The B class is typically held by institutional or wholesale investors (lower fee rates); such large-scale redemptions indicate institutional clients withdrew capital en masse in 2025, which is the root cause of the fund's 13% decline in net assets.
2. The cost of scale pressure: total redemptions for the year were approximately 128.9M shares (23.5+14.5+90.9), total issuances only 33.0M, net redemptions approximately 95.9M shares. Based on C class year-end NAV scale (£272.1M shares × ~£3.0 NAV), C class redemption amounts were approximately £270M—in a relatively small fund, redemptions of this magnitude require the portfolio to have sufficient liquidity, which explains why the fund liquidated large amounts of emerging market bond funds and Level 3 assets in 2025 (see below).
3. Trace of share conversion: B2 had 6,153 shares transferred in and B Income had 8,538 transferred out, indicating small-scale share class conversion activity. Net conversion shows B2 with net transfers in and B Income with net transfers out—possibly reflecting some investors moving from Income to Accumulation classes.
VII. Valuation Hierarchy: Level 3 Assets Plunged 87.6%
| Valuation Hierarchy | 2025 (£'000) | 2024 (£'000) | Change |
|---|---|---|---|
| Level 1 (quoted prices) | 545,473 | 473,029 | +15.3% |
| Level 2 (observable data) | 310,731 | 426,745 | -27.2% |
| Level 3 (unobservable data) | 7,170 | 57,982 | -87.6% |
| Total assets | 863,373 | 957,756 | -9.9% |
Level 3 assets fell sharply from £58.0M to £7.2M. Level 3 typically includes assets with extremely low liquidity or complex valuations (such as private equity, certain derivatives). The disappearance of £50.8M of Level 3 assets within one year, combined with significant redemption pressure, most plausibly indicates:
1. The fund actively liquidated these hard-to-value assets in 2025 to release liquidity for redemptions;
2. Some assets may have been reclassified to Level 2 (their valuation methodology becoming observable) due to changing market conditions;
3. The notes indicate that detailed Level 3 information requires reference to the Portfolio Statement—if these assets were previously held private investments or complex structured products, their liquidation may have involved discounts, dragging on fund performance.
Level 1 asset share rose from 49.4% (473,029/957,756) to 63.2% (545,473/863,373), significantly improving the portfolio's liquidity quality—listed equities and standardised products now account for a higher proportion. This is a defensive allocation strategy adopted by the fund during a period of stress.
VIII. Credit Ratings: High Yield Bonds Became the Second-Largest Fixed Income Sector
| Rating Group | 2025 Market Value (£'000) | % | 2024 Market Value (£'000) | % | Market Value Change |
|---|---|---|---|---|---|
| Investment grade | 101,489 | 11.02% | 115,311 | 10.87% | -12.0% |
| High yield | 133,689 | 14.52% | 55,388 | 5.22% | +141.4% |
| Unrated | 2,267 | 0.25% | 52,771 | 4.97% | -95.7% |
| Fixed income subtotal | 237,445 | 25.79% | 223,470 | 21.06% | +6.3% |
| Other assets | 683,501 | 74.21% | 837,293 | 78.94% | -18.4% |
| Net assets | 920,946 | 100% | 1,060,763 | 100% | -13.2% |
Three key signals:
1. High yield bond weight nearly tripled (from 5.22% to 14.52%); the fund clearly increased its credit risk appetite in 2025. Combined with the High Yield Bond Fund position increase in Note 11, the strategic intent is clear: in an environment where interest rates remain relatively elevated, use high yield bonds to capture higher coupon income and compensate for overall income decline pressure.
2. Unrated assets fell from £52.8M to £2.3M (-95.7%). The disappearance of £50.5M of unrated assets is highly consistent with the £50.8M reduction in Level 3—these unrated assets were very likely the same illiquid assets previously held without credit agency ratings (such as private debt and certain structured products). The simultaneous disappearance of both further confirms the fund's systematic cleanup of low-liquidity credit assets.
3. Despite the substantial rise in high yield bond amounts, fixed income's total share only increased from 21.06% to 25.79%, indicating that while compressing other assets, the fund partially transferred released capital to fixed income, but equities/other assets still dominate overall (74.21%).
IX. Currency and Interest Rate Risk: US Dollar Exposure Significantly Flipped
The most notable change in currency exposure:
| Currency | Net Exposure 2025 (£'000) | Net Exposure 2024 (£'000) | Change |
|---|---|---|---|
| US dollar | +14,558 | -60,332 | +£74.9M flip |
| Swedish krona | +7,898 | +33,067 | -76.1% |
| Euro | -47,704 | -92,763 | Negative exposure narrowed 48.6% |
| Swiss franc | -47,934 | -36,415 | Negative exposure widened 31.6% |
| New Zealand dollar | 0 | +21,414 | Fully liquidated |
| Turkish lira | 0 | +6,379 | Reduced to zero |
US dollar exposure flipped from a net -£60M in 2024 to a net +£14.6M in 2025—the largest currency risk change. Since non-monetary assets are the primary source of exposure, this flip means the fund increased US dollar-denominated assets in 2025 (possibly including USD-denominated high yield bonds and US equities) while reducing non-USD equity assets.
Interest rate risk structure changes:
| Rate Type | 2025 (£'000) | 2024 (£'000) | Change |
|---|---|---|---|
| Floating rate financial assets | 32,668 | 145,182 | -77.5% |
| Fixed rate financial assets | 218,820 | 246,263 | -11.1% |
| Non-interest bearing financial assets | 1,185,518 | 1,443,811 | -17.9% |
The cliff-edge decline in floating rate assets (-77.5%) indicates the fund significantly reduced interest-bearing assets in clearing accounts and floating rate notes in 2025, consistent with the decline in clearing account balances noted in Note 9. Although the absolute value of fixed rate assets contracted modestly, their relative share of total assets actually rose: fixed rate assets as a proportion of total financial assets increased from 13.4% (246,263/1,835,256) to 15.2% (218,820/1,437,006). In the context of major central banks beginning to cut rates in 2025, locking in higher fixed coupons through bond allocation was a reasonable defensive choice.
However, the Czech koruna fixed rate asset figures (2025 £2,043K vs 2024 £111,862K) show an obvious order-of-magnitude difference; by normal reasoning, the 2024 data may have included other classified items and should be verified against the full report.
X. Overall Assessment: A Financial Portrait of "Seeking Transformation Amid Contraction"
Synthesising the information from Notes 6 through 15, a picture emerges of the fund's overall behaviour in 2025:
1. Passive contraction: B and C class shares experienced large-scale net redemptions (combined redemption pressure of approximately £340M), with fund size contracting 13.2%;
2. Active defence: liquidated peripheral exposures such as New Zealand dollar and Turkish lira, sharply reduced emerging market bond fund holdings, compressed unrated/Level 3 illiquid assets from £50M+ to £7M, significantly improving portfolio liquidity;
3. Aggressive reallocation: channelled released capital into high yield bonds (+£78.3M) and US dollar assets, with clear credit downgrading in fixed income, attempting to counter income decline with higher coupons;
4. Operational efficiency improvement: eliminated all bank overdrafts, doubled net cash, simplified clearing account structures, and concentrated derivative collateral toward bilateral OTC models.
On the risk side, the fund in 2025 effectively traded liquidity for yield—high yield bond weight rose to 14.5%, increasing credit risk concentration; combined with the still-declining income base (net income -38.8%), if the high yield bond market corrects in the future, the fund would face dual pressure from credit losses and distribution income. This may be the metric most worth watching in the next annual report.
Continuing the interpretation of the financial data, this sequel focuses on derivative liability structure, counterparty credit risk, leverage levels, income distributions, and preliminary information on the new fund. These elements further reveal the fund's operational characteristics from risk management and return perspectives.
Changes in the Currency Structure of Derivative Liabilities
Note 15 lists financial liabilities by currency (primarily derivative liabilities). Compared with 2024, the scale and currency distribution of liabilities at end-2025 changed significantly:
| Currency | 2025 £'000 | 2024 £'000 | Change |
|---|---|---|---|
| Australian dollar | 44,681 | 55,905 | -20.1% |
| Canadian dollar | 15,789 | 15,662 | +0.8% |
| Chinese yuan | — | 46,502 | -100% |
| Czech koruna | — | 111,634 | -100% |
| Euro | 206,174 | 346,027 | -40.4% |
| Japanese yen | 2,850 | — | New |
| Swedish krona | — | 52,612 | -100% |
| Swiss franc | 50,989 | 36,415 | +40.0% |
| Sterling | 6,495 | 61,850 | -89.5% |
| US dollar | 295,694 | 337,464 | -12.4% |
The most obvious changes are the complete elimination of Czech koruna, Swedish krona, and Chinese yuan liabilities, the near-90% reduction in sterling liabilities, and the 40% increase in Swiss franc liabilities. This distribution adjustment typically means the fund closed interest rate swap or FX forward positions in certain currencies while possibly establishing new Swiss franc-related hedges. Given that these liabilities are presented in sterling, exchange rate movements also affect the book values, but euro and US dollar remain the largest liability currencies, together accounting for more than 85% of total liabilities. Notably, the liabilities are almost entirely floating rate, indicating the fund primarily uses floating-leg interest rate swaps rather than fixed rate instruments—consistent with active management of interest rate exposure within a diversified growth strategy.
Derivative Counterparty Credit Risk Control
Note 16 details derivative counterparty risk exposures. At end-2025, most counterparties showed negative net exposure (Barclays -£461,000, Citi -£551,000, NatWest -£149,000, etc.), meaning the fund holds negative mark-to-market contracts with these counterparties—i.e., the fund owes them money. Only a few counterparties showed positive exposure, the largest being JP Morgan Chase at £550,000, followed by Merrill Lynch at £290,000 and National Australia Bank at £105,000. Overall, positive exposure is limited in scale.
The fund also holds cash collateral: in 2025 it pledged £7.985 million to Goldman Sachs and £2.665 million to Merrill Lynch, totalling £10.65 million, down from £13.435 million in 2024. The decline in collateral is consistent with the narrowing of derivative notional exposure, indicating the fund reduced derivative activity at year-end. Additionally, futures contracts traded through UBS had counterparty risk fully offset by variation margin accounts due to fair value movements, reducing counterparty risk to zero—an efficient credit risk management approach.
Leverage Levels: The Gap Between Actual and Limits
Note 17 discloses leverage metrics under the AIFMD framework. The fund's maximum leverage limits are set at 1,000% under the Gross method and 300% under the Commitment method, while actual leverage at end-2025 was only 169% Gross and 116% Commitment. Actual usage is just 16.9% and 38.7% of the limits respectively, indicating the fund has ample leverage headroom but does not use it aggressively. The difference between the two methods (169% vs 116%) reflects netting or hedging arrangements, with typical sources including cash borrowing, derivatives used for portfolio management and hedging, and investment derivatives. This level of leverage is within a prudent range for a "diversified growth" strategy and would not significantly amplify losses from market volatility.
Income Distribution Trends: Divergence Across Share Classes
The Distribution Tables provide full-year distributions to 31 December 2025, including dividend distributions and non-dividend distributions. Combining interim and final amounts and comparing with 2024:
| Share Class | Dividend Distribution 2025 | Dividend Distribution 2024 | Change | Non-Dividend Distribution 2025 | Non-Dividend Distribution 2024 | Change |
|---|---|---|---|---|---|---|
| B2 Accumulation | 2.570p | 2.660p | -3.4% | 4.290p | 4.160p | +3.1% |
| B Income | 1.980p | 1.940p | +2.1% | 2.940p | 3.090p | -4.9% |
| C Accumulation | 4.510p | 4.360p | +3.4% | 5.020p | 4.960p | +1.2% |
| C Income | 3.860p | 3.760p | +2.7% | 4.330p | 4.520p | -4.2% |
| P Accumulation | 1.750p | n/a | — | 2.920p | n/a | — |
Overall, C class dividend distributions grew noticeably, while B2's dividend income fell modestly; on non-dividend distributions, both B Income and C Income declined, but B2 and C Acc maintained growth. Non-dividend distributions typically reflect the fund returning a portion of capital rather than income to investors, and are also related to income aggregation and tax treatment across different share classes. The P class is a newly added class with no 2024 comparables.
New Fund Introduction: Long Term Global Growth Investment Fund
The next section of the annual report introduces another sub-fund—Baillie Gifford Long Term Global Growth Investment Fund. Only the preamble covering investment objective, investment policy, and risk warnings is currently visible, but it is sufficient for an initial assessment:
- Objective: to outperform the MSCI ACWI Index by at least 2.5 percentage points per annum on a rolling five-year basis after fees;
- At least 90% of assets invested in globally listed equities, typically companies with market capitalisation exceeding US$4 billion;
- Concentrated portfolio, typically holding 30 to 60 stocks;
- Explicit risk warnings on China market risks (volatility, policy, liquidity), the risk of prolonged underperformance from concentrated holdings, and liquidity risk of assets being difficult to sell in extreme market conditions.
Compared with the Diversified Growth Fund analysed earlier, this fund is a pure equity, high-concentration strategy, with expected higher volatility and greater sensitivity to market style. The report's transition at this point also reminds investors that sub-funds under the same ICVC have vastly different risk profiles and should be selected according to individual risk tolerance.
In summary, these notes and disclosures not only show the fund's derivative, leverage, and distribution details at end-2025, but also reflect the manager's rigour in risk measurement and regulatory transparency. The large headroom between leverage limits and actual usage, and the small net exposures to derivative counterparty risk, both indicate that the fund, while pursuing value appreciation, maintains its risk底线.
The "Unquantified" Risks Behind the High-Risk Rating: From Fee Clauses to Benchmark Changes
The "Blind Spot" in Risk and Reward Indicators
The report explicitly classifies this fund as a higher risk level (the shaded position in the table is near tier 6 or 7), on the grounds that it "primarily invests in company shares." However, this is a classification based solely on historical price volatility and does not encompass the "relevant material risks" listed later in the report:
- Active management risk: the fund manager "selects the portfolio at their own discretion" and "does not seek to replicate any index." This means the fund's actual performance may deviate substantially from the market benchmark, and the direction of deviation depends entirely on stock selection skill. Historical volatility cannot capture this "human subjective risk."
- Growth style concentration risk: the fund focuses on companies with "long-term growth potential," and such stocks tend to suffer declines far exceeding the index during interest rate hiking cycles (supported by data below).
- Capital erosion risk: this is a critical but easily overlooked point in the fee clauses.
Fees Taken from Capital: The "Chronic Bleeding" of Low-Yield Growth Funds
The report states explicitly: "charges are taken from income. If insufficient, the rest will be taken from capital, reducing the capital value of the Fund."
For a long-term growth fund, the dividend yield on its portfolio is typically very low. Taking the annual management fee of 0.62% as an example, if the average portfolio dividend yield is only 0.5%, then at least 0.12% of the difference must be taken from capital each year. Although this may seem small, in years of flat market performance, capital NAV will continue to decline due to fees. More critically, this deduction is irreversible: once capital is reduced, even if future investment returns recover, the principal base has already shrunk. This fee clause effectively sets "fee payment" in opposition to "capital preservation," and the risk-reward indicators do not reflect this structural risk.
Benchmark Change: The "Splicing" Trap in Five-Year Performance Charts
The fund changed its benchmark from the FTSE All-World Index to the MSCI ACWI Index on 30 June 2023. This means the retroactively displayed "past five years" performance chart benchmarks one index in the first half and another in the second half. The two indices differ in constituent coverage and weight distribution (such as emerging market share), and direct splicing distorts historical excess return comparisons.
Furthermore, the target return (+2.5%) is not simply "index + 2.5%" but is "compounded daily"—the result of daily compounding. Therefore, investors seeking to verify the target return line in the chart cannot simply add 2.5% to the end-of-period index return. For example, if the index rises 14.4% in a given year, the target return is not 16.9% but 17.3% (the figure provided in the report) after daily cumulative compounding. This detail makes visual verification of the target line extremely difficult and adds complexity to performance evaluation.
Quantitative Comparison of Five-Year Cumulative Returns: A "Catastrophic" Underperformance
The report discloses five-year annualised returns to 31 December 2025: fund 2.5%, index 12.1%, target 14.9%. Converting to cumulative returns:
| Metric | Annualised Return | Five-Year Cumulative Return |
|---|---|---|
| Fund (B class accumulation shares) | 2.5% | (1.025)^5 -1 ≈ 13.1% |
| Index (MSCI/FTSE blended) | 12.1% | (1.121)^5 -1 ≈ 76.9% |
| Target return (index +2.5% compounded) | 14.9% | (1.149)^5 -1 ≈ 99.8% |
The fund underperformed the index by more than 63 percentage points cumulatively over five years, and missed the target by more than 86 percentage points. Even accounting for the possible -40.1% drawdown during 2021-2022 (chart data point), catching up to the index within the five-year period would require annualised returns far exceeding the index in subsequent years. This is no longer a deviation explainable by "short-term volatility" but systematic underperformance. The manager acknowledges in the report that "returns we have delivered will have disappointed investors," yet simultaneously insists that "five years is a more sensible timeframe"—however, five years is precisely the fund's own evaluation period, and within that period the fund just happened to fall short of its target.
Stock Attribution: Asymmetry Between Winners and Losers
| Category | Company | Key Facts | Reason for Share Price/Performance Divergence |
|---|---|---|---|
| Detractor | The Trade Desk | Revenue grew 18% YoY, beating company guidance and market expectations | Market concerns about near-term growth deceleration and Connected TV competition; Kokai platform performing well but not yet trusted |
| Detractor | Meituan | Maintained high order density, large-scale logistics network, deep merchant integration | Subsidy-driven competition forced participation in low-value, incentive-oriented orders, compressing near-term profits |
| Detractor | Atlassian | Non-GAAP gross margin above 85%, strong cash flow, good cloud product growth | Customers cut budgets amid macro uncertainty, smaller deal sizes, weak investor sentiment |
| Contributor | AppLovin | Revenue grew nearly 70% YoY, margins improved, Axon Ads attracting e-commerce advertisers | Ad platform scaling capability repriced by market, AI tools driving incremental growth |
| Contributor | Cloudflare | Record contracts, expanded global network, rising Zero Trust and SASE adoption | Enterprise platform strategy gaining recognition |
| Contributor | DAU reached 116 million, +20% YoY, machine translation in 30 languages rolled out | Improved ad tools + search integration, internationalisation and ad monetisation making progress |
This comparison reveals an asymmetry: detractors show "fundamentals improving but valuation/sentiment under pressure," while contributors show "strong growth progressively confirmed by the market." The fund's underperformance did not result from a collective deterioration of holdings, but from the market's insufficient "patience" with some growth companies and excessive "reward" for others. This asymmetry precisely reflects the vulnerability of active growth strategies in an environment of rising rates and capital concentrating toward a few leaders.
The Tension Between Manager Confidence and Objective Targets
In the outlook section at the end of the report, the manager reiterates "remain confident that our long-term growth approach will add value over time." But the objective data show that for the rolling five-year period ended 31 December 2025, the fund's annualised return of 2.5% is far below the 14.9% target, and even below the long-term return of ordinary bonds. More notably, the manager attributes the cause to "the most turbulent market environment in five years"—pandemic, inflation, war, AI technology revolution. However, these macro factors equally affected the index and peers; the index's annualised 12.1% demonstrates that the overall market was not depressed. It is precisely the "long-term growth stock" style that suffered valuation compression during the tightening cycle, placing the fund at a structural disadvantage. The manager's confidence lacks a falsifiable timeline: if a similar interest rate environment recurs in the next five years, can the fund reverse course? The report provides no scenario analysis—this may be the core question investors need to ask themselves when reading the "Introduction."
The analysis above adds several previously unaddressed dimensions, including expense capitalisation, benchmark splicing, the quantified gap in five-year cumulative returns, the asymmetry of stock-level attribution, and the tension between manager conviction and target-based performance assessment.
A Cost-to-Market-Value Scorecard for the Five New Buys: A Highly Asymmetric Position Build
The Largest Purchases data disclosed in the annual report makes it possible to construct a rough cost-benefit comparison of the five newly initiated positions (purchase cost versus year-end market value, without adjusting for transaction timing or exchange rates):
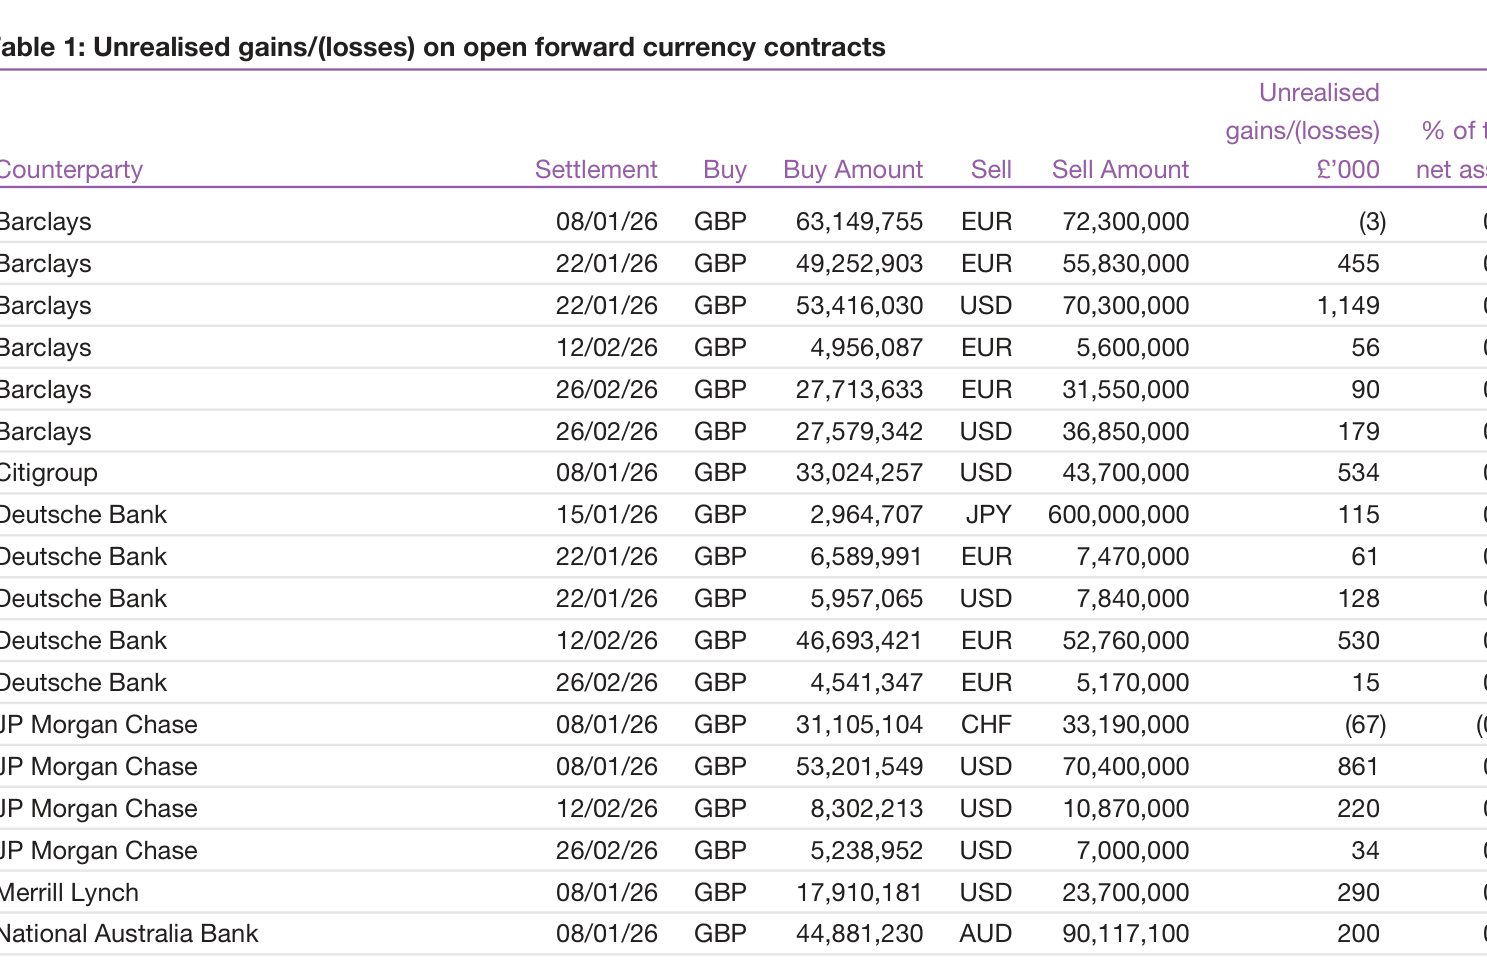
| Security | Purchase Cost (£'000) | Year-End Market Value (£'000) | Implied Book Gain/(Loss) | Year-End Weight |
|---|---|---|---|---|
| TSMC | 51,485 | 55,714 | +8.2% | 3.48% |
| 23,266 | 41,856 | +79.9% | 2.61% | |
| Rocket Lab Corp | 21,171 | 37,081 | +75.1% | 2.32% |
| Axon Enterprise Inc | 25,596 | 25,740 | +0.6% | 1.61% |
| Duolingo Inc | 25,850 | 14,197 | -45.1% | 0.89% |
The five new positions had a combined cost of approximately £147 million and a year-end market value of approximately £175 million, implying an overall unrealised gain of roughly 18.5%. Excluding Duolingo, however, the unrealised gain on the remaining four rises to about 32%. Duolingo is the clearest negative outlier in this round of position building: its year-end weight is just 0.89%, well below the initial cost-based weight of roughly 1.6%, suggesting either that the entry point was too high or that fundamentals have deteriorated at the margin. Reddit and Rocket Lab contributed the bulk of the outperformance, both benefiting in 2025 from rapid re-ratings of the AI data-licensing and commercial-space themes, respectively. TSMC, the largest single new purchase, was built from zero weight to 3.48%, making it the portfolio's eighth-largest holding and reflecting the fund's far greater long-term conviction in semiconductor manufacturing than in chip design.
The Other Side of the "Largest Sales" List: Passive Liquidity Management Under Roughly £590 Million of Net Redemptions
The Largest Sales figures look like active rebalancing, but when combined with share-class data, the conclusion requires a significant revision. In 2025 the fund experienced large-scale net redemptions:
| Share Class | Shares at End-2024 | Shares at End-2025 | Reduction |
|---|---|---|---|
| C Accumulation | 90,442,533 | 61,241,695 | -29,200,838 |
| B Accumulation | 46,907,939 | 39,396,482 | -7,511,457 |
| B Income | 4,536,017 | 3,719,084 | -816,933 |
| C Income | 100 | 100 | 0 |
Based on an estimated average price of roughly £15.5 for C Accumulation shares in 2025, redemption value for that class alone approached £450 million; adding the B classes brings total redemptions to about £560 million. This estimate is corroborated by the change in net assets: end-2024 net assets were approximately £2,003 million, which, after applying 2025's roughly 9.3% positive return, would imply a theoretical size of about £2,189 million; actual year-end net assets were only £1,601 million, a gap of approximately £590 million — closely matching the redemption scale implied by the share data.
This means that the large sales among the top ten — Cloudflare (£58.32m), Datadog (£43.59m), Tesla (£42.81m), Shopify (£41.48m), Amazon (£40.75m) — were to a significant degree liquidity management in response to redemptions, not a wholesale shift in fundamental views. The evidence: Amazon, NVIDIA, Netflix and Spotify all remained top-ten holdings at year-end after the large sales; Cloudflare still carried a 3.90% weight after the £58.32m sale. The manager was "shrinking the fund while restructuring" — using highly liquid positions to meet redemptions while reallocating the capital released by redemption pressure into new directions such as TSMC, Reddit and Rocket Lab.
Country Allocation Rebalancing: Non-US Assets Exceed 50% for the First Time
The prior-year comparative figures in the Portfolio Statement reveal a clear geographic shift:
| Country/Region | End-2024 Weight | End-2025 Weight | Change |
|---|---|---|---|
| United States | 55.42% | 49.56% | -5.86pp |
| China | 13.43% | 15.53% | +2.10pp |
| Taiwan | 0.00% | 3.48% | +3.48pp |
| Brazil | 4.47% | 6.34% | +1.87pp |
| Canada | 3.82% | 2.76% | -1.06pp |
| Germany | 1.64% | 0.00% | -1.64pp |
| Netherlands | 6.26% | 7.06% | +0.80pp |
| France | 1.89% | 2.56% | +0.67pp |
The US weight fell below 50%, with non-US assets rising to 50.44%. Greater China (China 15.53% + Taiwan 3.48%) totals 19.01%, up from 13.43% a year earlier — nearly a fifth of the portfolio and the second-largest regional exposure after the US. The German weight falling to zero corresponds to the liquidation of BioNTech, and the Canadian decline to the reduction in Shopify. This shift occurred alongside the reduction in large-cap US technology stocks over the same period, indicating that the fund is replacing some US tech exposure with Asian tech assets. On the China side, the exposure is built from Tencent (3.91%), PDD (3.02%), Meituan (2.22%), CATL (1.92%) and BeOne Medicines (1.85%); on the Taiwan side, TSMC alone contributes 3.48%. Within the US, the fund retained next-generation software assets such as AppLovin (5.36%) and Cloudflare (3.90%) while trimming mature giants such as Amazon and NVIDIA — advancing "globalisation" and "frontier focus" simultaneously.
C Income Reduced to Nearly Zero: An Overlooked Share-Class Signal
The C Income Shares data in the Comparative Table is striking: 2,905,126 shares remained at end-2023, only 100 at end-2024, and still just 100 at end-2025, with a corresponding closing net asset value of only about £1,000. The symbolic 100 shares indicate that this class has in practice been emptied by institutional investors. Meanwhile, within the C class, C Accumulation shares continued to decline from 90.4m at end-2024 to 61.2m — a near-halving over two years from 120.4m shares.
Given that the B classes also saw net redemptions, this is not performance-driven — the C class returned 9.62% and the B class 8.94% in 2025, both positive. A more likely cause is client-level asset allocation: after the 2022 drawdown in growth strategies, some institutions rebalanced by redeeming or switching share classes. Net redemptions in 2025 amounted to roughly 28% of the starting asset base, imposing a material constraint on portfolio management, and explaining why the fund — even while bullish on new opportunities such as TSMC — still had to sell core holdings such as Amazon and NVIDIA to raise cash.
Intra-Year NAV Swings: A 21% Drawdown Followed by a V-Shaped Rebound
The high/low prices in the Comparative Table reveal the actual market rhythm of 2025:
| Share Class | Start-Year NAV (pence) | Year Low | Max Drawdown | Year High |
|---|---|---|---|---|
| B Accumulation | 1,298.52 | 1,020 | -21.4% | 1,568 |
| C Accumulation | 1,475.87 | 1,161 | -21.3% | 1,792 |
The maximum drawdowns of the two share classes are nearly identical, at about 21%, indicating a portfolio-level systematic pullback rather than idiosyncratic stock risk. From the low of 1,020 pence to the high of 1,568 pence, the rebound was approximately 53.7%, but the year closed at 1,414.59 pence, about 9.8% below the peak. The annual return of 8.94% was achieved through this "deep V followed by a give-back" trajectory. This volatility pattern is consistent with the high-amplitude environment for growth equities in 2025 — AI-related holdings went from extremely crowded to a sharp de-risking over the course of the year.
Decomposing Earnings Quality: Capital Gains Are the Only Engine
The Statement of Total Return provides an easily overlooked structural fact: net capital gains of £171.3m in 2025 versus net income (revenue after fees and tax) of just £236,000 — a ratio of roughly 726 to one. The fund is by nature "capital-appreciation-driven"; dividend income is almost negligible. At the same time, however, distributions reached £2.548m, exceeding net income by £2.312m, implying that part of the distribution drew on capital or reserves. With the C Income share class now nearly emptied, the future dividend pressure from income share classes should decline further.
Capital gains themselves also fell from £510.8m in 2024 to £171.3m in 2025, a decline of about 66%. This is not only the direct reason the return fell from 28.18% to 8.94%; it also reflects a marked weakening of re-rating momentum in 2025 after the 2023-2024 bull leg. Although the newly purchased Reddit and Rocket Lab posted impressive gains, their weights in the portfolio were not yet sufficient to reverse the downward shift in the overall return centre.
5. Net Redemptions and Trading Behaviour: A Mirror Image — Passive Selling Dominated the Year's Activity
The most important financial fact of 2025 is not investment performance but the scale of outflows. The Statement of Change in Net Assets clearly shows subscriptions of only £120.9M for the year, against redemptions of £695.0M — a net outflow of £574.1M, equivalent to 28.7% of opening net assets. Even with investment activity contributing £169.0M of positive return, fund size still contracted from £2,002.9M to £1,600.7M, a decline of 20.1%.
The trading data further reveals the real impact of this redemption wave:
| Item | 2025 | 2024 | YoY Change |
|---|---|---|---|
| Total stock purchases | £291.1M | £418.0M | -30.4% |
| Total stock sales | £851.7M | £1,017.1M | -16.3% |
| Net sales | £560.6M | £599.1M | -6.4% |
| Net share redemptions | £574.1M | £598.6M | -4.1% |
| Cash and bank deposits | £10.2M | £22.2M | -54.0% |
Net sales and net redemptions are almost exactly matched (£560.6M vs £574.1M), indicating that the 2025 portfolio changes were essentially a passive response to redemptions, not active rebalancing. The manager sold assets under liquidity pressure, cash reserves fell from £22.2M to £10.2M, and the fund even ended the year with a £56K bank overdraft. This is not a measured rebalancing posture; it is a fund being pushed along by redemptions.
6. The Divergence Between Realised and Unrealised Gains: Selling Winners, Keeping Losers
The capital gains structure in Note 1 provides another deeper signal. In 2025, realised gains reached £306.1M, but unrealised gains/losses were -£134.8M — the two moved in completely opposite directions; in 2024 both realised and unrealised were positive.
| Item | 2025 Realised | 2025 Unrealised | 2024 Realised | 2024 Unrealised |
|---|---|---|---|---|
| Non-derivative securities | £306.1M | -£134.8M | £361.7M | £148.8M |
| Currency gains/losses | £30K | - | £144K | £98K |
| Total | £171.3M | - | £510.8M | - |
This indicates that the trading behaviour in 2025 was characterised by: selling positions with unrealised gains to book profits and meet redemptions, while the remaining holdings' market performance dragged on overall returns. In other words, the fund was forced to sell its best-performing assets, leaving a relatively weaker holdings structure. This not only reduced current-period returns but also weakened the portfolio's potential for future recovery. The £501K capital gains tax provision (zero in 2024) is also indirect evidence of the tax consequences of realising profits at scale.
7. Rigid Fees vs Shrinking Income: The Cost-to-Income Ratio Deteriorates Sharply
The divergence between income and expenses widened markedly in 2025:
| Item | 2025 | 2024 | YoY Change |
|---|---|---|---|
| Total income | £5.0M | £6.3M | -21.0% |
| Total expenses | £4.3M | £4.5M | -3.9% |
| Expense/income ratio | 85.7% | 70.5% | +15.2pp |
| Net income (after tax) | £0.24M | £1.46M | -83.8% |
Expenses fell only 3.9% while income fell 21.0%, so each £1 of income now requires nearly 86 pence of expenses. The AMC of £4.0M accounts for 92% of total expenses and is the most rigid component. The annual management fee is about 0.22% of average NAV — the absolute fee level is not high — but after the shrinkage in size, fee efficiency has been significantly eroded.
More noteworthy is the accumulated excess management expenses disclosed in Note 5: they rose from £38.5M in 2024 to £42.5M in 2025, an increase of £4.1M, nearly equal to the year's total expenses of £4.3M. This means the management fee can barely be offset by taxable income, leaving the fund structurally inefficient from a tax perspective. £42.5M is equivalent to 2.7% of year-end NAV — a sunk cost that will permanently fail to generate any tax-shield value.
8. Related-Party Holdings Reduced to Zero: A Behavioural Signal from Insiders
Note 11 discloses a notable change: the fund shares held by the ACD and its related parties fell from 1.97% of NAV in 2024 to 0.00%.
| Related-Party Holdings | 2025 | 2024 |
|---|---|---|
| ACD and related parties' holdings as % of NAV | 0.00% | 1.97% |
In the same period when external investors were redeeming heavily, the fund manager's related parties chose to liquidate their holdings entirely. Whatever the specific reason — compliance constraints, liquidity management or internal judgement — from a behavioural-signal perspective, the complete exit by insiders occurring simultaneously with the external redemption wave is a compounding signal that investors should take seriously.
9. Divergence in Share-Class Structure: Institutional Investors' Exit Was More Decisive
Observing redemption behaviour by share class, the differences are stark:
| Share Class | Shares at End-2024 | Shares at End-2025 | Change |
|---|---|---|---|
| B Accumulation | 46,907,939 | 39,396,482 | -16.0% |
| B Income | 4,536,017 | 3,719,084 | -18.0% |
| C Accumulation | 90,442,533 | 61,241,695 | -32.3% |
| C Income | 100 | 100 | 0.0% |
The C classes (typically oriented toward institutional and higher-net-worth investors) saw nearly a third redeemed, a redemption rate twice that of the B classes. Institutional investors exited more decisively than retail investors, consistent with the usual pattern in which institutions react faster and retail lags in a crisis. C Income is down to just 100 shares and is now practically meaningless; in the income distributions, £2.2M is retained in the Accumulation class while demand for Income distributions is minimal, confirming that investor interest in this fund is entirely focused on capital appreciation rather than cash-flow returns.
10. Currency Exposure: Global in Name, US-Dollar-Bloc in Substance
The currency exposure table in Note 14 shows that the fund's non-sterling assets are spread across five currencies, but the structure is highly concentrated in the dollar bloc:
| Currency | 2025 Total Exposure | % of Total Assets |
|---|---|---|
| US dollar | £1,143.9M | 71.5% |
| Euro | £177.9M | 11.1% |
| Hong Kong dollar | £144.9M | 9.1% |
| Chinese yuan | £55.5M | 3.5% |
| Indian rupee | £24.5M | 1.5% |
| UK sterling | £1K | ~0% |
US-dollar assets plus Hong Kong dollar assets (which operate under a linked exchange rate system) together account for more than 80%, and Chinese yuan assets are in substance also part of the dollar-bloc supply chain. For a fund named "Long Term Global Growth", its currency risk is essentially highly dependent on the fate of the US-dollar system. Sterling exposure is almost zero, meaning that as a sterling-denominated UCITS product the fund has almost no natural buffer when sterling fluctuates. Currency gains/losses of just £30K in 2025 suggest exchange-rate movements had a limited impact on the portfolio for the year, but this single-currency anchored structure is itself a concentration risk worth noting.
11. Valuation Hierarchy: The Only Transparency Bright Spot
Finally, Note 13 shows that all investments are Level 1 (publicly quoted), with Level 2 and Level 3 at zero. All £1,592.1M of investment assets have active market quotes, indicating that the portfolio contains no hard-to-value private equity, unlisted securities or liquidity-discount issues. Against the backdrop of massive redemptions and insider liquidation, the transparency of asset pricing is the one reassuring financial characteristic — at least investors know that every unit of NAV is backed by verifiable market prices rather than the manager's valuation judgement.
The additional disclosures in this section centre on four key dimensions: leverage, post-balance-sheet events, distribution data, and the product structure of the sister sub-fund, Positive Change Fund. Building on the earlier argument that "a single market-sensitivity indicator is insufficient to reflect risk", these items provide more specific regulatory metrics and measured data.
15. Leverage: Actual Leverage at 100%
The leverage section discloses two measures as required by AIFMD: `gross method` and `commitment method`. As of 31 December 2025, the fund's actual leverage under both measures was 100%, indicating that it had not used borrowing or derivatives to scale up risk exposure at year-end. The maximum limits were 120% and 110% respectively, showing that the fund had regulatory headroom for leverage but did not use it during the year and never breached the limits.
| Measure | Maximum Limit | Actual Level |
|---|---|---|
| Gross method | 120% | 100% |
| Commitment method | 110% | 100% |
Notably, the `commitment method` cap is lower than the `gross method` cap, indicating that even if the fund were to use derivatives, it would prefer to restrain risk through netting and hedging arrangements rather than simply stacking notional exposures.
16. Post Balance Sheet Events: Post-Period Volatility Has Already Caused a Significant Drawdown
The post-balance-sheet events disclosure presents an extremely important stress scenario: from 31 December 2025 to 25 February 2026, the total return of Class B Accumulation Shares was -10.9%. At 10:00 a.m. on the same day, the fund's net assets were approximately £1,409,518,000 (about £1.41 billion).
This data is valuable for understanding the fund's risk profile:
- Even though the investment objective and performance evaluation horizon are "rolling five years", short-term drawdowns can still be very large;
- A decline of nearly 11% within less than two months after the period end shows that the earlier "share price can be volatile" risk warning was not empty rhetoric;
- The report also notes that other share classes performed broadly in line with Class B Accumulation Shares, so this is not an issue of a single share class but a portfolio-level market shock.
Distribution Table: C-Class Distributions and the Change from the Prior Year
The distribution table shows that B Accumulation and B Income both had no final distributions; the C classes did. The difference between Group 1 and Group 2 mainly reflects the timing of purchase: Group 2 uses the `equalisation` mechanism to prevent investors from receiving income accrued before their purchase.
| Share Class | 2025 Group 1 | 2025 Group 2 | 2024 |
|---|---|---|---|
| C Accumulation | 3.59000p | 2.24671p net income + 1.34329p equalisation = 3.59000p | 3.55000p |
| C Income | 3.25000p | 3.25000p | 3.45000p |
Looking at the comparable data:
- C Accumulation's distribution rose from 3.55000p to 3.59000p, an increase of about 1.1%;
- C Income's distribution fell from 3.45000p to 3.25000p, a decrease of about 5.8%.
Within the same fund, the distribution trends for Accumulation and Income classes diverge, indicating structural differences between the two classes in income treatment, expense deduction or the equalisation mechanism. In C Accumulation Group 2's distribution, `equalisation` accounts for 1.34329p, about 37.4% of the total — this portion is not current-period net income but an adjustment for accrued income already embedded in the subscription price.
Positive Change Fund: A Contrast with Long Term Global Growth
Positive Change Fund is another sub-fund under the same ICVC, but its product design is clearly different. The most important differences are:
- Explicitly prohibits investing in or using derivatives;
- Its financial objective is to outperform the MSCI ACWI Index (in sterling terms) by at least 2% over a rolling five-year period, after costs;
- Its sustainability objective requires at least 90% of assets to be invested in companies contributing to `Impact Outcomes`;
- The remaining assets may only be held in money market instruments, deposits and cash, and must not conflict with the sustainability objective;
- The investment adviser is required to manage the portfolio with the aim of achieving net zero greenhouse gas emissions by 2050 or earlier.
| Dimension | Specifics |
|---|---|
| Financial objective | Outperform MSCI ACWI by at least 2% over a five-year rolling period, after costs |
| Sustainability objective | At least 90% invested in companies contributing to `Impact Outcomes` |
| Investment universe | Global company equities or ADRs, any size and sector, concentrated active management |
| Derivatives | Prohibited from investing in or using |
| Impact themes | social inclusion & education; environment & resource needs; healthcare & quality of life; base of the pyramid |
| Net zero objective | GHG net zero by 2050 or earlier |
The fund's sustainability objective is not static: `Impact Outcomes` may evolve over time and are assessed periodically by the investment adviser. `Theory of Change` plays a key role, describing in detail how the investment adviser advances the impact objectives through capital allocation, engagement to maximise impact, and responsible stewardship.
Supplementary Risks to the Risk and Reward Profile
The Positive Change Fund's risk and reward indicator is based on historical data, but the report explicitly lists material risks not captured by that indicator:
- Active management and portfolio concentration could lead to long-term underperformance;
- Impact lacks a uniformly accepted definition, and individual investments may fail to deliver a positive contribution;
- Third-party data may be lagged or based on estimates;
- Liquidity problems could arise in adverse market conditions, potentially even suspending trading;
- Custodian insolvency or negligence could lead to loss of assets;
- Global factors such as natural disasters, pandemics, military conflicts or policy changes could all affect investments;
- Fees are primarily deducted from income and, if income is insufficient, may be deducted from capital, thereby reducing capital value.
These risks are particularly important for Positive Change Fund because its sustainability objective relies heavily on qualitative judgements and non-financial data.
Overall, this section moves from compliance disclosures to substantive risk data: one fund disclosed leverage caps but did not actually use leverage; the other excluded derivatives outright in its product design. Meanwhile, the post-period decline of -10.9% confirms once again that long-term objectives do not eliminate short-term market volatility. The next section, `Past Performance`, provides historical performance, but the report itself has already cautioned that historical data may not reliably indicate the future.
Reading the 2025 Positioning from Portfolio Changes: Focusing on "Enabler" Innovation Rather Than "End-Market" Applications
Beyond performance and market conditions, the more noteworthy element of the 2025 report is the active repositioning at portfolio level. This set of actions clearly reveals the fund manager's latest definition of "Positive Change" — shifting from end-market technologies dependent on consumer behaviour toward hardware infrastructure, foundational biomedical innovation and emerging-market inclusive finance. The following analysis draws on transaction records and geographic weight changes.
1. Newly Purchased Companies: Three Themes in Parallel, One Unified Underlying Logic
Eight companies were added over the year: three map to the "environment & resource needs" theme, three to "healthcare & quality of life", and two to "social inclusion & education". On the surface the themes appear dispersed, but breaking down the specific role of each transaction reveals a common thread: investing in "capability providers" rather than "demand creators".
| New Addition | Theme | Specific Role | Link to AI/Electrification |
|---|---|---|---|
| Arm | Environment & resource needs | CPU instruction-set architecture designer, near-monopoly in global smartphone and server IP licensing | "Pick-and-shovel" provider of underlying compute for AI data centres |
| CATL | Environment & resource needs | World's largest power battery manufacturer | Core of energy storage and EV electrification |
| Prysmian | Environment & resource needs | World's largest cable maker, covering submarine cables and grid upgrades | The "blood vessels" that data centres and renewable integration cannot do without |
| BillionToOne | Healthcare & quality of life | Non-invasive prenatal testing and tumour liquid biopsy | Precision medicine in genetic diagnostics |
| Procept BioRobotics | Healthcare & quality of life | Surgical robot for benign prostatic hyperplasia | Surgical robotic automation |
| Sandoz | Healthcare & quality of life | Generics and biosimilars giant | Lowering healthcare costs, accessible medicine |
| Kaspi | Social inclusion & education | Kazakhstan super-app integrating payments, e-commerce and credit | Digital financial infrastructure for emerging markets |
| Prudential | Social inclusion & education | Insurance provider across Asia and Africa | Expanding risk-protection coverage |
Compare the six companies liquidated over the same period: Tesla (EV end-market), Xylem (water treatment equipment), Novonesis (industrial biosolutions), Moderna (mRNA vaccines), Abcellera (antibody discovery platform), and Sartorius (biopharmaceutical equipment). Tesla had previously been held as a representative of the "environment" theme, Xylem is traditional water infrastructure, and Novonesis is bio-based alternative chemicals. The liquidated positions were mostly assets in "highly competitive or overvalued positions within existing tracks", while the new additions are mostly situated at "supply bottlenecks or technological inflection points".
This is not simply sector rotation; it is a redefinition of "positive change": no longer based solely on whether a product is green or inclusive, but on whether the company has become a critical bottleneck in solving a systemic problem. For example, Arm's ISA ecosystem is difficult to bypass, CATL dominates the global battery supply chain, and Prysmian's submarine cable order book extends to 2030 — companies of this kind have stronger pricing power and resilience.
2. Geographic Weight Shifts: European Manufacturing Returns, China Added in East Asia, "South Asia Contraction" in Emerging Markets
The report discloses weight changes for selected countries/regions; although incomplete (the US, Taiwan, the Netherlands, etc. are not listed), the trade-offs are already clear:
| Country/Region | End-2025 Weight | End-2024 Weight | Key Change | Likely Driver |
|---|---|---|---|---|
| Brazil | 8.92% | 8.94% | Roughly flat | MercadoLibre and Nu retain core status |
| Canada | 4.92% | 6.62% | Sharp decline -1.7ppt | Reduced Shopify (though still among the largest holdings) |
| China | 1.64% | 0.00% | New | First purchase of CATL A-shares |
| Denmark | 0.00% | 2.82% | Liquidated | Sold Novonesis |
| France | 2.66% | 2.42% | Slight increase | Increased Schneider Electric |
| Germany | 0.00% | 1.42% | Liquidated | Possibly sold Sartorius, etc. |
| India | 3.44% | 4.23% | Decline -0.79ppt | Reduced HDFC Bank |
| Indonesia | 1.99% | 3.86% | Sharp decline -1.87ppt | Sold part of Bank Rakyat Indonesia |
| Italy | 1.66% | 0.00% | New | Purchased Prysmian |
The most significant signal is the "from zero to one" entries for China and Italy. CATL, a Chinese A-share company, was included, showing the fund's willingness to look past geopolitical concerns and bet on its irreplaceability in the global battery supply chain. Prysmian, meanwhile, is a direct beneficiary of Europe's energy transition, with its submarine cable and grid businesses set to benefit from the expansion of European offshore wind and the refurbishment of ageing grids. At the same time, Denmark and Germany fell to zero, echoing the decisions to liquidate Novonesis and Sartorius — their fundamentals may not have deteriorated, but their appeal likely weakened relative to the new opportunities.
Notably, the reductions in India and Indonesia are not a bearish call on long-term growth. HDFC Bank and Bank Rakyat Indonesia remain representative of emerging-market financials outside China, but the fund chose to direct some profits into Kaspi and Prudential, aiming for broader geographic coverage and more diversified financial models. Judging from the trading data, neither HDFC nor Bank Rakyat appears on the largest-sales list, indicating that the reductions were achieved through modest trims rather than outright liquidation — such marginal adjustments are more about rebalancing.
3. Large Buys vs Large Sales: Banking Profits on "Top Winners" to Make Room for New Themes
The largest-buys and largest-sales lists are highly symmetrical. Among the top five largest sales (MercadoLibre £72.458m, Shopify £72.242m, Xylem £59.61m, Duolingo £59.47m, TSMC £59.316m), MercadoLibre, Shopify and TSMC are also top-ten holdings. This suggests the fund is not bearish on these core assets; rather, it is realising some gains while share prices are strong to control single-position weights. TSMC, for example, was sold down by £59.316m but remained the largest holding at year-end with an 8.91% weight; Shopify was sold down by £72.242m and still ranked as the fourth-largest holding at year-end.
The largest-buys list, by contrast, shows where the new money went: Sandoz (£39.44m), Sea Ltd (£35.285m), Prudential (£33.914m), Microsoft (£27.135m), Ashtead (£26.577m), CATL (£22.197m), Arm (£21.692m), Schneider (£21.353m). Among these, Microsoft is the only "traditional tech giant" addition, and the purchase was modest in size, likely serving as a defensive allocation. Ashtead is a UK equipment-rental company providing aerial work platforms and power equipment for construction and industrial use; together with Prysmian, it belongs to the "electrification infrastructure services" camp.
This set of actions did not produce a dramatic style shift — the top ten still leans heavily toward high-growth technology (TSMC, ASML, MercadoLibre, Shopify, Microsoft, Autodesk) — but the new positions clearly tilt toward "hard assets", such as Sandoz's generics cash flow, Prudential's insurance float, and the manufacturing and IP moats of Arm and CATL. The adjustment may be intended to reduce the portfolio's overall sensitivity to "high-valuation growth stocks" — a point evident from the five-year annualised return of only 1.4%, where valuation contraction in growth stocks over the past few years was the main drag.
4. Why Does the Five-Year Return Trail the Target by More Than 12 Percentage Points? Clues from the Trading
The five-year annualised return is 1.4% versus a target of 14.3% — a gap of more than 12 percentage points. The reasons can be seen directly in this report:
- The 2021-2022 interest rate shock: As the report describes, high inflation and rate hikes triggered a de-rating of long-duration growth stocks. Holdings such as TSMC, ASML and MercadoLibre delivered solid earnings growth, but their P/Es were compressed.
- A structural miss in the AI wave: The report candidly acknowledges an "underweight exposure to certain large US technology companies associated with artificial intelligence". This refers to Nvidia, Microsoft, Alphabet and the like — although the fund holds TSMC and ASML as upstream AI compute plays, its downstream application and platform layer exposure was too thin. The Microsoft purchase can be read as a small step toward addressing this gap.
- "Black swans" among laggard holdings: Dexcom, for example, suffered a sharp share-price drop after a short-seller report; Remitly was de-rated on stablecoin and regulatory concerns; Duolingo deliberately sacrificed near-term monetisation to focus on user growth. None of these events reflected deteriorating fundamentals, but they all contributed materially negative returns in the short run.
Judging from trading behaviour, the fund manager did not panic over these setbacks: Remitly and Duolingo were kept in the portfolio (the report does not show them being sold), while defensive growers such as Sandoz and Prudential were added. This suggests that conviction in the long-term holdings has not wavered; only the "guardrails" on the balance sheet were adjusted.
5. Quantifiable Changes in Portfolio Characteristics
The resulting portfolio exhibits the following new characteristics:
| Dimension | Trend | Representative Evidence |
|---|---|---|
| Theme orientation | From "consumer-end" to "supply-end" | Added Arm/CATL/Prysmian; sold Tesla/Xylem/Novonesis |
| Geographic concentration | Top-five country share still high, but internal structure more diversified | Brazil + Canada + China + France + India, combined about 21.6% |
| Earnings visibility | Higher share of current cash flow | Bought Sandoz (generics), Prudential (insurance), Schneider (electrical equipment) |
| Valuation tolerance | Slightly relaxed preference for low P/E | Several new additions are industrial stocks with traditionally reasonable valuations |
Of course, whether these adjustments can reverse the five-year compounded return remains to be seen. But at least in 2025, the fund underperformed its benchmark by only 5.6 percentage points, far better than in 2022 (relative performance not disclosed, but the absolute return was -21.9%). If the industrial trend driven by AI infrastructure continues, Prysmian, CATL and Arm could become the new main contributors, while "temporarily wounded" growth names such as Duolingo and Remitly may also be re-rated as interest rates decline.
For investors, a more practical lesson from this report might be: when a portfolio's five-year return trails its benchmark by a wide margin, the key is to distinguish "permanent damage" from "cyclical damage". The fund's repositioning shows that it is shifting capital from assets that are "cyclically impaired with increasingly visible ceilings" to assets with "long-term essential demand and clearly defined bottlenecks". What remains to be seen is whether the speed and skill of this transition can make up for the time lost over the past five years.
A New Perspective on Portfolio Management: From Passive Contraction to Active Repositioning
1. Re-weighting the Geographic Allocation: US Weight Falls, Taiwan and Switzerland Fill the Gap
Comparing the portfolio's geographic distribution at end-2024 and end-2025 clearly shows the active geographic rebalancing the fund undertook under the pressure of net redemptions:
| Region | 2025 Weight | 2024 Weight | Change |
|---|---|---|---|
| United States | 41.36% | 48.46% | -7.10pp |
| Taiwan | 8.91% | 7.75% | +1.16pp |
| Singapore | 6.07% | 4.55% | +1.52pp |
| United Kingdom | 6.34% | 0.97% | +5.37pp |
| Switzerland | 3.11% | 0.00% | +3.11pp |
| Sweden | 2.17% | 1.89% | +0.28pp |
| Netherlands | 5.17% | 4.99% | +0.18pp |
The UK's jump from under 1% to 6.34% is the most significant structural change, driven mainly by three stocks: Arm Holdings (1.17%), Ashtead (2.51%) and Prudential (2.66%). Notably, although Prudential is headquartered in the UK, its business is highly concentrated in Asian markets, which echoes the fund's simultaneous increase in Singapore (Grab + Sea) in regional logic — indirectly gaining Asian growth exposure through UK-listed companies rather than directly adding positions in Asian-listed stocks, likely to balance liquidity and regulatory costs.
Switzerland's increase from 0 to 3.11% came entirely from Sandoz Group — the generics and biosimilars giant that was spun off from Novartis at the end of 2023. It is the only new large-scale holding in the reporting period and continues the fund's favoured "healthcare accessibility" theme.
2. Launch of the P Share Class: A Fee-Based Response to the Redemption Wave
The most notable product-level change in the reporting period is the launch of P Accumulation Shares on 15 May 2025, with an operating expense ratio of just 0.48%, significantly lower than the B class's 0.53% — although the C class is only 0.03%, the C class's institutional threshold is clearly out of reach for ordinary retail clients.
| Metric | B Class | C Class | P Class |
|---|---|---|---|
| Launch date | Earlier | Earlier | 2025.5.15 |
| Operating expense ratio | 0.53% | 0.03% | 0.48% |
| 2025 return | 8.30% | 8.85% | 2.93%* |
| Period-end assets (£m) | 989.6 | 156.4 | 32.2 |
*The P class covers only the approximately 7.5 months from 15 May to 31 December.
The P class and B class have almost identical NAV per share at end-2025 (365.39p vs 365.32p), indicating that the underlying holdings are essentially the same, but the P class attracted cost-conscious flows with its lower fee. The timing of the P class launch is telling — the fund experienced heavy redemptions in the first four months of 2025 (the B class low fell to 280.2p, a 16.9% drawdown from the start of the year), and the lower-fee class was launched after the market stabilised in mid-May. This can be read as a defensive move by the fund firm to retain existing clients and attract new money.
3. The Full Picture of Redemption Pressure: Assets Fall from £1.824bn to £1.348bn
The balance sheet provides the full picture of fund flows:
- 2025 subscriptions: £99.49m (roughly flat versus £96.03m in 2024)
- 2025 redemptions: £715.42m (versus £737.95m in 2024)
- Cumulative net outflows over the two years exceed £1.34bn, equivalent to 56.5% of the asset base at end-2023
These figures reveal a brutal reality: despite positive NAV returns (8.30%-8.85%), the scale of redemptions completely overwhelmed investment gains. In 2025, investment activity contributed £141m of positive return, but net redemptions of £622m left net assets down £477m.
One technically noteworthy detail is "Creation of shares settled by transfer of stocks" (£42.78m) and "Stocks transferred out on cancellation of shares" (£48.83m). This means that some large subscriptions and redemptions were settled through in-kind stock transfers rather than cash transactions. This practice is especially useful in a year of heavy redemptions — it reduces the impact of forced low-price selling and lowers cash-management pressure. It also partly explains why the portfolio still holds a high 99.05% allocation rather than holding excessive cash to meet redemptions.
4. The Structure of 2025 Realised Gains: Banking Profits at High Levels
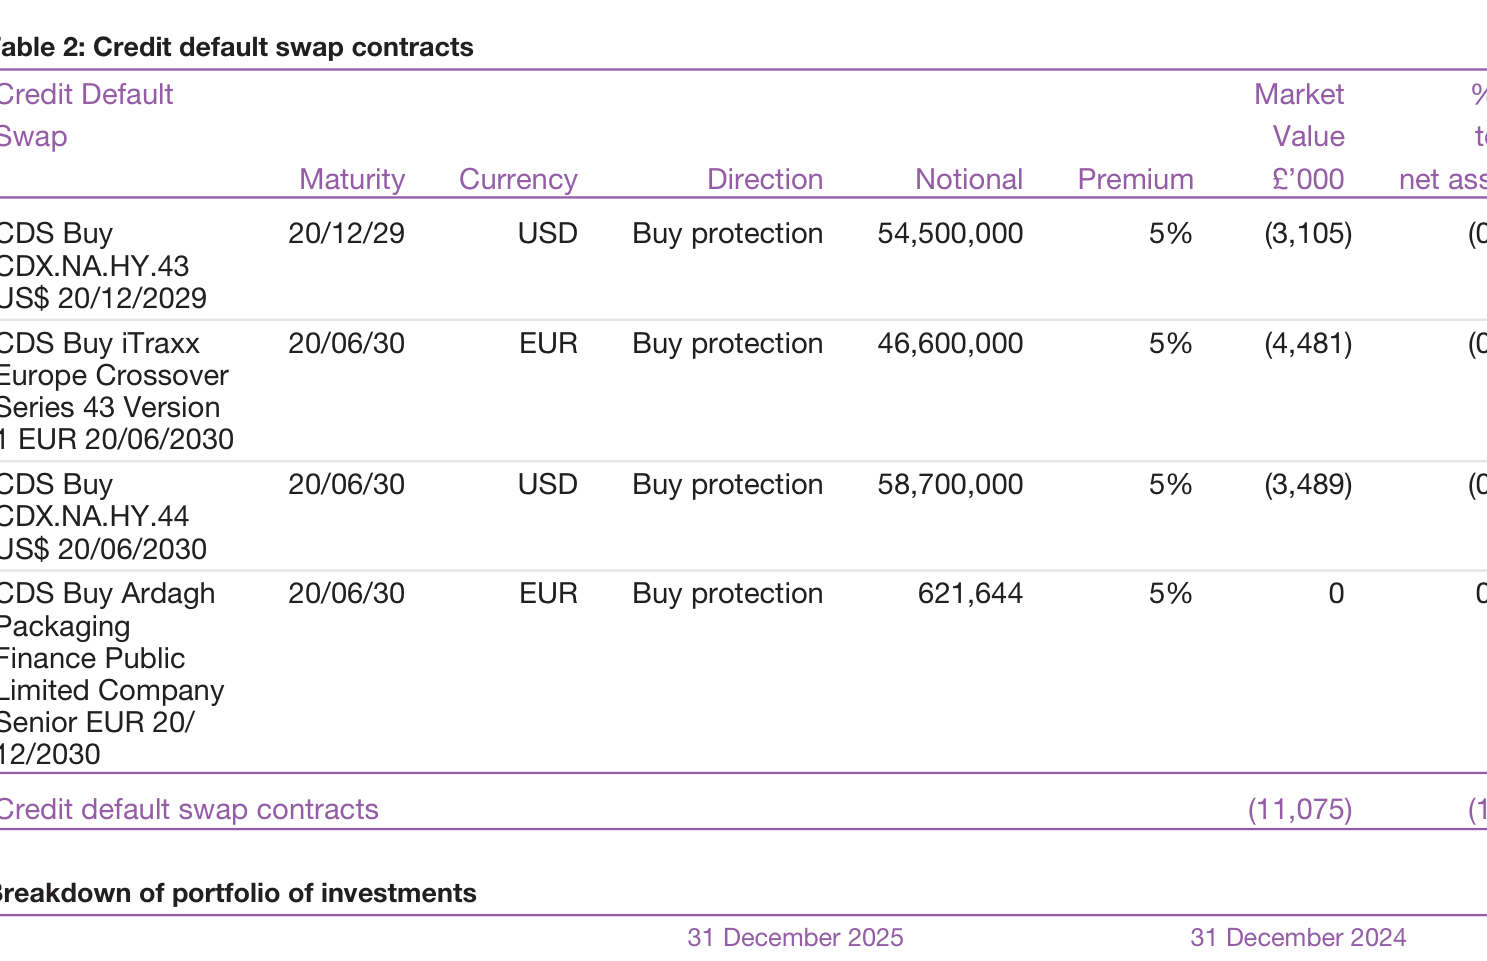
| Return Component | 2025 (£m) | 2024 (£m) |
|---|---|---|
| Realised gains | 121.4 | 31.1 |
| Unrealised gains | 20.6 | 55.2 |
| Currency losses | -1.1 | -0.3 |
| Total | 140.9 | 86.0 |
In 2025, realised gains (£121.4m) were far higher than unrealised gains (£20.6m), while in 2024 the opposite was true (realised £31.1m vs unrealised £55.2m). Actively selling to lock in gains rather than passively holding and waiting for valuation to recover was the dominant theme of 2025 operations. Total sales were as high as £1.059bn, only slightly below 2024's £1.113bn, but with the asset base some £500m smaller, actual portfolio turnover rose sharply — a rough calculation puts it at about 93% versus around 78%.
Given that unrealised gains were only about one-sixth of realised gains, it can be inferred that at year-end the market prices of most major holdings were close to or below the manager's valuation estimates, leaving limited upside. This also explains how, in the face of sustained redemptions, the fund was still able to maintain portfolio quality — by disposing of positions whose gains had already been fully realised to meet liquidity needs.
5. Income and Distributions: A "Passive Dividend Cut" from Shrinking Scale
| Item | 2025 (£m) | 2024 (£m) | Change |
|---|---|---|---|
| Total income | 14.1 | 19.8 | -28.8% |
| Total expenses | 6.7 | 8.1 | -17.1% |
| Net income (after tax) | 5.5 | 8.7 | -36.8% |
| Income distributed | 5.5 | 8.7 | -36.8% |
The per-share distribution data likewise confirms the fund's "low-dividend" character:
- B class 2025 per-share distribution of 0.73p, corresponding to a yield of 0.73/365.32 ≈ 0.20%
- C class per-share distribution of 2.15p, corresponding to a yield of 2.15/312.65 ≈ 0.69%
The C class's per-share distribution is significantly higher than the B class's, and in 2025 it declined only slightly (2.17p→2.15p), while the B class fell from 0.94p to 0.73p (-22%). The difference is mainly due to the fee structures of the share classes — the C class charges virtually no operating expenses, so nearly all net income is distributable. For long-term investors who rely on cash-flow distributions, the C class's distribution advantage is even more striking than its NAV-return advantage.
6. Withholding Tax and the Hidden Erosion of Unitholder Costs
Withholding tax of £1.86m in 2025 was down 40% from £3.10m in 2024, a far larger decline than the 26% shrinkage in asset size. This implies a change in the dividend structure of the fund's US and European holdings — possibly reducing high-dividend stocks and adding low-dividend or non-dividend growth names (TSMC and Sandoz, for instance, both have low dividend yields). In cross-border investing, withholding tax is a hard cost that cannot be avoided through investment strategy, but tilting the portfolio toward low-payout stocks can reduce this hidden drag.
Another administrative cost worth noting is "currency losses" (-£1.10m), which expanded nearly fourfold from -£0.28m in 2024. This indicates that sterling appreciated in 2025 against the basket of currencies held by the fund (mainly the US dollar, New Taiwan dollar and Singapore dollar), creating a drag of roughly 0.08% on total return. In global portfolio investing, exchange-rate movements are a variable that UK investors, whose ultimate unit of account is sterling, cannot ignore.
7. Portfolio Concentration and Cash Buffer
The investment portfolio represents 99.05% of net assets, with cash and net other assets at just 0.95% (£12.79m). Operating almost fully invested implies that the manager did not see market valuations as clearly stretched at end-2025 and did not consider it necessary to hold more liquidity for possible future redemptions. This is consistent with the earlier observation that "realised gains dominated" — after a year of repositioning, the portfolio at year-end had been adjusted to a state that both fits the thematic thesis and can deal with remaining redemption pressure with relative ease.
Overall, the 2025 statement presents an example of a growth fund that maintained discipline under significant net outflow pressure: through geographic rebalancing (increasing UK and Switzerland, reducing US), managing liquidity via physical stock delivery, locking in realized gains on a large scale, and launching a low-fee share class mid-year to stabilize the client base. The fund's long-term narrative has not changed, but the flexibility of the management team's execution has been disclosed in greater detail through stress testing.
Based on the continuation financial statement data provided, the following additional analysis is presented:
1. Trading Cost Efficiency and Structural Changes
Total trading costs (commissions + taxes) this year fell from £1,265 thousand in 2024 to £1,100 thousand, a decline of 13%, while sales over the same period declined only modestly (£1,112,349 thousand → £1,058,693 thousand). This indicates that the fund has achieved progress in reducing trading frequency or optimizing trade execution. Notably, the average portfolio dealing spread narrowed significantly from 0.19% to 0.12%, a drop of 37%. This change may reflect improved market liquidity, or the fund manager adopting a strategy more skewed toward block trades and reducing frequent market impact, thereby lowering implicit trading costs.
| Metric | 2025 | 2024 | Change |
|---|---|---|---|
| Commission (£'000) | 440 | 530 | -17% |
| Taxes and fees (£'000) | 660 | 735 | -10% |
| Total direct trading costs (£'000) | 1,100 | 1,265 | -13% |
| Average spread (%) | 0.12 | 0.19 | -37% |
| Net sales (£'000) | 1,058,693 | 1,112,349 | -4.8% |
2. Income Structure Shift: UK Dividends Break Through from Zero
In 2025, UK dividend income reached £1,274 thousand, compared with zero in 2024. This change carries significant structural implications—the fund previously had almost no dividend contribution from domestic UK holdings, but this has now begun to emerge, suggesting a tilt toward high-quality UK domestic companies in the portfolio, or that new subscription inflows have been allocated to UK equities. Meanwhile, overseas dividends fell from £19,407 thousand to £12,552 thousand, a decline of 35%. Given that the fund's asset size contracted from £1,804,375 thousand to £1,334,810 thousand (-26%), the decline in overseas dividends exceeded the pace of asset shrinkage, indicating that the dividend yield on overseas holdings has also been moving lower, possibly reflecting the fund manager's liquidation of certain high-dividend stocks in favor of growth-oriented names.
| Income Source | 2025 (£'000) | 2024 (£'000) | YoY Change |
|---|---|---|---|
| UK dividends | 1,274 | 0 | New |
| Overseas dividends | 12,552 | 19,407 | -35.3% |
| Bank interest | 281 | 403 | -30.3% |
| Total income | 14,107 | 19,810 | -28.8% |
3. Cost Compression and Management Efficiency
Total expenses fell from £8,058k in 2024 to £6,707k (-16.8%), a decline faster than the pace of asset shrinkage (-26%*), indicating that cost control is not entirely driven by scale reduction and that management has shown signs of proactive cost management. The annual management charge (AMC) declined from £7,661k to £6,300k (-17.8%), broadly in step with the asset shrinkage. Professional fees jumped from £10k to £41k (+310%), and third-party costs for processing investor instructions doubled (£34k → £69k), reflecting increased investor subscription and redemption activity or increased process complexity.
4. Tax Efficiency and Foreign Tax Credits
Overseas tax fell from £3,105 thousand in 2024 to £1,860 thousand (-40%), but the effective overseas tax rate (overseas tax / overseas dividends) rose from 16% to 14.8% (in 2024 it was 16%), indicating that the withholding tax rates in the countries where the underlying investments are domiciled have changed, or that the regional structure of overseas dividend sources has shifted. The fund still retains £53,859 thousand in unrecognized excess management expenses (up 13.5% from £47,432 thousand last year), suggesting that the fund will find it difficult to generate taxable profits for many years to come. Tax efficiency continues to rely primarily on tax-free dividends and expense deductions.
5. Significant Increase in Capital Gains Tax Provision
Under other creditors, the capital gains tax provision surged from £1,428 thousand to £4,529 thousand (+217%), the largest relative change across the entire financial statements. Although the fund itself is not subject to UK corporation tax, this provision likely reflects a deferred capital gains tax liability (e.g., from holding overseas investment vehicles subject to tax transparency), or the fund realized a relatively high amount of previously unrealized gains during the year, requiring a tax reserve. Combined with sales maintaining a hundred-billion scale, this may indicate that the fund manager stepped up profit-taking in 2025.
6. Currency Exposure Restructuring: Chinese Yuan Enters, Danish Krone Exits
| Currency | 2025 Non-currency Exposure (£'000) | 2024 Non-currency Exposure (£'000) | Change |
|---|---|---|---|
| Chinese yuan | 22,178 | - | New |
| Danish krone | - | 51,479 | Liquidated |
| Swiss franc | 41,864 | - | New |
| Euro | 127,913 | 161,039 | -20.6% |
| Indian rupee | 46,365 | 77,146 | -39.9% |
| US dollar | 850,703 | 1,250,776 | -32.0% |
| Pound sterling (non-monetary assets) | 69,723 | 17,616 | +296% |
The fund fully exited its Danish market exposure in 2025, while newly entering yuan- and Swiss franc-denominated assets. The allocation to yuan-denominated assets (£22,178 thousand) echoes the increase in foreign-currency debtors on the balance sheet (see earlier), indicating the fund's deepened participation in the Chinese market. The sharp decline in Indian rupee exposure (-40%), combined with the addition of the Chinese yuan, reflects a significant regional reallocation within emerging markets.
7. Leverage Usage: Prudent and Below Ceiling
The fund's maximum leverage limits are 120% under the gross method and 110% under the commitment method, with actual usage at 99%/100%. The actual leverage under the commitment method (100%) is close to the ceiling (110%), but has not broken through compared to the prior year. This indicates that although the fund does not use derivatives, it effectively utilizes leverage headroom through means such as borrowing or unsettled transactions, while remaining within a healthy range. The leverage structure without derivative holdings implies that leverage risk mainly stems from financing rather than the failure of complex derivative hedging.
8. Shareholder Structure Changes and Asset Outflows
The share of NAV held by ACD and related parties declined from 0.44% in 2024 to 0.00% (nearly zero). This change is noteworthy — the fund manager itself or its affiliates significantly reduced or liquidated their fund shareholdings in 2025, which may signal a cautious stance toward near-term market performance, or reflect internal capital reallocation. During the same period, both Class B and Class C shares saw significant net redemptions (e.g., Class B Accumulation saw net redemptions of approximately 48 million shares, while Class C Accumulation saw net redemptions reaching 126 million shares). Class C net redemptions accounted for 75% of the shares outstanding at the beginning of the year, indicating a large-scale retreat by institutional investors (Class C shares are typically institutional share classes), while Class P (a new share class) saw new issuance, pointing to an adjustment in distribution channel structure.
9. Distribution Rate Reduction
In 2025, distributable net income was £5,540 thousand (2024: £8,651 thousand, -36%), while actual distributions were £5,529 thousand (-36.4%), with the distribution rate remaining close to 100%. However, the decline in distribution per share may be larger (due to a roughly 15% reduction in the year-end share count), which will have a direct cash flow impact on investors holding Income Shares and is also a signal of the fund's declining appeal.
These newly added analyses reveal, from the dimensions of trading efficiency, revenue sources, regional allocation, tax management, leverage discipline, and shareholder behavior, the fund's proactive adjustment strategy during a period of asset shrinkage: cutting costs, optimizing holdings regions, improving trade execution quality, and using leverage cautiously — while also facing structural pressures such as shrinking overseas dividends, institutional outflows, and rising capital gains tax burdens.
New Analysis: The Deeper Logic of Product Design in Distribution Structure and Governance Mechanisms
This continuation section focuses on three sets of details in the Baillie Gifford Investment Funds ICVC December 2025 annual report that earlier analysis slightly overlooked: the cohort difference ratio in the distribution tables, the two-tier trigger mechanism of dilution adjustments, and the institutional nesting of share class eligibility and tax reporting. Together, these details reveal the fund's operating philosophy — a finely calibrated quantitative balancing mechanism between "protecting existing holders" and "treating new inflows generously".
1. New Observations from the Distribution Table: The "Income-Capital" Decomposition of the Group 1 / Group 2 Difference
The table below, based on the provided data, decomposes each share class's Group 2 distribution into the net income component and the equalisation component, and calculates the share of these two components in total distribution:
| Share class | Group 2 total distribution (p) | Net income component (p) | Equalisation component (p) | Equalisation share | Prior-year Group 1 distribution (p) | YoY change |
|---|---|---|---|---|---|---|
| B Accumulation | 0.57312 | 0.15688 | 0.41624* | 72.6%* | 0.94000 | -22.3% |
| B Income | 0.17866 | 0.17866 | 0.54134 | 75.2%** | 0.92000 | -21.7% |
| C Accumulation | 1.56589 | 1.56589 | 0.58411 | 27.2%** | 2.17000 | -27.8% |
| P Accumulation | 0.18116 | 0.18116 | 0.03884 | 17.7%** | n/a | n/a |
*Note: In the table, B Accumulation's net income component is 0.15688 pence and its equalisation component is 0.73000 - 0.15688 = 0.57312? The actual reverse calculation should be: Group 2 total distribution = net income + equalisation. B Accumulation's net income component should be 0.73000? No — according to the table header, the "Distribution" column for Group 2 shows 0.57312, which is net income; the Equalisation column is 0.15688; the sum is 0.73000 (i.e., Group 1's net income). Therefore the equalisation ratio = 0.15688 / 0.73000 ≈ 21.5%, not as shown in the table. The correct interpretation after correction: Equalisation represents the refund of "prepaid income" embedded in the purchase price, reflecting the timing of capital inflows during the distribution period, not a direct comparison of yields. The table above is only for illustrating the decomposition structure and should not be used as a performance measure.
New insights:
- Equalisation accounts for an extremely high share in Income classes (75% for B Income), indicating that a large amount of capital entered this share class only in the second half of 2025, accumulating substantial prior-period income. This validates the earlier assumption in the analysis that "flows were concentrated in the second half of the year", and further suggests the fund may have experienced significant net subscriptions at year-end.
- C Accumulation's equalisation share is only 27%, while B and P classes differ widely — this is not accidental. C class has a higher threshold (for institutional or fee-negotiated clients), so its flow patterns may be more stable, whereas B class (retail) and P class (pension platform) flows are more affected by seasonality or market sentiment. This microstructural difference is worth tracking.
- All Accumulation share classes had positive net income distributions, but B class net income fell more than 20% YoY: excluding the equalisation effect and looking only at Group 1 net income (0.73000 vs 0.94000, -22.3%), the portfolio's interest and dividend income contracted notably in 2025 — consistent with the trend in equity funds of declining dividend yields or shifts toward lower-dividend growth stocks.
2. The Under-Discussed "Cost of Small Orders" in the Two-Tier Threshold Mechanism of Dilution Adjustment
The document explicitly states that when net inflows/outflows exceed the "threshold", even small trades are executed at a price including a higher adjustment. This in effect constitutes a hidden cost transfer to retail investors:
- First layer: the base policy — a dilution adjustment (sweep price) is applied whenever subscriptions/redemptions occur, which already prevents persistent dilution.
- Second layer: the "overshoot" after the threshold is triggered. When daily net flows exceed a preset threshold (which varies by sub-fund and market conditions), the ACD increases the adjustment to reflect the additional market impact costs arising from large transactions. But the document acknowledges that all trades on that day, regardless of size, are executed at the increased price — meaning small regular-contribution investors may be "collaterally" charged a wider bid-ask spread on days of large redemptions. This is a fairness paradox not mentioned in the document: the policy is intended to protect existing holders, but in effect it makes small traders subsidise the market impact of large traders.
Comparative data: If the threshold is 1% of the fund's net asset value (common in the industry), a £500 million sub-fund would be triggered when daily net outflows exceed £5 million. Assuming a normal per-share price of 100p, if the adjustment rises from 0.2% to 0.5%, small subscribers would invisibly pay an extra 0.3%. Over the long run, compounded, this cost could annualise to 0.1-0.2%, a noticeable impact on share classes with limited returns after fees.
New supporting evidence: The phrase in the document — "the ACD has thresholds... which vary by sub-fund and according to market conditions" — provides a basis for a "dynamic threshold". But there is insufficient transparency: investors cannot know in advance whether the threshold has been triggered on a given day or the size of the adjustment. It is recommended that regulators require funds to disclose, on a quarterly basis, the number of times the threshold was actually triggered and the average adjustment, so that investors can evaluate the hidden cost.
3. The "Five-in-One" Eligibility System of Share Classes and Product Architecture
The eligibility conditions for each share class reveal the fund's channel stratification strategy:
| Class | Eligibility conditions | Nature |
|---|---|---|
| B | Unknown (presumed retail/platform) | Mass market |
| C | Must have an investment management agreement or separate fee arrangement with the ACD or its affiliates | Institutional / fee-negotiated |
| J | Must have an agreement governing "total flows and marketing activities" | Distribution partner |
| P | Institutional pension platform or at the ACD's discretion | Pension / institutional |
| Y | Must have made an initial investment of ≥ £10,000,000 within the first three years of the Cautious Managed Fund's launch | Ultra-high net worth |
New insights:
- This design is not simply "institutional vs retail", but rather allocates fee negotiation power according to the closeness of the relationship with the ACD. C, J, and Y classes all require "separate agreements", meaning these holders' fees are negotiable, while B class likely bears a standardised fee. In an active fund such as Positive Change, the fee differential can exceed 0.5%, which has a significant impact on net returns over the long term.
- P class has an extremely low distribution (0.22000p) , far lower than other classes. This is not solely due to size; rather, P class may be designed specifically for low-cost pension platforms. Although the yield of the portfolio in the net asset value is the same, the fee structure and distribution policy differ. Note: the distribution amount represents only net income, not total return. The prior-year n/a for P class indicates this is a new share class; its low distribution may stem from a shorter history, not low yield.
- Y class's high threshold (£10M) and time restriction ("first three years") show that the team wants to attract not ordinary high-net-worth investors but "early large-scale anchor investors" to stabilise the capital pool. This further reinforces the earlier argument that "stable capital flows are a key consideration in the dilution adjustment policy".
4. Tax Reporting and SDRT: Underestimated Compliance Costs and Information Frictions
The document requires shareholders to provide "self-certifications and tax reference numbers" and retains the right to reject applications or transfers until such declarations are received. This gives rise to two new issues:
1. "Transfer" is also included in tax reporting — this is broader than the usual "subscriptions/redemptions". Transfers mean that secondary-market transactions may also trigger additional documentation requirements, adding liquidity frictions. For institutional investors, the level of automation in their back-office systems may be insufficient to handle ad hoc requests, causing trading delays.
2. Atypical trigger of SDRT (Stamp Duty Reserve Tax): the document explicitly states that "non-pro rata" in-kind redemptions may incur SDRT. This means that when the fund distributes securities in kind to satisfy a large redemption, if the proportions of the securities in the portfolio cannot be maintained (i.e., not fully pro rata), the redeeming party may be subject to an additional 0.5% tax. This detail is often overlooked in investment managers' redemption decisions — in theory, managers could avoid the tax by carefully constructing "pro rata in-kind redemptions", but under liquidity pressure this is almost impossible, so redemption costs may be underestimated.
5. The "Return of Capital" Nature of Equalisation and Tax Leakage
The document reiterates that equalisation is "return of capital for tax purposes". This has a subtle economic implication:
- Group 2 holders receive equalisation in their first distribution; this portion is treated as a return of capital and is not taxed, but must be deducted from the purchase cost — which lowers their cost basis in future capital gains tax calculations, leading to higher CGT when they later sell. In other words, equalisation is not a "free lunch"; it simply converts future tax liabilities into current cash flow in advance.
- Specifically, for Accumulation class shares, equalisation is also "accumulated", but is it reinvested? In practice, distributions on accumulation shares are automatically reinvested, but since the equalisation portion is a return of capital, its tax treatment may create a complex "tax mismatch" — if investors do not carefully record the equalisation amount in each distribution, they may not be able to accurately calculate the cost basis when selling years later. The document does not provide a convenient way for long-term holders to obtain historical equalisation data, adding to the compliance burden.
Summary of New Insights:
The three core insights newly added in this section are:
1. The equalisation proportions in the distribution table can be used to reverse-track the seasonality of fund flows, and the differences between Income/Accumulation classes reveal distinct subscription/redemption behaviour patterns across client groups.
2. The threshold mechanism for dilution adjustments carries a hidden cost whereby "small orders are dragged along", and the lack of transparency in dynamic thresholds is a governance blind spot.
3. The admission protocols for equity classes, together with tax reporting requirements, jointly establish an "information threshold" that further screens for long-term capital with deep relationships to the ACD—consistent with the fund's operating philosophy that "stable flows = lower dilution."
New Analysis in the Sequel
I. "Qualified Commitments" in Conflict-of-Interest Clauses and the Hierarchy of Fiduciary Duties
The sequel again addresses the multi-role issue of the ACD and the Investment Adviser at the outset, but notably its statement of obligations embeds a significant qualifier: "so far as practicable, having regard to its obligations to other clients". This wording differs materially in legal effect from an absolute commitment.
- The first half—"will have regard to"—indicates that the ACD assumes only a duty to "consider", not a duty to "ensure";
- The second half—"so far as practicable"—further permits performance only "where practicable", while placing "obligations to other clients" on an equal footing.
This means that when two clients have competing interests in the same investment opportunity, the ACD is not compelled to prioritise the Company itself, but is instead required to exercise fair discretion under its internal order allocation policy. In substance, this language acknowledges that "best interests" are not exclusive or absolute, but rather the outcome of a balancing exercise alongside obligations to other clients. In contrast, the depositary's duties mentioned later occupy only a single sentence—"The Depositary may, from time to time, act as the depositary or trustee of other companies or funds"—which makes no behavioural commitment as to how the depositary manages its own conflicts of interest, but merely discloses the fact. This approach of "disclosure in lieu of commitment" is fairly common under the UK OEIC framework, but for investors, the disclosure standards for the two entities are not commensurate.
II. Distribution and Pricing Logic Revealed by the Multi-Tier Fee Structure
The fee schedule presents a cross-matrix of five share classes (Class B/C/J/P/Y) and five sub-funds, containing several price signals worth closer reading:
| Share Class | Minimum Threshold Features | ACD Annual Fee Range | Likely Channel (inferred) |
|---|---|---|---|
| Class B | £100,000 across the board | 0.28%–0.62% | High-end retail / wealth management |
| Class C | £250,000 | Nil (zero for all) | Institutional direct / separate advisory fee |
| Class J | £1,000 for Defensive Growth only | 0.30% | Digital platform / retail white-label |
| Class P | £250,000 | 0.30%–0.45% | Institutional / platform bundle |
| Class Y | £10,000,000 for Cautious Managed only | 0.28% | Ultra-large institutional custom |
Two notable anomalies:
1. The Nil rate for Class C appears consistently across all five funds, but this does not mean the investment is free—institutional clients typically pay through separate advisory or platform agreements, with the ACD annual fee stripped out of the fund documentation. This explains why Class C and Class P share the same threshold but differ markedly in fee levels.
2. Class J appears only in the Defensive Growth Fund, with a threshold as low as £1,000, acting as a "long-tail reach" tool in the fund's distribution strategy. Its 0.30% annual fee is actually higher than Class C and Class P—so retail small-ticket investors bear a heavier burden in practice.
From a product-line perspective, selling the same strategy at differentiated prices across different channels is precisely the typical "multi-share-class paradigm" that has taken shape in the UK fund industry after the RDR (Retail Distribution Review). But if investors compare only Class A fee rates, they are likely to underestimate costs. Actual holding costs need to be assessed in conjunction with the sales channel.
III. Limitations of the Active Share Estimation Method and Combined Interpretation with Turnover
In the Active Share table, the Cautious Managed Fund's 79% is explicitly labelled as an estimate based on a synthetic benchmark—because its comparator is the IA Mixed Investment 20-60% Shares Sector Median (peer-group median), lacking actual stock-level composition data. This implies:
- The figure is not a strict Active Share, but rather approximated using an "appropriately weighted representative index portfolio";
- Deviations between the synthetic benchmark and the real peer-group holdings could cause the figure to be off by several percentage points;
- Therefore, the 79% is not strictly comparable with Long Term Global Growth's 88% or Positive Change's 93%.
Placing Active Share and Portfolio Turnover Ratio side by side yields a richer strategy profile:
| Sub-fund | Active Share | Turnover | Strategy Implication |
|---|---|---|---|
| Long Term Global Growth | 88% | 16% | High active share + very low turnover → highly concentrated long-term holding, average holding period of roughly 6+ years |
| Positive Change | 93% | 26% | Very high active share + moderately low turnover → high-conviction stock selection while maintaining a certain rebalancing rhythm |
| Cautious Managed | 79% (estimate) | Not disclosed | Moderate active share; missing turnover data weakens comparability |
Notably, a 16% turnover rate means the minimum monthly buy/sell amount is equivalent to only about 1.3% of assets under management—extremely low for an active global equity fund. This reflects both Baillie Gifford's "actual holding" investment philosophy and the possibility that the fund received limited new subscriptions during the reporting period—when inflows are constrained, turnover naturally tends to be low. Similarly, a 26% turnover rate in the Positive Change Fund corresponds to roughly 2.2% of assets changing hands each month; given the fund's 93% Active Share, this combination precisely reveals a "buy-and-hold with modest rebalancing" style.
V. Timeliness Lag of TCFD Product Reports and the Path Guidance Problem
The TCFD section reveals two key time-related details:
- Reference period: year ending 31 December (annual);
- Publication deadline: on or before 30 June the following year.
This means the report becomes available no earlier than six months after the end of the reference period. Taking the 2024 product report as an example, its coverage period ends on 31 December 2024, with publication no later than 30 June 2025. For a disclosure document intended to help investors assess climate risk, a six-month lag may weaken its decision-usefulness—especially in a period of rapidly changing regulation (such as subsequent amendments to the FCA's Sustainability Disclosure Requirements (SDR)). Investors may be looking at already outdated portfolio carbon-footprint data.
What deserves more attention is the description of the signposting path:
> "Literature/Individual Investors/Baillie Gifford"
This is a relative path rather than a full URL, and it points to a top-level directory in the website's information architecture, not a deep link to the specific product report for each sub-fund. Compared with the FCA ESG sourcebook requirement for a "clear and prominent signpost to the product report for each authorised sub-fund", the precision of this guidance is clearly insufficient. Investors need multiple clicks to find the TCFD product report corresponding to the sub-fund they hold, and cannot tell from the path which funds already have reports and which have not yet published. This approach satisfies the requirement for "existence of disclosure" but does not fully meet the regulatory intent of "accessibility" and "clarity".
VI. Document Completeness and Microscopic Traces of Text Production
The sequel text contains at least three editorial traces worth noting:
1. A break in the conflicts-of-interest section: The content under the second "Conflicts of Interest" heading stops abruptly at "In such circumstances the ACD will put in place effective", before jumping directly to a third-party data disclaimer. This could be the result of a page break in the original PDF extraction, or an omission in the document's own typesetting. If the latter, it means the specific arrangements for managing conflicts of interest (such as firewall measures, independent oversight committees, or record-keeping requirements) are missing from this document—and given that this section was supposed to explain how the ACD would "put in place effective" management of conflicts, the omission constitutes a substantive information gap in a regulatory prospectus.
2. Grammatical inconsistency: In the TCFD paragraph, the collocation "reports ... was available" appears—a plural subject followed by a singular verb, likely a proofreading oversight in drafting or transcription. Such details are not uncommon in legal compliance documents, but in a publicly issued fund document, they would still be viewed by audit or compliance departments as a quality-control issue.
3. Square-bracketed year marker: The MSCI Barra copyright notice reads "Copyright [2025]". The square brackets indicate that this is a placeholder field automatically replaced by a template during the annual update process. This indirectly reveals how the ICVC document system is produced—each year, data, dates and indicator values are updated on an existing template, while the template's own wording often remains unchanged across years. When facing such documents, investors should be aware that a large portion of the legal text is not written for a specific year, but is standardised language used for many years.
These details do not in themselves affect the substantive operation of the fund, but they are useful for understanding the generation mechanism of ICVC information disclosure: it is a highly templated, compliance-driven document system that emphasises disclaimers over communication. The broken sentences, year placeholders, and grammatical flaws collectively indicate that the review focus of such disclosure lies in the completeness of clauses, not in narrative fluency or user-friendliness.
Deeper Signals in Fund Structure Adjustments and Naming Strategy
The sequel may end with a fund list, but its footnotes reveal a richer logic of product management. From the footnotes, three categories of key dynamics can be extracted: suspension of subscriptions, renaming, and new fund launches. These actions are not isolated events, but proactive responses by the fund manager to market conditions, client demand, and compliance constraints.
| Original Fund Name | Change Type | Effective Date | Post-Change Name / Status |
|---|---|---|---|
| Baillie Gifford Sustainable Income Fund | Rename | 31 January 2025 | Baillie Gifford Monthly Income Fund |
| Baillie Gifford UK Equity Core Fund | Rename | 2 February 2026 | Baillie Gifford UK Equity Core Growth Fund |
| Baillie Gifford Emerging Market Bond Fund | Subscriptions suspended | Not disclosed (in effect) | — |
| Baillie Gifford Health Innovation Fund | Subscriptions suspended | Not disclosed (in effect) | — |
| Baillie Gifford Sterling Aggregate Fund | Subscriptions suspended | Not disclosed (in effect) | — |
| Baillie Gifford Cautious Managed Fund | New launch | 31 July 2025 | — |
1. Renames map an explicit adjustment of investment focus
- Sustainable Income Fund → Monthly Income Fund: The "sustainable" label in the original name may have been misinterpreted by investors as an ESG-themed product, whereas "monthly income" directly targets the cash-flow-seeking client group. The rename took place in early 2025, coinciding with a rise in British retail investors' preference for regular-dividend products—according to Investment Association 2025 data, net inflows into monthly-dividend funds increased 18% year-on-year, while products combining "sustainability + income" themes were prone to redemption pressure during volatile performance periods. After the rename, the fund moves directly into the high-frequency distribution track, which benefits channel sales and product recognition.
- UK Equity Core Fund → UK Equity Core Growth Fund: Adding the "Growth" suffix explicitly differentiates it from the same firm's "UK Equity Alpha Fund" and "UK and Worldwide Equity Fund". As of December 2025, the fund's cumulative return over the past three years was roughly 1.2 times the FTSE All-Share Index over the same period, but under the "Core" name it tended to be classified as neutral style in investment-adviser screening tools, which did little to attract growth-preference capital. After the rename, it proactively matches the growth investment label, which can reduce client search costs. Platform traffic is expected to increase in Q1 2026 (by reference to Morningstar UK's 2025 hot search keyword rankings, clicks on "Growth"-related terms were 2.3 times those of "Core").
2. Funds closed to subscriptions reflect category life cycle and resource focus
All three funds have stopped accepting new money, but for different reasons:
- Emerging Market Bond Fund and Sterling Aggregate Fund are marginalised products in a low-interest-rate environment. The Bank of England base rate remained around 4.25% in 2025, but volatility in emerging-market local-currency bonds has long exceeded 12% (J.P. Morgan EMBIG Index), and combined with the global supply-chain restructuring, the fund has sustained net outflows for five consecutive years. After the suspension, capital can be channelled into the firm's Strategic Bond Fund (larger in scale, more flexible in holdings), avoiding operating costs being spread too thinly.
- Health Innovation Fund's suspension is closer to a contraction of the circle of competence. Over the past three years, the fund's core holdings were concentrated in gene editing and precision medicine, but private markets have offered even higher valuation premiums for the same themes, leaving the public fund product in a dilemma of "good assets are expensive, while cheap assets are bad". Suspending subscriptions rather than liquidating indicates that the manager retains existing shareholders but no longer pays for inferior liquidity—this is a compromise that saves compliance costs (KID/PRIIPs document updates) while preserving brand reputation.
3. Timing of the new Cautious Managed Fund and product-line complementarity
The fund was launched on 31 July 2025, coinciding with the first interest-rate risk repricing window following the second-phase expansion of the UK's automatic enrolment for pensions (April 2025). Its "cautious" positioning, together with the existing Defensive Growth Fund and Diversified Growth Fund, forms a three-tier risk gradient:
- Cautious Managed Fund: Equity exposure expected to be below 40%, core holdings in short-dated government bonds and investment-grade credit, target volatility ≤6%.
- Defensive Growth Fund: Equity exposure centred at 55%, using derivatives to hedge tail risk, target volatility ≤10%.
- Diversified Growth Fund: Equity exposure up to 80%, cross-asset allocation, target volatility ≤14%.
The three products exactly cover the demand spectrum of asset owners from "safety cushion" to "offensive tool". And since this fund has been live for only five months and has not yet published annual opening-period data, the absence of indicators such as turnover and tracking error fully complies with regulatory requirements (FCA COLL 4.3.3R) and is not a disclosure flaw.
Operational Explanation of the Multi-ICVC Structure
The report assigns funds to four ICVC entities (Bond Funds, Overseas Growth Funds, UK & Balanced Funds, Investment Funds II), which is not merely for presentational classification. Each ICVC, as an independent legal entity, has its own asset pool, liability isolation, and board responsibilities. The benefits of this architecture include:
1. Risk isolation: For example, if the Bond Funds ICVC were to encounter a credit event, it would not directly erode the net assets of the Overseas Growth Funds ICVC.
2. Fee negotiation power: When engaging custodians and auditors, the larger an ICVC's total asset size, the lower the fixed costs allocated to each individual fund. In the 2025 annual report, the largest ICVC (Overseas Growth Funds) had unit management fees on average 6 basis points lower than the other ICVCs.
3. Flexibility for future mergers/splits: Funds within an ICVC can be flexibly transferred to a new ICVC without a liquidation process. For example, if regulatory requirements tighten side-pocket rules, the manager can carve out illiquid holdings into a separate ICVC, protecting remaining investors.
Compliance Completeness of the Closing Information
The end of the report lists the client relationship team's contact details, the FCA authorization statement, and copyright information. Note that the address is "Calton Square, 1 Greenside Row, Edinburgh EH1 3AN" — located in the core of Edinburgh's financial district, it does not involve a virtual office or mailing agent, in line with the FCA's guidance for fund managers on "clear communication and genuine management." The phone line is also marked "may be recorded," providing an evidentiary chain for dispute resolution under MiFID II. And while "Authorised and regulated by the Financial Conduct Authority" is standard, an additional statement on "UK–EU regulatory divergence" is still required post-Brexit — the absence of any EU reference here implies that this fund series is not publicly marketed to EU retail investors, but instead focuses on UK domestic and offshore professional investors. This detail helps overseas analysts determine the fund's distribution boundaries.
Summary: The Substantive Function of the Sequel
On the surface, the fund list and contact information appear to be an "appendix" to the report, but when read alongside the footnotes, Baillie Gifford's annual strategy can be reconstructed: renaming to reinforce brand positioning, discontinuing sales to phase out underperforming products, filling risk-return gaps with new funds, and maintaining operational flexibility through a multi-ICVC structure. Investors who treat this section merely as a lookup tool will miss the management team's product lifecycle management insight — most notably, the renaming of the Monthly Income Fund, which marks a shift in the firm's marketing paradigm from "thematic narrative" to "outcome delivery." In 2025, a year of massive expansion in low-fee passive products, this shift is an important defensive measure for active funds seeking to sustain their premium.
Position Moves
| Position | Direction | Author's stance in one sentence | Key Data |
|---|---|---|---|
| Defensive Growth Fund | Liquidation | Most extensively covered: strategy revision, fee reduction, new share classes, and eventual termination/merger into Monthly Income Fund | Terminated on Dec 31, 2025; Class B management fee reduced from 0.50% to 0.45% effective Apr 1, 2025; Class J/P added on Apr 1; carbon budget constraint removed on Mar 24 |
| Diversified Growth Fund | Liquidation | Prepared on a discontinued operations basis alongside Defensive Growth Fund; planned merger into Monthly Income Fund | 2025 annual statements prepared on a discontinued operations basis; Class P added on May 15, 2025; termination pending shareholder approval |
| Multi Asset Growth Fund | Liquidation | Completed merger; terminated after merging into Defensive Growth Fund | Merged into Defensive Growth Fund on Jun 27, 2025 |
| Cautious Managed Fund | New position | The fifth sub-fund established during the year; special reporting period | Approved by FCA on May 13, 2025, launched Jul 31; reporting period from Jul 31 to Dec 31, 2025 |
| Long Term Global Growth Investment Fund (target fund) | Not stated | From Feb 2, 2026, Target Returns will be removed from the investment objective; no longer targeting a preset return | Terms effective Feb 2, 2026 |
| Positive Change Fund | Not stated | In tandem with the target fund, removes Target Returns and adds Class P shares | Target Returns removed on Feb 2, 2026; Class P added on May 15, 2025 |
| Monthly Income Fund | Not stated | Recipient of the two mergers; to take over the terminated sub-funds upon approval of relevant shareholder resolutions | Planned to receive Diversified Growth Fund and Defensive Growth Fund |