Baillie Gifford Investment Funds II ICVC Interim Report - December 2025
In plain words
This report covers operational changes at Baillie Gifford: a couple of sub-funds are being merged or closed, one is renamed, fees are cut, and three funds are dropping their return targets. It also flags that the Japanese Income Growth Fund is struggling—the Japanese market jumped 13.5% in six months but the fund only gained about 7%, partly because management fees are taken from capital, eroding returns. Five-year annualized return is just over 2%, below its promised gap over the index. Key holdings mentioned include SoftBank Group (largest stake, heavily traded), SBI Shinsei Bank (new purchase), and Chugai Pharmaceutical (new purchase).
The report describes operational changes to five sub-funds under Baillie Gifford Investment Funds II ICVC: effective 2 February 2026, Baillie Gifford UK Equity Core Fund is renamed Baillie Gifford UK Equity Core Growth Fund; the annual management fee for P-class shares of Baillie Gifford Monthly Inc
This Introduction (the About the Company section) does not disclose any investment performance, portfolio holdings, or fund manager market views; its substantive content is entirely focused on operational changes and structural arrangements at the fund product level.
Where Positions Moved: Additions and Reductions
Fund-level flows were confirmed after the reporting period: one sub-fund was merged into another sub-fund and one sub-fund was closed, with no new fundraising direction disclosed.
| Fund | Direction | Terms/Scope |
|---|---|---|
| Baillie Gifford Sustainable Growth Fund | Merged then terminated | Planned merger into Baillie Gifford Global Alpha Paris-Aligned Fund, subject to shareholder approval of that fund, after which the ACD intends to terminate the fund |
| Baillie Gifford Sterling Aggregate Bond Fund | Closed | Closed on 2026-02-27; the ACD will no longer actively accept subscriptions |
The merger path is clearly specified as the Sustainable Growth Fund being merged into the Global Alpha Paris-Aligned Fund, but the Introduction does not disclose specific terms such as the exchange ratio, fees, or the size of assets transferred; the closure of the Sterling Aggregate Bond Fund was a unilateral decision by the ACD and took effect immediately after the reporting period.
Fund Matters
Three operational changes take effect from 2026-02-02: a name change, a fee reduction, and the removal of target returns from three funds; the annual value assessment mechanism was also disclosed on the same day.
| Category | Fund/Scope | Effective Date | Details |
|---|---|---|---|
| Name change | Baillie Gifford UK Equity Core Fund | 2026-02-02 | Renamed Baillie Gifford UK Equity Core Growth Fund |
| Fee reduction | Baillie Gifford Monthly Income Fund (P class shares) | 2026-02-02 | Annual management fee reduced from 0.35% to 0.30% (a decrease of 0.05 percentage points) |
| Removal of target returns | Baillie Gifford Japanese Income Growth Fund, Baillie Gifford Sustainable Growth Fund, Baillie Gifford UK Equity Core Fund | 2026-02-02 | Target Returns removed from investment objectives |
Other structural information:
- As of 2025-12-31, the company offered five sub-funds; each sub-fund is valued daily at a single price, with different fee structures and subscription limits, and conversion facilities are available between sub-funds; the Prospectus and the company's Articles of Association were most recently amended on 2026-02-02.
- Cross-shareholdings: As of 2025-12-31, there were no mutual shareholdings among the sub-funds.
- Value assessment: The ACD conducts an annual assessment against seven criteria (quality of service, performance, ACD fees, economies of scale, comparable market rates, comparable services and share classes); the reference date is 31 March each year, with conclusions published no later than 31 July each year; the latest assessment report is based on 2025-03-31.
- The report and financial statements were approved and signed by the ACD on 2026-02-27 — the same day the Sterling Aggregate Bond Fund closed.
Interpretation of the removal of Target Returns: The ACD states this decision followed a review of each fund, but the report does not explain the specific triggers. At the fund document level, the investment objectives no longer contain a commitment to a specific return level, representing a weakening of binding language for shareholders; readers should note this change.
Sequel: Further Evidence of Fund Lifecycles and Strategy Dilemmas
I. A Comparison of Two Funds: The Sample Value from "Termination" to "Continuation"
This sequel provides two starkly different fund states, forming a natural comparison:
| Dimension | Health Innovation Fund | Japanese Income Growth Fund |
|---|---|---|
| Lifecycle status | Terminated operations in November 2024 | Operating normally |
| Net assets | 0 (fully redeemed) | Has a full net asset scale |
| Report disclosure type | Liquidation-period financial data | Regular interim report |
| Distributions | All zero (no distributions for either Class B or Class C) | Maintained a yield above the benchmark (2.6% vs 2.4%) |
| Fee capitalization | No related arrangements disclosed | 100% of fees deducted from capital |
The core issue this comparison reveals: One fund went into liquidation because its strategy failed, while the other, after three years of underperformance, still insists on its "five-year rolling period" — the same asset management platform has taken completely different approaches to the two predicaments: the former was shut down, while the latter buys time to await validation. This in itself constitutes an internal test of the "long-termism narrative."
2. The Hidden Cost of "Fee Capitalization" — The Overlooked Erosion of Capital Structure
The Japanese Income Growth Fund spells out a key arrangement in its risk disclosures:
> 100% of fees are allocated to capital, meaning the management fee is not deducted from investment income but directly from the capital value.
The actual impact of this arrangement on investors is worth quantifying:
| Assumption | Fees deducted from income | Fees deducted from capital (current arrangement) |
|---|---|---|
| Fund net asset return | Unchanged | Capital is eroded |
| Distributable income | Reduced | All income available for distribution |
| Apparent yield | Relatively lower | Relatively higher |
| Capital growth potential | Preserved | Approximately 0.60% deducted each year |
Given the fund's 0.60% management fee rate, the cumulative effect of deducting from capital cannot be ignored: with the fund's annualized return at only 2.1% (five-year rolling period), management fees account for nearly 30%. In other words, for every 100 yuan of net return investors receive, roughly 30 yuan of value is consumed by fees. The report continues to tout the "portfolio return above TOPIX" as a selling point, but the sustainability of this return is questionable—it is artificially maintained through fee capitalization, not a genuine return advantage derived from investment skill.
3. The Huge Gap Between Target Setting and Reality: Numbers Don't Lie
Comparing Targets and Actuals:
| Metric | Target Commitment | Actual Performance (as of 2025.12.31) |
|---|---|---|
| Annualized excess return (relative to TOPIX) | ≥1% (five-year rolling) | Annualized total return of 2.1%; TOPIX far outperformed over the same period |
| Rate of return (portfolio level) | Higher than TOPIX | 2.6% vs 2.4% (barely met) |
| Market environment contribution | — | TOPIX rose 13.5% in six months |
Against the backdrop of TOIPX hitting a record high (breaking 3,000 points for the first time) and Japanese companies setting records in both buybacks and dividends, the fund's half-year return was only about 54% (7.3% vs 13.5%) of the index's. This gap is not a coincidence — it indicates that the fund's allocation deviated from the core driver of the market rally (the AI sector), rather than being merely "bad luck."
Even more worthy of reflection is the five-year annualized figure of 2.1%. The past five years coincided with a rare multi-year uptrend in Japanese equities, with TOPIX posting double-digit growth for three consecutive years (2023-2025), yet the fund's five-year annualized return was only 2.1%. This means: even after fees, the fund seriously failed to meet its core commitment of "1% annual excess return over the benchmark." This kind of long-term validated failure is precisely a new example of the "fund manager narrative bias" identified in Part I — a pattern of prioritizing narrative and attributing results to short-term noise.
4. The Yield Paradox: The Structural Cost of Sacrificing "Growth" for "Dividends"
The description of the market environment reveals the structural reasons behind the fund's underperformance:
- Market-dominant narrative: AI, SoftBank, OpenAI
- Core improvement in Japanese corporate behavior: buybacks + dividends exceeded ¥20 trillion for the first time
- Central bank rate hikes: marking the end of the "lost decades"
However, the fund operates under the constraint of "maintaining a yield above TOPIX." In a bull market cycle, this constraint means:
Growth companies typically have lower dividend yields (as capital is reinvested in growth), and in order to maintain the portfolio's yield (2.6%), the fund manager is forced to hold more high-dividend, low-growth value stocks, thereby missing the valuation expansion driven by the AI narrative. The fund lags behind in structural bull markets while proving relatively resilient in defensive markets—this is dictated by its strategic DNA, yet the report consistently avoids reflecting on this.
五、值得警惕的信息不对称:报告数据形同“半份档案”
一个细节值得注意:Health Innovation Fund部分的所有财务数据(净资产变动、总回报、资产负债表)均以“−”或“n/a”呈现,因为基金已清盘。然而Balance Sheet显示其仍有6,000英镑现金及1,000英镑债务人——也就是说截至2025年6月30日,该基金尚余少量资产处于清算过程中。这种“最终清理”的状态,使得该基金从“活跃运营”到“彻底终结”的过渡时间跨了至少一年。投资人若期待透明及时的清盘节奏,这一过程本身就反映出运营层面的低效。
V. Information Asymmetry to Be Wary Of: Report Data Resembles "Half a File"
One detail worth noting: all financial data in the Health Innovation Fund section (net asset changes, total returns, balance sheet) are presented as "−" or "n/a" because the fund has been liquidated. However, the Balance Sheet shows it still holds £6,000 in cash and £1,000 in debtors—meaning that as of June 30, 2025, the fund still had a small amount of assets in the process of liquidation. This "final cleanup" status means the fund's transition from "active operation" to "full termination" has spanned at least a year. For investors expecting a transparent and timely liquidation pace, this process itself reflects operational inefficiency.
6. Summary: New Judgments in This Section
1. Expense capitalization is a cognitive trap — headline returns benefit from it, but capital is eroded, investors bear the full cost, and long-term returns are systematically diluted.
2. The five-year rolling annualized return of 2.1% directly negates the core investment objective of "achieving TOPIX +1%"; the report should acknowledge this rather than circumvent it.
3. The fund's long-term underperformance is no accident; it is the result of a structural conflict between its "maintain a high return rate" constraint and the growth logic of a bull market.
4. The comparison between the two funds reinforces the judgment from the first part: once Baillie Gifford's strategy failed validation, the platform could choose either to terminate or to wait, but neither path is fair to investors — the former means "net asset value goes to zero," while the latter means "a slow grind over the long term."
Portfolio Structural Shift: Additions and Reductions in Sector Allocation
Comparing the sector weights at the end of the reporting period (31.12.25) with those at the start (30.06.25) shows that the portfolio completed a clear rebalancing within six months:
| Sector | December 2025 Weight | June 2025 Weight | Change (pp) |
|---|---|---|---|
| Manufacturing | 43.09% | 42.63% | +0.46 |
| Finance & Insurance | 17.77% | 17.33% | +0.44 |
| Commerce | 8.96% | 8.42% | +0.54 |
| Services | 8.58% | 10.46% | -1.88 |
| Transport & Communications | 14.35% | 15.29% | -0.94 |
| Real Estate | 5.73% | 5.31% | +0.42 |
Services experienced the largest decline (-1.88 percentage points), directly related to the full liquidation of Sawai and the reduction of Mixi during the period. Notably, Mixi still retains a 0.93% position, but it has clearly contracted relative to before. The decline in Transport & Communications was mainly the result of partial profit-taking in SoftBank Group — although the stock remains the largest holding, the buy/sell data show a sale of £7,530 thousand during the period (the largest single trade), while the purchase was likewise £7,530 thousand (also the largest single trade), indicating a major repositioning rather than a trend-based exit.
Top Ten Holdings: Rising Concentration and the Clustering of "Platform-Type" Companies
The top ten holdings account for approximately 34.1% in total, of which the combined SBI group (SBI Holdings 4.53% + SBI Shinsei Bank 1.84%) reaches 6.37%, second only to SoftBank Group as a single stock. This approach of adding positions through IPOs shows the manager's strategic conviction in the SBI ecosystem — the transformation path from online brokerage to integrated financial group is clear, and the incorporation of Shinsei Bank has brought a qualitative change to the deposit base.
Another notable structural feature is that the top ten includes three financial/insurance companies (in fact four: SBI Holdings, Sumitomo Mitsui Trust, Tokio Marine, and MS&AD), with the financial sector accounting for roughly half of the top-ten weight. This is consistent with the "beneficiary of Japanese interest-rate normalization" logic emphasized in earlier reports.
The Common DNA of New Positions: Platforms, Technology, and Global Penetration
The four newly established positions may look diversified, but they actually share the same stock-selection framework:
| Company | Core Characteristics | Long-Term Logic |
|---|---|---|
| Chugai Pharmaceutical | Antibody/cell-penetrating peptide platform + Roche global channel | High-margin R&D engine, global biopharmaceutical penetration |
| Keyence | Machine vision + factory automation leader | Picks-and-shovels play on rising automation penetration |
| Kansai Paint | Coatings leader + Nerolac India option | Emerging-market infrastructure cycle + improving shareholder returns |
| SBI Shinsei Bank | Digital-first + ecosystem synergy | A rare target in the digital restructuring of traditional banking |
Among these, Chugai's partnership with Roche is especially critical — it gives its R&D output a defined channel for global commercialization while avoiding the capital consumption of building its own sales network. Keyence's business model (direct sales + high customer stickiness), meanwhile, allows it to maintain extremely strong cash generation through fluctuations in the automation investment cycle.
Performance Attribution Revisited: A Neglected Commonality
The report attributes the three laggards — DMG Mori, Sysmex, and Nintendo — to "short-term earnings/execution uncertainty." But on closer inspection, they actually share a deeper characteristic: all three are in the intermediate stage of transitioning from hardware/equipment sales to service/software/IP revenue.
- DMG Mori: Cyclical pressure on machine-tool sales, but the software-defined capability of its 5-axis systems is increasing customer stickiness
- Sysmex: After instrument placement is complete, the share of recurring revenue from reagents and services will keep rising
- Nintendo: Concerns over the Switch 2 hardware cycle, but cross-platform IP monetization (films, theme parks, mobile games) is the real long-term narrative
What the three have in common is that the market is still valuing them with the old hardware-cycle mindset, while management's long-term logic has already shifted toward recurring revenue. If the market gradually comes to recognize this transition, the valuation regime could undergo a systemic shift.
Structural Signals at the Fund Level: Expansion Within Contraction
The fund's data reveal an intriguing "scissors gap":
| Metric | June 2023 | December 2025 |
|---|---|---|
| Total net assets (£'000) | 726,118 | 290,137 |
| B Accumulation per-share amount (pence) | 152.69 | 181.99 |
| B Income dividend per share (pence/half-year) | 3.74 (full year) | 0.90 (half-year) |
Total assets shrank 60% in two and a half years, yet net asset value per share actually rose 19% — indicating that the main driver of the asset shrinkage was share redemptions rather than investment losses. However, the dividend per share fell from an annualized 3.74 pence to 0.90 pence for the half-year (annualized 1.80 pence), a decline of more than 50%, far exceeding the change in NAV. This means the portfolio's dividend-generating capacity is being compressed, likely a structural consequence of shifting into more growth-oriented names (such as Keyence and Chugai). For an "Income Growth" fund, this is a tension point that warrants ongoing attention.
SoftBank Group's Simultaneous Buy and Sell: The Art of Rebalancing the AI Narrative
During the period, SoftBank Group appeared at the top of both the largest-purchase list (£7,530 thousand) and the largest-sale list (£7,530 thousand). This symmetrical figure indicates that the manager was not simply adding or trimming the position, but was carrying out a large-scale "trade-in" on the same name — most likely selling part of the traditional telecom exposure (SoftBank Corp. position 0.99%) while increasing exposure to SoftBank Group's own AI/ARM/OpenAI story. This restructuring-style transaction within a single group reflects long-term conviction in the AI theme, along with increased short-term valuation sensitivity.
The IPO participation in SBI Shinsei Bank (£4,524 thousand cost) is another strategy — using primary-market pricing to take part in the digital restructuring of a bank, avoiding the chase of secondary-market premiums. The gap between this position's construction cost and its post-listing market value (£5,335 thousand) has already provided an initial margin of safety of roughly 18%.
Positioning of the New Fund: Analysis of Baillie Gifford Monthly Income Fund's Characteristics
1. Investment Objective and Supplementary Observations on Strategy
The fund's objective is to "generate monthly income while increasing income and capital value in line with UK CPI over a five-year period." This is not a simple income fund but one with an explicit inflation-hedging attribute. Its strategy is closer to a multi-asset income solution than to a single dividend-stock portfolio. The investment universe covers equities, bonds, money market instruments, derivatives, deposits, and cash, and it may invest indirectly in real estate, infrastructure, commodities, and loans — this full-spectrum allocation suggests the manager cares more about "diversification of cash-flow sources" than about concentrated bets on any one asset class.
Notably, the fund has incorporated a "sustainable investment process," applying quantitative and qualitative assessments to all assets (except cash, derivatives, and currency forwards), excluding companies with a high share of revenue from specific industries, and following the UN Global Compact's default assessment. This has two implications: first, it restricts the investment universe, potentially creating divergence during certain market phases (e.g., when traditional energy or high-emission industries perform strongly); second, it increases reliance on non-financial data, and the report acknowledges that "limitations of third-party data may affect the fund's ability to achieve its non-financial objectives."
2. Risk-Reward Profile: Medium Risk ≠ Low Volatility
Although the SRRI number sequence in the report, "1 4 2 3 5 6 7," appears to be a typesetting anomaly, based on the fund's cross-asset allocation characteristics and context, its risk rating should be level 4 (medium risk). This rating only reflects "historical volatility" and does not incorporate a range of material risks. These are set out below:
| Risk Factors Not Covered by SRRI | Specific Impact |
|---|---|
| Inflation and interest-rate pressure | Bond values will fall as interest rates rise, and nominal returns over the holding period may be eroded by inflation |
| Derivatives leverage | If the underlying assets are misjudged, losses may be amplified rather than limited to principal |
| Sustainable investment constraints | The investable universe is limited, and returns may diverge significantly from sector-unconstrained funds |
| Liquidity risk | In a deteriorating market, positions may not be sold in a timely manner, and the fund may even suspend redemptions |
| Custody risk | Bankruptcy or breach of duty by the custodian may lead to asset losses |
| Capital-based fee allocation | Fees deducted from capital directly reduce capital value but do not affect income for the year |
In particular, "deducting fees from capital" is a key structural design of this fund. As of 30 June 2025, 100% of fees were allocated to capital. This means the "income" shown to investors is, in substance, partly converted from principal — an apparently high payout rate does not represent true investment capability. The fee allocation ratio can change year by year, and the ratio for the current fiscal year has not yet been determined.
3. Performance: The Cost of "Sacrificing Capital for Income" in the Latest Half-Year
The report discloses that for the six months ended 31 December 2025, the B Income Shares total return was 2.7%, while the average total return of the IA Mixed Investment 40-85% Shares sector over the same period was 8.8%. The capital return was only 0.8%. The key figures are presented in comparison below:
| Metric | Fund (B Income) | Comparator (IA 40-85% sector) | Difference |
|---|---|---|---|
| Total return (6 months) | 2.7% | 8.8% | -6.1 ppts |
| Capital return (6 months) | 0.8% | — | — |
| Income stream over past 12 months (per share) | 4.67 pence | — | Annualized growth of 4.5% (vs. five years ago) |
This set of data exposes a core contradiction: the fund has achieved solid annualized growth on the income side (4.5%), well above the inflation level, but capital growth is almost stagnant. Combined with the policy of fully capitalizing fees, it can be inferred that the 6.1-percentage-point shortfall in total return versus the benchmark is, to a large extent, not a defect in investment skill but the opportunity cost of artificially boosting income. This is consistent with the fund's "CPI-anchored" objective — in a mild-inflation environment, capital appreciation needs are subordinated to income stability.
Looking at a longer horizon, the historical annual return series (including negative values) presented in the report shows that the fund experienced noticeable drawdowns in certain individual years. Although the layout makes it difficult to align years and values one by one, it is safe to say that the warning "past performance does not indicate future results" is especially important for this fund — because its return structure is highly dependent on fee-allocation strategy and the market interest-rate environment.
4. Cross-Comparison with the Japanese Income Growth Fund
Both are Baillie Gifford funds, and the differences in their positioning are worth noting:
| Dimension | Baillie Gifford Japanese Income Growth Fund | Baillie Gifford Monthly Income Fund |
|---|---|---|
| Investment region | Japanese equities (growth- and dividend-oriented) | Global multi-asset (equities, bonds, derivatives, etc.) |
| Income frequency | Usually periodic distributions | Explicitly monthly dividends |
| Risk rating (SRRI) | Not given in this follow-up, but Japanese equity funds are generally on the higher side | Medium (level 4) |
| Fee capitalization | No explicit disclosure | 100% of fees deducted from capital (FY2025) |
| Sustainable investment | Also governed by Baillie Gifford's sustainable process | Explicitly adopts a sustainable investment process and excludes specific industries |
| Latest half-year total return | Net capital gains of approximately £194 million (2025), net income of £2.218 million | Total return 2.7% (benchmark 8.8% over the same period) |
Source: The Statement of Total Return for the Japanese Income Growth Fund shows net capital gains of £19.355 million for the six months in 2025, versus a loss of -£2.674 million in the same period in 2024; the Monthly Income Fund, meanwhile, faced a relative underperformance of about 6.1 percentage points.
5. Concluding Views
The follow-up content reveals a deep tension within an income-oriented multi-asset fund between "income stability" and "capital growth." The Monthly Income Fund's strategy is essentially to exchange capital value for stable cash flow — acceptable in a period of low interest rates or subdued inflation, but with global rate volatility now rising and the bond-equity correlation changing, the sustainability of this strategy is questionable. Investors evaluating the fund should not look only at the monthly dividend figures; they should focus on:
1. Fee capitalization ratio: If this ratio remains at 100%, "income" looks more like a principal-repayment mechanism;
2. Tail risks beyond the risk rating: Especially if inflation exceeds income growth, the fund's promise of "real income protection" may be unmet;
3. Fairness of benchmark comparison: The IA 40-85% sector does not apply the same stringent capital-based fee allocation, so a direct comparison of total returns may understate the true cost of the fund's strategy.
If the fee capitalization ratio is reduced in the future, or the fund adjusts the balance between income and capital, its SRRI and performance logic will also need to be reassessed.
H2 2025: A Turning Point in the Market Environment and Tactical Adjustments
The follow-up's narrative on H2 2025 provides a window into how the fund navigated the "post-inflation" period. Unlike the path described earlier — broad asset-price declines in 2022 and a gradual repair in 2023-2024 — the six months to December 2025 presented a more complex, mixed picture: inflation continued to fall, but the downward slope of rates was gentle, and asset-class performance diverged markedly.
The "stepwise" decline in inflation and interest rates
The report confirms the core macro logic: after peaking in 2022 (CPI at 11% year-on-year), inflation was gradually brought under control and had fallen to 3.3% by December 2025. But the key point is not the figures themselves; it is that the decline was not smooth or linear — both the Bank of England and the Federal Reserve followed a "gradualist" path, causing long-end rates to rise before September and then fall, with the yield curve slightly steeper than in the summer.
| Period | Macro Characteristics | Rate Direction | Asset Implications |
|---|---|---|---|
| 2022 | Inflation outbreak | Rapid increases | Both equities and bonds sold off |
| 2023-2024 | Inflation gradually brought under control | Repeated expectation shifts | Volatile divergence |
| H2 2025 | Inflation near target | Slow declines | Risk assets supported |
This "stepwise" evolution is consistent with the "stagflation-lite" baseline scenario described in the fund's annual report (growth near trend, inflation easing, rates declining gradually), and it provides the macro basis for the fund's modest increase in risk assets at the period end.
Divergence in Asset Performance: Income Engines and Drags Coexist
The fund recorded positive returns across all asset classes over the covered period, yet capital returns remained weak. The root of this seemingly contradictory outcome lies in the differing interest-rate sensitivity of the various income engines. Two points merit deeper attention:
The leadership of infrastructure and emerging-market debt is no accident
The report notes that these two asset classes posted the strongest returns over the covered period. Infrastructure benefits from highly predictable income (usually linked to inflation or embedded in long-term contracts), giving it greater valuation-recovery elasticity as rates peak and decline. Local-currency emerging-market debt, meanwhile, benefits from a weaker dollar — the exact opposite of the 2022 logic in which a strong dollar weighed on EM assets, creating a mirror-image macro hedge.
Property's valuation paradox
The reason for real estate's lagging performance is identified as a regional bias toward "heavy exposure to the UK and Europe," rather than deteriorating fundamentals. The report highlights an important paradox: rental growth is healthy, capital values are supported, and income continues to rise, yet valuations remain at post-GFC lows. This not only reflects the market's inertial pricing of commercial real estate's rate sensitivity, but also reveals a structural feature of the current real estate market — a prolonged divergence between fundamentals and valuations. It underscores that the market is still pricing the risk premium for this asset class conservatively.
Holdings Map: Concentration Details Within Diversification
The Principal Holdings table reveals how the fund's "multi-engine" framework is reflected in actual holdings:
| Holding | Category | Weight | Characteristics |
|---|---|---|---|
| UK Treasury 4.5% 07/06/2028 | Government bond | 1.90% | Core liquidity + stable interest |
| TSMC | Growth equity | 1.76% | Newly introduced AI-theme exposure |
| Primary Health Properties REIT | Healthcare real estate | 1.75% | Inflation-linked rents |
| Italgas | Utilities | 1.57% | Regulated gas distribution |
| Microsoft | Tech growth | 1.32% | Cash flow + AI exposure |
| Greencoat Renewables | Renewables | 1.29% | Inflation-linked cash distributions |
| Apple | Tech growth | 1.27% | Cash flow + buybacks + dividends |
| UK T Bill 09/02/2026 | Cash management | 1.23% | Short-term liquidity |
| Terna | Power transmission | 1.13% | Regulated assets |
| Greencoat UK Wind | Renewables | 1.07% | Infrastructure income |
The top ten holdings total approximately 15.3%, with none exceeding 2%, reflecting the fund's deliberate strategy of avoiding excessive exposure to any single factor. At the same time, note that the "AI narrative" is not implemented through pure tech holdings — TSMC is a hardware supplier for AI infrastructure, Microsoft and Apple themselves combine AI applications with stable cash-flow characteristics, and physical assets such as Greencoat Renewables are indirect beneficiaries of surging electricity demand from AI data centers. This indicates that the fund's participation in new themes is penetrative rather than directly buying pure-play AI names.
This holding structure also has a hidden function: differentiation in dividend yields. Italgas has an expected dividend yield of about 6%, Primary Health Properties about 6.5%, and Terna about 4.5%; Microsoft and Apple, by contrast, offer dividend yields of only 0.9%-1.1%. The combination of high-dividend assets and low-dividend growth stocks in the top ten is precisely the fund's twin objective of "current income + future growth" mapped at the individual-stock level.
Large-Scale Trades: Quantitative Evidence of Strategic Adjustment
The Material Portfolio Changes table shows that the largest purchase and the largest sale were both UK gilts (4.5% 07/06/2028 with a purchase of £3,560 thousand, and 4.5% 07/03/2035 with a sale of £3,502 thousand). This operation is worth unpacking:
- Buying a shorter-dated gilt (maturing 2028): With the yield curve steepening, holding medium/short-dated gilts can lock in the relatively high coupon (4.5%) while reducing the erosion of NAV from interest-rate volatility — the shorter the maturity, the lower the price sensitivity to rates.
- Selling a longer-dated gilt (maturing 2035): In a rate-downcycle, long-bond prices have already experienced a recovery; realizing capital gains and shortening duration at this point effectively manages reinvestment risk from further rate declines.
This "buy short, sell long" operation reflects at least two things: first, the fund believes there is limited room for a significant further decline in rates; second, by locking in a higher coupon and releasing duration risk, it aims to support future income growth expectations.
Small Growth-Stock Positions: Broadening the Opportunity Set Without Deviating from the Mandate
The most notable new action in the follow-up is "introducing a small allocation to growth stocks as a supplement," funded by reducing the cash position and making internal adjustments within equities. The key point is that this is a bounded break from the core discipline in place since 2019 — the fund has historically used "income" as its primary stock-selection framework, and not all "companies with AI-catalyzed opportunities" can meet current dividend requirements.
This adjustment implicitly contains two judgments:
1. The AI investment cycle has not peaked, but it cannot be fully captured through pure high-dividend stocks.
2. The fund is unwilling to trade off its income target for growth, and therefore has chosen an extremely small-scale entry — one that neither alters the fund's income profile nor causes a significant shift in the portfolio's risk characteristics.
This approach effectively extends the fund's time horizon: by including early-stage compounders, it treats them as potential future dividend leaders — akin to laying the groundwork for the next five years of income growth while maintaining the current income engine. This is highly consistent with the fund's core purpose: to secure a continuously rising income stream, not merely to capture currently high-yielding opportunities.
Assessing the Sustainability of Medium-Term Performance: The Resilience of the Income Engine
The report confirms that income growth exceeded 5% for full-year 2025, significantly outperforming CPI of 3.3%. Combined with the main report data on the previous page, 2025 was the sixth consecutive year of positive growth since 2020. The following is a block-by-block assessment of the resilience of the fund's income engine:
| Income Source | Approximate Share | Drivers | Resilience Assessment |
|---|---|---|---|
| Equity dividends | ~1/3 | Corporate profits + payout policies | Medium-high, concentrated in companies with strong cash flow |
| Bond coupons | ~1/3 | Interest-rate levels + credit spreads | High; shorter maturities can be rolled and reinvested at higher rates |
| Physical assets | ~1/3 | Inflation-linked rents/contracts | High; a natural inflation hedge |
One notable detail: the report repeatedly mentions that infrastructure and emerging-market debt were the strongest performers over the covered period, and these two asset classes are precisely the directions in which the fund increased exposure at the period end. This means that while income is growing, the fund is also using new capital to accumulate assets for future returns at relatively attractive prices — the positive evolution of the portfolio's expected income does not rely on legacy assets, but instead reflects continued participation in the market with new money at reasonable prices.
Another factor that cannot be overlooked is that although rates have come down from their peak, they remain at relatively high levels. This is a double-edged sword for the bond component — duration risk is manageable, while coupon income remains significantly higher than in the 2010s. The current environment is still a window in which the fund can achieve similar yields with less risk exposure.
Returning to the Core Analytical Framework
Looking at the report as a whole, the core contradiction facing the fund has not changed:
- Income objective: Consistently outperform inflation; 2025 was well achieved.
- Capital objective: Suppressed by the narrow market (AI mega-caps); medium-term capital returns have been weak.
But the H2 2025 materials provide a new perspective that previous analysis could not cover: the fund did not sit back and wait for the contradiction to resolve itself; instead, it used a series of tactical adjustments (increasing local-currency EM debt, modestly adding growth stocks, and adjusting gilt duration) to reduce the portfolio's dependence on a single macro scenario. These moves are modest in size but clear in direction. At the same time, the report's expectation of "reversion to the mean in concentration" (AI spending normalizing, lower rates benefiting dividend growers) is somewhat optimistic, but hardly groundless — historically, extremely crowded trades tend to face mean-reversion pressure when catalysts shift.
Ultimately, this time window shows a turning point for the fund — from passively absorbing the macro shocks of 2022-2024 to actively fine-tuning the portfolio's direction. It also means that from 2026 onward, the focus of the contest will shift from "defensive capability" to "the elasticity of capital-return recovery," and the fund's sustained accumulation on the income side has given it time to absorb the market's repricing at this stage.
1. Asset Allocation Dynamics: Tilting from Cash and Infrastructure Toward Equities and Local-Currency EM Debt
As of 31 December 2025, the changes in the fund's major asset-class positions were as follows:
| Asset Class | Current Weight | Previous Weight | Change (pp) |
|---|---|---|---|
| Cash Equivalents | 1.73% | 2.59% | -0.86 |
| Developed Government Bonds | 1.90% | 1.98% | -0.08 |
| Emerging Market Bonds Hard Currency | 8.37% | 8.15% | +0.22 |
| Emerging Market Bonds Local Currency | 10.86% | 8.94% | +1.92 |
| Global Equities | 33.70% | 30.96% | +2.74 |
| High Yield Credit | 8.49% | 8.65% | -0.16 |
| Infrastructure | 19.89% | 20.48% | -0.59 |
Reading the key changes:
- Cash was cut sharply by 0.86 percentage points, showing that the fund actively deployed into the market in December, possibly adding to risk assets on dips.
- Global equities saw the largest increase (+2.74 percentage points). Unlike the conventional "bond-leaning" impression of monthly income funds, this fund clearly relies on equity appreciation and dividends to contribute income. At the same time, the equity sleeve may include some low-dividend, high-growth names, reflecting a dual "growth + income" orientation.
- Local-currency EM bonds increased by 1.92 percentage points, the largest marginal change in the fixed-income segment. Relative to hard-currency bonds, local-currency bonds offer higher coupons but carry exchange-rate volatility risk. The fund's contrarian increase suggests a more optimistic view on EM local currencies and inflation prospects.
- Infrastructure declined modestly (-0.59 percentage points) but remains elevated at 19.89%. As a fixed-income-like asset, infrastructure is the ballast for the fund's monthly cash flow; the trimming may be an intentional balancing of rate sensitivity rather than a trend-driven exit.
- Hard-currency EM debt and high-yield credit changed by smaller amounts, consistent with rebalancing. Overall risk appetite remains tilted toward income-generating assets.
2. Global Equity Holdings: High Tech Weight, with Defensive Dividends Also Covered
Equities account for over 30% of the portfolio, with holdings that include both large-cap tech leaders and traditional high-dividend blue chips, reflecting a "barbell" structure.
Top Ten Equity Holdings (by market value):
| Stock | Market Value (£'000) | Weight |
|---|---|---|
| TSMC | 3,290 | 1.76% |
| Microsoft | 2,466 | 1.32% |
| Apple | 2,374 | 1.27% |
| Analog Devices | 1,935 | 1.03% |
| CME Group | 1,676 | 0.90% |
| Roche | 1,492 | 0.80% |
| Partners Group | 1,391 | 0.74% |
| Accenture | 1,357 | 0.73% |
| Jack Henry & Associates | 1,341 | 0.72% |
| Deutsche Boerse | 1,337 | 0.72% |
Analysis of the new data:
- The top ten holdings total roughly 10%, with no single stock above 1.8%, so concentration risk is manageable.
- By sector, semiconductors and software (TSMC, Microsoft, Apple, Analog Devices, Intuit) carry a relatively high weight; these companies have strong cash flow and buyback capacity, providing indirect support for investor returns.
- The allocation to financial exchanges (CME, Deutsche Boerse, Partners Group) and healthcare (Roche, Novo Nordisk, Zoetis) provides a degree of defensiveness as well as stable dividend growth.
- Notable new additions are Midea Group (0.55%) and CATL (0.12%), showing that the fund has increased exposure to Chinese high-end manufacturing and green energy via the "A-shares + Stock Connect" channels.
- Two Russian stocks (Alrosa and Mobile Telesystems) have had their market value marked to zero, reflecting the effective loss of liquidity under geopolitical sanctions. This remains a tail risk for the portfolio, even though the weights are no longer counted in net assets.
3. Bond Portfolio Characteristics: Extremely High Diversification, Local-Currency Debt as the Main Income Enhancer
3.1 Hard-Currency EM Debt: Fine Diversification of Country Risk
Hard-currency bonds cover nearly 30 countries, with no single country exceeding 0.50% (e.g., Angola, Bahamas, each 0.4-0.5%). The holdings include both high-yield African/American countries (e.g., Angola 8.25%, Barbados 8%, Dominican Republic 13.625%) and a number of investment-grade countries (e.g., Chile, Qatar).
3.2 Local-Currency Debt: Balancing Yield and Currency Risk
Local-currency bonds rose to 10.86%, becoming the second-largest fixed-income segment. Key holdings include:
| Country/Issuer | Coupon/Characteristics | Portfolio Weight |
|---|---|---|
| Peru 6.15% 2032 | Local-currency bond | 0.72% |
| Mexico 7.75% 2042 | Local-currency long-dated | 0.51% |
| Brazil 10% 2035 | High coupon | 0.50% |
| Indonesia 8.25% 2036 | High coupon | 0.49% |
| EBRD 6.375% 2036 | Supranational | 0.48% |
These bonds generally offer higher coupons than hard-currency bonds, but the actual returns in sterling terms are affected by exchange rates. The fund's increase in local-currency debt is equivalent to deliberately taking on higher risk in exchange for higher carry, making it one of the clearest "offensive" signals in the December portfolio changes.
3.3 High-Yield Credit: Focus on Mid-Sized US/UK Companies
The high-yield allocation stands at 8.49%, with roughly 45 positions and no single bond exceeding 0.30%. Most are euro- and sterling-denominated UK/European corporate bonds, such as:
- Future PLC 6.75% 2030 (0.25%)
- Kier Group 9% 2029 (0.25%)
- Iceland Foods 10.875% 2027 (0.22%)
The average coupon on these high-yield bonds is far above investment grade, but credit spreads are correspondingly wider. By strictly diversifying, the fund controls idiosyncratic default risk, essentially contributing credit-risk premium to monthly income.
4. Infrastructure: Core Assets for Stable Cash Flow
The infrastructure sleeve maintains a near-20% allocation, with individual holdings averaging about 0.6%-0.9%. The top five holdings are as follows:
| Company | Portfolio Weight | Characteristics |
|---|---|---|
| CenterPoint Energy | 0.89% | US utility, regulated cash flow |
| 3i Infrastructure | 0.76% | Private infrastructure investment company |
| Aguas Andinas | 0.75% | Chilean water utility, strongly defensive |
| Brookfield Renewable | 0.62% | Global renewables, long-term contracted power |
| USS Co | 0.62% | UK student accommodation operator |
Infrastructure assets are typically linked to inflation (e.g., water supply, transmission and distribution grids) and provide stable long-term contracted cash flows, perfectly matching monthly dividend needs. Although the position was trimmed modestly in December, it remains the core "fixed-income-like" pillar of the portfolio.
5. Risk Management Perspective
1. Interest-rate risk: The portfolio holds a number of long-duration bonds (e.g., Mexico 2110, Sweihan 2049, Hungary 2051) that are highly sensitive to rate movements. With global rates currently in a high-level decline phase, longer duration can amplify capital gains in a rate-cutting cycle, but if inflation proves persistent, it can also produce significant mark-to-market drawdowns.
2. Currency risk: The increased share of local-currency EM debt means the portfolio is more sensitive to EM currency volatility. In December, many Asian and Latin American currencies strengthened against sterling or the dollar, contributing positive exchange gains to local-currency bonds.
3. Russian assets written to zero: Alrosa and Mobile Telesystems have been marked to zero, showing that geopolitical risk can lead to principal losses. The fund manager no longer retains historical-cost markers for them in the portfolio, but investors should recognize that such assets are no longer recoverable investments.
6. Summary
Judging from the latest holdings detail, Baillie Gifford Monthly Income Fund clearly moved up the portfolio's risk/return curve in December: it cut cash, added to global equities and local-currency EM bonds, while maintaining the stable contributions of infrastructure and high-yield credit. This repositioning indicates that the manager holds cautiously optimistic views on risk assets for 2026, adhering to the three-engine model of "equity dividends + bond coupons + infrastructure cash flows" to support the monthly distribution target. Although a few Russian assets were written to zero, overall diversification and multi-asset allocation remain solid — this can be seen as active rebalancing rather than an aggressive shift.
Asset Allocation and Holdings Analysis (Continued)
1. Changes in Asset-Class Weights: Higher Equities, Lower Bonds and Derivatives
As of 31 December 2025, the fund's total net assets were £187 million, up 5.8% from £177 million as of 30 June 2025. By asset class, equities rose from 63.26% to 64.30%, bonds edged down from 35.48% to 34.64%, and derivatives were cut sharply from 0.62% to 0.23%, nearly halved. This adjustment suggests that, amid changing rate expectations, the manager moderately reduced hedging positions and bond exposure while increasing equities to capture return opportunities.
| Asset Class | 2025-12-31 Market Value (£'000) | Weight | 2025-06-30 Market Value (£'000) | Weight | Change (pct pts) |
|---|---|---|---|---|---|
| Bonds | 64,776 | 34.64% | 62,726 | 35.48% | -0.84 |
| Derivatives | 434 | 0.23% | 1,089 | 0.62% | -0.39 |
| Equities | 120,253 | 64.30% | 111,868 | 63.26% | +1.04 |
| Total | 185,463 | 99.17% | 175,682 | 99.36% | - |
2. Equity Holdings: Infrastructure and Utilities at the Core
The equity sleeve is heavily concentrated in regulated utilities and infrastructure operators, consistent with a "monthly income" fund's requirement for cash-flow stability. Key holdings include:
- United States: NextEra Energy (1.02%), Edison International (0.45%), Southern (0.76%), WEC Energy Group (0.78%)
- Europe: Italgas (1.57%), Terna (1.13%), Redeia (0.43%), Getlink (0.80%)
- United Kingdom: Severn Trent (0.98%), United Utilities (1.01%), HKT Trust (0.56%), and Fortis (0.77%)
Italgas is the largest utility holding, with a weight of 1.57%, reflecting a preference for the stable returns of Italy's regulated gas network. Across the entire portfolio, the utilities sector is estimated to account for more than 10% in total, closely matching the fund's "Monthly Income" name.
3. Bond Portfolio Characteristics: High Coupons Coexist with Subordinated Debt
The bond component (34.64%) reflects a clear "income enhancement" strategy: it holds investment-grade corporate bonds (e.g., Barclays 3.811% 2041-42 T2, Caixabank 6.875% T2) alongside high-coupon perpetuals or AT1s (e.g., Investec 10.5% 2029 Perp AT1, Nationwide 7.875% Perp AT1). Coupons range from 3.811% to 10.5%, indicating a combination of credit downgrading and term-premium capture.
Notably, some positions are held under Rule 144A (restricted to qualified institutional buyers), such as James Hardie, Lineage OP, and Weir Group, indicating that the fund can capture a liquidity premium for higher returns. The overall bond portfolio is dominated by financials (banks, insurance), but diversification reduces single-industry risk.
4. Real Estate: Weight Declines, Healthcare Property Remains the Largest Position
The real estate investment trust (REIT) weight fell from 11.83% to 10.71%, down 1.12 percentage points, the most pronounced reduction among major asset classes. The largest holding, Primary Health Properties (1.75%), is a healthcare REIT, followed by CTP N.V. (1.06%), LondonMetric Property (0.63%), Equinix (0.63%), among others. The reduction likely stems from concerns about commercial real estate's rate sensitivity, but the logic for healthcare and logistics property remains intact.
5. Derivatives: Primarily FX Hedging, with Lower Credit Protection Costs
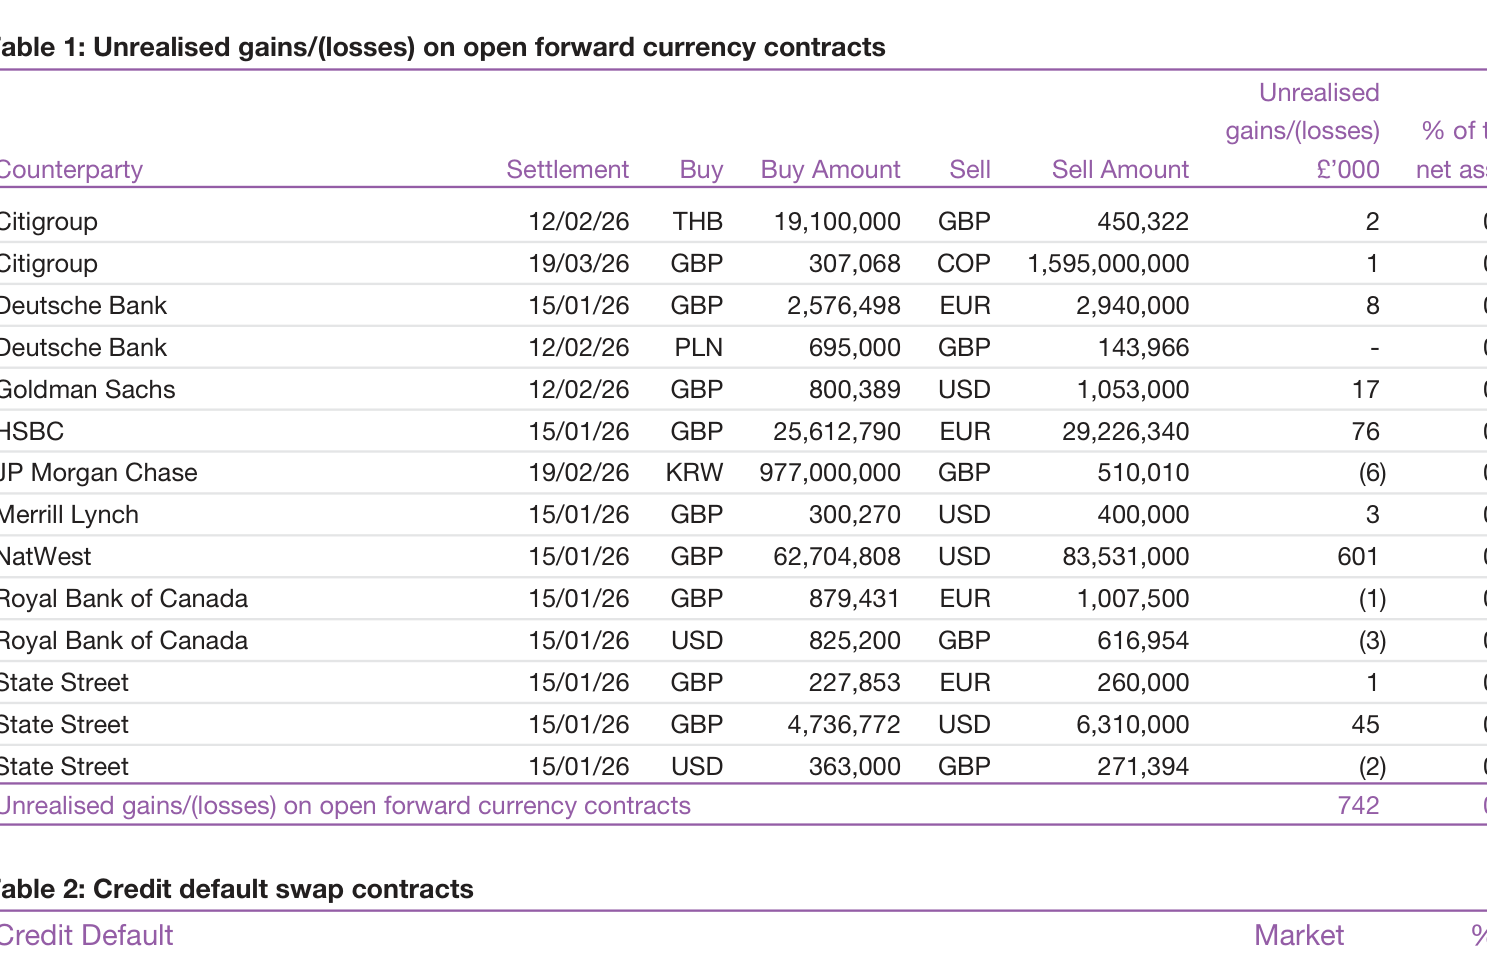
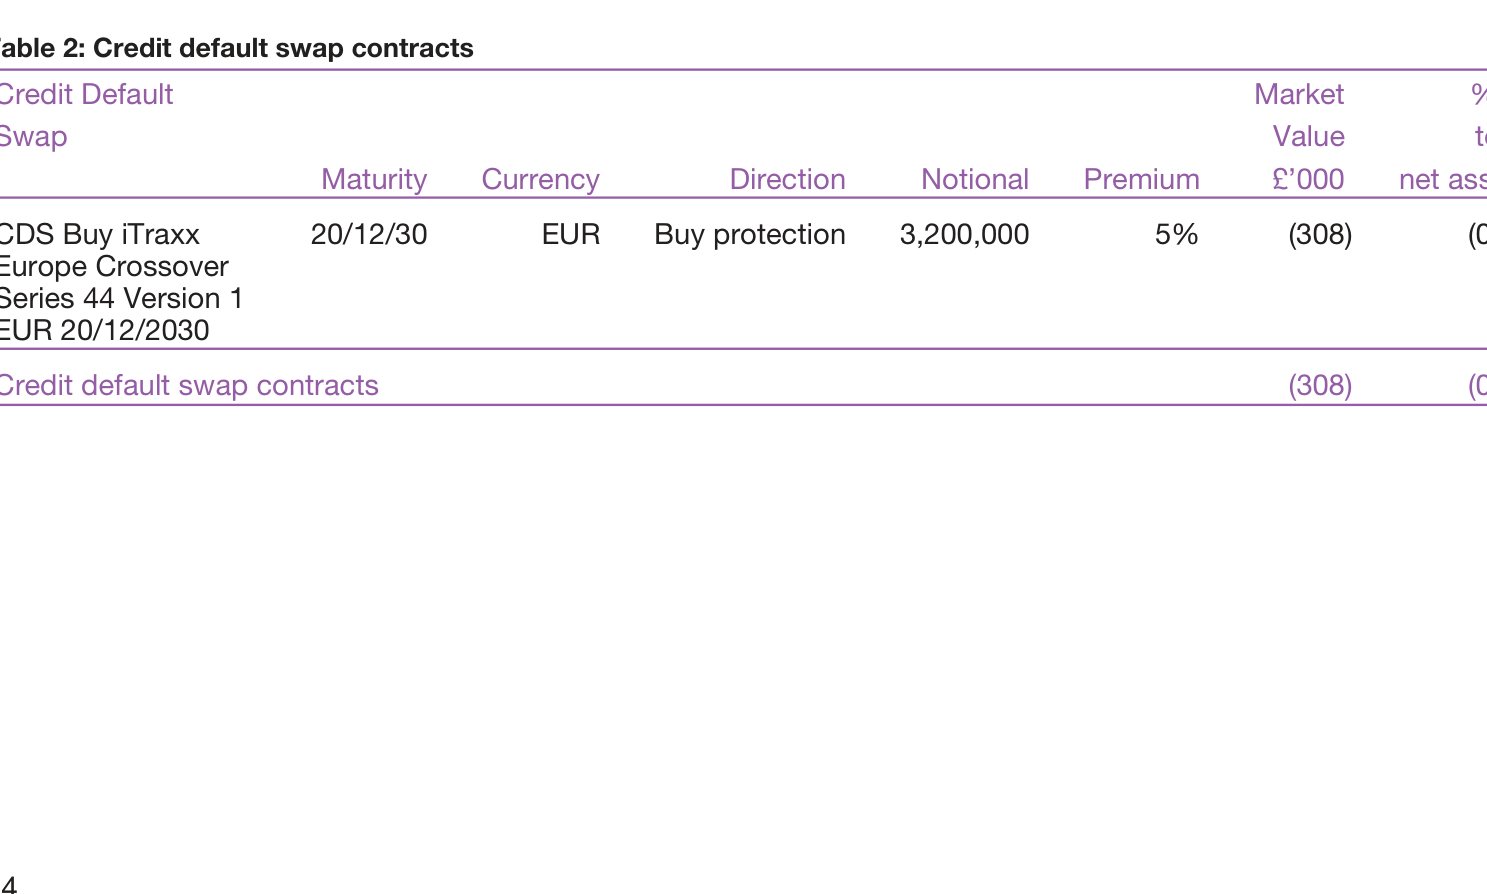
Derivatives contributed a net 0.23% (+£742k from forward FX gains, -£308k from credit default swap costs). The forward FX contracts mainly involve sterling against the US dollar, euro, Korean won, Thai baht, and Colombian peso, among others; the NatWest sterling/US dollar contract contributed +0.32% of value. The fund uses FX hedging to avoid local-currency depreciation risk, but with the large US dollar exposure, the recent dollar decline may generate gains.
On CDS, the fund bought protection on iTraxx Europe Crossover Series 44, with a notional amount of €3.2 million, paying a fixed premium of 5%; the market value was -£308 thousand, representing -0.17% of net assets. Compared with the total derivatives weight of 0.62% at 30 June 2025, the fund significantly scaled back hedging, likely based on the view that credit spreads will narrow.
6. Ongoing Charges Continue to Decline, with a Cut in the B-Share Management Fee
The Ongoing Charges Figures (OCF) show a downward trend:
| Share Class | 31.12.25 | 30.06.25 | Change |
|---|---|---|---|
| B Accumulation | 0.503% | 0.58% | -0.077 |
| B Income | 0.503% | 0.57% | -0.067 |
| C Accumulation | 0.05% | 0.07% | -0.02 |
| H Accumulation | 0.29% | 0.255% | +0.035 |
| J/P classes | 0.40% | 0.42% | -0.02 |
Note 3 explains that, effective 1 July 2025, the annual management fee for B classes was reduced from 0.50% to 0.45%, directly improving the OCF. For income-oriented investors, the fee reduction helps lift the net yield.
7. NAV Performance: Accumulation Classes Rise More Than Income Classes
In terms of NAV performance, accumulation classes significantly outperformed income classes. For example, B Accumulation rose from 139.60p to 143.00p (+2.43%), while B Income only rose from 106.73p to 107.30p (+0.53%). The difference primarily reflects that income classes distributed dividends during the period, returning gains to investors, while accumulation classes reinvested earnings. This data also confirms the fund's "monthly income" positioning.
Total net assets increased by £10.2 million over the period, mainly from investment gains and new subscriptions; B Accumulation shares rose from 19.06 million to 20.99 million, reflecting market preference for low-fee accumulation classes.
8. Risk Rating Downgrade: SRRI Lowered from 5 to 4
The Synthetic Risk and Reward Indicator changed from 5 to 4 as of 31 December 2025, indicating that the fund's risk level declined based on historical volatility statistics. This may be related to the reduction in derivatives, adjustments in bond duration, and narrower equity-market volatility. However, note that this indicator is based on historical data and may not be indicative of the future.
9. Income Continues to Grow, with Stable Distribution Capacity
For the six months ended 31 December 2025, income per share (e.g., B Accumulation) was 2.65p, versus 5.87p for the full previous fiscal year (July 2024-June 2025), equivalent to about 2.94p per half-year. This period came in slightly below the half-year average, but if the annual trend continues, full-year distributions could exceed 5.9p. Over three years, income rose from 4.73p in 2023 to 5.87p in 2025, a CAGR of approximately 11.4%, demonstrating solid dividend growth while maintaining capital appreciation.
10. Specific Risk: Ukraine-Conflict-Related Holding Written to Zero
Note 1 states, "This stock was valued at nil at the period end amid the ongoing conflict in Ukraine," indicating that the portfolio still holds an asset related to Russia/Ukraine (name undisclosed) that has been fully written down to zero. Although the amount is not separately listed (it may be included within Equities at 64.30%), this move shows the fund has adopted a prudent valuation for geopolitical risk; investors should monitor potential legal and recovery developments.
In summary, the current portfolio exhibits a rebalancing pattern of "increasing equities, reducing interest-rate instruments, and trimming hedges," while fee optimization and income growth have enhanced investor returns. Going forward, the key areas to watch include the further impact of Fed/ECB rate paths on bond allocations, as well as the potential impact of utility regulatory policy changes on the portfolio's core holdings.
1. The "Reversal" of Fee Disclosure Rules: Regulatory Scope Adjustments and Their Impact
This follow-up report reveals a key regulatory timing point: in June 2023, UK regulators required that indirect costs arising from holdings in closed-ended investment funds be included in the Ongoing Charges disclosure, causing the disclosed fee ratio to rise by 0.07% at the time. However, only five months later (November 2023), the Investment Association, following an FCA statement on PRIIPs and UCITS communications, removed this requirement again. This "include-then-remove" change directly disrupts investors' comparisons of fee ratios across different periods.
| Time | Regulatory Action | Impact on Ongoing Charges |
|---|---|---|
| Before June 2023 | Closed-ended fund indirect costs not included | Baseline basis |
| June 2023 (disclosure point) | Indirect costs included | Fee ratio rose 0.07% |
| After November 2023 | Indirect costs removed | Fee ratio returned to original basis |
New View: When reviewing fund fee data from mid-2023 to year-end, investors should be particularly vigilant about the "jump" and "pullback" in fee ratios caused by inconsistent regulatory bases. This change did not stem from actual fee adjustments by fund managers, but rather from the oscillation of regulatory rules. For long-term performance attribution and holding-cost assessment, it is recommended to use the latest basis and retroactively restate historical data.
二、Monthly Income Fund 中期财务分析:分配压力与资本消耗信号
该基金截至2025年12月31日的半年报显示,其净收入税后为 3,052 千英镑,但当期分配总额高达 3,411 千英镑,分配额超出税后收入 359 千英镑。这意味着基金动用了资本或前期留存收益来维持分配水平。
| 项目(千英镑) | 2025 H2 | 2024 H2 | 变化 |
|---|---|---|---|
| 净资本收益/(损失) | 1,288 | (586) | 由负转正 |
| 收入 | 4,006 | 3,709 | +8.0% |
| 费用 | (427) | (421) | +1.4% |
| 税后净收入 | 3,052 | 2,803 | +8.9% |
| 分配 | (3,411) | (2,995) | +13.9% |
| 投资活动净资产变动 | 929 | (778) | 扭亏为盈 |
新增观点:尽管本期资本收益大幅改善(从亏损转为盈利),但分配增速(13.9%)远超收入增速(8.9%)和税后净收入增速(8.9%),这种“以本派息”的倾向值得警惕。若市场下行导致资本收益无法持续,基金可能面临削减分配或进一步侵蚀资本的双重风险。投资者不应仅关注当期较高分配率,更需审视分配的可持续性。
III. Sterling Aggregate Bond Fund: Significant Excess Returns, but Market Risk Premium Has Narrowed
The bond fund performed strongly in the second half of 2025:
| 指标(截至2025年12月31日) | 基金(B 累积份额) | 基准指数 | 目标回报(指数+0.65%/年) |
|---|---|---|---|
| 6个月回报 | 4.0% | 2.9% | 3.2% |
| 三年年化回报 | 5.2% | 3.7% | 4.4% |
New view: The fund not only delivered a half-year excess return (4.0% vs 2.9%), but also substantially outperformed its target on a three-year annualized basis (5.2% vs 4.4%), indicating that its active management strategy has been effective over a longer cycle. However, the investment report also notes that after the brief pullback in October 2025, corporate bond valuations remain elevated, and the market has priced in a "continued tailwinds" environment. Such rich valuations imply compressed potential returns ahead, and the persistence of excess returns may weaken.
New market structure fact: The report mentions that U.S. 10-year Treasuries significantly outperformed German Bunds, driven by the interplay between expectations of European fiscal stimulus (defense and infrastructure spending) pushing long-end yields higher, and expectations of a dovish Fed pivot. This contrasts with the historical pattern in which U.S. Treasuries typically followed German Bunds, suggesting that the logic of cross-market macro transmission is changing.
IV. Fee Allocation Strategy: The "Capital Payment" Arrangement of the Sterling Aggregate Bond Fund
The fund explicitly allocates all fees to capital in order to support its income distribution objective. This means:
- Income distributions received by investors may be higher, but the fund's capital appreciation will slow accordingly;
- In an environment of rising interest rates or widening credit spreads, capital impairment may be amplified;
- From a total-return perspective, this strategy is not necessarily equivalent to high fees, but it changes the timing pattern of the return structure.
| Source of Fee Payment | Impact on Income Distributions | Impact on Capital Value |
|---|---|---|
| Capital | Higher distributions | Net asset value growth under pressure |
| Income | Lower distributions | Capital relatively preserved and growing |
Additional Insight: This is essentially "exchanging future capital appreciation for current cash flow." It may be attractive to income-oriented investors seeking stable cash flows, but for investors focused on long-term capital appreciation, the actual total return may be lower than the book performance suggests. Investors are advised to incorporate the fee allocation strategy into a pre-tax/after-tax total-return conversion framework when evaluating this fund, rather than simply comparing nominal distribution rates.
V. Potential Risk Warning for the Bond Market: The "Twin-Tail" Game of Supply and Inflation
The investment report explicitly identifies two tail risks:
1. Coexistence of slowing economic growth and inflation stickiness—if inflation falls short of expectations, central bank rate-cut space is limited, making it difficult for bond yields to decline;
2. Supply pressure from fiscal expansion—European fiscal stimulus involves large-scale bond issuance, increasing the risk of higher long-end rates.
Combined with the "wobble" event in October, it is evident that the market is highly sensitive to inflation data. Even though corporate bond fundamentals are still acceptable, elevated valuations imply insufficient spread compensation. Once macro expectations shift, price volatility could be amplified. This risk warning has direct decision-making relevance for fixed income investors considering whether to continue adding credit bond positions in the current environment.
This analysis focuses on new information at the fund holdings, trading records, and operational levels, and these details reveal more specific investment logic and potential issues.
1. Strategy Evolution Seen Through Asset Allocation Shifts
Comparing the June 2025 and December 2025 holdings tables reveals a clear "inward contraction":
| Sector | Dec 2025 | Jun 2025 | Change (pct) |
|---|---|---|---|
| UK Government Bonds (incl. T Bill) | 43.03% | 33.45% | +9.58 |
| Overseas Government Bonds | 9.97% | 17.57% | -7.60 |
| Quasi-Government Bonds | 2.78% | 4.96% | -2.18 |
| Corporate Bonds | 47.43% | 46.40% | +1.03 |
| Asset-Backed Securities | 6.43% | 4.82% | +1.61 |
| Real Estate | 7.87% | 5.64% | +2.23 |
| Banks | 11.68% | 12.39% | -0.71 |
| Consumer | 0.00% | 1.26% | -1.26 |
New Insight: The sharp reduction in overseas government bonds was not simply "selling Australia/New Zealand," but a systematic retreat—quasi-government bonds were also compressed (e.g., Canada Pension Plan, KFW, etc.), with funds concentrated instead into UK government bonds. This is not simply "hunting for value"; more likely, it is liquidity preparation made in advance for the fund's closure: UK government bonds are the asset in the portfolio with the highest liquidation efficiency and the smallest price impact. December 31 was only three weeks before the closure notice (January 23), yet the portfolio operations already showed traces of a "liquidation plan."
II. Implicit Judgments from the Top Ten Holdings
| Bond | Market Value (£’000) | Weight |
|---|---|---|
| UK Treasury 4.75% 07/12/2038 | 5,402 | 12.99% |
| UK Treasury 4.75% 07/12/2030 | 2,492 | 5.99% |
| UK Treasury 0.125% IL 22/03/2051 | 2,390 | 5.75% |
| UK T Bill 02/03/2026 | 1,669 | 4.01% |
| UK Treasury 4% 22/10/2031 | 1,135 | 2.73% |
| UK Treasury 4.375% 07/03/2028 | 1,008 | 2.42% |
| Bund 2.4% 19/10/2028 | 1,000 | 2.40% |
| Intesa Sanpaolo 6.5% 2028/29 | 834 | 2.00% |
| UK T Bill 16/03/2026 | 645 | 1.55% |
| Peru 7.6% 12/08/2039 (144A) | 631 | 1.52% |
| Top 10 total | 17,206 | 41.36% |
New view: The top ten holdings are highly concentrated along the UK yield curve, forming a “barbell” between the long end (2038/2051) and the ultra-short end (T Bills). The weight of intermediate-maturity bonds is relatively diminished. This structure implies an expectation of a steeper yield curve—locking in high coupons at the long end while preserving liquidity at the short end. The inflation-linked 2051 issue (0.125% IL) acts as tail insurance against unexpected inflation. Overall, the fund has retreated from “global allocation” to a composite position of “UK rates + credit spreads.”
III. Trade Records Validate the Real Operational Logic
| Action | Bond | Amount (£’000) |
|---|---|---|
| Buy | UK T Bill 02/03/2026 | 1,666 |
| Buy | Indonesia 6.625% 15/02/2034 | 809 |
| Buy | UK Treasury 4.375% 07/03/2028 | 1,420 |
| Buy | Dominican Republic 11.25% 15/09/2035 | 566 |
| Sell | Australia 4.75% 21/06/2054 | 794 |
| Sell | New Zealand 4.5% 15/05/2035 | 784 |
| Sell | Virgin Money UK 5.125% 2030 | 642 |
| Sell | Assura Financing 1.625% 2033 | 453 |
Additional Evidence:
1. T Bill rolling operations: The fund bought the 02/03/2026 and 16/03/2026 while selling the maturing 08/12/2025 and 03/11/2025. This maturity rollover shows the fund maintains approximately 5.5% cash equivalents on a long-term basis, rather than as temporary cash management. On the eve of liquidation, this amounts to a "reserved redemption buffer."
2. Two new names in the EM accumulation: Indonesia (6.625%, 2034) and the Dominican Republic (11.25%, 2035) had not previously appeared in the portfolio; they are new positions built during the reporting period. The Dominican Republic sovereign bond carries a yield as high as 11.25%, indicating the fund is taking on significant credit risk in exchange for high cash income. This forms a sharp contrast with the sale of Australian and New Zealand developed-market bonds — a shift from "low-spread defense" to "high-spread offense."
3. Increased concentration risk: As seen in the periodic report, individual trade sizes range from only tens of thousands to over one hundred thousand pounds, while the entire fund is approximately £41.6 million (derived from the UKT 4.75% 2038 market value of £5.402 million / 12.99%). Such a small scale, combined with a large number of 144A private placement bonds, bank AT1s, and private credit positions, could face significant discount redemption pressure during the liquidation window.
IV. Fund Closure: Portfolio Already Reflected Operating Intent
Timeline:
- December 31, 2025: Annual report deadline
- January 23, 2026: Termination notice issued to shareholders
- February 27, 2026: Closure effective
New Assessment: Although the external notice came in late January, the portfolio had already begun pivoting heavily toward UK gilts and accumulating T Bills in H2 2025. There are two possibilities:
1. The fund company had already made the internal decision to close, and the operations during the reporting period were liquidation preparations;
2. The portfolio manager was proactively responding to liquidity risk — even without knowing of the closure, the manager judged that the pace of asset monetization needed to be accelerated.
Either way, current holders are faced with a fact: the fund's remaining assets still contain a large volume of non-core, illiquid assets. For example, within the real estate segment (7.87%), International Workplace Group 6.5% 2030 and CPI Property 1.5% 2031, as well as private credit positions (Blue Owl, Blackstone Private Credit), trade thinly in the secondary market, and forced sale discounts may exceed normal levels. Bank capital instruments (AT1, T2, approximately 4%+ combined) would likewise struggle to find buyers in a liquidation environment.
V. Rebalancing Risk and Opportunity
| Direction | Factor | Impact |
|---|---|---|
| Bullish | Emerging market high coupons (Dominican Republic 11.25%, South Africa 9%, Peru 7.6%) | If no credit event occurs, coupon income can cover interest-rate volatility |
| Bullish | Absolute yield locked in by UK long-end 4.75% coupon | Remains favorable for cash inflows before final liquidation |
| Bearish | UK single interest-rate factor exposure exceeds 43% | If yields rise rapidly, long-end price declines will drag on NAV |
| Bearish | Discounted liquidation of private credit and 144A bonds | May erode existing investment gains during the liquidation period |
| Neutral | Fund has outperformed its three-year target, but forced redemptions follow closure | Performance advantage cannot prevent structural exit |
Summary: On the surface, this stage of the report reads as an “investment review,” but in fact it reveals more signals about operational arrangements. The portfolio’s shift into UK gilts, the rolling of T Bills, and the compression of overseas positions together point to a fund gradually moving onto a liquidation track. For those who study fund manager behavior, this is a valuable case: before any formal announcement, the balance sheet has already reacted first.
Continuation Analysis: Tail-End Sector Distribution, Derivatives Basket, and Share-Class Structure Changes
I. The “Tail Panorama” of Sector Allocation: Utilities Becomes the Largest Sector, But Highly Dispersed Internally
Combining the earlier and continuation data, the full picture of the fund’s sector allocation is now clear. As of end-2025, Utilities became the largest sector holding at 4.32%, but the largest single position among its nine bonds was only 0.77% (Yorkshire Power), showing an extremely dispersed pattern of “large sector, small positions.”
| Sector | 2025.12.31 Weight | 2025.06.30 Weight | Direction of Change |
|---|---|---|---|
| Utilities | 4.32% | 4.54% | ↓ Slight decline |
| Telecommunications | 1.59% | 1.86% | ↓ |
| Services | 0.73% | 1.63% | ↓ |
| Retail | 0.75% | 0.75% | → Flat |
| Technology & Electronics | 0.00% | 0.45% | ↓ Liquidated |
Notably, the three AT&T positions collectively account for 1.59%, making it the highest-weighted holding among single issuers. Among them, the older bond maturing in 2040 with a 7% coupon has a market value of £329 thousand against a face value of £300 thousand, a premium of about 9.7%; while the low-coupon bonds maturing in 2043 and 2044 (4.25%/4.875%) are both at discounts (market value/face value of approximately 79.5% and 86.0%, respectively). This combination of “high-coupon at a premium, low-coupon at a discount” reflects the fund’s continued preference for high-coupon fixed-income assets in a high-interest-rate environment.
II. Derivatives Portfolio: “Refined Tactical Allocation” Across Four Instrument Types
Derivatives in total account for only 0.17% of net assets, but the internal structure reveals multiple strategic intentions.
Instrument Summary:
| Derivative Instrument | Market Value (£’000) | % of Net Assets | Core Characteristics |
|---|---|---|---|
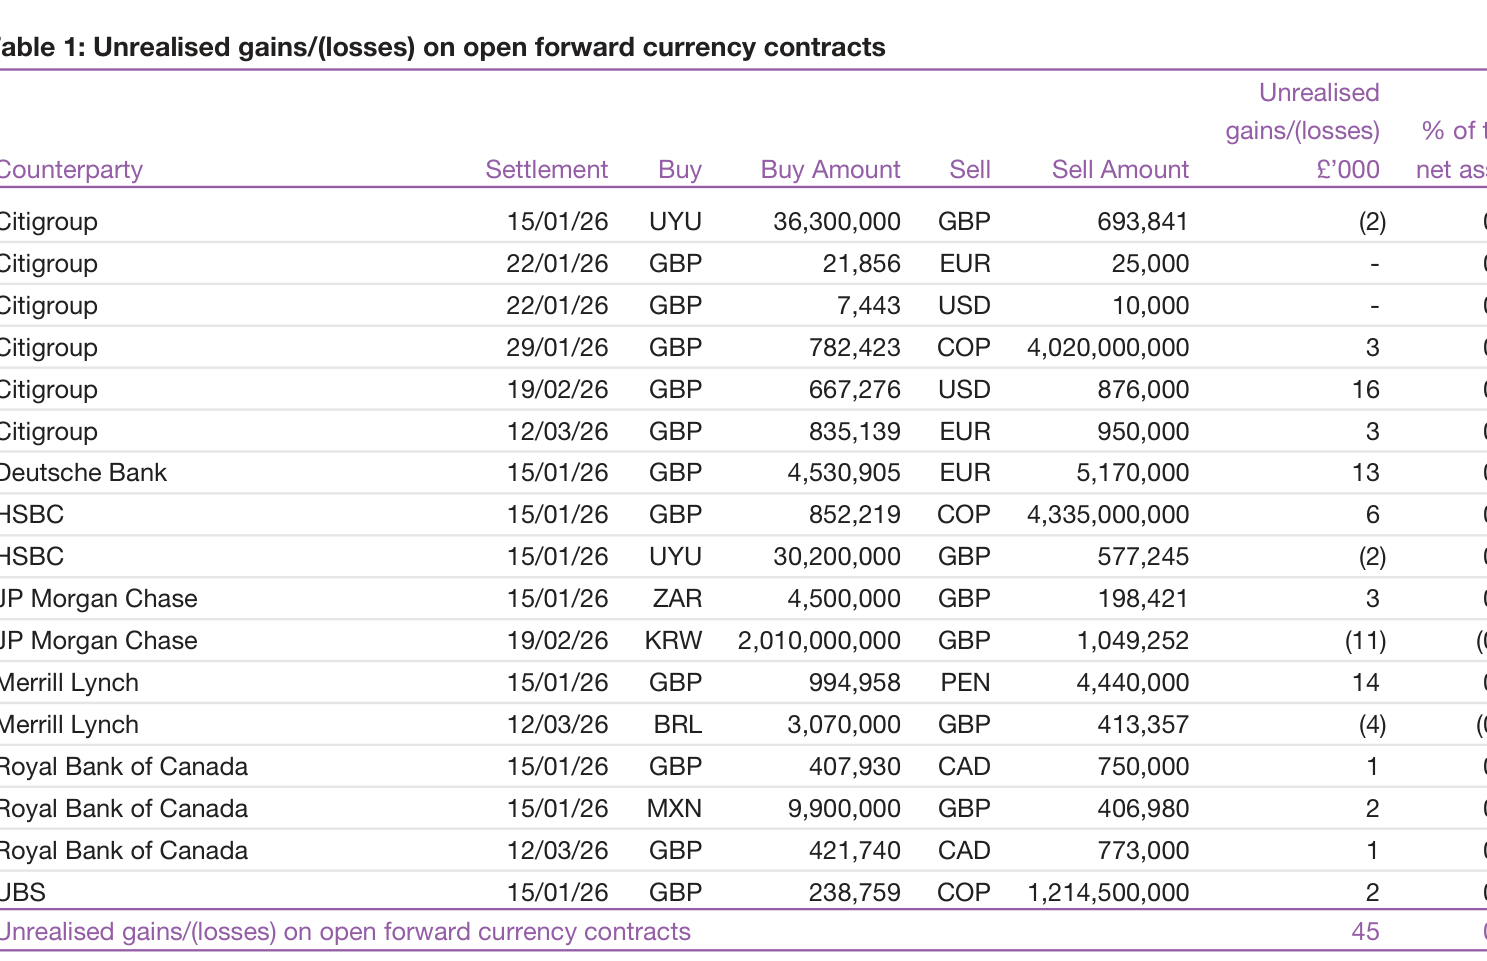
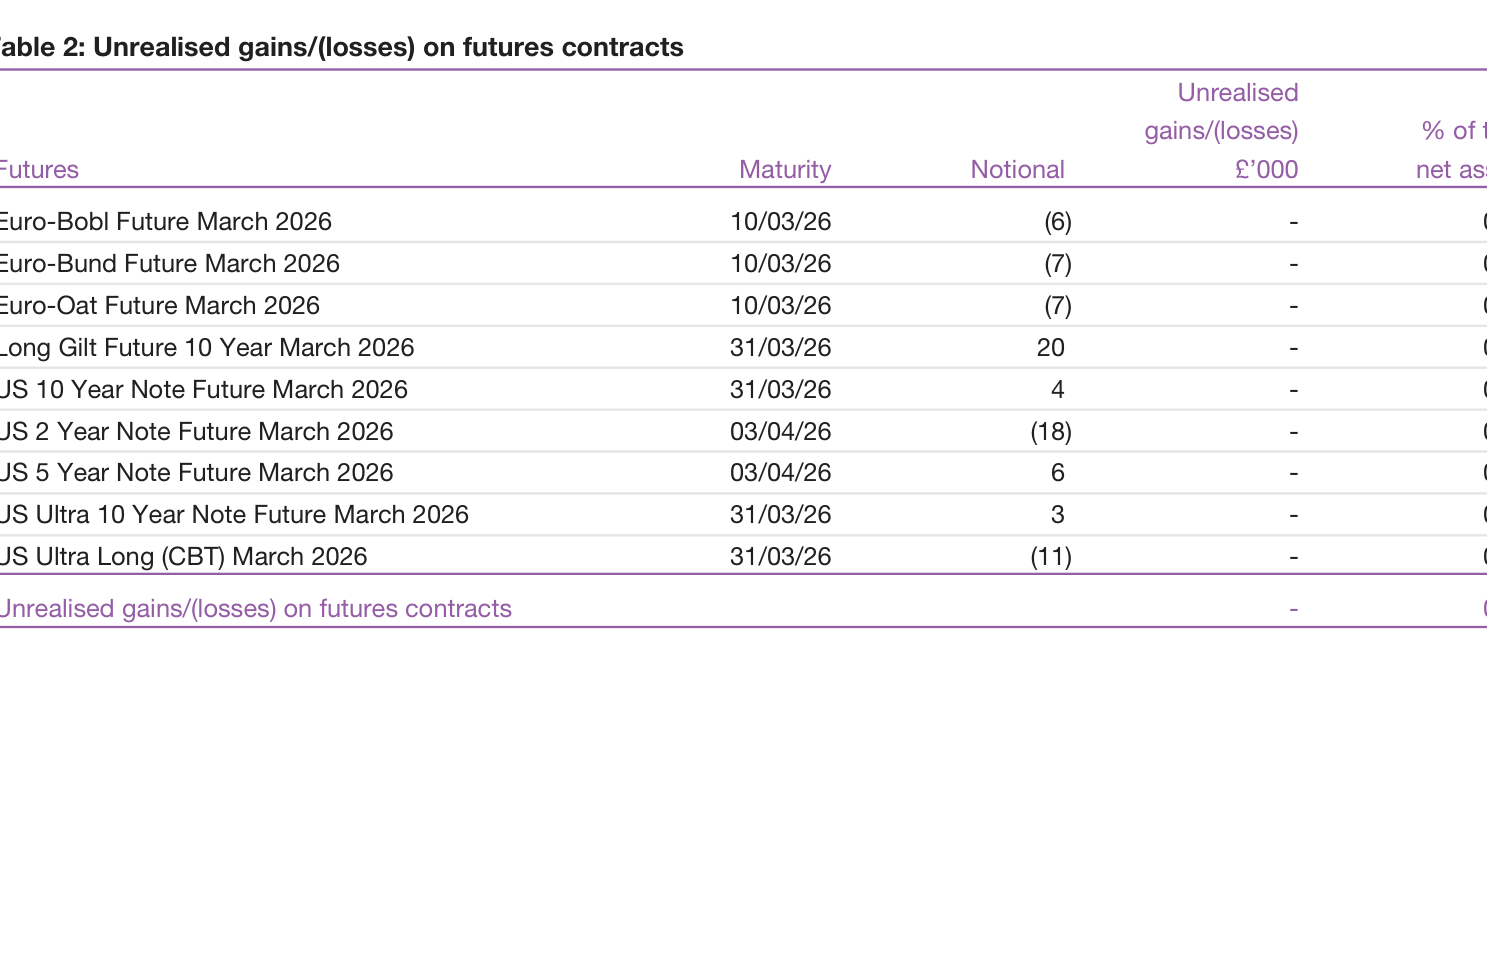
| Forward foreign exchange contracts | +45 | +0.11% | Predominantly emerging-market currencies, 12 counterparties |
| Futures contracts | ~0 | 0.00% | Gains/losses on 9 contracts largely offset each other |
| Interest rate swaps | +101 | +0.24% | Clear yield curve trading characteristics |
| Credit default swaps | -77 | -0.18% | Primarily iTraxx Crossover protection |
In the forward FX basket, emerging-market currencies carry significant weight: the Uruguayan peso (UYU), Colombian peso (COP), Peruvian sol (PEN), Mexican peso (MXN), South Korean won (KRW), Brazilian real (BRL), and South African rand (ZAR) collectively involve large notional contract amounts, yet the net contribution is only +£45 thousand. Among them, the two-way Uruguayan peso/pound positions are mutually offsetting (losing £2 thousand and £2 thousand, respectively), indicating this is currency risk management rather than a directional speculative position.
The interest rate swaps exhibit a typical “curve steepener” trading structure: at the short-to-medium end (maturing 2028–2031), the fund pays fixed and receives floating (SONIA/SOFR), while at the long end (maturing 2055) it is the reverse—receiving a fixed rate of 4.6172% and paying floating SONIA. This combination of paying fixed at the short end and receiving fixed at the long end implies an expectation that “short-end rates have limited room to fall, while long-end rates may stay elevated.” The only HUF swap (paying 6-month BUBOR and receiving 6.057%) is an alternative allocation in a non-mainstream currency.
The CDS positions are very small in size but clear in direction: all are bought protection, concentrated in iTraxx Europe Crossover (two contracts with a combined notional of EUR 800,000) and the single name Ardagh Packaging. The market-value loss of £77 thousand is equivalent to paying roughly 9.6 basis points in protection costs (based on the EUR 800,000 notional). Against a backdrop where this is only 0.18% of net assets, this is more of a portfolio-level credit hedge than a directional bet.
III. Share-Class Structure: C-Class Institutional Shares in a “Quiet Period,” B-Class Retail Shares Continue to See Redemptions
Share-class change data in the continuation show that the only class to experience a change in share count during the reporting period was the B Accumulation class—falling from 15,382,782 to 14,154,294 shares, a net redemption of approximately 1.23 million shares (-8.0%); the C-class share count remained completely unchanged during the period (20,252,150 shares).
| Share Class | 2025.12.31 | 2025.06.30 | 2024.06.30 | Change Characteristics |
|---|---|---|---|---|
| B Accumulation | 14,154,294 | 15,382,782 | 23,703,751 | Still net redemptions this period, but at a slower pace |
| C Accumulation | 20,252,150 | 20,252,150 | 111,202,529 | Zero change this period; significant redemptions in earlier period |
Lengthening the timeline shows that redemption pressure was concentrated from mid-2024 to mid-2025—C-class shares plummeted from 111.2 million to 20.25 million over one year (-81.8%), while B-class shares fell only 35.1% over the same period. This period’s “freeze” in C-class shares combined with continued net redemptions in B-class shares indicates that institutional investors have largely completed their exits, with the current outflow driven mainly by retail investors.
The fund-flow data provides a sense of magnitude: subscriptions of +£2,708 thousand and redemptions of -£4,051 thousand in the current period, producing a net outflow of £1,343 thousand. Compared with the prior period (the June 2024 period) net outflow of £9,312 thousand, the outflow pressure has decreased substantially.
IV. Current-Period Performance and Income Distribution: Prices Recovered, Income Sharply Lower, Payout Ratio Extremely High
On net asset value performance, all three share classes delivered positive returns:
| Share Class | Period-End NAV (p) | Period-Start NAV (p) | Period Change | High | Low |
|---|---|---|---|---|---|
| B Accumulation | 118.50 | 113.77 | +4.16% | 118.7 | 113.0 |
| C Accumulation | 122.60 | 117.50 | +4.34% | 122.8 | 116.7 |
| B Income | 95.47 | 93.65 | +1.94% | 96.71 | 92.97 |
The C class outperformed the B class by approximately 18 basis points, broadly in line with the 0.35% fee differential between them. The price range shows that NAV moved higher in a one-sided, oscillating fashion during the reporting period; the B Accumulation class’s high of 118.7 pence was only 0.2 pence above its period-end level of 118.5 pence, reflecting a “low-volatility climb” rather than a spike followed by a pullback.
On income and distributions, these need to be understood in light of the shrinking asset base:
| Metric | 2025.12 (six months) | 2024.12 (six months) | YoY Change |
|---|---|---|---|
| Income | 930 | 3,754 | -75.2% |
| Expenses | 43 | 62 | -30.6% |
| Net income (after tax) | 886 | 3,682 | -75.9% |
| Distributions | 873 | 3,137 | -72.2% |
The year-on-year decline in income (-75.2%) is highly synchronized with the contraction in net assets (from £149,029 thousand to £41,603 thousand, -72.1%), indicating that the drop in income was driven mainly by shrinking scale rather than deterioration in coupon-earning capacity. Distributions accounted for 98.5% of net income, with nearly all net earnings distributed. The B Income class paid a dividend of 2.05 pence per share; based on a period-end NAV of 95.47 pence, the semi-annual distribution rate is about 2.15% (approximately 4.3% annualized), so the income characteristics remain distinct.
Overall, the fund’s operating characteristics over the half-year can be summarized as follows: bond price recovery generated capital gains, scale contraction limited the absolute amount of income, retail investors took a dominant position, and the derivatives portfolio was primarily used for refined risk hedging without materially amplifying directional exposure.
Structural Contraction of the Balance Sheet and Precursors to Liquidation
Net assets rose from £41,298 thousand to £41,603 thousand, which on the surface appears to be a slight increase of £305 thousand, but the direction and scale of asset changes reveal a deeper logic. Total assets declined by £2,138 thousand (-4.9%), while total liabilities fell by £2,443 thousand (-89.6%); the increase in net assets was driven entirely by a large-scale cleanup on the liability side, not by operating profits. Specifically:
| Item | 31 Dec 2025 (£’000) | 30 Jun 2025 (£’000) | Change |
|---|---|---|---|
| Investments | 40,831 | 41,423 | -592 |
| Cash and bank balances | 511 | 1,771 | -1,260 |
| Investment liabilities | (137) | (1,215) | +1,078 |
| Bank overdrafts | (38) | (1,019) | +981 |
| Other creditors | (110) | (494) | +384 |
Cash and bank balances plunged by 71.1%, but over the same period investment liabilities, bank overdrafts, and other creditors were collectively settled by approximately £2,443 thousand. This indicates that the fund actively called in cash during the half-year to settle external debts, rather than to reinvest. At the same time, investment assets fell only 1.4%, far less than the contraction in liabilities, suggesting that the fund manager did not undertake a large-scale reduction of the portfolio, but instead reduced leverage by repaying external financing or closing out derivatives. This pattern of “stable assets, liabilities brought to zero” is fully consistent with the ACD’s already-announced termination plan—the financial report is paving the way for liquidation or merger, not for the continuation of operations.
Accounting Impact of the Non-Going-Concern Assumption: The Alignment of Fair Value and Residual Value
The report specifically states that because the ACD intends to terminate the sub-fund, the fund is no longer regarded as a going concern; however, since the assets and liabilities in the balance sheet are measured at fair value, and fair value “is in substance equivalent to its residual value,” no adjustments to the financial data are needed. This assertion is technically feasible, but two implicit assumptions are worth scrutinizing:
1. Absence of a liquidity premium: If fair value is based on active market quotes, it may include a liquidity premium. In a liquidation scenario, forced selling could lead to price slippage, particularly for concentrated holdings in growth companies. The report does not disclose whether the portfolio contains securities with restricted liquidity.
2. Residual value of liabilities: Investment liabilities fell from £1,215 thousand to £137 thousand, a decline of 88.7%. This is not natural market fluctuation but most likely active closing of positions. If these liabilities involve derivatives contracts that have not yet been settled, their residual value is related to the cost of terminating the contracts and may not equal fair value.
Although the accounting treatment is compliant, investors should view this as a risk signal: once the liquidation process begins, the actual realizable net value may be lower than the fair value disclosed in the report, especially during a market downturn.
Performance Target vs. Actual Results: A Quantitative Comparison of Long-Term Deviation
The report provides key performance data as of 31 December 2025. A direct comparison reveals the extent to which the fund’s strategy has failed:
| Period | Fund B-Class Share Return | MSCI ACWI Index | Target (Index + 2%) | Excess vs. Index | Excess vs. Target |
|---|---|---|---|---|---|
| Six months (2025.07-12) | 6.0% | 13.5% | 14.6% | -7.5 pct | -8.6 pct |
| Five-year annualized (as of 2025.12) | -2.8% | 12.1% | 14.3% | -14.9 pct | -17.1 pct |
Underperforming the index by 7.5 percentage points over six months can still be attributed to short-term style rotation, but a five-year annualized underperformance of 14.9 percentage points means that an initial investment of £100 would have left only approximately £86.8 after five years (based on the -2.8% annualized return), while the index would have grown to £176.6 (based on the 12.1% annualized return). With the target set at Index + 2%, the fund would have needed to achieve an annualized 14.3%, yet its actual performance fell 17.1 percentage points short of that target—this is no longer “missing the target” but strategic failure.
What is especially noteworthy is that the Fed cut rates in September 2025 and global equity markets continued to rise, yet the fund generated only a 6.0% return. A high-interest-rate environment typically suppresses valuations of long-duration growth stocks, but after a rate cut, growth stocks should have rebounded meaningfully. The fund’s failure to benefit suggests there may be deeper problems in its portfolio structure: perhaps it is overly concentrated in unprofitable sustainable technology companies, or constrained by the UN Global Compact and Alignment Assessment screening mechanisms, which passively exclude traditional high-beta sectors such as energy and materials—sectors that led the post-rate-cut rally.
The Cost of Sustainability Constraints: A Performance Ceiling Locked In by “Major Global Challenges”
The investment policy requires at least 70% of assets to be invested in companies that “address major global challenges,” and these companies must derive at least 30% of their revenue or profits from related areas. At the same time, the report notes that “Revenue-based screens are applied that exclude companies with a defined level of activity in certain sectors.” This dual constraint (thematic targeting + sector exclusion) limits the investable universe to a relatively narrow range. In practice, this constraint has not translated into a sustainability premium; instead, it has become a primary source of long-term negative excess returns.
In global markets, traditional energy, mining, and parts of high-emission manufacturing have posted strong profits in recent years (for example, during the energy crisis and supply-chain restructuring of 2022–2025), but these sectors are excluded by the fund. Sustainable-theme sectors such as healthcare, financial inclusion, and clean technology, despite having long-runway characteristics, have seen their valuations compress over the past five years because of interest-rate shifts and high capital costs. The fund’s five-year annualized return is negative while global indices achieved double-digit growth, revealing a harsh fact: at the current stage, ESG constraints and shareholder value are in significant conflict.
But this does not necessarily negate the long-term logic of sustainable investing. The report also points out that its objective is assessed over “rolling five-year periods,” and the past five years (2021–2025) happened to be a disastrous period for growth stocks—from peak valuations in 2021 to the tightening cycle of 2022 and the gradual rate cuts by 2025. The fund’s holdings at inception were likely concentrated in high-valuation growth stocks, creating an unfavorable base effect. Nevertheless, for investors, five consecutive years of significant underperformance is hard to justify on the basis of “time horizon.”
The Future of the Fund Merger: Strategic Pivot or Cutting Losses?
On 21 January 2026, the ACD announced plans to merge this fund into the Baillie Gifford Global Alpha Paris-Aligned Fund. This move appears logical given the persistently weak performance. But investors must note two key differences:
1. Relaxation of sustainability standards: Paris-Aligned funds typically follow the Paris Agreement capital-allocation guidelines, focusing mainly on greenhouse-gas emission-reduction pathways, rather than this fund’s “three themes” (People, Planet, Prosperity) and the 30% revenue threshold. This could mean that after the merger, the fund can invest in more low-carbon transitioners in traditional industries (such as energy companies and industrial giants), making the sector distribution closer to the market index and thereby reducing the degree of deviation.
2. Fee and tax treatment: The merger requires shareholder approval and regulatory clearance, and the fund may suspend subscriptions and redemptions during the process. If the merger takes the form of a share exchange, it would constitute a taxable event, and investors need to watch the capital-gains implications. The report does not disclose the post-merger fee structure, but based on the usual management fee for the Global Alpha series (0.50% for Class B of this fund), the post-merger fee may stay the same or be reduced; nevertheless, the cost-allocation effect after asset scale integration is worth assessing.
The shift from “termination” to “merger” indicates that the ACD is not simply liquidating, but is attempting to move assets into a sustainable strategy more in line with current market conditions. But for investors who have held this fund for more than five years, this is tantamount to admitting the failure of the original strategy.
Actual Risks Not Covered by the Risk Indicator: Specific Vulnerabilities in Liquidation and Merger
The fund is classified in the “investment company equities” category in the risk and reward indicator, but no specific level is assigned. More importantly, the indicator is based on historical data and cannot reflect the following risks that are strongly related to current events:
- Liquidity cliff: Once the fund enters a liquidation or merger transition period, subscriptions and redemptions may be suspended, leaving investors unable to exit in a timely manner. The balance sheet shows cash of only £511 thousand, just 1.2% of total assets; if investment liabilities require additional margin, the cash buffer is severely inadequate.
- Custody risk: The report notes that “Custody of assets involves a risk of loss if a custodian becomes insolvent.” In the context of fund termination, a change of custodian or account migration could introduce operational risk.
- Fair-value distortion: Under the non-going-concern assumption, fair value is claimed to equal residual value, but if the liquidation process takes time, market volatility will erode NAV. In particular, the portfolio may include illiquid unlisted assets or emerging-market equities whose valuations depend on models rather than actual trades.
- Fee-erosion signal: The report explicitly states that “Where possible, charges are taken from income. If insufficient, the rest will be taken from capital.” With negative performance, fees are being deducted from capital, further depressing net assets—while administrative costs during liquidation may rise additionally, leaving shareholders to bear more costs.
These risks already exist when the fund operates normally, but the liquidation scenario amplifies their impact. While waiting for the shareholder vote, investors should closely monitor the shareholder letters sent by the ACD regarding the timeline, fee estimates, and final asset-distribution details.
Structural Signals from Fund Size Changes and Fund Flows
The current report discloses a data point worthy of in-depth reading: the fund’s total net assets fell from £493.3 million on 30 June 2025 to £394.8 million on 31 December 2025, a decline of approximately £98.58 million, or 20%. This change far exceeds what can be explained by market fluctuations over the same period, and clearly includes the impact of large net redemptions. From share-class data, B Accumulation shares fell from 32.53 million to 24.48 million, and C Accumulation from 12.38 million to 6.21 million, with the two classes together declining by more than 8 million shares, confirming systematic withdrawals by institutional and retail investors during the period.
| Date | Net Assets (£’000) | Most Significant Share-Class Change |
|---|---|---|
| 30.06.2025 | 493,355 | — |
| 31.12.2025 | 394,756 | B Acc (-8.05 million shares), C Acc (-6.17 million shares) |
The “double bleed” from redemption pressure combined with performance lag deserves attention. The fund achieved a positive absolute return over the half-year yet still suffered large-scale redemptions, indicating that investors’ sensitivity to relative performance is rising—the holding experience (the gap relative to the index), rather than absolute returns, has become the dominant driver of fund flows.
Three Logics in the “High-Conviction Repositioning”
The new positions and liquidations in the current period reflect the manager’s decision-making framework in different scenarios, which can be summarized as three differentiated logics:
Contrarian valuation-reset type—Both Novo Nordisk and Duolingo are names entered after sharp share-price pullbacks. Novo Nordisk’s valuation reset (due to concerns about the GLP-1 competitive landscape) offered a window to enter a high-certainty growth track at a more reasonable price; Duolingo was entered during a strategic phase in which management deliberately chose to prioritize user growth over near-term monetization. What the two have in common is that their fundamental trends remained intact, but market sentiment provided a price discount.
Fundamental-disproof type—The reverse case is the exit from Inspire Medical Systems. Management explicitly acknowledged that its “growth trajectory continues to fall short of expectations,” and combined with the evolution of the treatment landscape, this meant that the original investment thesis had weakened. This shows that the fund does not mechanically hold to a target price, but continuously validates its original growth assumptions; once a core premise is disproven, it decisively cuts losses.
Operating-momentum stall type—The exits from Sweetgreen and CTI stemmed from “weaker-than-expected operating momentum.” This belongs to the same category as the Inspire exit, but the difference is that in these cases the thesis was not disproven; rather, the pace of growth itself failed to meet the screening threshold. This distinction reflects the fund’s strict requirement between a “good company” and “growth at the pace that meets our standards.”
Structural Implications of Further Rising Portfolio Concentration
The combined weight of the top three holdings (Microsoft, Alphabet, TSMC) rose from the period-start level to 16.39%, and the top ten holdings accounted for approximately 37.69%. In a macro environment where market returns are concentrated in large-cap companies, this increase in concentration is not simply a defensive choice; more likely, it reflects active recognition of these companies’ structural positions in the AI capital-expenditure cycle.
| Holding | Weight (%) | Role During the Period |
|---|---|---|
| Microsoft | 5.93 | Core base position |
| Alphabet Class A | 5.62 | Largest contributor (AI marginal-cost advantage) |
| TSMC | 4.84 | Largest contributor (CoWoS/advanced packaging) |
| Top three combined | 16.39 | — |
Notably, Alphabet was increased during the half-year to a purchase size of £12.56 million, while Microsoft and TSMC also received additions of £4.52 million and £11.05 million, respectively. This echoes, at the management level, the market’s enthusiasm for AI infrastructure investment during the same period—but the fund’s screening standard is not simply AI-concept exposure; rather, it is “business models that can deploy AI at a lower marginal cost” (Alphabet’s in-house chips plus Gemini, TSMC’s irreplaceable packaging node).
Signals of Change in Regional Allocation
Two directional adjustments can be seen from the regional comparison:
First, Sweden’s weight declined significantly (6.30% → 4.90%), with Atlas Copco, Beijer Ref, and Epiroc collectively accounting for nearly all of the Swedish exposure. This regional reduction was not a liquidation of a single holding, but a systematic lowering of exposure to cyclical industrial risk, likely reflecting the manager’s defensive adjustment amid rising uncertainty in global manufacturing conditions.
Second, Denmark’s weight rose (2.93% → 4.57%), supported mainly by the new position in Novo Nordisk (1.53%) and DSV (3.04%). The two respectively represent structural growth (pharmaceutical demand) and improvements in logistics-integration efficiency, with a relatively high fit to the fund’s “sustainable growth” theme.
| Region | Dec 2025 Weight | Jun 2025 Weight | Direction of Change |
|---|---|---|---|
| Sweden | 4.90% | 6.30% | ↓ Significant decline |
| Denmark | 4.57% | 2.93% | ↑ Significant increase |
| United States | 50.37% | 49.88% | → Roughly flat |
Market-Structure Implications from Performance Attribution
The report repeatedly notes that “returns were increasingly concentrated in a relatively narrow group of large companies” and that “stock-level volatility and dispersion increased.” In this environment, the fund’s lag relative to the index does not necessarily mean a deterioration in stock-picking ability; rather, it reflects a style mismatch between its portfolio-construction strategy and current market momentum—the fund’s mid-cap growth holdings (such as MercadoLibre and The Trade Desk) faced valuation-compression pressure during a phase when the market favored mega-cap AI leaders.
From an absolute-return standpoint, the fund still recorded positive returns, and some of the suppressed holdings have “business fundamentals that remain intact” (for example, MercadoLibre’s strong GMV and payment-volume growth, and Intuit’s solid core-platform revenue growth), providing a fundamental basis for performance recovery in the next phase. Whether this recovery materializes depends on whether market style shifts from “concentrated bets on certainty” to “repricing growth differentiation.”
The following is additional analysis for Part 13, focusing on “share-class data, financial trends, liquidation signals, and the positioning of the new sub-fund, the UK Equity Core Fund.” Connecting with the previous 12 parts, this section draws on the overlapping portions of two official documents, with the focus on revealing fund flows and termination risk.
I. Dividend Per Share: No Regular Distribution for the Sustainable Growth Fund in the Current Period
Looking at “income per share,” all share classes are marked `n/a` for the six months ended 31 December 2025. This is not zero income, but rather no regular distribution was declared/paid during the period. Reviewing full financial-year data, distributions actually showed an upward trend:
| Share Class | to 31.12.25 | to 30.06.25 | to 30.06.24 | to 30.06.23 |
|---|---|---|---|---|
| B Accumulation | n/a | 2.75p | 2.54p | 1.85p |
| B Income | n/a | 2.72p | 2.50p | 1.83p |
| C Accumulation | n/a | 6.56p | 5.94p | 5.05p |
| J Accumulation | n/a | 3.90p | 3.56p | 2.82p |
| Y Accumulation | n/a | 3.14p | 2.92p | 2.21p |
This trend indicates that, as of the last complete financial year, the dividend-paying capacity of the fund’s underlying holdings was actually improving. The suspension of distributions in the current period is more of an operational arrangement under the fund’s termination/liquidation backdrop than a deterioration in fundamentals.
II. High/Low Prices: Six-Month Range Narrowed Significantly
Comparing the high and low prices, the Sustainable Growth Fund exhibited a pattern in H2 2025 of “highs not breaking prior highs, while lows moved up markedly”:
| Share Class | Current-Period High (p) | Current-Period Low (p) | Prior-Year High (p) | Prior-Year Low (p) |
|---|---|---|---|---|
| B Accumulation | 797.2 | 744.7 | 820.8 | 630.0 |
| B Income | 781.5 | 730.1 | 807.6 | 619.9 |
| C Accumulation | 807.1 | 752.8 | 828.0 | 636.1 |
| J Accumulation | 802.6 | 749.4 | 825.4 | 633.7 |
| Y Accumulation | 808.9 | 755.5 | 832.6 | 639.1 |
Notably, the prior year’s low was around 630p, while the current period’s low never fell below approximately 730p. This suggests that market sentiment has repaired somewhat after bottoming. However, the current period’s high is about 20p to 30p below the prior year’s high, meaning the fund’s price is still oscillating below its earlier highs and has not yet fully recovered.
III. Fee Structure: The C-Class Advantage Is Extremely Pronounced
Ongoing Charges remained stable, but the fee differences among share classes are worth emphasizing:
| Share Class | 31.12.25 | 30.06.25 | 30.06.24 | 30.06.23 |
|---|---|---|---|---|
| B Accumulation | 0.53% | 0.54% | 0.52% | 0.53% |
| C Accumulation | 0.03% | 0.03% | 0.02% | 0.03% |
| J Accumulation | 0.38% | 0.38% | 0.37% | 0.37% |
| P Accumulation | 0.48% | 0.46% | n/a | n/a |
| Y Accumulation | 0.49% | 0.49% | 0.47% | 0.47% |
The C class’s `0.03%` is nearly zero-cost, significantly lower than the B class’s `0.53%`. For long-term investors, the fee gap will have a huge impact through compounding. However, C-class shares are typically intended for institutions or large investments, and ordinary retail investors may find them difficult to access directly.
IV. Fund Flows: Net Outflow Exceeding £120 Million, Nearly 25% of Starting NAV
This is the most critical data in this report. The `Statement of Change in Net Assets` shows:
| Item | as of 31.12.25 (£’000) | as of 31.12.24 (£’000) |
|---|---|---|
| Opening net assets | 493,355 | 523,258 |
| Amounts receivable on issue | 8,767 | 4,584 |
| Payments on redemption | (130,395) | (40,831) |
| Net share transactions | (121,628) | (36,247) |
| Dilution adjustment | 158 | 49 |
| Change in net assets from investment activities | 22,871 | 37,073 |
| Closing net assets | 394,756 | 524,133 |
The calculation yields:
| Metric | Six months 2025 | Six months 2024 |
|---|---|---|
| Net redemption amount | £121.6m | £36.2m |
| Net redemptions as % of starting NAV | -24.6% | -6.9% |
Even though the fund achieved a positive return of £22.9m during the period, it was unable to offset the massive redemptions. Period-end NAV fell from £493.4m to £394.8m, a decline of about 20%. This is not simply market volatility; it is capital actively withdrawing.
V. Going-Concern Disclosure: The Fund Has Been Determined for Liquidation
The `Basis for preparation` section gives the clearest signal:
> The ACD intends to terminate the sub-fund.
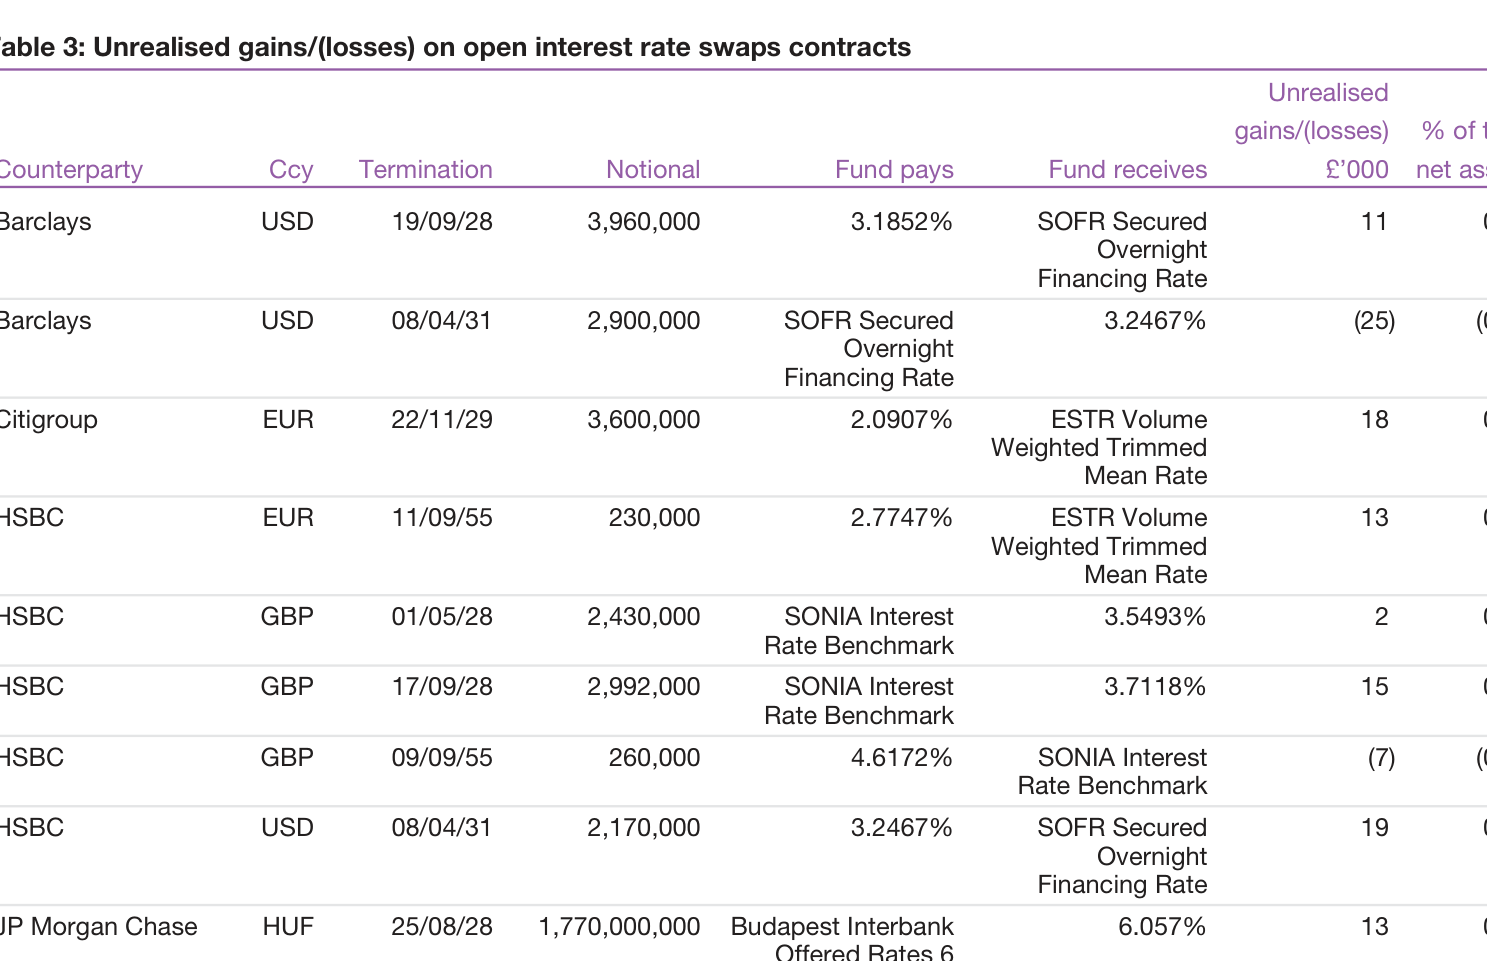
This means the sub-fund is no longer preparing its financial statements on a going-concern basis. The report also explains that, because assets and liabilities are measured at fair value and fair value is broadly consistent with residual value, the current statements do not require any additional impairment adjustments due to liquidation.
But investors need to note:
- Current NAV being close to recoverable value does not equal the final liquidation distribution value;
- The liquidation process may incur liquidation fees, legal and administrative costs, and the final amount received may be lower than the reported NAV;
- Massive redemptions may force the fund to sell assets at unfavorable times, thereby affecting the interests of remaining holders.
VI. UK Equity Core Fund: Introduction to the New Sub-Fund
The latter part of the report shifts to the Baillie Gifford UK Equity Core Fund, another sub-fund under the same ICVC umbrella structure.
1. Objective and Strategy
- Objective: to outperform the FTSE All-Share Index by at least 1% per annum after fees over a rolling five-year period;
- At least 80% of assets invested directly or indirectly in UK company equities;
- Actively managed, not index-replicating;
- Focus on the `net zero` 2050 target, with ongoing assessment of portfolio companies’ alignment with the net-zero objective;
- Uses norms-based screening, with reference to the UN Global Compact.
This means the fund writes the net-zero objective into its investment policy more explicitly than the Sustainable Growth Fund does, rather than just using the broad label of “sustainable growth.”
2. More Direct Risk Disclosures
The document explicitly acknowledges:
- Active stock selection combined with relatively concentrated holdings may lead to long-term underperformance of the benchmark;
- In adverse markets, assets may be difficult to sell in a timely manner;
- Third-party data may be delayed or based on estimates, affecting the achievement of non-financial objectives;
- Custodian insolvency or negligence may cause losses.
These risk statements are more blunt than those of the Sustainable Growth Fund, reflecting regulators’ wariness of “overpromising” in sustainable/net-zero strategies.
3. What the Performance Chart Reveals
The performance chart shows the annual comparison of the B Accumulation share class against the FTSE All-Share Index and the Index +1% target. Although the OCR data is somewhat misaligned, several features can be identified:
- Strong performance in 2020-2021, with the fund returning about 25.3%, clearly above the index’s 24.0%;
- Significant volatility in subsequent years; the chart contains negative return markers at the `-14.8%` and `-20%` levels, indicating that the fund did not outperform every year;
- In the most recent years, the gap between fund and index returns is not significant, and excess returns are not stable enough.
Therefore, investors should lower their expectations of “outperforming by 1% every year.” This target is only a long-term objective over a rolling five-year period, and short-term deviations can be significant.
VII. Horizontal Comparison of the Two Funds
| Dimension | Sustainable Growth Fund | UK Equity Core Fund |
|---|---|---|
| Current status | Liquidation announced | Operating normally |
| Investment universe | Global sustainable-growth theme | At least 80% UK |
| Benchmark/Target | Not disclosed in this section | FTSE All-Share +1% p.a. ( rolling 5y ) |
| Net-zero disclosure | Focuses on broad thematic trends | Explicitly written into investment policy |
| Fee levels | B class 0.53%, C class 0.03% | Not disclosed in this section |
| Risk characteristics | High-volatility growth stocks | High volatility, relatively concentrated |
This shows an internal product-line adjustment by the same fund manager: on one hand, liquidating the shrinking Sustainable Growth sub-fund, while on the other, continuing to maintain the UK Core Equity sub-fund’s operations. Fund flows also confirm that investors are shifting from “thematic sustainable growth” to a clearer, more measurable “UK core + net-zero constraint” strategy.
The next section should further examine whether the UK Equity Core Fund has similar large-scale redemption or fee data, as well as the final distribution arrangements after the Sustainable Growth Fund is liquidated.
This continuation provides more details on performance attribution, trading behavior, and portfolio-structure changes, and further incremental information can be extracted as follows:
I. The Deep Structure of the Performance Gap: The “Dual-Track” Dilemma of Six-Month Underperformance and Five-Year Cumulative Results
| Metric | Fund (B Class Accumulation) | Index (FTSE All-Share) | Target (Index + 1%/yr) | Gap (Fund - Target) |
|---|---|---|---|---|
| Six-month return (2025.7-12) | 7.1% | 13.7% | 14.3% | -7.2pp |
| Five-year annualized return | 6.0% | 11.7% | 12.8% | -6.8pp |
The six-month and five-year annualized gaps are similar (approximately -7pp), indicating that this is not a short-term random event but a structurally unfavorable environment. The report explicitly mentions “higher interest rates” and a “market environment that has favoured near-term certainty over long-term growth,” which directly explains the valuation pressure on long-duration growth stocks in the portfolio (such as Auto Trader and Rightmove).
II. Attribution Layers of Relative Returns: The “Opportunity Cost” of a Single Non-Holding
Notably, the report points out that “Not holding HSBC” was a major drag on relative returns. HSBC, a heavyweight in the FTSE All-Share Index, saw its share price rise strongly over the same period. This shows that the fund’s exposure to the banking sector was concentrated in Standard Chartered and smaller banks (such as Close Brothers and Sabre Insurance), while it failed to capture the rally in globally systemically important banks. This bias of “stock selection rather than timing” was amplified by the index’s weighted giant over the six-month horizon.
III. The Transmission Path of the AI Shock: The Technology Premium Discount on Non-Technology Companies
The report’s discussion of AI is especially critical: the concern does not come from technology hardware or software companies, but rather from data-driven, asset-light, high-margin platform companies—Auto Trader (online car marketplace) and Rightmove (property portal). These companies had previously been awarded a “data moat” premium, but when AI threatens to reshape the logic of traffic distribution, the market is repricing their moats. Rightmove’s announcement of a three-year £60 million technology investment actually triggered a short-term sell-off, reflecting the market’s aversion to tangible capital expenditure.
But the fund chose to interpret this in a contrarian manner: it believes these companies are financially healthy, with management teams that have not become complacent, and views the decline as an opportunity. This stance is consistent with Baillie Gifford’s long-term growth style, but it also explains the increased short-term volatility.
IV. Trading Logic: From Energy Exits to a Two-Way Layout of “Digital Assets + Physical Storage”
| Direction | Exited/Reduced | Added/Increased | Style Characteristics |
|---|---|---|---|
| Sell | EnQuest (small oil & gas), Just Group (takeover monetization), Weir, Ashtead, Diploma, Bunzl | — | Reducing low long-term growth, cyclical/mature industrials |
| Buy | — | Baltic Classifieds (online classifieds), Big Yellow (self-storage), Spirax Group, Bellway, Hikma | Digital platforms + defensive physical assets + specialty industrials |
There are two novel points:
1. Big Yellow Group—self-storage is a “counter-cyclical + physical asset” business with stable cash flows, forming a hedge against digital assets, suggesting the fund manager is adding defensiveness in an uncertain environment.
2. Just Group’s selling timing: after the Brookfield takeover offer drove the share price higher, it was sold for approximately £8.08m, the largest sale in the portfolio. This reflects event-driven profit-taking—both recognizing the market’s validation of the revaluation and recycling capital at elevated levels into names with more certain future growth.
V. Changes in Sector Weights: Net Rotation of Capital Across Sectors
| Sector | 30 Jun Weight | 31 Dec Weight | Change (pp) |
|---|---|---|---|
| Healthcare | 7.02% | 8.24% | +1.22 |
| Consumer Discretionary | 15.00% | 16.48% | +1.48 |
| Energy | 0.26% | 0.00% | -0.26 |
| Technology | 7.38% | 6.69% | -0.69 |
| Real Estate | 5.15% | 4.34% | -0.81 |
| Industrials | 26.08% | 25.64% | -0.44 |
| Financials | 23.41% | 24.17% | +0.76 |
The most significant changes are increased allocation to healthcare and consumer discretionary, and reduced allocation to technology and real estate. The increase in healthcare mainly stems from the rise or accumulation of AstraZeneca and Hikma (with AstraZeneca’s weight rising to 5.06% at period-end, making it the second-largest holding), while the reduction in technology may stem from declines in Auto Trader, RELX, and others, or from dynamic dilution. This reflects the fund manager shifting some exposure toward more traditional growth sectors after the emergence of “AI concerns.”
VI. Top Ten Holdings: A Concentrated Structure of “Heavy Financials, Light Technology”
As of period-end, the top ten holdings collectively accounted for approximately 39.37% (the arithmetic sum is 42.37? Verification: 5.21+5.06+4.23+4.10+3.71+3.60+3.37+3.17+3.05+2.87=39.37). Among them, financial institutions occupy four seats (Standard Chartered, Prudential, St. James’s Place, Legal & General), totaling roughly 16.52%, which is significantly higher than the index’s financial weight. The success or failure of banks and insurers will largely determine the portfolio’s relative performance. This is both a risk and an opportunity: in a rate-cutting cycle, net interest margin pressure on financial institutions may weigh on returns, but the report suggests these companies have structural drivers such as Asian wealth growth (Standard Chartered) and the pension market (Just Group, St. James’s Place).
VII. Other Details: Cash and Liquidity
At period-end, “Net other assets” accounted for 0.66% (2.03% at end-June), and the cash position declined. Reducing cash during a rising equity market suggests the fund manager is not bearish on the market, but rather keeping capital in high-conviction names. However, the 0.66% buffer is extremely thin; if the fund faces redemptions or liquidity demands, the portfolio would be forced to sell holdings, potentially at low prices—a point worth cautioning in extreme volatility.
VIII. Conclusion: Consistency of Strategy and Mismatch with Market Style
The core message of this report is that the fund’s investment process—seeking high-quality, long-term growth companies with attractive valuations—has been persistently mismatched with market preferences (low-rate beneficiaries, banks, defensive large-cap value) over the past five years. Half-year data show that “certainty” sectors such as banks and defense led the rally, while the fund’s long-term growth names (Auto Trader, Rightmove, and gaming names such as Games Workshop) were hit by the AI narrative. However, the report emphasizes that “Historically, this combination has provided a…” (the original text is incomplete), implying that historically this type of portfolio has tended to deliver excess returns subsequently. This is a classic “style patience” statement, and its validity depends on the future path of interest rates and the real speed at which AI’s impact materializes.
The fund information and interim financial data provide a solid basis for understanding the product structure, cost efficiency, and capital operations. The following expands on four dimensions—share-class differences, return drivers, liquidity management, and the dilution-adjustment policy—supplementing content not covered in previous analyses.
I. Share-Class Structure and Compounding Differences: The Clear Advantage of the C Class
| Metric (as of 31.12.25 or corresponding period) | B Accumulation | C Accumulation | Notes |
|---|---|---|---|
| NAV per share (pence) | 140.75 | 145.54 | C-class NAV consistently higher |
| Number of shares | 8,791,137 | 152,010,098 | C-class accounts for approximately 94.5% |
| Period income (pence / share) | 0.90 | 1.00 | Income gap does not widen with fees |
| Ongoing Charges Figure (%) | 0.44 | 0.02 | Cost difference is the core of compounding gap |
The C class not only has a fee as low as 0.02%, but also a huge share count, indicating that this class is the fund’s main distribution channel (such as institutional direct sales or zero-commission platforms). The B class has a fee of 0.44%, and the NAV gap widened from 109.71/107.22 (a difference of 2.49 pence) on 30.06.23 to 145.54/140.75 (a difference of 4.79 pence) on 31.12.25, nearly doubling in two and a half years. This is the “erosion effect” of low fees in compounding: when total returns are similar, a 0.42-percentage-point annual cost difference will continuously widen the NAV gap. Given that the B class has a relatively small number of shares (only 8.79 million), its higher fee is not necessarily a product-design flaw; it may be a legacy issue or the pricing for a specific sales channel.
II. Interim Financial Data: Capital Gains Dominant, Income Under Pressure
| Item (£’000) | 31.12.25 | 31.12.24 | YoY Change |
|---|---|---|---|
| Net capital gains | 13,120 | 9,054 | +44.9% |
| Revenue | 2,492 | 2,871 | -13.2% |
| Expenses | (49) | (42) | +16.7% |
| Total return before distributions | 15,563 | 11,883 | +31.0% |
| Change in net assets from investment activities | 14,132 | 10,039 | +40.8% |
The substantial increase in capital gains alongside declining income clearly indicates that the fund is positioned as a “core equity growth” vehicle: dividend income contributes only a limited amount to total returns (Revenue accounts for only 16% of total return), with the main returns coming from share price appreciation. The absolute amount of expenses is only £49 thousand. Against net assets of £2.33 billion over the same period, the annualized cost ratio is approximately 0.04%, consistent with the weighted estimate of C-class 0.02% and B-class 0.44% fees (approximately 0.045%). This shows good internal consistency in the expense data and confirms the structural advantage of “C-class dominance + low fees.”
Another notable point: Revenue fell by 13.2% year on year, while capital gains rose by 44.9%. This may mean that the fund manager switched into low-dividend, high-growth names during the period, or that some portfolio companies cut their dividends. For long-term holders, income volatility has limited impact on total returns, but changes in dividend policy should be watched for their impact on cash-flow-sensitive investors.
III. Balance Sheet and Fund Flows: Net Subscriptions Drive Net Asset Expansion
| Item (£’000) | 31.12.25 | 30.06.25 | Change |
|---|---|---|---|
| Investments | 232,068 | 203,185 | +14.2% |
| Cash and bank balances | 2,376 | 3,824 | -37.9% |
| Bank overdrafts | (805) | - | New |
| Net assets attributable to shareholders | 233,614 | 207,395 | +12.6% |
The 12.6% increase in net assets consists of three components: £14,132 thousand from investment activities, £10,341 thousand from net subscriptions (subscriptions of £25,274 thousand minus redemptions of £14,933 thousand), and £1,599 thousand from retained distributions. Net subscriptions equaled 5% of beginning net assets, indicating strong market demand for low-fee core equity products.
On the balance sheet, cash balances fell from £3,824 thousand to £2,376 thousand, while a new bank overdraft of £805 thousand appeared. The emergence of the overdraft seems contradictory, but in fact it may be a short-term liquidity gap caused by differences in settlement timing. For example, before large subscription funds arrive, the fund manager may have already placed orders to buy stocks, creating a temporary overdraft; or there may be a mismatch between redemption payments and the settlement of sold securities. For a fund of approximately £233 million, an overdraft of £805 thousand is less than 0.35%, which is not a risk, but it shows that the fund manager prefers to maintain a high position and keep idle cash to a minimum.
IV. Dilution Adjustment: Current Policy and Investor Costs
The panel explains in detail the trigger conditions and execution logic of the Dilution Adjustment. The ACD currently applies dilution adjustment to the issue and cancellation of all share classes, meaning that the actual execution price for investors on a dealing day will deviate from the underlying NAV to cover bid-ask spreads and transaction costs. The transparency of this practice is acceptable, but three details deserve investors’ attention:
1. Threshold amplifying per-trade costs: When net inflows or outflows on a given day exceed the preset threshold, the ACD will increase the dilution-adjustment magnitude. All trades that day (including small trades) will be executed at the adjusted price. Thus, small investors may bear disproportionate additional costs on days of heavy subscriptions/redemptions. This is essentially a “price penalty” mechanism that deters short-term arbitrage, but it can also inadvertently harm ordinary investors.
2. Unpredictability of policy adjustments: The document explicitly states that it is “impossible to predict when an adjustment will be made,” because it depends on that day’s net fund flows and market liquidity. For institutional investors that trade frequently, this is an additional uncertainty; for long-term holders, it is precisely a protection—preventing existing shareholders from bearing implicit transaction costs due to the entry and exit of new money.
3. Regulatory compliance background: The document emphasizes the final interpretation right, periodic review, and HMRC reporting obligations. This reflects the strict requirements for fair pricing and tax transparency under the UK UCITS/ICVC framework. Investors must submit a tax-residency declaration when opening an account, or they may be unable to complete transactions—an administrative hurdle that is especially important in cross-border investing.
V. Risk Disclosures and Performance Reference
In the footnote, the Synthetic Risk and Reward Indicator (SRRI) reminds that the fund’s risk level is based on historical data and is not a reliable indicator of future performance. Looking at the four-year price range: the C class moved from a low of 92.93 pence on 30.06.23 to a high of 147.2 pence on 31.12.25, a cumulative increase of approximately 58%, with an annualized return of about 19% (a rough estimate), while the average difference between the period’s high and low prices is about 15%, indicating that volatility is manageable. But it must be remembered that this range only represents the past; changes in the future market environment may significantly increase drawdown risk.
In summary, this set of data and policy descriptions paints a picture for investors of a core equity fund with “low fees, high positioning, growth orientation, and sustained capital inflows.” The cost data in the interim report corroborate the fee disclosures, while the dilution-adjustment policy provides an important defense for protecting long-term shareholders’ interests. When continuing to read subsequent sections, it may be useful to focus on portfolio concentration and sector allocation to verify whether the growth in capital gains is sustainable.
Continuation Analysis (Parts 16/17)
I. Dilution Adjustment: From One-Off Compensation to Structural Institutional Design
The basic function of dilution adjustment has been discussed earlier. This passage reveals two design details that deserve more attention: the asymmetric mechanism based on the net-flow direction and the proportional pass-through across share classes.
1. The Logic of Systematic Compensation Under Netting
The text explicitly states that the adjustment is based on “net inflows” and “net outflows,” i.e., determined by the net direction after offsetting subscriptions and redemptions on the day. The commercial significance of this “netting-offset” design is that, at the fund level, the transaction costs actually incurred are generated by both buyers and sellers; but by using a net basis, only a single directional adjustment is needed, reducing operational complexity. However, this also creates a systematic behavioral bias—in a market environment of one-sided net inflows, the incremental capital continuously buying in actually bears all of the transaction-cost compensation, while existing investors redeeming on the same day get a free ride. In the Investment Association’s industry guidance for OEICs, the typical dilution-adjustment compensation ratio is usually within a certain industry-customary range of transaction costs, with the specific figure determined prudently by the ACD on a daily basis; nevertheless, the consistency of direction judgment in this mechanism remains an audit focus.
2. The Fairness Implications of Proportional Pass-Through
The statement “any dilution adjustment will in percentage terms affect the dealing price of shares of each class identically” appears to be a neutral explanation on the surface, but in fact implies an important pricing principle: although the absolute prices of different share classes differ significantly because of fee structures (for example, the prices of C-class and P-class shares may differ several-fold), the dilution adjustment acts as a multiplicative factor (rather than an additive markup) applied to the underlying NAV, ensuring that all classes bear transaction costs at the same percentage. This avoids the problem of higher-priced classes (usually low-fee institutional classes) being overcharged in absolute amount, and reflects fair protection for institutional shareholders.
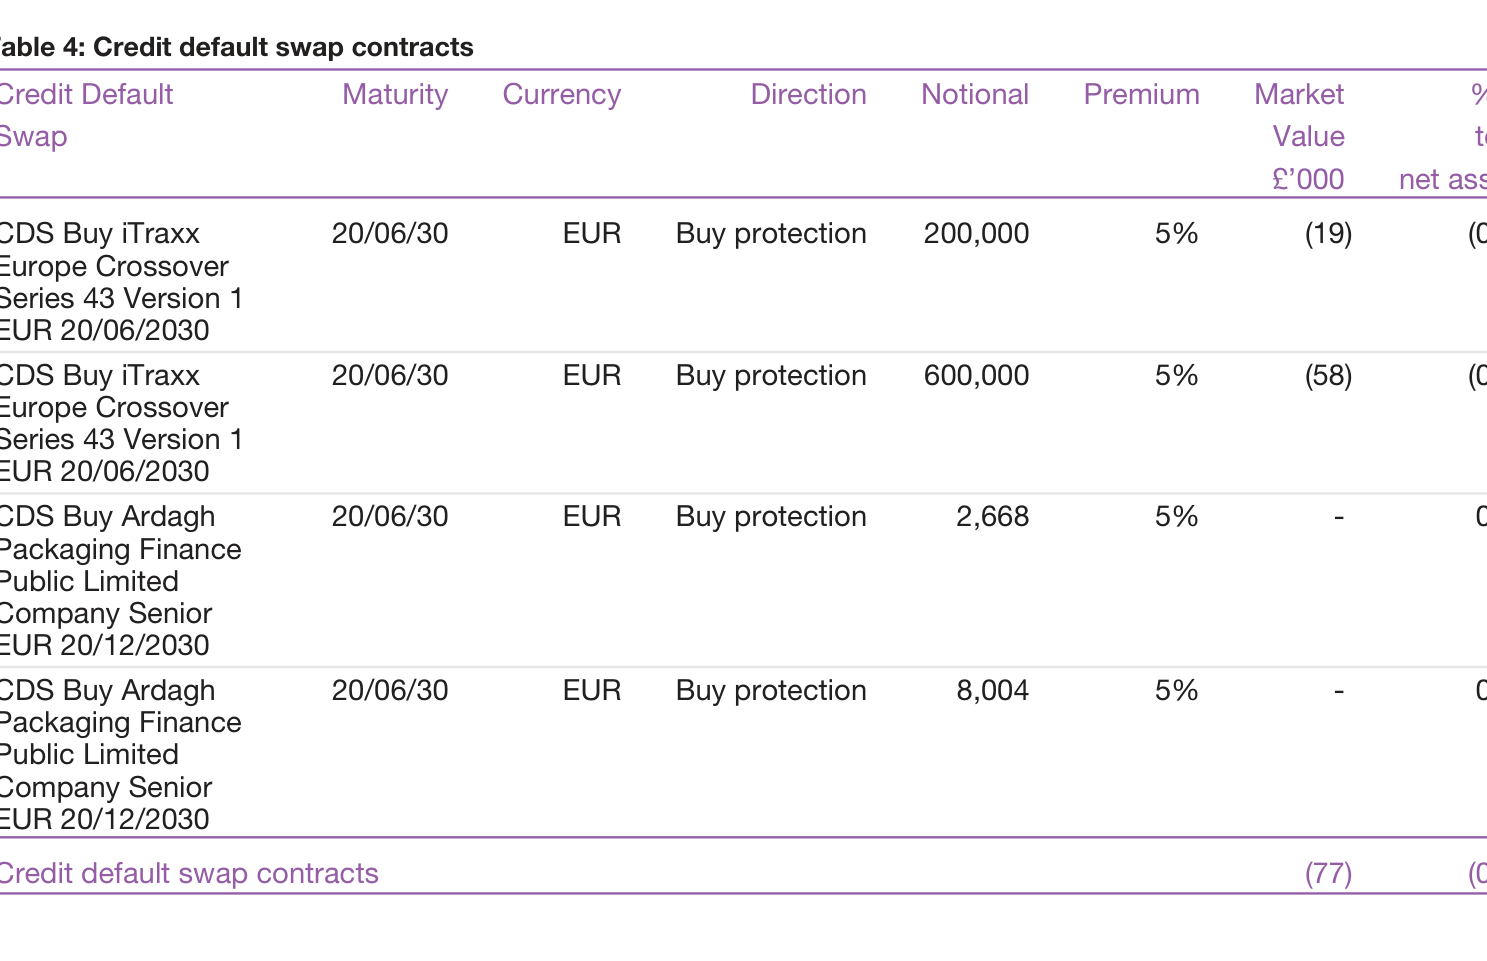
II. Share Class Matrix: The Commercial Logic of Agreement-Based Classification
This filing densely discloses the admission conditions for six share classes: C, H, J, P, W, and Y. Placing these conditions side by side makes clear that Baillie Gifford's share class framework is not a traditional sales-channel classification, but rather a fine-grained segmentation based on customer relationship morphology:
| Share Class | Core Admission Condition | Relationship Feature |
|---|---|---|
| Class C | Acceptance of investment management services provided by the ACD or its affiliates | Bundled advisory service commitment |
| Class H | Separate agreement signed with the ACD/affiliates | Customized institutional agreement |
| Class J | Agreement covers aggregated investment flows and marketing activities | Flow commitment / distribution partnership |
| Class P | Institutional pension platform + ACD's sole discretion | Platform-based admission |
| Class W | Separate fee agreement | Direct-fee structure |
| Class Y | Specific merger history origin (former Phoenix holders) | Legacy/closed-ended nature |
The essence of this classification system is breaking down the management fee discount entitlement into a hierarchy of negotiable variables — each admission condition essentially corresponds to a service attribute that can be priced independently. Unlike the U.S. share class system (typically divided into A front-end load / B back-end deferred / C level load / I institutional no-load), the U.K. ICVC regime has largely prohibited commission-driven share classes under the FCA's RDR (Retail Distribution Review) framework. Baillie Gifford has therefore shifted toward a multidimensional segmentation strategy anchored on "agreement relationships," unbundling marketing costs, advisory costs, platform costs, and flow commitments across different agreements to achieve granular fee differentiation.
Notably, Class P's "otherwise considered appropriate by the ACD at its sole discretion" and Class Y's "such other persons as the ACD may permit at its sole discretion" both retain a sole-discretion channel. These flexible clauses provide a legal interface for admitting large institutions or closed-end legacy shares in the future, allowing flexible operation without amending the prospectus.
III. SDRT and Equalisation: Two Nested Layers of the Tax Structure
1. SDRT Trigger Mechanism for Non-Pro-Rata In-Specie Redemptions
The text notes that ordinary redemptions do not trigger SDRT, but non-pro rata in specie redemption is an exception. This means that when a fund satisfies redemption requests by distributing securities in specie, and the distribution ratio deviates from each shareholder's holding ratio, the transferred UK securities will be treated as a taxable transfer subject to the standard 0.5% SDRT rate. The practical consequence of this exception is that large institutions must, before initiating large in-specie redemptions, specifically assess whether the transaction incurs additional tax costs due to non-pro-rata distribution. For fund managers, this also constitutes an implicit constraint when making distribution decisions between "cash redemption vs. in-specie redemption"—a poorly designed in-specie distribution could shift otherwise avoidable tax burdens onto the redeeming shareholder.
2. Group Classification Accounting for Equalisation (with Numerical Illustration)
The text describes a classic two-track equalisation model:
| Dimension | Group 1 (Existing Shares) | Group 2 (New Subscriptions During Period) |
|---|---|---|
| Definition | Held since previous distribution period | Newly subscribed during current period |
| Accumulated net income included in subscription price | None | Includes equalisation amount |
| First distribution | Full net income | Income + equalisation repayment |
| Tax treatment | Entirely income | Repayment portion treated as capital return |
Using a simplified numerical example: suppose a sub-fund has accumulated net income of £0.20 per unit, and a new investor subscribes at £10.20 (£10.00 NAV + £0.20 equalisation). At the first distribution, the investor receives £0.20 income + £0.20 repayment, matching the total amount received by existing investors. However, the £0.20 repayment is capital in nature, is not counted as taxable income, and is instead deducted from the subscription cost basis—i.e., the CGT base is adjusted from £10.20 to £10.00. The core purpose of this mechanism is to ensure that new and existing investors within a distribution period are perfectly equal in distribution amounts, while maintaining tax fairness.
There is another key statement: "An 'income equalisation-like' mechanism will be operated by the ACD for conversions"—that is, share class conversions are also brought under a similar mechanism. This resolves the common conversion arbitrage problem in practice: if an investor transfers from Class C to Class W on the eve of a distribution period, the accumulated income carried along must be recognised through an equalisation-like adjustment; otherwise, the distribution fairness between the two classes would be distorted.
IV. Tax Reporting Obligations: The ACD's Pivotal Role in Compliance
Although the text's disclosure on Taxation Reporting is limited in length, it effectively encapsulates the modern fund compliance framework. The ACD's collection obligations span four levels: identity, tax residency, tax status, and financial information on shareholdings, and require self-certifications and tax reference numbers. This maps directly onto two international compliance infrastructures:
- FATCA (Foreign Account Tax Compliance Act): requires reporting of U.S. taxpayers' shareholding information.
- CRS (Common Reporting Standard): the OECD-led multilateral framework for automatic exchange of information.
Notably, the inclusion of "controlling persons" goes beyond the beneficial owner level, extending to look-through reporting of the actual controllers of institutional shareholders. For pension platforms where holdings are held through the platform, this means the platform must cooperate to provide the chain of information on ultimate beneficiaries. The ACD's reservation of the right to "refuse an application" effectively establishes a firewall between compliance risk and business expansion: investors with incomplete information will be turned away.
5. Conflict of Interest Management: From Principle Statements to Organizational Design
This section's disclosure of conflict-of-interest provisions can be viewed as a three-dimensional management system:
First dimension: actor matrix. The text identifies four types of interested parties—ACD, Investment Adviser, related parties, and other clients/funds. These parties simultaneously manage multiple sub-funds with similar investment objectives, generating inherent trade allocation conflicts (such as how to allocate the same security when multiple funds buy or sell it at the same time).
Second dimension: types of conflicts of interest. These include conflicts between the ACD and shareholders (e.g., fee setting), conflicts among different shareholder groups (e.g., the allocation interests of Group 1 and Group 2), and self-dealing risks arising from the ACD's dual identity.
Third dimension: management tools. The text explicitly sets out two paths—"effective organisational and administrative arrangements" (organizational separation, such as information barriers and trade allocation policies) and "disclosed" (disclosure as a fallback). This is highly consistent with the FCA's SYSC 10 principles: when conflicts are manageable, prioritize managing them through process separation; when they are not manageable, disclose them fully to clients.
Conclusion
On the surface, this passage is procedural disclosure, but it in fact outlines a precise operational blueprint of a modern UK ICVC: a price protection layer built on dilution adjustment, a customized commercial logic realized through six share classes, a tax fairness architecture composed of SDRT and Equalisation, a compliance infrastructure anchored on CRS/FATCA, and a data-supply-chain risk firewall constructed through multiple layers of disclaimers. Every provision responds to a specific operational risk—together pointing to the ACD's systematic commitment to "fair treatment" within a complex web of interests.
Based on the provided follow-up content, the following is an independent analysis of the newly added content in the "Introduction" section. This analysis focuses on the legal risks, operational governance, and product management details unique to this follow-up, supplementing the preceding discussion.
I. The Deeper Game in Data Provider Disclaimer Clauses and the Cognitive Cost to Investors
1. The "Asymmetric Information" Structure of the MSCI Disclaimer Clause
The MSCI disclaimer clause in the follow-up reveals the typical risk allocation pattern in index data licensing agreements:
| Dimension | MSCI Rights/Protection | Fund/Investor Obligations/Risks |
|---|---|---|
| Data Use | For internal use only; reproduction or dissemination prohibited | Investors must independently verify the boundaries of compliant data use |
| Nature of Content | Explicitly does not constitute investment advice | Investors may mistakenly treat index data as a recommendation signal |
| Quality Assurance | Full disclaimer of all express/implied warranties | Investors bear all decision-making risks arising from data errors |
| Liability Cap | Any MSCI party is exempt from liability for any direct/indirect losses | Even if data errors cause actual losses, there is no channel for recourse |
Additional Evidence: The phrase "not be relied on as such" in this clause in effect constructs a "cognitive firewall" in legal practice—that is, the Fund formally uses MSCI data, but investors are required not to form reasonable reliance on the basis of such data. For ordinary investors, this creates a significant cognitive burden, because the fund product's performance benchmark (e.g., the MSCI ACWI Index) is precisely the core reference point by which investors evaluate fund performance.
2. The "Semi-Closed" Structure of TOPIX Data Ownership
Unlike MSCI's comprehensive disclaimer, the TOPIX clause is distinctive in that:
- Single ownership entity: It explicitly identifies JPX Market Innovation & Research, Inc. as the sole rights holder, but the scope of liability only covers "calculation errors, incorrect publication, delays, or interruptions," without a comprehensive exclusion of data accuracy and completeness as MSCI does.
- Risk gap: JPX is responsible only for the "publication process" and makes no explicit commitment regarding the accuracy of the "data content itself" (e.g., constituent adjustments, weighting calculation logic), which may create a legal application blind spot in cross-border investment scenarios between China and Japan.
II. The "Time Lag" in TCFD Reporting and Governance Transparency
1. Signs of a Tightened Disclosure Deadline
The follow-up shows that the ACD (Baillie Gifford & Co Limited) must publish its TCFD entity report by June 30 each year, while the product report as of December 31, 2024 is already available for review. This pace implies:
- Compressed reporting cycle: From the fiscal year end (12/31) to public disclosure (June 30 of the following year), there is only a six-month window, reflecting the strong regulatory orientation toward timeliness of climate information disclosure in the FCA ESG Sourcebook.
- Two-tier reporting structure: The entity report (company level) and product report (sub-fund level) run in parallel, and the product report must be embedded in the annual/interim financial statements—this is not only a compliance requirement but also a transitional signal pushing climate risk from "voluntary disclosure" toward "mandatory assurance."
2. The Absence of Core Climate Metrics
Although the clause requires "including a core set of climate-related metrics," the follow-up does not list any specific metrics (e.g., carbon intensity, carbon footprint, fossil fuel exposure, etc.). This implies:
- The metrics framework is still evolving (possibly referencing the TCFD recommendations and the transitional arrangements of the UK SDR);
- For investors, the disclosure obligation statement alone is insufficient to judge the actual level of climate risk exposure of each sub-fund; they must consult the original product reports themselves.
III. The "Hidden Ladder" in Fee Structures and Scale Incentives
1. The Complex Fee Mechanism of Class W Shares — Additional Evidence
The fee structure for Class W shares disclosed in the follow-up is distinctly behaviorally oriented:
```
Scale < £100M → flat 0.60%
Scale ≥ £100M → 0.60% × £30M
→ 0.50% × £20M
→ 0.40% × £140M
→ 0.35% × amount above
```
Key Insight: This structure embodies a dual design of "cliff effect" and "scale smoothing"—
- Cliff effect: When scale approaches the £100M threshold, the fund company has an incentive to make a marketing push to reach the lower-fee tier (which can be cross-validated with subsequent changes in actively managed scale);
- Scale smoothing: Once above the threshold, fees do not drop in one step but gradually decline, avoiding excessive trading by the fund manager near the threshold (window dressing).
2. The "Tail-End Concession" of Class Y Shares
Class Y shares (applicable only to the Sustainable Growth Fund) have the following fee structure:
| Scale Range | Fee Rate |
|---|---|
| First £60M | 0.50% |
| Amount above | 0.35% |
This structure is simpler than Class W, but offers significant concessions only on tail-end capital, indicating that this share class is positioned for large institutional investors (the minimum subscription amount of £1,000 is only a symbolic threshold).
IV. Horizontal Comparison of Active Share and Portfolio Turnover — New Data Tension
1. Structural Differences in Active Share
| Sub-fund | Active Share | Comparison Index | Implied Meaning |
|---|---|---|---|
| Japanese Income Growth | 84% | TOPIX | Relatively high active share, but lower than global funds |
| Sustainable Growth | 90% | MSCI ACWI | Extremely high active share, close to a pure stock-picking strategy |
| UK Equity Core | 76% | FTSE All-Share | Relatively restrained, possibly reliant on core holdings |
Additional Evidence: An Active Share of 90% means the fund overlaps only about 10% with the MSCI ACWI, which is especially aggressive for a sustainability-themed fund—indicating that the fund seeks excess returns not through tail-risk hedging (e.g., decarbonization industries) but through a substantial deviation from the benchmark. This contrasts with "Paris-Aligned" funds (which typically maintain high tracking error), suggesting that the fund may hold small- and mid-cap growth stocks as its primary underlying assets.
2. Governance Signals from the Portfolio Turnover Ratio
| Sub-fund | Turnover Ratio | Inference |
|---|---|---|
| Japanese Income Growth | 6% | Extremely low turnover, akin to a buy-and-hold strategy |
| UK Equity Core | 8% | Low turnover, stable core positions |
| Sustainable Growth | 22% | Moderately high, possibly related to rebalancing driven by ESG data updates |
Key Gap: Both the Monthly Income Fund (renamed from the Sustainable Income Fund) and the Sterling Aggregate Bond Fund do not disclose turnover, on the grounds that the ACD considers the metric inapplicable to fixed income funds. But this avoids a measurement issue: fixed income funds should focus more on bond yield-to-maturity distribution (yield curve positioning) or duration turnover than on a simple buy/sell amount ratio.
V. "Dynamic Warnings" in Fund Lifecycle Management
1. Operational Risks of Name Changes
The follow-up reveals two key changes:
| Original Name | New Name | Effective Date | Potential Risk |
|---|---|---|---|
| Baillie Gifford Sustainable Income Fund | Baillie Gifford Monthly Income Fund | January 31, 2025 | Investors may misjudge ESG attributes because the word "Sustainable" has disappeared |
| Baillie Gifford UK Equity Core Fund | Baillie Gifford UK Equity Core Growth Fund | February 2, 2026 | Adding "Growth" to the name may alter investors' style expectations |
Additional Evidence: The renaming of the UK Equity Core Fund occurs after the financial report cutoff date (December 2025), indicating that the report actually implies a known but not yet occurred material change—at the time of the annual report's publication, this information already constituted a "forward-looking statement," yet the report does not provide the reason for the change (such as strategy adjustment or marketing needs), which to some extent weakens the completeness of information disclosure.
2. Residual Impact of Funds Closed to Subscriptions
- Health Innovation Fund: It has been closed to subscriptions but remains on "The Group's Funds" list, indicating that it is in a liquidation transition period rather than fully terminated—investors should watch for the timing of subsequent liquidation distributions.
- Emerging Markets Bond Fund: It has also been closed to subscriptions, but it is not listed as an exception to Portfolio Turnover disclosure, implying that it may still have legacy assets requiring management.
VI. Conclusion: A Comprehensive Assessment
New Risk Point Matrix
| Risk Category | Specific Manifestation | Affected Group |
|---|---|---|
| Legal cognitive risk | The MSCI "as is" clause prevents investors from claiming based on index data | All investors |
| Climate disclosure lag | TCFD report covers only up to end-2024, leaving a nearly one-year gap from the current date (2025.12) | Institutional investors focused on ESG |
| Fee complexity | The Class W tiered fee structure involves scale-threshold gaming | Large investors |
| Renaming confusion | Fund name changes may lead to strategy identification bias | Retail clients |
| Index data ownership blind spot | TOPIX's liability boundary for data accuracy is unclear | Investors with Japanese equity positions |
Forward-Looking Observations
The follow-up content further strengthens the earlier assessment that "Baillie Gifford's product system is undergoing a boutique transformation": by closing subscriptions to some funds, consolidating names, and optimizing fee structures, the company is reducing product line redundancy and focusing on areas with high Alpha capabilities (such as Japanese small- and mid-cap and sustainable growth). Meanwhile, the existence of the MSCI/TOPIX disclaimer clauses reminds investors that, when relying on any third-party data to evaluate fund performance, they need to establish their own independent verification mechanisms.
The above constitutes the additional analysis of this follow-up content.