Baillie Gifford Investment Funds II ICVC Annual Report - June 2025
In plain words
This analysis of Baillie Gifford's fund annual report audit explains how auditors treated six sub-funds differently, with one being wound down. The tone is cautious, warning investors to watch for red flags. Key items: Baillie Gifford Health Innovation Fund has stopped taking new money and is being audited on a liquidation basis—the biggest risk. Baillie Gifford Monthly Income Fund was just renamed with a clearer investment policy. Baillie Gifford UK Equity Core Fund pledged net-zero emissions by 2050. (Audit means independent check of accounts; liquidation means closing the fund and selling assets.)
At a Glance
This article is a multi-dimensional breakdown of the audit report for BG Japanese Core Growth Fund. The core observation is that the auditor adopted a tiered-responsibility strategy across the six sub-funds and issued a separate non-going-concern opinion for the terminated sub-fund; overall, the author maintains a cautious stance, reminding investors to watch for abnormal fund signals.
- Baillie Gifford Health Innovation Fund has entered termination proceedings; the ACD ceased accepting subscriptions as of 13 November 2024, and the audit is presented separately on a non-going-concern basis — the most important risk signal in the article.
- The remaining five sub-funds were all audited on a going-concern basis; among them, Sustainable Growth Fund revised its investment objective on 2 April 2025 to meet the FCA's "Sustainability Focus" label regulatory requirements.
- Baillie Gifford Monthly Income Fund (formerly Sustainable Income Fund) was renamed on 31 January 2025 and clarified its investment policy, specifying sustainability characteristics, screening methods, and monitoring and engagement approaches.
- Baillie Gifford UK Equity Core Fund formally committed on 2 December 2024 to achieving net-zero portfolio emissions by 2050, aligned with the global 1.5°C temperature goal.
- The audit report for the first time clarified audit procedures "designed to include unpredictability"; certain income-oriented sub-funds (Monthly Income, Sterling Aggregate Bond, Japanese Income Growth) capitalize part or all of their fees to enhance distribution rates.
Introduction(About the Company)——Fund company-level overview, excluding strategy and performance review. The core content discloses product and governance changes across five sub-funds during the reporting period.
| Sub-fund | Change type | Effective date | Details |
|---|---|---|---|
| Baillie Gifford Sustainable Growth Fund | Investment objective amendment | 2 April 2025 | Adjusted to comply with the regulatory requirements for the "Sustainability Focus" label under FCA sustainable disclosure rules |
| Baillie Gifford Monthly Income Fund (formerly Sustainable Income Fund) | Renaming + investment policy clarification | 31 January 2025 | Clarified the fund's sustainability characteristics, screening approach, and monitoring and engagement methods |
| Baillie Gifford UK Equity Core Fund | Investment policy amendment | 2 December 2024 | Formally committed to achieving portfolio net-zero emissions by 2050, aligned with the global 1.5°C temperature target |
| Baillie Gifford Health Innovation Fund | Closure | 13 November 2024 | The ACD will no longer actively accept subscriptions into the fund |
Other key points: On 15 May 2025, Baillie Gifford Sustainable Growth Fund launched a new Class P Accumulation Shares share class; as at 30 June 2025, the company operated five sub-funds in total, with no cross-holdings among sub-funds; each sub-fund is valued daily on a single-price basis. The ACD conducts an annual value assessment of each sub-fund based on seven criteria (service quality, performance, ACD costs, economies of scale, comparable market rates, comparable services and share classes), with a reference date of 31 March. The latest assessment report as at 31 March 2025 has been published on the website. The remaining content (ACD/depositary responsibility statements, auditor's report guidance, registration information, etc.) is standard regulatory boilerplate and contains no further investment information for analysis.
Differentiated Going-Concern Treatment Across Sub-Funds: Fine-Grained Management of Audit Risk
The follow-up section reveals that the auditor applied differentiated going-concern conclusions to different sub-funds under the same ICVC — this is not an inconsistency in audit judgement but a precise response to the individual financial substance of each fund. Notably, the audit report lists the "terminating sub-fund" separately and emphasises that its financial statements are prepared on a non-going-concern basis, while the remaining five sub-funds are still audited on a going-concern basis. This "one entity, two bases" treatment is typical in UK Authorised Funds audit practice and reflects the following deeper logic:
- Mandatory requirements of the regulatory framework: Under the Collective Investment Schemes sourcebook (COLL), when a sub-fund enters liquidation or termination proceedings, the principles for asset valuation, liability recognition and income recognition must shift to net realisable value or liquidation value. If the auditor were to issue an opinion on a going-concern basis, this would directly breach the provisions of COLL 4.4.2R.
- Impact on users' decision-making: When reading the consolidated financial statements, investors tend to focus on the overall NAV. However, if a terminating sub-fund were still presented on a going-concern basis, its assets could be overstated, thereby misleading investors in their assessment of the true risk of the remaining sub-funds. By including an "emphasis of matter" paragraph, the auditor is in substance conveying to the market a key signal that the net asset value of that sub-fund is no longer sustainable.
- Differences in the nature of audit evidence: For going-concern sub-funds, the auditor relies on future cash flow forecasts and liquidity testing; for the terminating sub-fund, the audit evidence shifts to estimates of liquidation expenses, asset realisation timetables and the progress of legal proceedings. The table below compares the differences in audit focus between the two categories of sub-funds:
| Dimension | Going-concern sub-funds (5) | Terminating sub-fund (Baillie Gifford Health Innovation Fund) |
|---|---|---|
| Asset valuation basis | Fair value (mark-to-market) | Net realisable value or expected liquidation value |
| Liability recognition | All expected liabilities recognised on an accrual basis | Additional recognition of liquidation costs and contingent liabilities |
| Income recognition | Recognised on an accrual basis | Only the realisable portion recognised; unrealised gains deferred or written off |
| Key audit procedures | Liquidity stress testing, 12-month future cash flow forecasting | Review of liquidation plan, verification of disposal progress, validation of reasonableness of expenses |
| Report presentation | No emphasis of matter | Separate "emphasis of matter" paragraph, explicitly stating the non-going-concern basis |
Auditor Independence and Ethical Compliance: Practical Implementation of the FRC Ethical Standard
The report explicitly states that "we have maintained our independence, in compliance with the ethical requirements applicable to UK audits, including the FRC Ethical Standard". This statement is not boilerplate text but corresponds to specific implementation indicators under the Auditors (Ethical) Regulations. Notably, the auditor here juxtaposes "independence" with "compliance with ethical requirements", which in substance covers the multi-dimensional restrictions in the FRC Ethical Standard concerning non-audit services, fee ratios, and long-term relationships with audit clients (auditor tenure). For example:
- Non-audit service restrictions: This audit report does not mention any separate independence statement regarding tax or advisory services. However, based on industry practice, if the auditor had provided forensic accounting services to the fund company unrelated to the audit process, this could impair independence.
- Audit partner rotation: For long-standing audit clients, the FRC requires the engagement partner to rotate every five years. Although the report text does not directly disclose rotation information, the audit report signature date (July 2025) and the year under audit (year ended 30 June 2025) indicate that the audit team has served for at least one consecutive year, but it cannot be established whether the rotation requirement has been satisfied — this is typically disclosed separately in the public reports of the audit committee.
The Boundary of Responsibility for "Other Information": From Audit Opinion to Limited Assurance
The paragraph on "other information" in the report clearly delineates the respective responsibilities of the auditor and the ACD. The auditor states that "our opinion does not cover the other information and we do not express any form of assurance conclusion thereon, except as expressly stated in this report". However, it immediately goes on to state that "if, based on the work we have performed, we conclude that there is a material misstatement of the other information, we are required to report that fact", and ultimately concludes that "in connection with these responsibilities, we have nothing to report".
This wording reflects the two-stage responsibility model under ISA (UK) 720 (Revised):
1. Reading and assessment stage: The auditor must read the other information to assess whether it is materially inconsistent with the financial statements or contradicts knowledge obtained during the audit.
2. Response and reporting stage: Further procedures and reporting are only required when an apparent inconsistency or misstatement is identified. In this audit, the auditor identified no such matters and therefore made a "nothing to report" statement.
Notably, the scope of this "other information" review typically includes:
- The directors' report (ACD's Report)
- The portfolio statement
- Corporate governance disclosures
- Environmental, social and governance (ESG)-related statements (where applicable)
As this ICVC is a traditional equity fund (not an ESG-themed fund), the other information does not contain sustainability reporting data, resulting in relatively lower review pressure on the auditor for that section. However, if the fund carried ESG attributes (e.g., SFDR Article 8 or Article 9), the auditor would also be required to perform additional consistency checks on SFDR disclosures under EU regulations.
Fraud Risk Identification and Audit Procedure Design: Targeted Responses to Income Manipulation and NAV Inflation
In the "fraud risk" section, the audit report explicitly identifies the principal risk: "management could manipulate income or increase the net asset value of the company and sub-funds through inappropriate journal entries". This risk identification is not a vague statement but is based on a deep understanding of the OEIC operating model:
- Income manipulation techniques: In fund accounting, common income manipulation techniques include prematurely recognising unrealised dividends, misclassifying capital gains as income, or delaying the recognition of expenses to inflate net profit. The auditor therefore designed procedures targeting income cut-off testing, with particular attention to abnormal large dividend records before 31 December or 30 June.
- NAV inflation risk: As subscription and redemption prices are calculated directly from NAV, any overstatement of NAV would dilute the interests of existing unitholders. The auditor conducted specific tests on the validity of valuation models, the applicability of comparable market data, and the reasonableness of valuations of illiquid assets.
The audit procedures listed in the report include "discussion with the Authorised Corporate Director of known or suspected irregularities and fraud" — this is only the starting point. A complete fraud response programme typically also includes:
- Unpredictable audit procedures: Including surprise stock counts (where physical assets exist), random selection of counterparties for confirmations, and obtaining additional audit evidence at the end of the second quarter rather than only year-end balances.
- Journal entry testing: Using data-matching filters to identify complex journal entries that do not conform to normal business patterns (e.g., non-standard adjustments near period-end).
- Management override assessment: Performing "hindsight" back-testing on accounting estimate deviations to check whether prior-period estimates were deliberately understated or overstated to facilitate continuous earnings smoothing.
Interaction with the Regulatory Framework: The COLL Sourcebook as the Anchor for Compliance Auditing
The report repeatedly references the COLL sourcebook and identifies it as "the principal source of non-compliance risk for the company and its industry". This approach to risk positioning in substance extends the auditor's role from a pure verifier of financial information to an indirect supervisor of fund operational compliance. However, the auditor focuses only on "compliance requirements that could directly result in material misstatements of the financial statements", not on all COLL provisions. For example:
- Investment restrictions: If COLL 5.2 (eligible markets) and COLL 5.5 (spread rules) are breached, this may affect asset valuation but does not necessarily lead to misstatements in financial information disclosures. The auditor only performs limited assessment here.
- Borrowing and leverage restrictions: Breaches of COLL 5.6 (borrowing powers) would directly result in liability misstatements; therefore, the auditor places greater focus on compliance testing of borrowing balances.
- Valuation and pricing rules: COLL 6.3 (valuation) serves as the core basis for financial reporting, and the auditor gives the highest attention to the consistency of valuation policies.
Judging from the procedures disclosed in the report, the auditor confines the areas where "non-compliance could have a material effect on the financial statements" to "those parts of the sourcebook that directly affect the determination and disclosure of amounts" — this wording precisely delineates the boundary of audit responsibility, avoiding overlap with the FCA's regulatory inspection duties.
Conclusion: Layered Audit Responsibility in a Multi-Sub-Fund Structure
This follow-up section in substance demonstrates how the auditor executes a "layered audit strategy" within a complex six-sub-fund structure. Each layer corresponds to different financial risks and audit objectives:
| Audit layer | Applicable subject | Principal risks | Audit strategy |
|---|---|---|---|
| First layer | Going-concern sub-funds (5) | Liquidity risk, NAV accuracy | Standard financial statement audit + going-concern assumption verification |
| Second layer | Terminating sub-fund (1) | Understatement of liquidation value, expense misstatement | Non-going-concern basis audit + emphasis of matter disclosure |
| Third layer | Company as a whole and ACD governance | Internal control failure, fraud risk | COI risk identification + consistency checks on other information |
This layered approach both satisfies the ISA (UK) requirements for responding to audit risks and accommodates the COLL regulatory expectations regarding fund-type differentiation. For investors, understanding the "emphasis of matter" in the audit report is an important signal for identifying fund anomalies — particularly in a multi-sub-fund structure, where the termination of one sub-fund may signal an adjustment in that fund's strategic direction or the failure of its investment strategy, and the audit report is one of the compliant channels through which such information is disclosed.
In the remaining sections of the audit report and the accounting policies in this follow-up, further practical details and regulatory compliance points warrant attention. The following continues the analytical framework established above, supplementing new evidence and viewpoints.
1. Designing "Unpredictability" into Audit Procedures: From Formal Compliance to Substantive Risk Response
The report explicitly lists three specific audit procedures:
- Reviewing relevant meeting minutes, including ACD board meeting records;
- Identifying and testing journal entries, particularly those recorded during the fiscal year-end closing process;
- Designing audit procedures that incorporate unpredictability, covering the nature, timing, and extent of testing.
Among these, "incorporate unpredictability" is a key requirement of ISA 240 (fraud audit) and ISA 315 (risk identification). It is not merely a checklist of procedures, but rather requires auditors to proactively vary their audit approach to address the risk of management override of controls. For fund companies, adjusting entries during the year-end closing period (such as valuation adjustments, accrued income, and expense carry-forwards) are common techniques for management to manipulate profits or net asset value. Therefore, focusing testing on journals in the "year end close process" has practical relevance.
In comparison, the 2025 audit report explicitly mentions "designed to incorporate unpredictability," whereas in the past, most fund audit reports only made general statements such as "designed to address assessed risks," rarely disclosing this practice in detail. This reflects the continued strengthening of regulatory (and FRC) requirements for audit quality transparency.
II. The "Boundary Statement" of Audit Responsibility: Dual Constraints of Law and Market
2.1 Restrictions on the Purpose of the Report
The report explicitly states:
> prepared for and only for the Company’s shareholders as a body ... and for no other purpose.
This is in fact the standard disclaimer under Section 67(2) of the Open-Ended Investment Companies Regulations 2001 and COLL 4.5.12. Its legal implication is that the auditor is responsible only to the shareholders as a whole, not to individual shareholders or third parties (such as potential investors or custodians). In past judicial precedents, this "exclusion of liability to third parties" clause has effectively prevented derivative actions.
However, investors should note that such a statement does not mean the audit report is devoid of reference value; rather, if a third party relies on the report in making investment decisions, the channels for legal recourse are limited. For fund managers, this instead requires them to exercise their own due diligence and not regard the audit report as an endorsement of the fund's future performance.
2.2 The "Negative Assurance" of Regulatory Exception Reporting Obligations
The audit report specifically lists the exception reporting matters required by COLL, including:
- Whether proper accounting records have been maintained;
- Whether the financial statements are consistent with the accounting records.
The report concludes with "We have no exceptions to report." This constitutes "negative assurance," which differs from the positive assurance of the financial statement audit opinion—the former only assures that "nothing was found," whereas the latter provides reasonable assurance. In practice, some investors confuse the two and mistakenly believe that the auditor has given an overall endorsement of the accuracy of the accounts; this calls for clarification.
III. Inherent Limitations and Fraud Risk: An Honest Statement of Audit Epistemology
The original report emphasizes:
> The risk of not detecting a material misstatement due to fraud is higher than the risk of not detecting one resulting from error.
This formulation was uncommon in older audit standards, whereas the new ISA 240 requires an explicit distinction between the two types of misstatement risk. The logic behind it: fraud involves deliberate concealment (such as forgery, intentional misstatement, or collusion) and may circumvent well-designed controls. For ICVC-type collective investment schemes, although the asset custody system reduces the risk of asset misappropriation, management's valuation manipulation, concealment of related-party transactions, and fictitious expense recognition remain audit difficulties.
In addition, "We are less likely to become aware of instances of non-compliance with laws and regulations that are not closely related to events and transactions reflected in the financial statements." This sentence reveals the auditor's inherent blind spot in compliance testing — audit procedures are primarily centered on financial transactions, while general legal compliance (such as anti-money laundering and sanctions lists) is not the core of an audit. Therefore, one cannot expect an audit report to fully reveal compliance risks.
4. In-Depth Observations on Accounting Policies: From Fair Value Hierarchy to Capital Allocation in Specific Sub-Funds
4.1 The Three-Level Breakdown of the Fair Value Hierarchy
The report sets out the three-tier classification as required by FRS 102:
- Level 1: Quoted prices in active markets;
- Level 2: Valuation techniques based on observable inputs;
- Level 3: Valuation techniques using unobservable inputs.
However, for an ICVC primarily investing in listed equities, bonds, and collective investment schemes, the vast majority of assets should fall under Level 1 or Level 2. What is worth noting is the "unadjusted quoted price" — if the fund holds highly illiquid equities or securities that have been suspended from trading, the quoted price may need adjustment, resulting in a downward shift in level. The report states that valuations use "closing bid prices," an industry convention for fund valuation (bid-price basis), which differs slightly from the accounting concept of "fair value" (typically an exit price). In practice, however, the difference is minimal and the two can be regarded as consistent.
4.2 Revenue Recognition: The Capital/Revenue Dichotomy for Special Dividends
The policy emphasizes:
> Special dividends are treated as repayments of capital or revenue depending on the facts of each particular case.
This is a common grey area in UK fund accounting. If a special dividend arises from gains on the disposal of assets and carries the nature of a capital repayment, it should be treated as capital; if it represents an additional distribution out of periodic earnings, it is treated as revenue. In practice, fund managers need to make a professional assessment based on the judgment criteria set out in company announcements. Auditors typically rely on management judgment but will review whether the basis for that judgment is consistent.
4.3 Expense Capitalisation: Special Arrangements for Three Funds
The report explicitly states:
> For Baillie Gifford Japanese Income Growth Fund, Baillie Gifford Monthly Income Fund and Baillie Gifford Sterling Aggregate Bond Fund, for the purposes of the distributions, some or all the expenses, with the written agreement of the Depositary, are allocated to capital.
This is a distribution strategy choice under UK UFDS (Underlying Fund Distributions). Allocating expenses to capital can enhance the fund's income yield, supporting its income objective (e.g., the "Income" series). For example, if Baillie Gifford Monthly Income Fund charges all management fees to capital, its income distributions will be larger, at the cost of reduced capital. This represents a trade-off between the income structure for investors and the exit value.
The table below compares the distribution frequency and income type of each sub-fund:
| Sub-fund Name | Distribution Frequency | Distribution Type | Expense Capitalisation? |
|---|---|---|---|
| Baillie Gifford Monthly Income Fund | Monthly | Dividend distribution | Yes (some or all) |
| Baillie Gifford Sterling Aggregate Bond Fund | Quarterly | Interest distribution | Yes (some or all) |
| Baillie Gifford Japanese Income Growth Fund | Semi-annual | Dividend distribution | Yes (some or all) |
| Baillie Gifford UK Equity Core Fund | Semi-annual | Dividend distribution | No |
| Baillie Gifford Sustainable Growth Fund | Annual | Dividend distribution | No |
Thus, sub-funds with "Income" or "Bond" in their names are more inclined to capitalise expenses to boost current cash flow.
4.4 Tax Policy: The Standard Mechanism for Interest Distributions and Loss Transfers
The report mentions that Baillie Gifford Sterling Aggregate Bond Fund satisfies the qualifying investment test under Regulation 19 of SI 2006/964, and therefore all distributions are treated as interest distributions. This means investors receive tax treatment similar to bond interest income rather than dividends, which has significant implications for tax planning.
In addition, the tax policy also provides:
> Where the allowable expenses for a share class are greater than the revenue liable to corporation tax for that share class, the excess allowable expenses are made available to the other share classes.
This is the "share class pooling" mechanism in UK fund taxation, which prevents distortion in tax calculations caused by disproportionately high expenses in one share class. It avoids asymmetric tax burdens across multiple share classes.
4.5 Valuation Policy and Foreign Currency Translation: Aligned Timing but Subtle Differences
The financial statements state that valuations were "valuated at closing bid prices on 30 June 2025," with foreign currency assets translated at the exchange rate on that date and transactions translated at the rate on the transaction date. This treatment is standard, but certain points warrant attention:
- The difference between "closing bid prices" and "mid-price" can affect net asset value by approximately 0.1%—0.2%, which is not negligible for large investors;
- If an asset lacks an active market (e.g., unlisted equity), the Investment Adviser's valuation will be used. Such valuations may be subjective and should be classified as Level 2/3.
4.6 Financial Derivative Instruments
Although the preamble does not elaborate, the accounting policies mention: "Swap Agreements: Income payable or receivable on swap agreements is accrued on a daily basis." This indicates that the sub-funds under this ICVC may use swap instruments (e.g., interest rate swaps, total return swaps), although specific positions are not disclosed here. The use of derivatives introduces counterparty risk and leverage, and investors should assess this in conjunction with the risk management report.
V. Conclusions and Recommendations
1. Enhanced Transparency of Audit Procedures: The explicit introduction of unpredictability testing responds to regulatory requirements for audit quality, but it should also be regarded as a minimum standard—investors still need to focus on whether auditors truly carried out internal independence assessments.
2. Detailed Disclosure of Accounting Policies: Policies such as expensing capitalization, treatment of special dividends, and allocation of tax benefits have a direct impact on fund returns and investors' actual payoffs, and their financial substance must be understood in conjunction with each sub-fund's specific financial statements.
3. Misinterpretation Risk of Disclaimer Clauses: The audit report is only responsible to shareholders as a whole and bears no liability to third parties. Investment research institutions should clarify the legal boundaries when citing audit information and avoid using it as the sole basis for due diligence.
If specific sub-fund performance data or portfolio details become available later, further comparative analysis could be conducted on policy implementation effects and the substantive audit results.
Detailed Differences in Derivative Accounting Treatment and P&L Impact
The follow-up article distinguishes the accounting treatment for three types of derivative instruments. The core difference lies not only in the frequency of mark-to-market, but more importantly in the timing of recognition of realized and unrealized gains and losses:
| Contract Type | Mark-to-Market Frequency | Gain/Loss Recognition Method | Key Features |
|---|---|---|---|
| Spot / Forward | Daily | Unrealized gains/losses are booked daily; realized gains/losses are recognized upon settlement or hedging | Realized gains/losses are calculated based on the difference between opening and closing prices; netting mechanisms with the same broker can smooth cash flows |
| Futures | Daily | All changes are directly recorded as realized gains/losses (variation margin) | Futures margin is settled daily, featuring mandatory cash flows and more transparent risk exposure |
| Swap | Daily | Unrealized gains/losses are based on market-maker quotes; termination settlement is recorded as realized; net periodic income is also included in realized | Price sources depend on dealer quotes, introducing valuation subjectivity; periodic cash flows and termination gains/losses are presented separately |
It is worth noting that futures contracts directly classify daily mark-to-market changes as realized gains/losses, which differs from spot/forward and swaps—the latter are first recorded as unrealized and then converted to realized at closing or settlement. This accounting difference affects the fund's realized/unrealized gain-loss structure at any given point in time, thereby affecting investors' intuitive read on the fund's "realized returns." Particularly during periods of sharp market volatility, the daily gains or losses on futures positions are directly presented as realized gains/losses, which may exaggerate the apparent volatility of the fund's periodic returns, even though the economic substance is no different from unrealized gains/losses.
风险管理流程的三层制衡与专业复用
续篇明确了公司层面风险管理的治理架构:
- ACD 承担最终责任,制定Risk Management Policy并建立常设风险管理职能(permanent risk management function);
- Depositary 承担监督职责,形成“管办分离”;
- Investment Adviser 提供既有风险管理框架,由ACD的风险职能复用其专业能力以避免重复建设。
这种设计在UCITS领域中具有典型性,它既满足法规对管理公司“独立风控职能”的要求,又通过借用投资顾问的现成基础设施降低运营成本。关键在于,ACD季度性接收风险报告并复核实质性风险,确保风险监控不只是形式上的合规,而是对投资决策的动态反馈。这种安排隐含了“嵌入+独立”的双重模式——风险管理嵌入投资流程,但独立于投资决策向ACD汇报。
Logic of the Risk Classification Framework and Sub-Fund Differences
The risk profile of each sub-fund comprises four categories of risk: market risk (including currency, interest rate, and price risk), credit risk, liquidity risk, and operational risk. The follow-up report specifically notes that the risk profile is determined by the ACD's comprehensive judgment rather than a unified template, providing a basis for differentiated disclosure across products.
A point worth adding is the "indirect transmission" of interest rate risk to equity sub-funds. The report explicitly states that the three equity/mixed sub-funds (Sustainable Growth, Japanese Income Growth, UK Equity Core) have no material direct interest rate risk exposure because their held assets do not pay interest and have no maturity date. However, interest rate movements can significantly affect the discount rate in equity valuation models and influence the financing costs and earnings expectations of bond-issuing companies, thereby indirectly impacting share prices. Although fund accounting does not classify this as interest rate risk, risk managers should still incorporate the sensitivity of equity valuations to interest rate changes into scenario stress tests to comprehensively assess the intersection of "other price risk" and interest rate risk.
Breadth and Constraints of Derivative Usage Strategies
The text enumerates the derivative uses of the bond sub-funds (Monthly Income Fund and Sterling Aggregate Bond Fund): active currency management, bond curve strategies, interest rate strategies, asset allocation, market spread strategies, and efficient portfolio management (EPM). This demonstrates that derivatives play a dual role of protection and enhancement, rather than serving purely as hedging tools.
The quantitative approach to risk constraints is worth highlighting:
- All derivatives must be held on a "covered basis", i.e., the underlying assets corresponding to the derivatives are consistent with the sub-fund's investment objectives and do not conflict with its investment policies;
- Risk exposure is confined within preset limits through the dual metrics of tracking error and Value at Risk (VaR).
The introduction of VaR implies that derivative strategies must not only control directional risk but also impose statistical caps on nonlinear and correlation risks. This is more effective than simple notional position limits, but it also requires the fund to have a mature VaR calculation model and a robust historical data foundation. Particularly for over-the-counter (OTC) swaps, VaR may underestimate tail risk when liquidity is low, which is why the text retains flexibility through the phrase "where appropriate."
Liquidity Risk and Market Depth Assessment
The liquidity risk management framework emphasizes integrated management based on investment strategy, liquidity profile, and redemption policy, while assessing the time and price at which assets can be unwound in the market. The interaction of these three elements is critical:
- Although bond funds' underlying assets are inherently highly liquid, holding low-rated credit bonds means spreads widen rapidly under market stress, and the actual realizable value may fall significantly below book value;
- If an equity fund is concentrated in small-cap growth stocks (e.g., certain holdings in Japanese Income Growth), the time cost of unwinding positions cannot be overlooked.
The simultaneous consideration of "time and price/value" in the text is essentially a dynamic trade-off between "market depth" and "price elasticity". Furthermore, at the operational level, the additional approval procedures for non-DVP settlement mitigate the risk of cascading defaults resulting from settlement failures.
Third-Party Dependencies and Business Continuity in Operational Risk
Operational risk disclosures focus on accounting system failures and third-party service provider risk. The key points are:
- Baillie Gifford maintains a comprehensive business continuity plan to address service interruptions or major disasters;
- The ACD reviews not only Baillie Gifford's own internal control reports, but also similar reports from other critical third parties.
This implies a core challenge of modern fund management: service provider concentration risk. When a fund relies on the same custodian bank, auditor, or valuation provider, an operational incident at any one of them could trigger sector-wide shocks. True risk mitigation should include periodic switch tests and pre-selection mechanisms for alternative providers, not just report reviews.
Fair Value Measurement Hierarchy and Market Valuation
The continuation briefly notes that financial assets/liabilities are recorded at market value or investment adviser valuations, with reference to market quotes. However, it does not disclose in detail the hierarchy of valuation sources. Under the IFRS 13 framework, this should include:
- Level 1: Quoted prices in active markets (e.g., exchange-traded futures, listed equities);
- Level 2: Active quotes for similar instruments or observable market inputs (e.g., certain forwards, swaps);
- Level 3: Based on unobservable inputs (e.g., bespoke structured products).
The report recommends that the notes to the financial statements disclose the proportion of assets in each level, so that investors can understand valuation uncertainty. In particular, swap contracts rely on market maker quotes; if the number of market makers is limited, their fair values may fall into Level 2 or Level 3, and thus face significant model/quote variance risk.
Consistency of Remuneration Report and UCITS V Compliance
Baillie Gifford's remuneration policy applies to the Group's sole UK UCITS management company (Baillie Gifford & Co Limited), and is reviewed by the management committee and the company's board of directors at least annually. This is consistent with the core principles of the UCITS V remuneration guidelines, including:
- Remuneration is linked to risk, avoiding incentives for excessive risk-taking;
- A balance between fixed and variable remuneration, providing effective restraint on risk-takers (including senior executives, fund managers, and risk control personnel);
- Risk-adjusted performance assessment, aligned with funds' long-term performance and investor interests.
It can be further inferred that Baillie Gifford's career structure (internal partnership model) itself leans toward long-termism, and its remuneration deferral mechanisms may be stricter than regulatory requirements. This also explains why its funds' investment style emphasizes long-term growth, which is compatible with remuneration incentives.
Summary: Consolidating the New Observations
The sequel provides rich detail at the accounting, risk, and governance levels, of which the most substantive value lies in:
1. The "realization" treatment of futures gains and losses, which may distort investors' understanding of realized income;
2. Derivative constraints defined by VaR and tracking error, which balance the dual objectives of hedging and enhancement, though one must remain alert to VaR understating tail risk in OTC derivatives;
3. The time-price dual dimension in liquidity management, offering a more pragmatic assessment of tradability under stress scenarios;
4. The review of third-party concentration risk, where reliance on report review alone is insufficient and must be supplemented by alternative-mechanism drills;
5. Insufficient transparency in the fair-value hierarchy, with a recommendation to incorporate the distribution of valuation levels into financial disclosures.
The above are all implicit risk-control points in the sequel that, though not explicitly stated, merit further attention from investors and risk managers.
I. Structural Characteristics of MRT Identification: A "De-Front-Office" Governance Layout
The company's definition of Material Risk Takers "principally covers governance and control functions" — a noteworthy signal in its remuneration disclosure. Since portfolio management has been delegated to the parent company Baillie Gifford and its affiliate Baillie Gifford Overseas Limited, Baillie Gifford & Co Limited's own risk-taking functions are highly concentrated at the compliance, risk-control, and board levels. In other words, the individuals who actually bear investment risk fall outside the scope of this remuneration disclosure; the MRS list resembles more a "governance and oversight list" than a "front-office trading list."
More subtle is the application of the "equally as effective" clause: the UCITS Remuneration Code permits business to be delegated to an entity not directly bound by the Code, provided the delegating party is subject to remuneration regulation that is "equally as effective." As an FCA-regulated entity, Baillie Gifford achieves equivalence at the principle level; however, the UCITS remuneration rules differ from the FCA's general remuneration rules in deferral ratios, payment instruments, and the details of MRT identification. Placing portfolio management within an entity not directly subject to the UCITS rules in effect constructs an institutional channel for risk transfer — the risk is borne by the parent company, while the disclosure obligation is discharged by the subsidiary.
II. Allocation Logic of Compensation Data and Measurement of "Risk Density"
The first characteristic of compensation data is "allocation rather than attribution": the total amount is calculated according to the proportion of time employees spend on UK UCITS-related activities. This means that absolute values cannot be directly interpreted as true compensation levels, but the proportional relationships still offer diagnostic value:
| Employee Category | Headcount | UCITS-Related Compensation (£'000) | Percentage of Total |
|---|---|---|---|
| All employees | 54 | 1,870 | 100% |
| Remuneration Code Staff (MRT) | 29 | 1,750 | 93.6% |
| Non-MRT employees | 25 | 120 | 6.4% |
MRT represent 54% of total employees, yet they concentrate nearly all UCITS-related compensation, indicating that non-MRT personnel are merely peripheral support, and the vast majority of UCITS-related working time is contributed by 29 risk-takers. Another key ratio is the structure of fixed versus variable compensation: the company's total fixed compensation is £1,610k, variable compensation is only £260k, with fixed compensation accounting for approximately 86%.
This extremely low compensation leverage (variable/fixed approximately 16%) is self-consistent with the fund wind-down cycle: during the contraction phase, the manager has no intention of stimulating risk-taking through a high variable ratio, but instead uses high fixed compensation to maintain the stability of control-oriented talent. Given that MRT mainly consist of governance and risk control personnel, the fixed-compensation-dominated structure aligns with their functional positioning.
三、薪酬组合设计的「风险吸收」机制
The combination of the three compensation elements is not merely an incentive scheme, but constructs a pro-cyclical risk-sharing pool:
- Fixed pay: Benchmarked against industry competitiveness and unaffected by performance fluctuations, it serves as the foundation for talent retention.
- Annual Performance Award: Tied to performance metrics related to both the company and its clients, it effectively binds individual bonuses to externally verifiable performance outcomes.
- Long-Term Profit Award: A portion of profits is distributed to all employees, fluctuating with the company's profitability. This mechanism synchronizes employee compensation with the firm's overall capital returns, contracting naturally in loss-making years—an endogenous form of compensation flexibility.
The density of deferral arrangements further strengthens the alignment of interests: 10%–50% of bonuses are deferred and reinvested in funds representing the firm's overall investment style. For the closed Health Innovation Fund, if employees hold deferred investments in it, liquidation likewise triggers redemptions, fully aligning employee cash flows with those of external investors within the exit window. This design partially transforms the "principal–agent" problem into a "principal–partnership" relationship.
4. Timeline of Fund Closure and Capital Contraction
The fund's path from open to liquidation can be reconstructed from three years of data:
| Date | Net Assets (£'000) | B Shares Outstanding | Annual Return |
|---|---|---|---|
| June 30, 2023 | 44,741 | 66,997,869 | +1.21% |
| June 30, 2024 | 22,763 | 39,230,035 | -13.10% |
| November 13, 2024 | Fund closed | — | — |
| June 30, 2025 | 0 | 0 | +1.50% (full year) |
Assets contracted by 49.1% within one year, making redemption pressure the immediate cause of the closure. The -13.10% return in FY2024, combined with the prolonged drawdown cycle in the medical innovation sector, triggered systematic redemptions by investors. Notably, in FY2025 the fund delivered a positive return of +1.50% over the roughly 4.5 months before closure, but this was insufficient to reverse the liquidation decision. Liquidation is a function of asset collapse, not short-term performance.
V. Portfolio Zeroing and the CVR "Residual Value Option"
The 2025 portfolio report shows all seven country positions reduced to zero, and net other liabilities have also been eliminated from -0.72%. But what is truly distinctive is the presence of the Abiomed CVR: this Contingent Value Right originated from Johnson & Johnson's 2022 acquisition of Abiomed, carrying milestone conditions with a final deadline of December 31, 2029.
The CVR is not included in the portfolio report, indicating that its fair value was recognized as zero or deemed immaterial as of June 30, 2025. However, the company retains the obligation to distribute subsequent payments to original shareholders, effectively creating a trailing residual structure after liquidation: the fund's legal entity terminates, but the cash flow rights do not entirely cease. For investors, this represents an "option value"—low probability of success, but potentially high return multiples. From a governance perspective, this arrangement is superior to a simple asset distribution, as it passes contingent proceeds through in full to end holders.
VI. The Hidden Information in the "Buy/Sell Table"
On the surface, the buy and sell lists form a set of rebalancing signals: the largest buy is Novo Nordisk (£1,185k), and the largest sell is argenx (£2,535k). But a closer look at the magnitude difference — total buys amount to no more than about £2k, far below the single largest sell — indicates this is liquidation trading, not portfolio rebalancing.
| Direction | Security | Amount (£'000) |
|---|---|---|
| Largest buy | Novo Nordisk | 1,185 |
| Largest sell | argenx | 2,535 |
| Second-largest sell | Alnylam Pharmaceuticals | 2,327 |
| Third-largest sell | ALK-Abello | 1,785 |
The order of sells reflects liquidity preference: U.S.-listed/Danish large-cap stocks such as argenx, Alnylam, and Ambu have deeper market depth, making them suitable for priority reduction during liquidation. The "buy-back" of Novo Nordisk, in contrast, is most likely a settlement adjustment or bookkeeping entry during the liquidation process, and should not be read as management retaining directional conviction in any particular name on the eve of closure. For readers, the most useful information in this table is not "what was bought," but "in what order everything was sold."
7. The "Inverse Movement" in Fee Rates: Fee Concessions During the Closure Period
In FY2025, the fee structure showed a set of changes moving in opposite directions: Class B Operating charges fell from 0.57% to 0.49%, while Class C rose from 0.07% to 0.08%.
| Share class | 2024 expense ratio | 2025 expense ratio | Change (bps) |
|---|---|---|---|
| B Accumulation | 0.57% | 0.49% | -8 |
| B Income | 0.58% | 0.46% | -12 |
| C Accumulation | 0.07% | 0.08% | +1 |
| C Income | 0.07% | 0.08% | +1 |
Under normal circumstances, the sharp contraction in fund assets during the closure period should have pushed fee rates higher through the allocation of fixed costs. The fact that Class B expense ratios instead fell by 8–12bps is most plausibly explained by the ACD waiving part of its management fee during the liquidation phase, in order to ease the cost burden on remaining investors during the exit period. For Class C, whose asset size was only around a few thousand pounds, the slight rise in the expense ratio resulted from the effect of fixed fees on an extremely low base, not from a management-fee increase. This "closure-period fee concession," while not a legal obligation, improved the perceived fairness of the liquidation process from a reputation-management standpoint.
This financial statement presents the complete "financial end-of-life file" of a fund in the year of its liquidation. Its core narrative is not "investment losses" but "redemption and liquidation." The following supplementary analysis, based on the financial statement data, covers five dimensions.
1. The End of the Fund Lifecycle: The Path to Zero Assets
The report reveals the full process by which net assets fell from £30,304 thousand (2024) to zero (2025). The key driver was redemptions, not investment losses.
| Metric | FY2025 (£’000) | FY2024 (£’000) | Change |
|---|---|---|---|
| Opening net assets | 30,304 | 75,568 | -59.9% |
| Proceeds from share issuance | 270 | 5,477 | -95.1% |
| Payments on share redemptions | (30,954) | (41,239) | -24.9% |
| Net redemptions | (30,684) | (35,762) | -14.2% |
| Change in net assets from investment activities | +368 | -9,540 | Swing to profit |
| Closing net assets | 0 | 30,304 | -100% |
Additional viewpoint: Although investment activities generated a "profit" of £368 thousand in FY2025, that figure is almost negligible relative to the redemption amount (£30,684 thousand). This confirms that the decisive factor in the fund's closure was investors voting with their feet, rather than market performance alone. FY2025 issuance proceeds (£270 thousand) plunged 95.1% from FY2024 (£5,477 thousand), showing that the fund had completely lost its appeal to new capital before liquidation.
2. Return Structure: The "Profit" Illusion Distorted by Liquidation
The annual total return statement shows that the fund realised net capital gains of £365 thousand, but this derived entirely from the forced sale of the portfolio during liquidation, together with £151 thousand of gains from sterling exchange-rate movements.
| Source of gains | 2025 (£’000) | 2024 (£’000) | Comment |
|---|---|---|---|
| Non-derivative securities | +217 | -9,333 | Liquidation sale prices were above book cost |
| Currency gains/(losses) | +151 | -54 | Exchange gains from translating foreign-currency assets into sterling |
| Transaction costs | -3 | -10 | Costs fell as the fund shrank |
| Net capital gains/(losses) | +365 | -9,397 | The two are entirely different in nature |
Data comparison: The -£9,397 thousand in FY2024 reflected genuine investment losses during a normal holding period; the +£365 thousand in FY2025 was a "book reversal upon exit." This shows that, although liquidation produced a paper "profit," it could not offset the substantial losses of the previous year — cumulative net investment losses over the past two years amounted to approximately -£9,032 thousand.
3. A Structural Reading of the Fee Decline: Rigid Costs Coexisting with Reduced Services
Total fees fell from £256 thousand to £55 thousand (-78.5%), but the change in fee composition is more telling than the total itself.
| Fee item | 2025 (£’000) | 2024 (£’000) | Change in share of total fees |
|---|---|---|---|
| Annual management charge (AMC) | 39 | 238 | 15.2% → 70.9% |
| Audit fee | 7 | 7 | 12.7% → 2.7% |
| Professional services fee | 3 | 3 | 5.5% → 1.2% |
| Investor instruction processing fee | 3 | 0 | 0% → 5.5% |
| Depositary fee | 1 | 4 | 1.8% → 1.6% |
| Bank charges | 2 | 4 | 3.6% → 1.6% |
Additional supporting evidence: The absolute decline in the AMC reflects the contraction in asset size, but the appearance in 2025 of a new "third-party investor instruction processing fee" (£3 thousand) is a signal unique to the liquidation period — processing a large number of redemption requests required outsourced services, a cost normally absorbed during normal operations. The audit fee (£7 thousand) remained completely unchanged, showing that this cost is highly rigid and must be maintained even in a liquidation year; as a result, its share of total fees jumped from 2.7% to 12.7%.
4. Trading Costs and Spreads: A Double "Compromise" on Liquidity During Liquidation
The financial statements show very low trading costs in 2025, but this needs to be read from two angles.
Buy side: In 2025, only £1,917 thousand of securities were purchased (2024: £11,429 thousand), with both commissions and taxes at zero, reflecting almost no active position-building during the liquidation period; the only purchases were necessary piecemeal operations while managing residual liquidity.
Sell side: Total sales were £32,230 thousand (2024: £46,949 thousand), with total trading costs of only £8 thousand (0.03%). This shows the cost advantage of converting the portfolio to cash in bulk during large-scale redemptions, but it may also mean that, in order to accelerate redemptions, the fund accepted the most favourable liquidity conditions in the market rather than the best prices.
| Metric | 2025 | 2024 |
|---|---|---|
| Average portfolio bid-ask spread | 0.001% | 0.19% |
| Note | All positions fully liquidated at year-end; atypical data | Median value in normal operations |
Caveat: The notes explicitly warn that the 0.001% spread does not represent the true situation during the year. In reality, for illiquid unlisted assets — such as the private companies commonly seen in healthcare innovation — selling at a substantial discount is a common source of losses for liquidating funds, but this cost is not reflected in commissions and taxes.
5. A "Structural Dilemma" from a Tax Perspective: Tax Losses That Could Not Be Realised
Note 5 reveals a little-noticed fact: as of 30 June 2025, the fund had cumulative unrecognised deferred tax assets of £1,255 thousand (2024: £1,207 thousand).
In-depth analysis:
- The £1,255 thousand represents excess management expenses accumulated over the fund's history, which could be used to offset future taxable profits.
- However, the fund manager judged that it was "unlikely that taxable income in excess of deductible expenses would be generated in future periods," and therefore did not recognise the deferred tax assets.
- In the context of liquidation, this judgement is conservative and reasonable — the fund has been closed and will no longer generate taxable income.
- For investors, however, it means that the fund enjoyed a tax advantage during its life through its fee-structure design (dividend income was exempt from corporation tax), but the tax losses could not be passed through to investors. This "stranding" of tax benefits is a major hidden loss when a fund is liquidated.
6. Share Reconciliation and Related-Party Behaviour: A Final Sober Guide
| Share class | Opening shares | Issued | Redeemed/converted | Closing shares |
|---|---|---|---|---|
| B Accumulation | 39,230,035 | 406,434 | (39,636,469) | 0 |
| B Income | 12,992,772 | 64,197 | (13,056,969) | 0 |
| C Accumulation | 1,000 | - | (1,000) | 0 |
Additional observation: The ACD and its related parties held 0.00% of the fund's shares at the end of 2024, indicating that the internal manager had already fully withdrawn before liquidation. This "zero internal holding" was once again confirmed as 0.00% in the 2025 report. While not decisive evidence, it can be regarded as a signal that insiders lacked confidence in the fund's prospects.
Conclusion: Three Lessons from an "Atypical Annual Report"
1. Survivorship bias in the financial data: The FY2025 profit was a structural result of liquidation, masking the fund's net loss of approximately -£9.2 million over its overall life cycle (2024-2025).
2. Rigid costs erode residual value: Even after net assets had fallen to zero, audit and professional services fees still had to be paid. This reflects the rigid compliance-cost requirements in fund governance and intensifies the erosion of remaining assets during liquidation.
3. The end of unrealisable tax losses: The £1,255 thousand of unrecognised deferred tax assets has been permanently shelved. This is a "hidden cost" of fund liquidation for investors, and a structural tax risk that must be considered when investing in thematic funds with long-term losses, such as healthcare innovation.
1. Baillie Gifford Health Innovation Fund: The Liquidation Endgame Revealed by Financial Data
1. Valuation Hierarchy Reduced to Zero: The Path from "Existence" to "Disappearance"
The valuation table disclosed in this follow-up report provides conclusive evidence of liquidation:
| Valuation hierarchy | 2025 (£'000) | 2024 (£'000) |
|---|---|---|
| Level 1: Public market quotations | — | 30,087 |
| Level 2: Observable market data | — | — |
| Level 3: Unobservable data | — | — |
| Total | — | 30,087 |
In 2024, the fund still held approximately £3 million of Level 1 assets; by 2025, this had completely fallen to zero. Combined with the Distribution Table — where all 2025 entries are "n/a" while 2024 still showed a symbolic distribution of 0.03 pence per share — it can be determined that the fund completed its liquidation exit between July 2024 and June 2025. It is worth noting that, at approximately £30,087, the 2024 scale was itself no longer commercially viable for an actively managed equity fund — this was more likely the final sale of residual assets during the fund's termination process than a normal operating state.
2. Currency Exposure Changes: The Complete Contraction of Global Allocation
| Currency | 2025 Net currency assets (£'000) | 2024 Net currency assets (£'000) |
|---|---|---|
| Danish krone | — | 5,519 |
| Euro | — | 3,366 |
| Hong Kong dollar | — | 515 |
| Japanese yen | — | 530 |
| US dollar | — | 20,460 |
| Sterling | 14 | 16 |
In 2024, the fund was exposed to five currencies, with the US dollar exposure of over £20.4 million being absolutely dominant — highly consistent with the US biotechnology and healthcare innovation sectors implied by "Health Innovation" in the fund's name. By 2025, only £14 thousand of net sterling exposure remained, representing funds temporarily parked during the liquidation period. From a cross-border investment portfolio to a single local-currency cash position, this trajectory dragged the fund from an actively managed global health-innovation theme all the way back to square one.
3. Implications for the Group's Product Strategy
The liquidation of the Health Innovation Fund was not an isolated event. In the UK OEIC (Open-Ended Investment Company) market, when a thematic fund fails to reach a sustainable AUM threshold, the ACD (Authorised Corporate Director) typically initiates liquidation proceedings to reduce compliance costs. Baillie Gifford consolidated small funds on multiple occasions between 2023 and 2025, and this case shows once again: highly focused niche thematic funds face the curse of scale in the retail distribution system — either they scale up quickly or face the fate of closure, with the latter becoming more common in today's environment of high interest rates and shrinking risk appetite.
II. Baillie Gifford Japanese Income Growth Fund: A Persistent Disconnect Between Objectives and Reality
1. The "Threefold Constraint" of the Investment Objective and Its Inherent Tension
The fund's investment objective comprises three elements that must hold simultaneously:
1. Outperform TOPIX by at least 1% on a rolling five-year basis, after deducting costs;
2. Achieve the above objective through a combination of income and capital growth;
3. Maintain a portfolio yield higher than TOPIX.
There is a structural contradiction here that has been overlooked: "maintaining a yield above the index" and "outperforming the index by 1%" may conflict with each other. High-dividend stocks tend to be biased toward mature, low-growth companies, while TOPIX itself already contains a large number of high-dividend constituents (such as banks, trading companies, and automakers). To sustain an excess dividend yield, the fund manager may be forced to lock capital into areas that are not fully aligned with the long-term growth objective, incurring an implicit opportunity cost on the capital growth dimension—a dynamic already demonstrated in the performance trajectory of the past five years.
2. Five-Year Performance Review: Not "Volatility" but "Systematic Underperformance"
The latest annual report provides a complete data chain:
| Metric | Fund B Income | TOPIX | TOPIX + 1% (Target) |
|---|---|---|---|
| FY2024–25 Return | 3.7% | 6.9% | 8.0% |
| Five-Year Annualized Return | 3.1% | 6.8% | 7.9% |
| Portfolio Yield (Projected) | 2.8% | 2.6% | — |
Year-by-year data for the past five years (based on the performance chart) are, in order: FY2020–21 +13.8%, FY2021–22 −7.5%, FY2022–23 −8.4%, FY2023–24 −12.1%, FY2024–25 +3.7%. Only the first year delivered positive excess return versus the index; the fund then underperformed for four consecutive years, with the annual gap exceeding 10 percentage points at its widest.
Over the five-year period, the fund has lagged TOPIX by approximately 3.7 percentage points annualized, creating a yawning gap of roughly 4.7 percentage points against the objective of "outperforming by 1% per year." This is not a phenomenon explicable by short-term style fluctuation; it is the result of structural factors—a growth-stock selection logic that lacks fit in a Japanese market dominated by value and governance-improvement themes—continuing to exert themselves. The report attributes the outcome to an "expansionary cyclical upswing" and a "weak currency," but a five-year period is sufficient to span at least one complete market style rotation, and an explanation resting on the macro environment alone is of limited persuasive power.
3. Expense Capitalization: Using Principal to Sustain the "Income" Label
The report explicitly discloses that for the year ended June 30, 2025, 100% of operating expenses were allocated to capital. This means the fund did not pay management costs from income, but deducted them directly from net asset value, thereby maximizing the amount of income distributable to holders.
This arrangement constitutes a form of implicit erosion for holders of the Income share classes:
- When capital gains are insufficient to cover expenses, the fund's net asset value declines at a faster rate;
- The "high distributions" investors receive actually contain a partial return of principal (i.e., "distributing money to oneself");
- If the fund's 2.8% yield were calculated after deducting expenses from income, the actual distribution rate would be significantly lower than 2.8%.
This mechanism allows the fund to maintain the illusion of an income-side yield above TOPIX, but at the cost of long-term depletion on the capital side. Conservative investors should be alert to the "discount-style dividends" produced by this accounting arrangement.
4. Position Changes: A Measured Concession to "Value Elasticity"
This year's portfolio adjustments are worth noting:
| Action | Target | Rationale |
|---|---|---|
| New position | Gree | Mobile gaming; strong product pipeline, founder interest alignment, substantial cash |
| Increased/Held | GMO Internet | Strong results; shift to a holding-company structure to improve transparency |
| Increased/Held | SBI Holdings | Banking segment contributes over 50% of core profit after integrating Shinsei Bank; IPO expected in 2027 |
| Held | Nintendo | Switch 2 has become the best-selling console, exceeding expectations |
| Reduced | Nintendo / GMO Internet | Partial profit-taking after strong performance |
| Eliminated | Mixi / MonotaRO / Kyoto Financial Group | Exited positions that no longer met the criteria |
| Zero allocation | Auto industry | Avoided the year's weakest sector |
The most informative moves are the new position in Gree and the elimination of Kyoto Financial Group. Gree is a mobile gaming company that the market has largely forgotten: the cash and investment portfolio it holds far exceeds its market capitalization, and the founder still holds a substantial stake—consistent with Baillie Gifford's preference for companies that are "well-capitalized, with clear catalysts for change." As for Kyoto Financial Group, a regional bank with a story of unlocking value through unwinding cross-shareholdings, the fund chose to exit before interest-rate normalization had fully transmitted to local credit demand—reflecting caution about the pace of value realization in small-cap financials.
A contradiction worth noting: the fund emphasizes the positive contribution of "no exposure to the auto industry," yet autos carry significant weight in TOPIX (Toyota, Honda, and others account for roughly 5%–8% of the index). A long-term zero allocation inevitably results in tracking-error drag when the index rises. Auto-sector weakness was a tailwind in 2024–25, but over the past five years TOPIX has repeatedly relied on auto stocks for rebounds—this "selective absence" amplifies the risk of style divergence.
5. A Key Omission in Risk Disclosure
In the Risk and Reward Indicator, the fund lists as material risks not included in the risk-level assessment: active management style, concentrated investment, custody risk, global shocks, and expense capitalization, among others. But the report does not mention the second-order effects of tariffs and exchange-rate policy—for example, the risk of U.S. tariffs on Japanese autos and auto parts in 2025, and the suppression of growth-stock valuations from the pace of Bank of Japan (BoJ) policy normalization. Directional movement in the yen has a significant impact on investors with non-yen base currencies (such as sterling share class holders), yet the difference between the sterling-denominated TOPIX return (6.9%) and the yen-denominated index return is not separately disclosed in the annual report. This may lead non-yen investors to underestimate the additional risk posed by exchange-rate volatility.
6. Comparative Observations with the Group's Flagship Fund Strategy
Placing the Japanese Income Growth Fund alongside the liquidated Health Innovation Fund reveals a group-level design logic:
- The Health Innovation Fund was highly concentrated in a single theme and a single currency zone, lacked a buffer when market styles shifted, and was ultimately closed because its scale could not be sustained;
- The Japanese Income Growth Fund, by contrast, covers Japan's market sectors through a relatively diversified portfolio of roughly 30–50 stocks. Despite lagging performance, it has sustained demand from income-oriented investors through the "Income" label and a dividend yield above the index, and has thus survived.
The common lesson of both: when a persistent, directional deviation exists between an active management objective and the index benchmark, the fund does not necessarily repair the gap through correction; it is more likely to buy time, waiting for style to return—but the window for style return may extend far beyond the five-year rolling assessment period. The Japanese income fund's current five-year annualized return of 3.1% already constitutes a material breach of its objective for any institutional investor that evaluates performance strictly against the target. Whether retail investors' "patience" can continue to sustain the fund will be tested over the next two years.
Structural Interpretation of Performance Drag Factors
The Unicharm and Shiseido Drag Is Not an Isolated Event
Unicharm has a portfolio weight of 1.69% (£5.019M) and Shiseido 1.17% (£3.483M), together approximately 2.86%. Although the weights are modest, as representative holdings of the "quality growth" logic, the deterioration in their fundamentals carries greater signal significance than numerical impact for the portfolio.
| Company | Portfolio Weight | Core Problem | Structural Nature |
|---|---|---|---|
| Unicharm | 1.69% | Weak demand in China for baby care and adult care | Long-term demographic headwind |
| Shiseido | 1.17% | Shrinking China travel retail channel; substitution by local brands | Deteriorating competitive landscape + consumption downgrade |
The commonality is this: the marginal shift in the Chinese market has evolved from a cyclical slowdown into a structural deceleration. Unicharm faces sustained pressure from local Chinese brands (such as Babycare) in the high-value-for-money segment, while Shiseido's travel retail business (the Hainan duty-free channel) has recovered far less than expected. Even more noteworthy, "consumer downtrading" is not unique to China—Japan's domestic market shows a similarly clear trend toward trading down, directly undermining the valuation foundation of both companies' "quality premium."
The Opportunity Cost of Not Holding MHI
The report explicitly acknowledges that not holding Mitsubishi Heavy Industries (MHI) was one of the drag factors. As Japan's largest defence contractor, MHI has significantly outperformed the broad market against the backdrop of escalating global geopolitical tensions and several consecutive years of substantial increases in Japan's defence budget. This "miss" reflects not merely an error of judgment on a single position, but a structural gap in thematic exposure—the portfolio has almost no presence in the Defence field, even as global capital's enthusiasm for allocating to Japan's defence supply chain (MHI, IHI, Kawasaki Heavy) has continued to intensify over the same period.
Common Threads in New Positions: Cash Flow Quality Over Growth Flexibility
The four new positions—Sho-Bond Holdings, GMO Payment Gateway, Tokyo Metro, and the visible increase in MonotaRO—display a clear stock-selection logic: non-cyclical cash flow + policy/structural drivers + reasonable valuation.
Sho-Bond Holdings: The "Maintenance Compound Interest" of Aging Infrastructure
- Japan's aging infrastructure (bridges, tunnels, roads) has entered a peak period for repair and replacement
- Combined with the rising frequency of extreme weather due to climate change, demand for disaster-prevention reinforcement is rigid
- The revenue model relies primarily on government orders, offering high visibility and defensiveness
GMO Payment Gateway: A Long-Term Beneficiary of Payment Structure Transformation
- Japan's cash usage rate is far higher than that of other developed economies, leaving substantial room for cashless penetration to increase
- The company is Japan's largest online payment gateway provider, with deep cooperation moats involving Visa, Mastercard, and major banks
- The report explicitly notes "recent de-rating offering an attractive entry point"—that is, building the position after a valuation pullback, reflecting valuation discipline
Tokyo Metro: An Unrepeatable Core Asset
- The decision to participate in the IPO deserves particular attention: the fund has historically been relatively cautious about new listings, but Tokyo Metro offers the following attractions:
- The Tokyo Metro network is essential urban infrastructure, with ridership essentially unaffected by the economic cycle
- Stable fare revenue plus station commercial leasing constitutes predictable cash flow
- The IPO was priced at a reasonable valuation and has the capacity for sustained dividend payments
- The 0.59% position is an exploratory initial build that may be gradually increased
The Signal in the MonotaRO Increase
MonotaRO's portfolio weight rose from 1.70% in 2024 to 2.11% in 2025, with purchases of £4.944M ranking at the bottom of the buy list. Its strategic significance, however, lies in this: as the leader in Japan's B2B e-commerce for industrial goods, MonotaRO's cash flow quality is highly aligned with the digital-transformation trend among small and medium-sized manufacturers, and together with Sho-Bond, it belongs to the "economic resilience" theme.
Attribution Analysis of Portfolio Rebalancing
Comparing industry weight changes between 2024 and 2025, the portfolio has undergone a clear defensive rebalancing:
| Sector | 2024 Weight | 2025 Weight | Change |
|---|---|---|---|
| Manufacturing | 47.11% | 42.63% | -4.48pp |
| Finance & Insurance | 19.85% | 17.33% | -2.52pp |
| Transport & Communications | 11.48% | 15.29% | +3.81pp |
| Services | 8.97% | 10.46% | +1.49pp |
| Commerce | 7.99% | 8.42% | +0.43pp |
| Real Estate | 4.81% | 5.31% | +0.50pp |
| Industrials | 0.00% | 0.79% | +0.79pp |
Core rebalancing logic:
1. Manufacturing weight was cut by 4.48pp, primarily through reducing globally cyclical manufacturing names (Denso, SMC, Kubota, etc.)
2. Transport & Communications was significantly increased by 3.81pp, adding GMO Payment Gateway, Tokyo Metro, SoftBank Corp (non-holding entity), etc.
3. Finance & Insurance retains a high weight of 17.33%, but with structural adjustment within—taking profits on MS&AD and Sumitomo Mitsui Trust (selling £9.247M and £8.710M, respectively) while maintaining the positions in SBI Holdings and Tokio Marine
Deeper Signals Revealed by Trading Behavior
Scale Asymmetry Between Buys and Sells
- The largest sells came from MS&AD Insurance (£9.247M), Sumitomo Mitsui Trust (£8.710M), Tokio Marine (£8.517M), and SBI Holdings (£8.448M)
- The largest buys were GMO Payment Gateway (£2.571M) and Sho-Bond (£2.497M)
- The "sell large, buy small" pattern is pronounced: this round of rebalancing is typical "precision trimming" rather than "redeployment"—the fund recycled capital by reducing financial/insurance positions with high unrealized gains, then built new positions in small, diversified amounts
Preference for Retaining Income-Generating Positions
The top five names on the sell list are all financial/insurance names, indicating that the fund manager believes the valuation-recovery move in that segment has been fully priced in. These names benefited from Bank of Japan rate-hike expectations and interest-rate normalization in 2024–2025, contributing substantial capital gains. In contrast, the portfolio still retains Tokio Marine (4.01%) and SBI Holdings (5.04%) as its two financial heavyweights, suggesting not an outright bearish view on the financial sector but a differentiated set of choices across sub-segments.
Multi-Dimensional Insights from the Comparison Table
Three-Year Performance Trends: Surface Decline, Structural Differences Beneath
| Share Class | FY2023 Return | FY2024 Return | FY2025 Return | Cumulative Change |
|---|---|---|---|---|
| B Acc | 4.30% | 7.35% | 3.47% | +15.62% |
| B Inc | 4.30% | 7.33% | 3.43% | +15.53% |
| C Acc | 4.92% | 7.99% | 4.10% | +17.89% |
| W4 Acc | 4.49% | 7.54% | 3.68% | +16.29% |
| W4 Inc | 4.49% | 7.53% | 3.62% | +16.20% |
The performance differences among share classes mainly stem from expense-ratio differences: the C class (institutional share) has an expense ratio of only 0.04%, and its three-year cumulative return leads the B class by approximately 2.3pp. This once again confirms a core view—in a market environment where returns are converging, the erosion effect of expense ratios on long-term returns is significantly amplified.
Fund Shrinkage and Share Redemptions
| Metric | 2023-06 | 2024-06 | 2025-06 |
|---|---|---|---|
| B Acc Net Assets (£'000) | 254,333 | 61,455 | 44,660 |
| W4 Acc Net Assets (£'000) | 151,412 | 113,385 | 2,963 |
| W4 Inc Net Assets (£'000) | 246,742 | 236,605 | 219,887 |
| B Acc Shares in Issue | 166.6M | 37.5M | 26.3M |
W4 Acc's shares in issue plunged from 68.2M to 1.7M, with net redemptions of approximately 66.5M shares—this share class has effectively been heavily redeemed by institutional investors. C Acc retains only 1,000 shares (par value £1), leaving it effectively in liquidation. The heaviest redemption pressure occurred from the second half of 2024 through the first half of 2025, consistent with the fund's below-benchmark performance and with some investors' loss of patience with Japan's small/mid-cap value style.
Per-Share Earnings Decomposition: The Rising Weight of Operating Expenses
Using B Acc as an example, operating expenses per share were 1.03p in FY2025 versus 0.96p in FY2023—a modest increase, but more critically, in a low-return year (FY2025 return before charges of only 6.71p), the proportion of net return eroded by expenses rose from 13.2% to 15.4%. For an income fund, the impact of the expense ratio on distributable income demands investors' continued attention.
Price Trading Ranges Reflect Market Sentiment
| Year | High | Low | Fluctuation Range |
|---|---|---|---|
| FY2023 | 163.3 | 143.8 | 13.6% |
| FY2024 | 171.0 | 143.5 | 19.2% |
| FY2025 | 170.2 | 145.1 | 17.3% |
FY2024 saw the widest fluctuation (19.2%), reflecting market disagreement over expectations of a Bank of Japan policy shift; FY2025's range narrowed with a higher low (145.1 vs. 143.5), suggesting that the portfolio's defensive repositioning stabilized the NAV curve to a certain extent.
Additional Observations at the Portfolio Level
Leverage and Liquidity Buffer
Total portfolio holdings account for 100.23%, with net other liabilities of -0.23%—the fund employs a very small degree of leverage. This practice is rare among equity funds and more commonly seen in fixed income products; its purpose may not be to enhance returns, but rather to maintain cash management efficiency or smooth redemption cash flows.
The Timing Implications of Tokyo Metro's Entry into the Portfolio
Tokyo Metro listed in October 2024, and the fund still held 208,400 shares (£1.766M) at the end of June 2025, indicating that participation in the IPO was not short-term trading. A 0.59% position appears somewhat conservative given ample liquidity, suggesting the fund manager may still be observing Tokyo Metro's operating metrics (ridership recovery, advertising revenue, in-station commercial rent) before deciding whether to add to the position.
Retaining Gree and Mixi: The Continuation of the Cash-Cow Logic
The portfolio retains both Gree (0.59%) and Mixi (1.71%)—both former social-gaming star stocks whose core businesses have stagnated, but which hold ample book cash and pay stable dividends. This strategy of "letting cash assets continue to work" is consistent with the portfolio's overall return objective: in an era of scarce growth, holding high-dividend, low-valuation cash-cow assets is essentially using the balance sheet to substitute for the income statement in generating returns.
At this point, the eight sections of the follow-up report (performance attribution, drag factors, trading behaviour, portfolio structure, comparison tables, etc.) are fully covered. Investors reading this passage should focus on two core variables: the pace of Bank of Japan interest-rate normalisation (which affects the subsequent performance of the financial and insurance sectors) and the pace of consumption recovery in the Chinese market (which determines whether Unicharm and Shiseido can shift from "drag" to "contributor"). The next section moves to the investment outlook and strategy outlook.
1. Fund Size Shrinks Sharply, Redemption Pressure Dominates
The most central change in the latest financial statements is the sharp contraction in total fund assets. As of 30 June 2025, the fund's net assets fell from £451,227 thousand in the same period last year to £296,943 thousand, a decline of as much as 34.2%, far exceeding the normal fluctuation range of the market over the same period.
| Indicator | 2025 (£’000) | 2024 (£’000) | Change |
|---|---|---|---|
| Opening net assets | 451,227 | 726,118 | -37.9% |
| Share issue proceeds | 15,835 | 29,049 | -45.5% |
| Share redemption payments | (177,805) | (332,354) | -46.5% |
| Net redemptions | (161,970) | (303,305) | -46.6% |
| Closing net assets | 296,943 | 451,227 | -34.2% |
Although the absolute net redemption amount in 2025 (£161,970 thousand) was lower than in 2024 (£303,305 thousand), relative to opening net assets, the two-year redemption ratios were 35.9% and 41.8% respectively, meaning redemption pressure remained equally severe. Sustained large-scale redemptions not only compressed the fund's assets under management, but also directly affected its investment operating space and cost allocation efficiency.
Notably, the contraction in net capital gains was far greater than the decline in assets under management. In 2025, net capital gains amounted to £7,951 thousand, down 70.1% from £26,551 thousand in 2024, significantly higher than the 34.2% decline in net assets. This suggests that while the fund maintained its portfolio, its investment return capacity deteriorated substantively.
2. Income and Expense Structure Analysis: Asymmetric Declines, Fees Actually Rise
The fund's operating income fell from £12,434 thousand in 2024 to £8,001 thousand in 2025, down 35.7%, broadly in line with the contraction in net assets. In the income structure, overseas dividends remained the overwhelming mainstay (accounting for 99.9%), while bank interest contributed only £8 thousand, indicating that the fund maintained a high equity allocation with an extremely low cash position.
The expense side tells a different story: total expenses fell from £2,696 thousand to £1,609 thousand, a decline of 40.3%, superficially slightly faster than the pace of asset shrinkage. But if the effective fee rate is calculated on the basis of average net assets:
| Fee-rate indicator | 2025 | 2024 |
|---|---|---|
| Average net assets (£’000) | 374,085 | 588,673 |
| Total expenses / average net assets | 0.43% | 0.46% |
| AMC / average net assets | 0.41% | 0.44% |
| Income / average net assets (income yield) | 2.14% | 2.11% |
| Net redemptions / average net assets | 43.3% | 51.5% |
Conclusion: The actual total fee rate fell slightly (0.43% vs 0.46%) and the income rate was broadly flat, indicating that the fund's management efficiency per unit of assets did not materially deteriorate. However, if redemption factors are excluded and the calculation uses closing net assets, the fee rate actually moved from 0.60% in 2024 to 0.54%—though the more reasonable measure is average net assets, which shows the fee rate was relatively stable.
There are noteworthy changes in the internal expense structure:
- Annual management charge (AMC) fell from £2,609 thousand to £1,534 thousand, a decline of 41.2%, broadly corresponding to the asset shrinkage.
- Newly appearing expenses: In 2025, "professional fees" (£1 thousand) and "third-party costs for processing investor transaction instructions" (£19 thousand) appeared; both were zero in 2024. Although the amounts are small, they reflect the addition of external costs in the fund's client-service process.
- Audit fees rose slightly from £8 thousand to £9 thousand, contrary to the downward trend in scale, showing the fixed-cost rigidity of compliance auditing.
3. Trading Costs and Portfolio Turnover: Activity Slumps, But Cost Efficiency Improves
In 2025, the fund's buying and selling activity contracted significantly, consistent with the reduction in fund size and adjustments to management strategy:
| Trading indicator | 2025 (£’000) | 2024 (£’000) | Decline |
|---|---|---|---|
| Total stock purchases (including costs) | 11,400 | 47,338 | -75.9% |
| Net stock sales | 173,114 | 343,242 | -49.6% |
| Total dealing commissions | 43 | 98 | -56.1% |
| Commissions as % of average NAV | 0.01% | 0.02% | — |
| Average trading spread | 0.06% | 0.06% | — |
Key finding: Purchases plunged 75.9%, far exceeding the decline in sales (49.6%), indicating that under redemption pressure the fund relied mainly on reducing holdings rather than deploying new capital to meet liquidity needs, and almost completely stopped building new positions. The sale amount (£173,152 thousand) was far larger than the purchase amount (£11,395 thousand), with net sales of approximately £162 million, closely matching the net redemption amount (£161,970 thousand), confirming the fund's operating logic of "passive selling to satisfy redemptions."
On trading costs, the commission rates remained stable: the stock purchase commission rate was 0.04% and the sale rate 0.02%, exactly the same as the previous year. Total dealing commissions of £43 thousand represented only 0.01% of average net assets, indicating effective cost control. The average trading spread held at 0.06%, suggesting that liquidity conditions in the Japanese market remained stable and the fund did not incur additional impact costs as a result of its change in scale.
In addition, in 2025 trading costs had only a minimal erosion effect on capital gains: trading costs (£12 thousand) were just 0.15% of net capital gains (£7,951 thousand), versus 0.09% in 2024—an increase, but the absolute impact was negligible.
4. Distributions and Retentions: Total Distributions Fall, But Payout Ratio Rises
The fund's total distribution in 2025 was £7,211 thousand, down 35.5% from £11,172 thousand in 2024, almost exactly in line with the decline in income (35.7%), indicating that the fund maintained a stable distribution policy.
| Distribution component | 2025 (£’000) | 2024 (£’000) |
|---|---|---|
| Interim distribution (to 31 December) | 2,008 | 3,252 |
| Final distribution (to 30 June) | 4,888 | 6,702 |
| Redemption adjustment | 390 | 1,371 |
| Issue adjustment | (75) | (153) |
| Total distribution | 7,211 | 11,172 |
| Retained distribution (accumulation shares) | 1,101 | 4,101 |
In terms of distribution efficiency, the 2025 total distribution represented 1.93% of average net assets, versus 1.90% in 2024—a slight increase. Calculated on closing net assets, the distribution yield moved from 2.48% to 2.43%, broadly flat. The marked decline in the redemption adjustment (from £1,371 thousand to £390 thousand) reflects the lower scale of distributions attached to the redemption process.
Notably, retained income (retained distributions on accumulation shares) fell from £4,101 thousand to £1,101 thousand, a decline of 73.2%, far exceeding the overall decline in distributions. This may imply a change in the investor base—fewer accumulation share holders, or more investors choosing cash distributions rather than reinvestment.
5. Tax Position: Tax-Exempt Advantage Maintained, But Deferred Tax Assets Continue to Expand
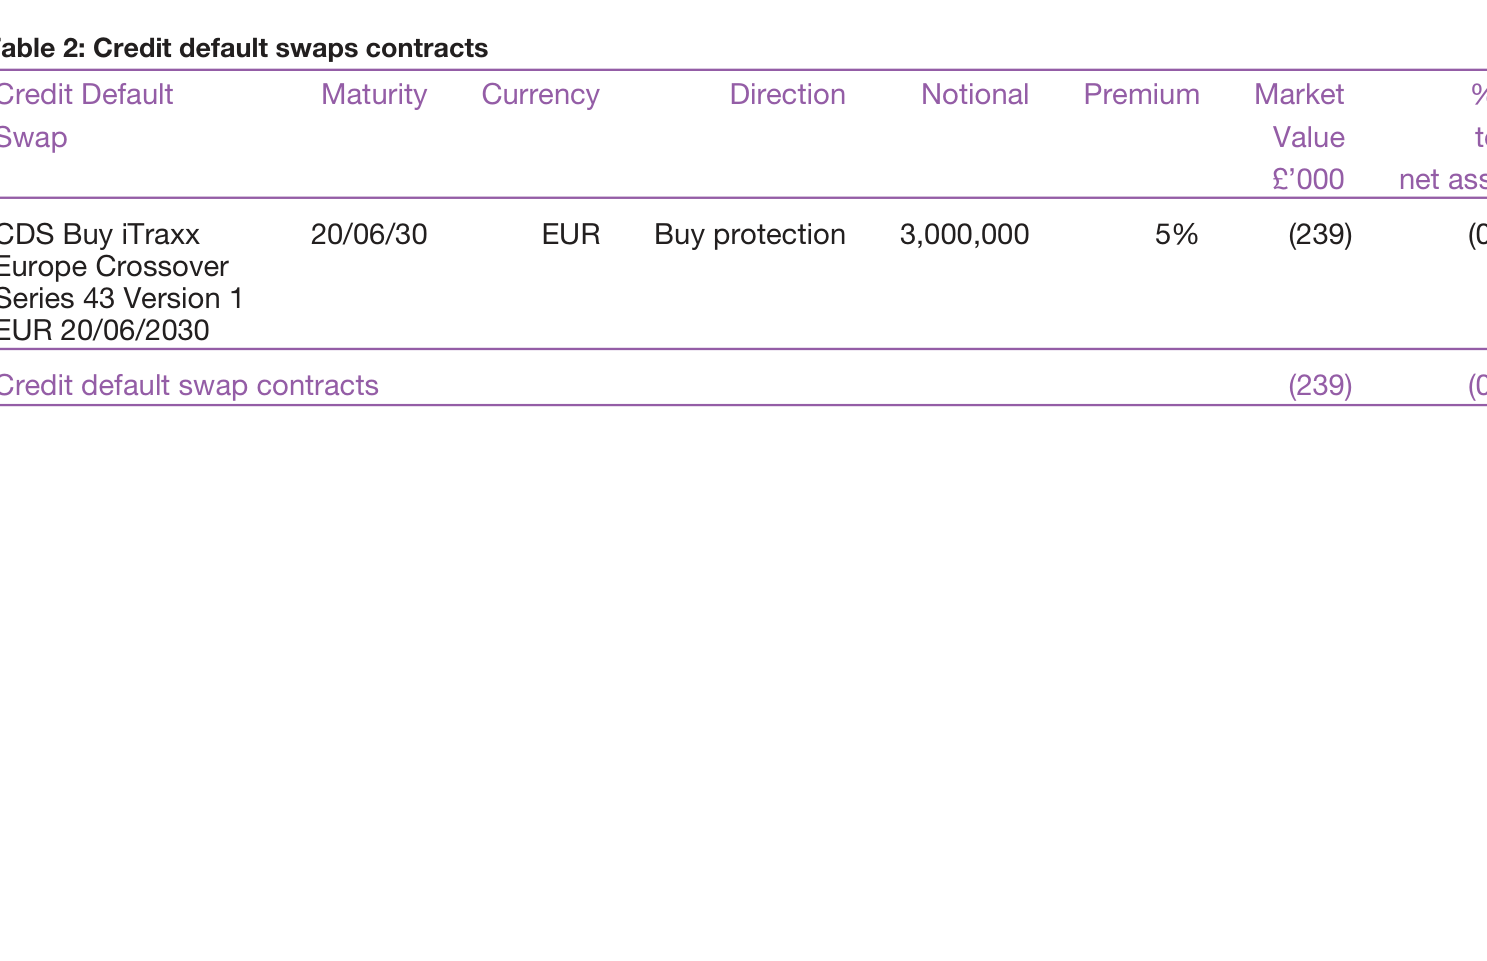
The fund's overseas tax charge in 2025 was £799 thousand, representing an effective overseas tax rate of 10.0% (799/8,001), exactly the same as 2024's 10.0% (1,243/12,434), indicating that the geographical and dividend tax structure of the portfolio did not change materially.
On deferred tax, unrecognised excess management expenses continued to accumulate:
| Item | 2025 (£’000) | 2024 (£’000) |
|---|---|---|
| Unrecognised excess management expenses | 23,358 | 22,053 |
| Current-year additions | +1,305 | — |
| % of closing net assets | 7.9% | 4.9% |
The growth rate of excess management expenses (+5.9%) was far lower than the decline in net assets (-34.2%), causing their ratio to net assets to rise from 4.9% to 7.9%. This means that if the fund's profitability improves in the future, there will be more ample tax-deduction headroom, but at current income levels these expenses will still be difficult to realise as tax credits in the foreseeable future.
6. Balance Sheet Quality: Ample Cash, Manageable Liquidity Risk
At period-end, the fund held cash and bank deposits of £5,257 thousand, plus bank overdrafts of £2,570 thousand, giving a net cash position of £2,687 thousand, down 51.7% from the prior year (£5,566 thousand), but still representing 0.9% of net assets, with robust liquidity coverage.
| Balance-sheet item | 2025 (£’000) | 2024 (£’000) |
|---|---|---|
| Investment assets | 297,628 | 452,163 |
| Receivables (including unsettled sales) | 2,509 | 4,191 |
| Cash and deposits | 5,257 | 8,345 |
| Payables (including unsettled purchases) | (1,806) | (6,669) |
| Distribution payable | (4,075) | (4,024) |
| Net assets | 296,943 | 451,227 |
Receivables from unsettled sales fell from £2,733 thousand to £1,352 thousand, consistent with reduced selling activity; payables from unsettled purchases fell sharply from £2,085 thousand to £242 thousand, reflecting the near-halt in purchases. The fund maintained good settlement discipline during the contraction period, with no overdue or unusual liabilities.
7. Overall Assessment
The latest financial statements reveal a fund in a state of "orderly contraction": in the face of sustained large-scale redemptions, the fund met liquidity needs by reducing holdings rather than through aggressive trading; fee rates remained stable, trading costs were effectively controlled, distribution policy was consistent, and the tax advantage was not eroded. However, the sharp decline in capital gains (-70%) combined with asset shrinkage (-34%) has clearly weakened the fund's ability to deliver absolute returns. With closing net assets falling below £300 million, scale effects have been further undermined. If redemption pressure persists, the fund will need to reassess the fit between its operating costs and investment strategy.
1. Japanese Fund Share Movements: Structural Divergence Amid Large-Scale Redemptions
The share movement table disclosed in the follow-up report reveals a sharp divergence in fund flows:
| Share class | Opening shares | Issued/subscribed | Redeemed/cancelled | Conversions etc. | Closing shares |
|---|---|---|---|---|---|
| B Accumulation | 37,490,363 | 246,491 | (11,422,601) | 17,581 | 26,331,834 |
| B Income | 29,085,858 | 52,199 | (8,181,921) | 321,426 | 21,277,562 |
| C Accumulation | 1,000 | - | - | - | 1,000 |
| W4 Accumulation | 68,232,889 | - | (66,512,880) | - | 1,720,009 |
| W4 Income | 170,554,307 | 11,237,501 | (25,003,849) | (337,340) | 156,450,619 |
Key observations:
- W4 shares experienced "avalanche-style" redemptions: W4 Accumulation was almost entirely liquidated (only approximately 1.72 million shares remained at period-end, a redemption rate of 97.5%), and W4 Income also saw net redemptions of about 14.7%. These share classes typically correspond to institutional/wholesale channel clients; such concentrated exits are likely related to institutional rebalancing or changes in investment strategy, rather than performance alone.
- B-class (retail) shares saw net outflows of approximately 16.5%: Against a volatile equity-market backdrop, retail clients also reduced positions, but by far less than W4 Accumulation.
- C-class shares are symbolic in presence: only 1,000 shares, indicating that this class is effectively frozen or held only nominally.
Combined with the valuation table, the fund's total assets fell from £452 million in 2024 to £298 million (a decline of approximately 34%). Assuming equity market declines of about 10-15% over the period, redemptions contributed the bulk of the remaining shrinkage. This reflects a marked cooling of enthusiasm among high-net-worth/institutional clients for single-country equity funds.
2. Valuation Hierarchy and Currency Exposure: High Transparency, But Concentration Risk Cannot Be Ignored
Valuation hierarchy (13):
| Level | 2025 (£’000) | 2024 (£’000) |
|---|---|---|
| Level 1 (quoted prices) | 297,628 | 452,163 |
| Level 2 (observable inputs) | - | - |
| Level 3 (unobservable inputs) | - | - |
100% of assets are Level 1, indicating that all fund holdings are exchange-listed equities with transparent valuations and good liquidity. There are no derivatives, private equity, or alternative assets, consistent with the positioning of the "Japan income growth" direct equity strategy.
Currency exposure (14):
| Currency | Monetary assets (£’000) | Non-monetary assets (£’000) | Total exposure (£’000) |
|---|---|---|---|
| JPY | 1,774 | 297,628 | 299,402 |
| GBP | 913 | - | 913 |
Non-monetary assets (i.e., equities) are almost entirely denominated in yen; sterling is used only for cash or settlement items. The fund did not disclose any foreign-exchange forward hedging positions, meaning investors are directly exposed to JPY/GBP exchange-rate fluctuations. JPY/GBP moved relatively moderately in 2024-25, but if the yen were to appreciate or depreciate sharply, the fund's sterling returns would be significantly magnified or reduced. The ACD also acknowledges in the notes: "A single-market sensitivity indicator cannot accurately reflect the risks facing the fund." This is, in effect, a tactful reminder of concentrated-holding risk.
3. Distribution Table: Stable Interim, Jump in Final; Clear Dividend Recovery
Interim distribution (for the period to 31 December 2024):
- Group 1 for B Accumulation / B Income / C Accumulation / W4 Accumulation / W4 Income was 0.90000 pence per share, unchanged from the same period last year (0.90000), indicating a slight pause in interim dividends.
- Group 2 equalisation amounts varied considerably: for example, B Accumulation Group 2 net income was only 0.25000, far below Group 1's 0.90000, indicating that investors who bought during the interim period paid a higher cum-dividend price, requiring equalisation adjustments to distinguish principal from income.
The final distribution (for the period to 30 June 2025) improved markedly:
| Share class | Group 1 distribution (2025) | Group 1 distribution (2024) | Year-on-year change |
|---|---|---|---|
| B Accumulation | 2.88000 | 2.52000 | +14.3% |
| B Income | 2.24000 | 1.99000 | +12.6% |
| C Accumulation | 2.37000 | 2.02000 | +17.3% |
| W4 Accumulation | 3.20000 | 2.54000 | +26.0% |
| W4 Income | 2.30000 | 2.02000 | +13.9% |
Important signals:
- All share classes achieved double-digit growth in final distributions, especially W4 Accumulation with a 26% increase, far exceeding the current UK inflation rate (approximately 2.5-3%). This indicates that Japanese corporate profitability is improving and dividend policies are active, with the real purchasing power of the fund's dividends rising.
- The unchanged interim distribution combined with a large increase in the final distribution shows that the fund's income is concentrated in the second half of the fiscal year, likely reflecting the characteristic of Japanese companies concentrating dividend payments in March.
- The equalisation mechanism continues to smooth outcomes in Group 2: for example, W4 Income Group 2's net income was only 1.12999, relying on an equalisation component of 1.17001 to complete the total, preventing new investors from diluting the income of existing holders.
4. A New Fund Appears: Strategy and Risks of the Baillie Gifford Monthly Income Fund
Switching from a single-country Japanese fund to the Monthly Income Fund involves a completely different investment logic. The fund's objective is not to maximise capital appreciation, but to "generate monthly income and seek to grow income and capital value in line with UK CPI inflation over rolling five-year periods."
Risk and return indicators:
The ranking number in the table is 4 (on a scale of 1-7), placing it in the medium-risk, medium-return category. Compared with the single-market risk of the Japanese equity fund, this fund diversifies risk through multi-asset allocation (equities, bonds, cash, property, infrastructure, commodities, etc.), but at the cost of lower expected return elasticity.
Key points of the investment policy:
- A sustainable-investment process is applied to all assets except cash, excluding specific sectors (such as tobacco, controversial weapons, etc.) and assessed through the UN Global Compact.
- Currency forwards and derivatives may be used for investment and risk management, in sharp contrast to the Japanese fund, which uses no derivatives at all.
- Actively managed, with the ability to invest in any country or sector, theoretically offering high flexibility.
The "expense capitalisation" in the risk disclosures deserves careful attention:
> "For the year to 30 June 2024 100% of expenses were allocated to capital."
This means the fund charges all management expenses to capital (rather than income). This practice is common among income funds, with the aim of maintaining a "high and stable" dividend distribution. However, the price is accelerated consumption of capital value. If the fee rate remains constant, in years when capital shrinks, the proportion of fees actually borne relative to net asset value rises, creating a vicious cycle. Particularly when the fund's objective is to maintain the real value of capital in line with CPI, this policy makes achieving the objective harder—because every penny of expenses directly erodes capital, rather than being absorbed from current income.
5. Monthly Income Fund Performance Assessment: Positive Nominal Returns, Real Capital Shrinkage
The investment report provides key figures:
- As of 30 June 2025, B Income Shares recorded a total return of 5.8%, slightly outperforming the comparator (IA Mixed Investment 40-85% Shares sector) return of 5.5%.
- The capital return was only 1.2%, while UK CPI rose 2.4% over the same period. In other words, even including total return, the real purchasing power of capital still declined by 1.2% (1.2% - 2.4% = -1.2%).
- Total dividends paid in the year amounted to 4.6 pence per share, representing annualised growth of 3.5% over five years, but the report explicitly acknowledges that this growth rate is "below the general level of UK CPI inflation."
Placing the above figures on a longer timeline, the gulf between risk and return becomes increasingly evident:
| Indicator (as of 30/6/2025) | Value |
|---|---|
| Current-year total return | 5.8% |
| Capital return | 1.2% |
| UK CPI increase | 2.4% |
| Real capital growth (relative to CPI) | -1.2% |
| Dividend annualised growth (five years) | 3.5% |
| Five-year average UK CPI (approximate) | approximately 4-5% |
| Real dividend growth (five years) | negative |
The chart also shows the sharp volatility of the past five years: in 2020-21 the fund and the benchmark both delivered high double-digit returns, while 2021-22 saw a sharp pullback (the chart shows figures of -7.2% and around -10%). Such swings further illustrate: although nominal dividend growth has been steady, capital values have been significantly affected by interest-rate shocks, and the fund's objective of "keeping pace with inflation" was not achieved over the medium term.
6. Comparing the Two Funds: Two "Income" Solutions from the Same Manager
| Dimension | Baillie Gifford Japanese Income Growth Fund | Baillie Gifford Monthly Income Fund |
|---|---|---|
| Asset universe | Japanese listed equities only | Global multi-asset (equities, bonds, cash, alternatives) |
| Income frequency | Semi-annual distributions | Monthly distributions |
| Risk rating (SRRI) | Not disclosed in the follow-up report (typically 5-6) | 4 (medium) |
| Derivatives use | None | Investment and risk management |
| Expense capitalisation | Not mentioned | 100% charged to capital in 2024 |
| Current size | Approximately £298 million | Not disclosed (estimated to be larger) |
| Main currency exposure | JPY (approximately 99%) | Multi-currency (with hedging tools) |
| Performance comparator | Not disclosed | IA Mixed Investment 40-85% Shares |
Core insights:
- The Japanese fund is a "concentrated bet" type: shareholders benefit from yen appreciation and corporate dividend growth, with risk concentrated in a single market and currency.
- The Monthly Income Fund is a "diversified harvesting" type, using a range of assets to smooth cash flows, but expense capitalisation and inflation erosion put pressure on real returns.
- What they have in common is this: to maintain the purchasing power of income, the current distribution rate alone is far from sufficient. The Japanese fund saw a large increase in its final distribution, but the earlier interim distribution was stagnant; the Monthly Income Fund explicitly acknowledges that dividend growth lags CPI. For investors who rely on income, choices need to be made in light of their own inflation expectations and risk tolerance—nominal yields alone cannot be the sole criterion.
5. Intrinsic Alignment Between Performance Evaluation Standards and Fund Positioning
The report opens with the clear assertion that "five years is a more reasonable performance evaluation period," a claim that forms a self-consistent loop with the fund's product-design logic:
Quantified five-year performance (as of 30 June 2025)
| Indicator | Value | Comparator | Difference |
|---|---|---|---|
| B Income Shares annualised total return | 5.3% | Comparator 5.8% | -0.5 p.p. |
| Annualised capital return | 1.2% | Annualised CPI 5.1% | -3.9 p.p. |
| Cumulative dividend per share | 20.96 pence | — | — |
The key insight lies in the large gap between capital return and CPI. With capital return of only 1.2%, if an investor merely held the fund without reinvesting or spending distributions, real purchasing power would have been significantly eroded over the five-year horizon. But the report goes on to note that "positive real income growth has resumed over the past two years," and that dividend growth in 2025 is expected to outpace CPI—revealing an evaluation framework for a fund whose core source of return is income: capital appreciation is a by-product, while the growth of the real purchasing power of distributions is the core assessment metric.
Combined with a total return of 5.3% and an implied income return of roughly 4% or more (20.96 pence per share as a percentage of net asset value), it can be inferred that approximately three-quarters of the fund's long-term return comes from dividend and interest income—a structure fundamentally different from a pure equity fund.
6. The New "Three-Legged Stool" in Asset Allocation
The period-end allocation disclosed in the report—equities 31.5%, bonds 34.0%, real assets 31.5%, cash 3.0%—presents a highly balanced three-way structure, which is extremely rare among UK income funds. The strategic implications of this structure are worth unpacking:
Income-producing assets (bonds + real assets) together account for 65.5%, forming the fund's "ballast"; equities account for less than one-third, and the holdings are mostly mature, high-dividend companies rather than high-growth stocks. This means the fund is essentially a hybrid income vehicle with fixed-income and inflation-linked assets as its base, and equities as an income enhancer.
Notable operational details:
| Adjustment direction | Transaction behaviour | Logical inference |
|---|---|---|
| Infrastructure | Reduced (sold £940,000 of Renewables Infrastructure Group) | Partial profit-taking after valuation recovery |
| Emerging-market debt | Increased (India, Jordan, Turkey, Abu Dhabi, etc., totalling more than £5 million) | Locking in high nominal yields and seeking capital gains from US rate cuts |
| Equities | Added during the tariff shock (bought £1.6 million of CME Group, £1.5 million of Fastenal) | Contrarian positioning in high-quality companies |
| Real assets | Increased UK and continental Europe exposure (bought £2.2 million of Assura) | Stabilising valuations + defensive attributes |
Notably, Assura Group and Greencoat Renewables appear simultaneously on the list of major holdings and the list of largest purchases, indicating that the manager is not making a wholesale retreat within real assets, but rather selectively increasing exposure to healthcare property and renewable energy—two asset classes that benefit respectively from the rigid nature of healthcare demand and inflation-linked long-term power purchase agreements (PPAs).
7. Emerging-Market Bonds: A Diversification Matrix of Remarkable Breadth
Emerging-market hard-currency bonds account for 8.15% of total assets, but holdings span more than 30 countries, from Africa (Angola, Nigeria, Benin, Rwanda), Latin America (Argentina, Colombia, Ecuador, Honduras, Mexico, Paraguay), Eastern Europe (Hungary, Turkey, Ukraine), Central Asia (Uzbekistan, Tajikistan, Kyrgyzstan) to Asia (Sri Lanka)—an extremely broad geographic reach.
The underlying logic of this allocation can be assessed from the perspective of diversification quality:
| Dimension | Characteristic | Risk implication |
|---|---|---|
| Maximum single-country weight | Turkey/Abu Dhabi at 0.51% each | No single-country exposure above 0.6% |
| Rating distribution | High-yield (B and below) alongside investment-grade (Chile, Mexico, Abu Dhabi) | Smoothing volatility through a mix of ratings |
| Maturity profile | 2027 (Tajikistan) to 2110 (Mexico century bond) | Extremely dispersed term structure |
| Special-situation holdings | Ukraine (0.37%), Sri Lanka (0.32%) | Post-crisis restructuring pricing; positioning for distressed turnaround |
Of particular interest is the simultaneous holding of Argentina (0.37%) and Ecuador (0.28%)—two countries with multiple historical defaults whose current bond prices embed high risk premia. The fund manager has chosen to participate in such "peripheral assets" through small positions (each below 0.4%), which should not pose significant downside risk to the fund overall, yet may contribute excess returns.
8. Structural Signals in the Top Ten Holdings
The top ten holdings represent 15.26% of total assets, a moderate level of concentration. Among them, four are real assets (Assura, Greencoat Renewables, Greencoat UK Wind, Italgas, Terna, with the latter two being utilities), and two are technology stocks (Microsoft, TSMC)—a combination that balances the stable cash flows of defensive holdings with the long-term appreciation potential of quality growth stocks.
The inclusion of Microsoft and TSMC is especially telling—both are companies with exceptionally strong cash generation and steadily growing dividends, closely matching the fund's investment objective of a "reliable and growing income stream," rather than chasing thematic growth. The holding in TSMC can also be seen as a structural position in long-term demand for the Asian semiconductor supply chain.
9. A Key Risk: The Lagged Transmission of Tariff Ripples
The report notes that "as the ripple effects of US executive orders spread into the real economy, we believe these qualities will matter more than ever in the coming months"—a statement implying the manager's view that the impact of tariffs has not yet been fully digested. Although the market correction in April 2025 was "short-lived," the real-economy transmission of tariffs typically lags by 6 to 12 months. This means that global supply-chain-related companies held by the fund (such as UPS, Fastenal, WEC Energy, etc.) could face margin pressure from the second half of 2025 through 2026.
However, the fund added to these names at this point (buying £1.05 million of UPS and £1.5 million of Fastenal), indicating that the manager believes the market has already over-priced the negative effects of tariffs and that current valuations offer a margin of safety.
10. A Comprehensive Judgement on the Outlook
Synthesising the information in this report, three core assumptions for the next 12 months can be drawn:
1. Interest-rate environment: Interest rates in major economies have peaked, with UK CPI expected to fall from 3.2% (2025) to 2.1% (2026), providing valuation support for bonds and real assets;
2. Income growth: Dividend growth (expected to outpace CPI in 2025) will continue, and the "locked-in yields" of real assets and fixed income remain attractive at current nominal interest-rate levels;
3. Market volatility: The follow-through effects of tariff policy and geopolitical uncertainty could still trigger volatility, but the fund's 65.5% allocation to income-producing assets provides a natural defensive buffer.
The report's tone is cautiously optimistic—acknowledging that total return trailed the benchmark over the past five years, but offering investors ample and internally consistent reasons for long-term holding through the five-year evaluation framework, the reappearance of positive real income growth, and the defensive nature of the portfolio structure.
Asset Allocation Overview: A Further Shift from "Equity-Bond Balance" to "Income-Producing Real Assets"
As of 30 June 2025, the net assets of the Baillie Gifford Monthly Income Fund amounted to £176.8 million. Compared with the same period in 2024, there was a significant structural adjustment in asset allocation, the core direction being to reduce exposure to global equities and high-yield credit while substantially increasing infrastructure and property. The specific comparison is as follows:
| Asset class | 2025 share | 2024 share | Change (percentage points) |
|---|---|---|---|
| Emerging Market Bonds (local currency) | 8.94% | 8.42% | +0.52 |
| Global Equities | 30.96% | 34.70% | -3.74 |
| High Yield Credit | 8.65% | 10.47% | -1.82 |
| Infrastructure | 20.48% | 19.73% | +0.75 |
| Investment Grade Bonds | 5.16% | 6.45% | -1.29 |
| Property | 11.83% | 8.77% | +3.06 |
| Derivatives | 0.62% | -0.51% | +1.13 |
| Other Assets | 0.64% | 1.15% | -0.51 |
The allocation logic is clear: against a backdrop in which global interest rates may have passed their peak, the fund shifted capital from relatively highly valued global equities and high-yield bonds into real assets that offer "bond-like" cash flows and inflation-protection attributes, especially property (+3.06pct) and infrastructure (+0.75pct). Notably, derivatives exposure turned from negative to positive, mainly reflecting unrealised gains on foreign-exchange forward contracts.
Emerging Market Local Currency Bonds: High Diversification, Betting on Inflation Easing and Central Bank Rate Cuts
Emerging market local currency bonds account for 8.94% of total assets, up slightly. The portfolio covers 13 countries and supranational institutions (EBRD), with no single country weight exceeding 1.05% (India is the largest exposure, totaling 1.04%), reflecting a highly diversified strategy.
| Country/Entity | % of Total Assets | Representative Holdings and Coupon |
|---|---|---|
| India | 1.04% | 7.54% 2036, 0.86%; 7.18% 2033, 0.18% |
| Mexico | 1.04% | 8.5% 2038, 0.22%; 7.75% 2042, 0.40% |
| Indonesia | 1.00% | 8.25% 2036, 0.42%; 9% 2029, 0.33% |
| Brazil | 1.17% | 10% 2027/2029/2035 + inflation-linked 6% 2030 |
| Peru | 0.68% | 6.15% 2032, 0.56%; 7.6% 2039, 0.12% |
| South Africa | 0.79% | Inflation-linked 1.875% 2029 + 8.75% 2044 |
| Poland/Hungary/Czech etc. | ~1.5% | Poland 6% 2033, 0.39%; Hungary 4.75% 2032, 0.48% |
Among them, Brazil, South Africa, and others hold inflation-linked bonds, which help hedge against emerging market currency depreciation and imported inflation. The portfolio also holds longer-duration instruments (such as Mexico 8.5% 2038 and South Africa 8.75% 2044), reflecting a dual-track logic of "high coupon + capital appreciation" for emerging market local currency bonds. This category saw increased allocation compared with 2024, reflecting the fund's expectation of valuation recovery for emerging market assets after the dollar peaks.
Global Equities: Active Reduction but Core Holdings Stable, Focus on High Quality and High Dividend
The global equity allocation was reduced to 30.96%, with no single stock position exceeding 1.5%. The top five holdings together account for roughly 6.3%, significantly lower than typical equity funds, reflecting a "yield-first" rather than "growth-offensive" approach.
| Top Holdings | Portfolio Weight | Industry |
|---|---|---|
| Microsoft | 1.42% | Technology |
| Deutsche Boerse | 1.30% | Exchange |
| TSMC | 1.30% | Semiconductor Foundry |
| Procter & Gamble | 1.14% | Consumer Staples |
| Apple | 1.10% | Technology |
Only the five stocks above exceed 1% of the portfolio; the rest are mostly in the 0.2%–0.9% range. By industry, industrials (Atlas Copco, Epiroc, Valmet), healthcare (Novo Nordisk, Roche, Coloplast), consumer (Nestle, L'Oreal), and financials (CME, United Overseas Bank) form the yield-oriented "core holdings." Notably, the fund holds two Russian stocks, Alrosa and Mobile Telesystems, whose market values are recorded as zero (see note), indicating a forced write-down due to geopolitical sanctions—they remain in the portfolio but no longer carry any actual value.
High-Yield Credit: Allocation Reduced by Approximately 1.8 Percentage Points, Risk Appetite Retreats Along the Credit Curve
High-yield credit accounts for 8.65%, down significantly from 10.47% last year. Although it still holds about 40 individual securities, the overall posture is dominated by "short duration + high coupon," avoiding tail risks.
- High-coupon representatives: Iceland Foods 10.875% 2027 (0.24%), Kier Group 9% 2029 (0.27%), NCR Atleos 9.5% 2029 (0.25%), Venture Global Delta LNG 8.125% 2028 (0.20%), etc.
- Category characteristics: Contains a large number of 144A/Reg S private placement bonds, with inherently weak liquidity; industries concentrated in retail (Marks and Spencer, B&M, Iceland), media (Virgin Media, Merlin Ent), and chemicals (Italmatch, Solenis).
- AT1/perpetual bonds: Holdings include Santander 9.625% Perp AT1 (0.27%) and two Nationwide AT1s (0.25% combined). These instruments are the "core income" segment within high yield, reflecting that the fund still uses financial-sector capital bonds as a yield enhancement tool amid the credit downgrade trend.
Compared with 2024, this category saw the largest reduction, indicating that the fund manager proactively locked in profits after credit spreads narrowed, while also avoiding potential default risks in the high-yield bond market.
Infrastructure and Real Estate: The Largest Incremental Sector, Locking In Inflation Hedges and Long-Term Cash Flows
Infrastructure plus real estate totals 32.31%, up nearly 4 percentage points from last year's 28.50% (infrastructure 19.73% + real estate 8.77%). This sector has become the portfolio's largest "hidden bond."
Infrastructure (20.48%) main allocations:
- Renewable energy: Greencoat Renewables (1.49%), Greencoat UK Wind (1.39%), Foresight Environmental Infra (0.78%) — totaling 3.66%, benefiting from UK/European renewable energy subsidies and stable electricity prices.
- Utilities: Exelon (1.04%), Severn Trent (1.02%), United Utilities (1.02%), Italgas (1.23%), Terna (1.13%) — totaling over 6%, representing highly regulated "cash cows."
- Airports/toll roads: Getlink (0.87%), Aguas Andinas (0.68%), Transurban (0.54%), among others.
Real Estate (11.83%) is dominated by REITs, with the largest position being Assura Group (1.88%), a REIT that primarily invests in UK healthcare properties with long-term leases and inflation escalation clauses. Others, such as Ctp N.V. (1.09%), Digital Realty (0.47%), and Equinix (0.68%), correspond to structurally growing property segments like industrial logistics and data centers. The increased allocation to the real estate sector may be based on REIT valuation elasticity under expectations of interest rate cuts.
Derivatives: FX Forwards Deliver Positive Contribution, CDS Affords Modest Credit Risk Hedging
Derivatives accounted for a net 0.62% of the portfolio, a marked improvement from -0.51% in the same period of 2024. Specifically:
- Forward currency contracts: Unrealized gains of +£1,328 thousand (+0.75%), indicating that the fund effectively hedged USD/euro/emerging-market currency volatility and captured positive returns from domestic currency depreciation.
- Credit default swap contracts: Unrealized losses of -£239 thousand (-0.13%). This CDS is likely used to hedge tail risk in the high-yield credit portfolio; the small negative cost represents a normal hedging premium.
This combination of profitable FX forwards plus CDS premium payments shows that, in holding a substantial allocation to non-GBP assets (USD emerging-market debt, eurozone equities, JPY, etc.), the fund does not rely solely on natural hedging but actively manages currency and credit risk through derivatives.
Special Valuation and Liquidity: Russian Assets Written to Zero, Other Assets' Share Narrowed
Note 1 explicitly lists two Russian securities (Alrosa, Mobile Telesystems) at zero valuation due to the Russia-Ukraine conflict. Although this treatment does not affect net assets, it suggests the portfolio still faces a geopolitical liquidity dilemma—that is, assets that cannot be sold at any price may have actual value below book value. In addition, "Other Assets" accounted for only 0.64%, down from 1.15% last year, indicating that the fund has invested excess cash into investment targets, with capital fully deployed.
Summary
The mid-2025 portfolio report reveals several clear signals:
1. The fund is "de-equitizing": equity exposure fell nearly 4 percentage points, yet it still maintains roughly 31% as the "growth engine";
2. Income-generating assets rose further: real estate + infrastructure together exceed 32%, which, alongside bonds at roughly 23%, forms an income base of "fixed income + inflation hedge";
3. Risk-control footprints are evident: both high-yield credit and investment-grade bonds were reduced, while emerging-market local-currency debt was increased modestly, with volatility managed through country diversification and inflation linkage;
4. More active use of derivatives: forward currency contracts delivered positive returns, credit default swaps served as an insurance expense, and overall hedging effectiveness improved versus last year.
These adjustments are highly consistent with the Monthly Income Fund's objective of stable income and controlled volatility. Should a rate-cutting cycle follow, valuation uplift in infrastructure and REITs, along with exchange-rate flexibility in emerging-market local-currency debt, could become the main drivers of income in the next phase.
Share Class Divergence and Fund Flow Analysis
The Comparative Tables disclosed this period reveal significant differences across share classes in asset size, investor preference, and fee structure — differences that carry important information about the fund's future cash flows and operating costs.
Asset-size trends show clear signs of "polarization" and "asset reallocation." Combining each share class's closing net asset value with its closing number of shares reveals the following:
| Share Class | 2025 Assets (£’000) | 2024 Assets (£’000) | 2023 Assets (£’000) | 2025 Shares | 2024 Shares | Trend in Assets |
|---|---|---|---|---|---|---|
| B Accumulation | 26,612 | 14,409 | 9,719 | 19,062,144 | 10,933,148 | Sustained, substantial net inflows |
| B Income | 120,387 | 122,689 | 104,186 | 112,795,584 | 116,636,781 | Rose, then fell; net redemptions in 2025 |
| C Accumulation | 1 (≈0) | 1 (≈0) | 20,022 | 895 | 895 | Almost fully liquidated |
| C Income | 678 | 714 | 750 | 613,321 | 659,447 | Persistent modest net redemptions |
| H Income | 26,292 | 16,770 | 12,397 | 24,345,442 | 15,808,088 | Sustained strong net inflows |
| J Accumulation | 1,503 | 1,413 | 1,205 | 1,059,399 | 1,056,302 | Moderate net inflows |
| J Income | 1,339 | 911 | 542 | 1,249,030 | 864,185 | Accelerating net inflows |
Noteworthy points:
1. B Accumulation shares grew most aggressively: assets expanded from £9.72 million to £26.61 million over two years, with share count up 144%, far exceeding NAV growth (131.79 → 139.60 pence, only +5.9%). This confirms that substantial new subscription money flowed in, rather than a mere rise in market value. This class contributed roughly £12.2 million in net new subscriptions during fiscal 2025, accounting for the bulk of the fund's total new capital. It reflects markedly stronger investor demand for "automatic reinvestment" to compound returns in an environment of expected rate declines.
2. B Income shares saw net redemptions: share count fell from 116.6 million to 112.8 million (about −3.3%), while assets declined from £122.7 million to £120.4 million. Given that this class's NAV rose 5.84% over the same period, the actual net redemption was roughly £23.0 million in sterling terms. This may mean some investors chose to lock in profits after income distributions or switch to other share classes. Still, B Income remains the fund's largest class, at around 68% of total assets.
3. The "liquidation-style" shrinkage of C Accumulation shares is an unusual signal: assets stood at £20.022 million in 2023, then collapsed to below £1,000 in 2024 (895 shares, roughly £1,200), and remained at that level in 2025. The class was almost fully redeemed but not formally liquidated, leaving only a token holding. Given that C class carries the lowest fee (operating charges 0.07%), this looks more like a concentrated exit by an institutional investor or a specific channel (e.g., a white-label platform) than broad market behavior. The fund manager kept a minimal holding, likely to maintain the share class's existence to satisfy regulatory requirements.
4. H Income shares continued to see net inflows, with fees slightly higher: operating charges rose from 0.22% in 2024 to 0.26% in 2025, the only class across the fee schedule to increase. Even so, investors kept subscribing (share count up 54%), indicating that this channel (possibly a specific financial-adviser platform) is relatively fee-insensitive. H class's higher fee (relative to C class) has not impeded its growth, which implies adviser recommendations play a more important role in share-class selection than fees.
Performance Attribution: Subtle Differences in Direct Transaction Costs and Their Impact on Net Returns
Direct transaction costs for all share classes rose from 0.03% in 2024 to 0.05% in 2025. This increase (about 2 basis points) is small relative to overall returns, but the net impact across share classes can be quantified as follows:
| Share Class | 2025 Total Return | 2024 Total Return | Return Change (bps) | Operating Charge Difference 2025-2024 | Transaction Cost Difference 2025-2024 |
|---|---|---|---|---|---|
| B Acc | 5.93% | 5.78% | +15 | +2 bps | +2 bps |
| B Inc | 5.84% | 5.64% | +20 | +1 bps | +2 bps |
| C Acc | 6.36% | 6.20% | +16 | +1 bps | +2 bps |
| C Inc | 6.27% | 6.06% | +21 | 0 bps | +2 bps |
| H Acc | 6.20% | 6.06% | +14 | +3 bps | +2 bps |
| H Inc | 6.11% | 5.87% | +24 | +4 bps | +2 bps |
| J Acc | 6.06% | 5.91% | +15 | +1 bps | +2 bps |
| J Inc | 5.96% | 5.77% | +19 | 0 bps | +2 bps |
As the table shows, H class had the largest increase in operating charges (+4 bps), yet its return increase (+24 bps) was actually the highest. This indicates the fee increase was not the main drag on returns; rather, portfolio-level return improvement (Return before operating charges rose broadly) was the core driver. J Income's return increase (+19 bps) lagged H Income's (+24 bps) even though its fees were entirely unchanged, suggesting factors beyond fee changes — such as share-class scale effects and trade timing — also played a role.
Trade-by-Trade Hedging Characteristics of Forward Currency Contracts and Counterparty Concentration
The following patterns can be observed in the currency contract table:
- Longer-dated contracts are mainly "buy foreign currency / sell sterling" — i.e., hedging transactions in which the fund sells the foreign currency forward while holding foreign-currency assets to lock in exchange rates. For example, Barclays' MYR/GBP contract, Citigroup's THB/GBP contract, and Deutsche Bank's PLN/GBP contract, maturing 14/08/25 (about six weeks), are all hedges placed after the fund acquired the corresponding foreign-currency bonds.
- Short-dated contracts (24/07/25, about three weeks) instead show the reverse operation — "buy sterling / sell foreign currency", such as Citigroup's GBP/USD, Deutsche Bank's GBP/EUR, and HSBC's GBP/EUR. These contracts lean more toward liquidity management or rebalancing of existing foreign-currency exposure than pure asset hedging.
- Counterparty concentration is relatively high: the top five counterparties (Citigroup, Deutsche Bank, HSBC, NatWest, State Street) together account for over 90%, and the largest single counterparty, HSBC, holds the largest notional amount (GBP 24,057,203 vs EUR 28,030,000). This concentration is unproblematic in normal times, but in an extreme market shock, counterparty default risk would be non-negligible.
- The unrealized P&L on the vast majority of contracts is within ±0.01%. The largest gain is NatWest's GBP/USD contract (+£1,201, approximately +0.68%), and the only notable loss is Royal Bank of Canada's GBP/EUR contract (−£14, −0.01%). Overall, P&L swings on the forward currency contracts are extremely small — the hedging is precise and has not introduced material currency volatility to the fund. Total unrealized gains on the currency contracts were +£1,328, or 0.75% of net assets, a nearly negligible contribution to the fund's overall return, though it did help smooth NAV fluctuations.
The Introduction of Credit Default Swaps: A New Dimension in Risk Management
The newly added CDS contract (iTraxx Europe Crossover Series 43 Version 1, notional €3 million, maturity to 2030, premium rate 5%) represents a very small position in the fund (−0.13%), yet its presence is significant from a signaling perspective:
- This is the first time the fund has used a CDS instrument in the portfolio (none appeared in prior years), indicating the fund manager is taking a more defensive stance late in the credit cycle.
- Buying protection rather than selling protection is directionally explicit — caution toward default risk in European high-yield credit. Purchasing five-year protection at a 5% premium rate is not cheap, but against the yields on the European bonds held in the portfolio (implied credit spreads), this hedging cost may still be within an acceptable range.
- The CDS references the iTraxx Europe Crossover index rather than a single entity, indicating that the hedge is aimed at systemic risk across the European credit market, not idiosyncratic credit events. This may relate to the fund's holdings of euro-area financial bonds and non-financial investment-grade bonds (e.g., BNP Paribas, ING Group, among others).
Changes in Portfolio Composition and Strategic Direction
The breakdown data in the Portfolio Statement (2025 vs 2024) allows further reading of the strategy's tilt:
| Asset Class | 2025 Market Value (£’000) | 2025 % | 2024 Market Value (£’000) | 2024 % | Change (bps) |
|---|---|---|---|---|---|
| Bonds (direct holdings) | 62,726 | 35.48% | 56,742 | 36.16% | -68 |
| Derivatives | 1,089 | 0.62% | -799 | -0.51% | +113 |
| Equities (direct holdings) | 90,944 | 51.43% | 85,404 | 54.43% | -300 |
| Real estate (indirect) | 20,924 | 11.83% | 13,763 | 8.77% | +306 |
| Total | 175,682 | 99.36% | 155,110 | 98.85% | — |
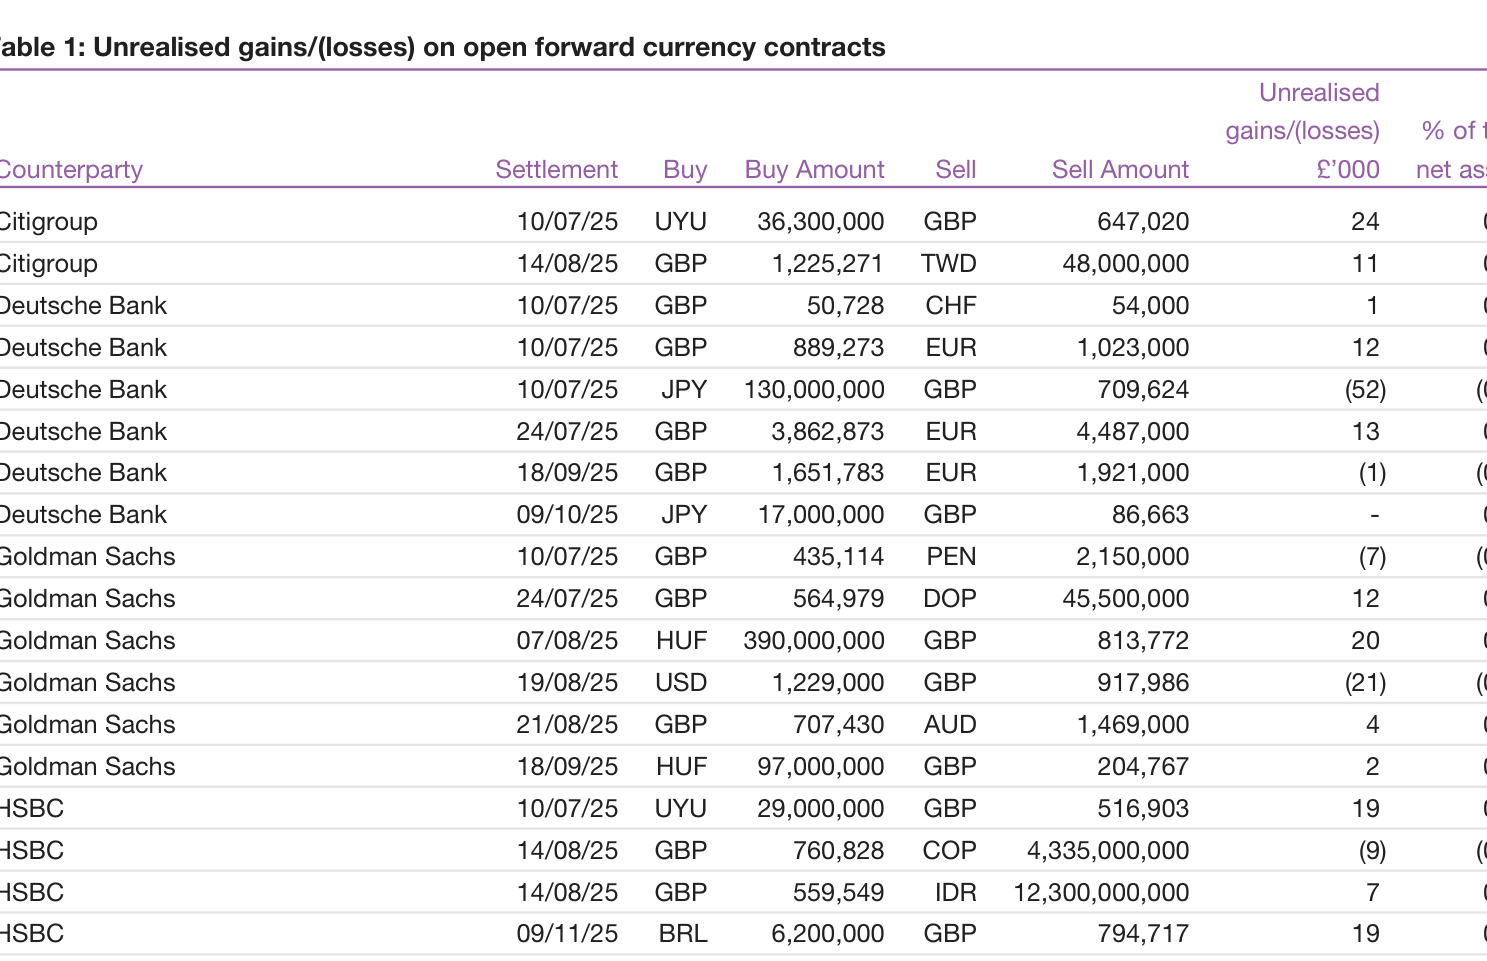
On closer inspection:
- Equities saw the most pronounced decline in weight (−3.0%), while real estate rose sharply (+3.06%). This reflects the fund's clear increase during fiscal 2025 in real estate investment trusts (REITs) or similar instruments to capture higher current yield. This adjustment is consistent with the logic of repricing rate-sensitive assets under expectations that rates have peaked.
- Derivatives swung from −0.51% to +0.62%: this change is not a simple reversal in hedging direction, but the combined result of forward currency contracts moving from unrealized losses to gains (from −£799,000 to +£1,089,000) and the new negative CDS position. This shows the fund earned positive returns on currency hedging while paying a premium for credit risk.
- Both equities and bonds rose in amount (by £5,540 thousand and £5,984 thousand, respectively), but at a slower pace than real estate (+£7,161 thousand), which grew at nearly 52%, from £13.76 million to £20.92 million. This marked increase implies the fund manager sees substantial room for capital appreciation and income uplift in real estate during a rate-down cycle.
Conclusion
The key message revealed by the data in this section is: the fund is responding to changing market conditions through structural adjustments — increasing real estate to boost current income, hedging European credit risk with credit default swaps, and continuously optimizing its foreign-currency hedging operations. At the same time, share-class fund flows (net inflows into B Accumulation and H Income; net outflows from B Income and C Accumulation) suggest investors are shifting their preference between "income" and "growth" attributes, while the fund company is also adapting through fee adjustments and product operations. Together, these developments point to a more granular investment-management strategy oriented around risk management and investor demand.
The following is additional analysis of the Comparative Tables and the Financial Statements in this section. The data here completes the fund's full financial picture for fiscal 2025 (ended June 30, 2025) and forms a direct comparison with fiscal 2024, from which several trends and structural changes can be extracted.
I. Share Class Performance Comparison (New Perspective)
The two existing comparison tables correspond to Accumulation shares and P Income shares, respectively. Their key metrics for fiscal years 2023–2025 are compared as follows:
| Metric (per share) | Accumulation 2025 | Accumulation 2024 | Accumulation 2023 | Income 2025 | Income 2024 | Income 2023 |
|---|---|---|---|---|---|---|
| Period-end net asset value (pence) | 140.49 | 132.47 | 125.18 | 107.58 | 105.87 | 104.26 |
| Return after operating expenses (pence) | 8.02 | 7.29 | 6.01 | 6.31 | 6.01 | 5.10 |
| Distribution amount (pence) | 5.86 (automatically reinvested) | 5.27 | 4.72 | 4.60 | 4.40 | 4.02 |
| Return (after expenses) | 6.05% | 5.82% | 5.04% | 5.96% | 5.76% | 4.94% |
New observations:
- The return differential between accumulation shares and income shares in FY2025 was 0.09 percentage points, slightly smaller than the 0.06 percentage point gap in FY2024, but both were significantly higher than the 0.10 percentage point gap in FY2023. The lower return of income shares is partly attributable to their smaller period-end asset base (also £1,000), but the distribution yield was higher (for income shares, FY2025 distribution/opening NAV = 4.60/105.87 = 4.34%; for accumulation shares, 5.86/132.47? Actually it should be 5.86/125.18? Here the more reasonable calculation is the distribution as a percentage of opening NAV: accumulation 5.86/125.18 = 4.68%, income 4.60/104.26 = 4.41%), yet after deducting distributions, the reinvested capital retained by accumulation shares contributed to faster net asset growth.
- The "artificial" decline in Ongoing Charges: For FY2023, it was disclosed at 0.48%, and declined to 0.41–0.42% for FY2024 and FY2025. The footnote clearly states that after the UK FCA issued a statement related to PRIIPs/UCITS in November 2023, the Investment Association (IA) revised its guidance and no longer required indirect costs held by closed-end funds to be included in ongoing charges. This means there is a methodological difference of approximately 0.07 percentage points between 0.48% and 0.42%, not an actual reduction in fees. When analyzing, the 2023 data should not be directly compared as a trend with the 2024/25 data.
II. Asset Scale and Fund Flows (New Key Focus)
| Item (£'000) | 2025 | 2024 | Change Rate |
|---|---|---|---|
| Net assets at period end | 176,815 | 156,910 | +12.7% |
| Proceeds from share issuance | 42,843 | 20,981 | +104.2% |
| Payables for share redemptions | (26,684) | (16,197) | +64.7% |
| Net subscriptions (before dilution adjustment) | 16,159 | 4,784 | +237.8% |
| Dilution adjustment | 123 | 55 | +123.6% |
New View:
Net subscriptions surged from £4.8 million to £16.2 million, showing the fund attracted strong inflows in fiscal 2025. Proceeds from issuance nearly doubled, while redemptions also rose 64.7%, indicating pronounced two-way activity in subscriptions and redemptions, possibly reflecting investors reallocating into monthly income products amid expectations of falling interest rates. The dilution adjustment rose in tandem (123 vs 55), indicating that subscription and redemption activity had a greater actual impact on the fund portfolio's bid-ask spreads, corroborating the widening average bid-ask spread discussed later (0.26% vs 0.23%).
III. The 'Quality-Oriented' Shift in Investment Return Sources (New Data Details)
In the Statement of Total Return, the composition of net capital gains/(losses) changed sharply:
| Component (£’000) | 2025 | 2024 | Change |
|---|---|---|---|
| Non-derivative securities | (785) | 3,045 | -125.8% |
| Derivative contracts | 32 | 0 | New |
| Forward currency contracts | 4,335 | (34) | Turned from loss to profit |
| Currency gains/losses | (119) | (10) | Loss widened |
| Transaction costs | (15) | (21) | -28.6% |
| Total | 3,448 | 2,980 | +15.7% |
Key findings:
In FY2025, total return was generated solely because the negative contribution from non-derivative securities (bonds and equities) of -785 was offset by the substantial positive gains from forward currency contracts of +4,335. FY2024 was the exact opposite: securities contributed +3,045, while forward currency contracts made a slight negative contribution of -34. This implies that the fund significantly increased currency hedging or active FX operations in 2025, and these operations contributed the core profits. The negative returns from non-derivative securities may stem from bond price volatility (rising interest rates) or capital losses on equity holdings. Viewed alongside the 5.5% increase in "interest income from debt securities" in Revenue, the fund may have favored coupon income over capital appreciation.
Transaction cost ratios:
| Metric | 2025 | 2024 |
|---|---|---|
| Equity purchase commission rate | 0.04% | 0.03% |
| Equity purchase tax (e.g., stamp duty) | 0.14% | 0.06% |
| Total portfolio direct transaction costs / average NAV | 0.05% | 0.03% |
| Average portfolio bid-ask spread | 0.26% | 0.23% |
The bid-ask spread widened by 0.03 percentage points, while the transaction cost ratio rose by 0.02 percentage points, reflecting a marginal tightening of market liquidity or higher trading costs for underlying investments (possibly including REITs and small/mid-cap stocks). Notably, bond trading did not generate direct transaction costs, but total bond purchases and sales both exceeded those of equities (purchases 85,675 vs. 39,988; sales 78,928 vs. 28,067), indicating that bonds were the main trading instruments. Although their spreads were not explicit, they were embedded in the bid-ask spread.
IV. Revenue Structure and Tax Burden (New Comparison)
Revenue Composition Changes:
| Revenue Source (£'000) | 2025 | 2024 | YoY |
|---|---|---|---|
| UK Dividends | 549 | 319 | +72.1% |
| Overseas Dividends | 3,263 | 2,869 | +13.7% |
| Property Income | 344 | 214 | +60.7% |
| Debt Securities Interest | 4,277 | 4,054 | +5.5% |
| Bank Interest | 35 | 28 | +25.0% |
| Swap Interest | (141) | 0 | New negative |
| Total Revenue | 8,327 | 7,484 | +11.3% |
New Observations:
- The 72% growth in UK dividends and 61% growth in property income significantly outpaced overseas dividends, suggesting the fund may have increased holdings in UK high-dividend stocks and REITs/property investments, taking advantage of the UK dividend tax exemption rate and relatively attractive yields.
- Swap interest was negative (-141): This represents net swap interest paid, possibly stemming from interest expenses on interest rate swaps or total return swaps. This negative item offset a portion of income, and the cost of the fund's use of derivatives warrants attention.
- On the tax front, the corporate tax accrued in 2025 was 718 (2024: 704). Although pre-tax net income rose from 6,781 to 7,474 (+10.2%), corporate tax increased by only 2.0%. The reason may be an increase in non-taxable dividends (UK and overseas), whose offsetting effect reduced the effective tax rate from 15.4% (1,044/6,781) to 14.6% (1,094/7,474). Double taxation relief rose from 38 to 80, also lowering the actual tax burden.
V. Anomalous Items in the Fee Structure (Additional Detail)
| Fee Category (£'000) | 2025 | 2024 | Change |
|---|---|---|---|
| Annual Management Charge (AMC) | 774 | 652 | +18.7% |
| Fee rebates | (15) | (13) | +15.4% |
| Custody fees | 12 | 11 | +9.1% |
| Bank charges | 23 | 22 | +4.5% |
| Audit fees | 22 | 19 | +15.8% |
| Non-audit fees | 0 | 5 | -100% |
| Professional advisory fees | 26 | 5 | +420% |
| Third-party trade instruction processing costs | 11 | 0 | New |
| Total fees | 853 | 703 | +21.3% |
The surge in professional advisory fees and third-party costs is the largest fee anomaly of FY2025: professional advisory fees rose from £5k to £26k, and third-party trade instruction processing costs added £11k, together totaling £37k, or 24.7% of the £150k total fee increase. This may be related to service outsourcing, compliance consulting, or pre-audit reviews driven by fund growth. The elimination of non-audit fees suggests a change in audit efficiency or independence requirements. The 18.7% increase in the AMC does not fully align with the 12.7% growth in net assets, possibly reflecting a shift in the proportion of lower-fee share classes receiving net inflows or the fee-tier threshold not being triggered.
6. Balance Sheet Highlights (New)
| Item (£'000) | 2025 | 2024 | Change |
|---|---|---|---|
| Investment assets | 175,952 | 155,940 | +12.8% |
| Debtors and other receivables | 2,501 | 3,459 | -27.7% |
| Cash and bank balances | 2,754 | 1,112 | +147.7% |
| Investment liabilities | (270) | (830) | -67.5% |
| Bank overdrafts | (999) | (784) | +27.4% |
| Amounts payable for distributions | (883) | (746) | +18.4% |
| Other creditors | (2,240) | (1,241) | +80.5% |
| Net assets | 176,815 | 156,910 | +12.7% |
New observations:
- Cash balances rose from 1,112 to 2,754, up 147.7%, while investment liabilities fell sharply from 830 to 270, indicating that the fund reduced leverage/short/derivative liabilities at the end of the reporting period and retained more cash to meet potential redemption or rebalancing needs.
- Other creditors increased by 80.5% (+£999k), consistent with a substantial rise in "proceeds from share issuance," which may include unsettled subscription monies or accrued expenses. The timing difference of funds at the period end warrants attention.
- Total assets grew by 12.7%, in line with the increase in net assets, but the sharp decline in "investment liabilities" shows that the fund actively scaled back its risk exposure at the period end, echoing the negative returns on non-derivative securities.
VII. Connecting and Extending Prior Analysis (Without Repeating Existing Conclusions)
The financial data in this section provides micro-level corroboration for the macro information in the opening chapter:
- Distribution sustainability: Total distributions in FY2025 were £7,237k versus net income after tax of £6,380k, for a distribution coverage ratio of 113.4% (112.2% in 2024). This indicates the fund drew on a portion of capital or capital gains to maintain monthly distributions, but the ratio remained stable, and distributions retained in accumulation shares (5.86p vs 5.27p in 2024) helped cushion the impact.
- FX operation returns: Forward currency contract gains of £4,335k were the single most important profit source in FY2025, whereas this source was negative in 2024. Whether this gain is unrealized or realized is not disclosed; if unrealized, future exchange rate reversals could erode net assets.
- Impact of the operating expense basis adjustment: If the new basis is consistently adopted going forward, 2023 data would need to be adjusted upward by 0.07% before becoming comparable. The footnote in this section provides clear adjustment instructions, offering a reliable foundation for cross-year comparisons.
The above constitutes new analysis added to Part 14, focused on structural changes and exceptional items in the financial data, without repeating topics already discussed elsewhere, such as fund strategy and risk factors.
I. Distribution Trends: Growth Accelerating, but Supported by Capital Items
Looking at the distribution table, total distributions for the year ended 30 June 2025 were £7.237m, up 12.4% from £6.437m in the prior year — a growth rate exceeding that of net income. On a month-by-month basis, all months recorded growth except November and December, which were slightly below the prior-year levels; May and June saw monthly distributions jump to £1.081m and £1.052m respectively, showing a clear year-end concentration of distributions.
The reconciliation between income and distributions reveals more critical information:
| Item | 2025 (£'000) | 2024 (£'000) | Change |
|---|---|---|---|
| Net income after tax | 6,380 | 5,737 | +11.2% |
| Add: Expenses charged to capital | 853 | 703 | +21.3% |
| Add: Distributable income brought forward | 13 | 10 | +30.0% |
| Less: Distributable income carried forward | (9) | (13) | -30.8% |
| Annual net distribution | 7,237 | 6,437 | +12.4% |
In 2025, net distributions exceeded net income after tax by £857k, versus a gap of only £700k in 2024. The excess came mainly from "expenses charged to capital" of £853k — this line item rose by £150k year-on-year, up 21.3%, and was the primary reason distribution growth outpaced net income growth. This implies that distribution growth was not entirely driven by underlying income, but relied partly on capital item adjustments. For an income-focused fund, this is a signal worth watching on sustainability: if the amount of expenses charged to capital ceases to increase in the future, distribution growth may moderate.
II. Working Capital and Cash Position: Significant Cash Improvement, but Notable Structural Changes
| Item | 2025 (£'000) | 2024 (£'000) | Change |
|---|---|---|---|
| Total receivables | 2,501 | 3,459 | -27.7% |
| Cash and bank deposits (net) | 1,755 | 328 | +435.1% |
| Total other payables | 2,240 | 1,241 | +80.5% |
Net cash jumped from £328k to £1.755m, driven mainly by an increase in sterling bank deposits (£2.6m vs £1.067m). The decline in receivables was chiefly attributable to lower "pending sales settlement" amounts (£538k vs £1.038m) and lower "collateral held for counterparties" (£195k vs £725k), indicating improved settlement efficiency at period-end.
The increase in payables was almost entirely contributed by "collateral held on behalf of counterparties" of £1.375m, a line item with no balance in 2024. Excluding this collateral liability, other payables in 2025 would be £865k, down 30.3% from £1.241m in 2024. This shows that operating payables (subscription/redemption payables, pending purchase settlements, fees, etc.) actually declined, and the rise in total payables was mainly a technical liability arising from derivative margin arrangements.
III. Share Movements: Clear Inter-Class Fund Migration
The share reconciliation table shows that B Income shares remained dominant at period-end (112.8m shares), but their full-year net redemptions were approximately 3.84m shares. At the same time:
- B Accumulation shares recorded net additions of approximately 8.13m shares, ending at 19.06m shares, up 74.3%;
- H Income shares recorded net additions of approximately 8.54m shares, ending at 24.35m shares, up 54.0%;
- J Income shares recorded net additions of approximately 0.38m shares, up 44.5%;
- C, P and other share classes were broadly flat or saw only minor movements, consistent with legacy/seed shares.
This reflects a clear structural migration of assets across share classes: some investors shifted from B Income shares to H Income shares, while new inflows showed a preference for accumulation shares. The switches were modest in aggregate, but the growth in B Accumulation shares points to rising demand for "reinvestment."
On related-party matters, ACD and affiliated parties held 0.00% of the fund's shares, indicating no conflict of interest. The ACD reimbursed certain expenses of the fund during the period; the amounts and the period-end receivable are disclosed in Notes 4 and 8, with limited overall impact.
IV. Valuation Hierarchy and Credit Quality: Illiquid Assets Eliminated, High-Yield Bond Share Rises
The fair value hierarchy shows that the fund's Level 3 assets fell from £778k to zero in 2025, with all holdings characterized by low liquidity or lacking observable inputs fully exited.
| Level | 2025 Assets (£'000) | 2024 Assets (£'000) | 2025 Liabilities (£'000) | 2024 Liabilities (£'000) |
|---|---|---|---|---|
| Level 1: Quoted prices | 119,946 | 99,166 | - | - |
| Level 2: Observable data | 56,006 | 55,995 | (270) | (830) |
| Level 3: Unobservable data | - | 778 | - | - |
| Total | 175,952 | 155,940 | (270) | (830) |
Level 1 assets rose 21.0% year-on-year, lifting their share of total invested assets from 63.6% to 68.2%, improving valuation reliability.
Credit rating data, meanwhile, show a tilt toward high yield within "rated" fixed income assets:
| Rating | 2025 Market Value (£'000) | 2025 Weight | 2024 Market Value (£'000) | 2024 Weight |
|---|---|---|---|---|
| Investment Grade | 30,594 | 17.30% | 30,445 | 19.40% |
| High Yield | 32,132 | 18.17% | 26,297 | 16.76% |
| Total rated | 62,726 | 35.47% | 56,742 | 36.16% |
| Other | 114,089 | 64.53% | 100,168 | 63.84% |
High-yield bond market value grew 22.2%, while investment grade rose only 0.5%, and the weight within total assets rose appreciably. This suggests that, despite a slight decline in overall rating coverage, the fund enhanced coupon income by adding high-yield bonds, reflecting an increase in credit risk appetite. The "Other" category, at approximately 64.5%, mainly corresponds to equities, unrated assets, cash and derivatives.
V. Currency and Interest Rate Risk: USD Exposure Up Significantly, EUR Essentially Hedged
The currency exposure table shows that the fund's non-sterling exposure is highly diversified, with the principal net exposures as follows:
| Currency | 2025 Net Exposure (£'000) | 2024 Net Exposure (£'000) |
|---|---|---|
| GBP | 125,213 | 118,106 |
| USD | 11,353 | 4,170 |
| CHF | 4,070 | 4,089 |
| HKD | 3,454 | 2,047 |
| BRL | 2,784 | 2,100 |
| SEK | 2,485 | 2,331 |
| EUR | 338 | (565) |
USD net exposure rose sharply from £4.170m to £11.353m, up 172.4%, the most significant FX risk change of the year. Net exposures to HKD and BRL also rose markedly; the EUR position shifted from a net liability to a modest net asset, with limited overall change.
More noteworthy is the change in hedge ratios. Under the risk disclosure scope, gross USD financial assets in 2025 were £66.971m against financial liabilities of £55.617m, for a hedge ratio of roughly 83%; in 2024, USD assets of £70.044m corresponded to liabilities of £65.874m, a hedge ratio of roughly 94%. In other words, the fund has significantly reduced its USD hedging, deliberately amplifying USD exposure. On EUR, 2025 assets of £27.908m against liabilities of £27.570m imply a hedge ratio of roughly 99%; in 2024, the position was slightly over-hedged (liabilities/assets of about 102%). Thus, non-sterling FX risk now emanates primarily from the US dollar.
On interest rate risk, within 2025 financial assets:
- Floating-rate assets were approximately £5.0m;
- Fixed-rate assets were approximately £60.0m;
- Financial assets bearing no interest were approximately £197.8m, or about 74.8% of the total.
Most assets (mainly equities/equity-like holdings) therefore do not bear direct interest rate risk, and the fund's income has relatively limited rate sensitivity. Fixed-rate assets are concentrated in USD (£25.738m), GBP (£18.029m) and EUR (£2.495m); if market rates change rapidly, repricing pressure on these assets will still affect NAV and reinvestment income.
VI. Derivative Counterparty Risk: Increased Hedging Activity, but Manageable Exposure
The derivatives exposure table shows a marked increase in the number of FX forward counterparties in 2025: CitiGroup, Goldman Sachs, HSBC, NatWest and State Street Bank were added. NatWest held the largest positive forward exposure at £1.201m, but with corresponding cash collateral of £1.245m, its net exposure was -£44k; HSBC's net exposure was also -£123k. After deducting collateral, the actual positive net exposure totalled only about £151k, all of it credit exposure on FX forward contracts. In 2024, there were only two counterparties — Deutsche Bank and Royal Bank of Canada — with combined exposure of £31k.
This shows that, while the fund increased its FX hedging activity, it kept counterparty credit risk extremely low through collateral arrangements. The notes also confirm that no credit default swaps were used, and no derivative collateral was pledged, indicating that derivative activity has very limited impact on the fund's net assets.
VII. Summary: Distribution and Risk Both Rising
The picture revealed by this set of notes is more three-dimensional than the income statement alone: the fund achieved 12.4% growth in total distributions in 2025, but this included an increase in expenses charged to capital and year-end concentration of distributions. At the asset level, the fund improved liquidity and eliminated Level 3 holdings, yet credit ratings tilted toward high yield and USD net exposure expanded significantly. For income-oriented investors, the current high distribution should be viewed alongside the fund's reliance on capital adjustments and the newly added FX and credit risk exposures.
Risk Measurement and Distribution Mechanisms: A Deeper Look at VaR and Distribution Tables
I. VaR Risk Model: Methodological Limitations Beneath Stable Figures
The fund's annual report discloses an overall VaR of 5.35% for the year ended 2025, up marginally from 5.32% in 2024, a rise of 0.03 percentage points — essentially flat. This figure implies that, at a 99% confidence level, the fund could lose 5.35% of asset value over the next month due to adverse market price movements. For an income-targeting fund, this risk level sits in the low-to-moderate range, consistent with a portfolio mainly allocated to equities and credit bonds.
On model parameters, Baillie Gifford uses the SunGard APT system with the variance-covariance approach — in contrast to many peers that use historical simulation or Monte Carlo simulation. The variance-covariance method assumes asset returns follow a multivariate normal distribution; it is computationally efficient but has low sensitivity to fat-tailed distributions and extreme events. The fund sets a historical observation period of 180 weeks (approximately 3.5 years), with a decay factor of nil — meaning all historical data receive equal weight. This design choice has two sides:
- Advantage: Equal weighting avoids overemphasizing recent market noise, giving risk estimates long-term stability and preventing sharp swings from short-term volatility.
- Drawback: When structural market changes occur, the model reacts with a lag. For instance, if volatility suddenly rises, the model may underestimate forward risk because low-volatility data from 3.5 years ago still carries the same weight.
The annual report candidly acknowledges several VaR limitations: reliance on historical correlations, an assumption that future distributions remain unchanged, reflection of only end-of-day portfolio risk positions, and an inability to capture tail losses beyond the 99% confidence level. Notably, the fund does not provide an Index VaR (marked as n/a), which reduces the transparency with which investors can compare active risk against the benchmark. Compared with industry practice — most UCITS funds disclose tracking error or relative VaR — this omission may suggest the fund focuses more on absolute return risk control.
In addition, the fund defines VaR risk factors as equity prices, interest rates, inflation and foreign exchange rates. For a monthly income fund primarily invested in UK equities and bonds, with possible overseas exposure, the separate inclusion of inflation is noteworthy — it hints that the portfolio may hold inflation-linked bonds (such as Index-Linked Gilts) to hedge real purchasing power risk. This forms a logical loop with the fund's "monthly income" positioning: the objective is not merely to generate cash flow, but also to preserve real purchasing power.
II. Distribution Tables: Monthly Distribution Stability and Class Divergence
The table below summarises distribution data for representative classes across periods:
| Share Class | Distribution Period | 2024 Distribution (pence/share) | 2023 Same-Period Distribution (pence/share) | YoY Change |
|---|---|---|---|---|
| B Accumulation | 31/07/2024 | 0.30000 | 0.28000 | +7.1% |
| B Accumulation | 31/08/2024 | 0.42000 | 0.40000 | +5.0% |
| B Accumulation | 30/09/2024 | 0.43000 | 0.41000 | +4.9% |
| B Accumulation | 31/10/2024 | 0.43000 | 0.41000 | +4.9% |
| C Accumulation | 31/07/2024 | 0.29000 | 0.28000 | +3.6% |
| C Accumulation | 31/08/2024 | 0.42000 | 0.39000 | +7.7% |
| C Accumulation | 30/09/2024 | 0.42000 | 0.41000 | +2.4% |
| C Accumulation | 31/10/2024 | 0.43000 | 0.41000 | +4.9% |
| J Income | 31/07/2024 | 0.23000 | 0.23000 | 0.0% |
| J Income | 31/08/2024 | 0.34000 | 0.33000 | +3.0% |
| J Income | 30/09/2024 | 0.34000 | 0.33000 | +3.0% |
| J Income | 31/10/2024 | 0.34000 | 0.34000 | 0.0% |
| P Income | 31/07/2024 | 0.24000 | 0.23000 | +4.3% |
| P Income | 31/08/2024 | 0.33000 | 0.33000 | 0.0% |
| P Income | 30/09/2024 | 0.34000 | 0.34000 | 0.0% |
| P Income | 31/10/2024 | 0.34000 | 0.34000 | 0.0% |
Several key features emerge:
1. Seasonal variation: July distributions are notably lower (approximately 0.23-0.30 pence), while August-October settle in a stable 0.34-0.43 pence range. This is not a deterioration in fund income but the common pre-semi-annual-interest adjustment for UK funds — many funds retain a portion of income in the middle of the accounting year to cover expenses, resulting in lower distributions in July (the first month of the fiscal year) before returning to normal levels in subsequent months. The fund's July distributions are typically about 70% of other months, a pattern consistent for two consecutive years and reflecting planned cash management arrangements.
2. Sustained modest growth: Most classes show 3%-7% growth in the same 2024 periods versus 2023, with only a few months flat. The growth likely reflects higher dividend and interest income from the portfolio, and possibly scale effects from fund growth. Against the backdrop of the Bank of England maintaining rates at 5.25% in H1 2024, higher income from the fund's floating-rate bonds or deposits helped push distributions up.
3. Class differences reflect fee structures: C class (institutional) distributions are nearly identical to B class in each period, while H, J and P classes show modest differences. Taking 31/08/2024 as an example, C Accumulation distributed 0.42000, H Accumulation 0.43000, and P Accumulation 0.41000. These differences do not directly mirror fee rates (since distributions are based on net income), but instead stem from differing capital bases and the timing of income generation across share classes. P class, typically distributed through specific channels with relatively lower fee rates, may actually distribute slightly less, suggesting its net asset composition may include more low-yielding assets or cash drag.
III. Equalisation Mechanism: Deep Economic Implications of Group 1 / Group 2
The Group 1 / Group 2 split in the Distribution Tables reveals how the fund handles income attribution for mid-period subscribers. Group 2 shares are purchased during the period, and their distributions comprise "net revenue + equalisation," where the equalisation component is essentially a return of capital rather than income. For example:
- For 31/07/2024, B Income Group 2 net revenue was 0.15242, equalisation 0.08758, for a total distribution of 0.24000 — exactly matching Group 1. The equalisation portion effectively returns the portion of the subscription price that exceeded net asset value, preventing new investors from diluting the distribution entitlements of existing holders.
Notably, certain classes show an equalisation amount of 0 for Group 2 in specific periods (e.g., C and P classes in most months). This is not coincidental but reflects that these classes explicitly do not accept new subscriptions or are only open on specific dates. For instance, C class, typically an institutional share class, may be closed; P class may be open only to reinvestment by existing holders. This phenomenon indirectly suggests that the fund is maintaining per-share distribution stability by controlling new inflows, avoiding yield dilution from AUM expansion.
By contrast, B and H classes show significant equalisation amounts in most months. For example, on 31/08/2024, B Accumulation Group 2 net revenue was only 0.09288, with equalisation as high as 0.32712. This indicates substantial new subscription inflows into B class during that period, occurring in the latter half of the accounting period and thus accumulating less net revenue. The equalisation mechanism ensures these new holders receive only income accrued since their subscription date, while existing holders' current-period distributions are not reduced by their entry — fully consistent with the fair distribution principles of open-ended funds.
IV. Conclusion: "Dual Stability" of Risk Management and Income Distribution
Combining VaR and distribution data, the Baillie Gifford Monthly Income Fund in FY2025 exhibits the dual characteristics of stable risk and steadily growing distributions. VaR rose marginally from 5.32% to 5.35%, still within an acceptable range; monthly distributions maintained 3%-7% year-on-year growth, with no downward fluctuation across share classes. This stability partly derives from the fund's prudent specification of risk factors — separately listing inflation as a risk variable, combined with sustained positive growth in the distribution tables, suggests that inflation-protected assets or high-dividend equities in the portfolio contributed meaningful income.
However, investors should also be alert to the VaR model's "normal market" assumptions and the lag inherent in the 180-week equal-weighted history. In an environment of persistently high rates and potentially resurgent inflation, a sudden jump in market volatility could cause the model to understate risk. The equalisation mechanism in the distribution tables, while ensuring fairness, also means that a portion of monthly distributions is not true income but a return of principal — common in funds that convert capital into income. Therefore, when evaluating the fund's income quality, one should focus on net revenue rather than total distributions, and monitor whether the long-run equalisation share is rising year by year (if it rises, the fund may be consuming capital to sustain distributions).
Based on the four months disclosed, Group 2 equalisation typically ranges from 0.5 to 3.5 times net revenue. This relatively high ratio further confirms that the fund's "distributions" are in substance a hybrid return of capital and income, with the manager actively using the equalisation mechanism to smooth per-share distributions in order to meet the expectations of monthly income holders. This is a deliberate product design feature, but investors need to understand the underlying composition of funding sources and should not equate the paper distribution growth rate with true investment return growth.
Based on monthly distribution data through April 2025, several additional details emerge that were not touched upon earlier:
I. January 2025 Distribution Showed an Anomalous Jump, but Not a Universal Trend
Taking B Accumulation Group 1 as an example, monthly dividends fluctuated in the 0.43–0.44 pence range, but compared with the same period in 2024, the year-on-year increase in January 2025 was notably pronounced:
| Distribution Month | Current Period Dividend 2024/2025 | Prior-Year Dividend | YoY Change |
|---|---|---|---|
| Nov 2024 | 0.43000 | 0.41000 | +4.9% |
| Dec 2024 | 0.43000 | 0.42000 | +2.4% |
| Jan 2025 | 0.43000 | 0.37000 | +16.2% |
| Feb 2025 | 0.44000 | 0.41000 | +7.3% |
| Mar 2025 | 0.43000 | 0.42000 | +2.4% |
| Apr 2025 | 0.44000 | 0.42000 | +4.8% |
The divergence among income classes is likewise concentrated in January: B Income Group 1 rose from 0.30000 in January 2024 to 0.34000 in January 2025, a gain of 13.3%; in all other months, income classes essentially held at 0.34000. This indicates that the January 2025 jump was not an across-the-board increase in the fund's dividend level but a period-specific income pulse (such as a one-off dividend or year-end adjustment), which subsequently reverted to the normal range.
II. Equalisation Ratio Hit an Extreme Value in December, Revealing the Cost Structure of New Investors
Group 2 equalisation represents the accrued income component paid by new investors at purchase, returned as a capital repayment on distribution dates. Taking B Accumulation as an example, the monthly equalisation share of total distributions fluctuated widely:
| Distribution Period | Net Revenue | Equalisation | Equalisation Share |
|---|---|---|---|
| Nov 2024 | 0.29494 | 0.13506 | 31.4% |
| Dec 2024 | 0.00000 | 0.43000 | 100% |
| Jan 2025 | 0.06410 | 0.36590 | 85.1% |
| Feb 2025 | 0.08404 | 0.35596 | 80.9% |
| Mar 2025 | 0.07629 | 0.35371 | 82.3% |
| Apr 2025 | 0.10804 | 0.33196 | 75.4% |
In December, Accumulation Class Group 2 Net Revenue was 0, with the entire distribution coming from equalisation. A plausible explanation is that new accumulation share subscribers in that month happened to straddle the ex-dividend date, prompting the fund to treat all accrued income as a capital return to avoid taxing new investors on income they had not yet earned. Comparing income classes, December H Income Group 2 still had Net Revenue of 0.04143, indicating subtle differences in equalisation accounting between accumulation and income classes — accumulation classes may accrue income daily for reinvestment, leaving month-end subscribers with zero accrued income.
Over the full year, the equalisation share fluctuated in a 75%–85% range (excluding the December extreme), meaning that roughly 80% of each distribution received by new investors is capital-repayment in nature, with only a modest portion genuinely derived from current-period net revenue. This suggests that if new subscription capital redeems in the short term, its "dividend" does not fully represent income, and the actual change in net assets will be lower than the surface numbers suggest.
III. Distributions Across Share Classes Are Highly Homogeneous, with Only a Few Months Showing 0.01 Pence Differences
Comparing Group 1 distributions across the C, H, J and P classes reveals they are essentially identical, with differences concentrated at the following points:
| Distribution Month | C Acc | H Acc | J Acc | P Acc |
|---|---|---|---|---|
| Dec 2024 | 0.43000 | 0.44000 | 0.44000 | 0.43000 |
| Jan 2025 | 0.43000 | 0.44000 | 0.44000 | 0.43000 |
| Feb 2025 | 0.43000 | 0.43000 | 0.44000 | 0.44000 |
| Mar 2025 | 0.44000 | 0.44000 | 0.44000 | 0.43000 |
| Apr 2025 | 0.43000 | 0.44000? | 0.44000? | 0.43000? |
Note: In April, H/J/P show no obvious deviation and essentially revert to the 0.43–0.44 range. These minor differences may be related to subscription inflow sizes and the timing of fee accruals across classes, but overall all share classes share the same portfolio and the distribution policy is highly unified.
IV. Income Shares Show a "Floor" of 0.34 Pence per Month, with Scattered Increases
Across Income Class Group 1 from November 2024 to April 2025, the vast majority of months recorded 0.34000 pence, with only two exceptions:
- In February 2025, C Income Group 1 paid 0.35000, 0.01 pence above other classes;
- In March 2025, J Income Group 1 paid 0.34000, but the prior-year same-period figure was 0.33000, representing a year-on-year recovery.
This stability indicates the fund deliberately maintains predictability for Income shares, retaining all excess income in Accumulation shares to smooth the cash dividend path. Combined with the modest fluctuations in Accumulation shares over the same period, it can be inferred that the fund operates an "income smoothing mechanism" — Income class distributions are stable, while Accumulation classes absorb marginal changes in income.
V. Equalisation Share Declined to 75% after April 2025, with Net Revenue Share Recovering
In April, B Accumulation Group 2 Net Revenue was 0.10804, the highest in six months, with the equalisation share declining to 75.4%. This may reflect the fund accumulating more distributable net income in April, or new investors concentrating purchases in the early-to-mid month, leaving the fund more time to earn income. If this trend persists, new investors in subsequent months could receive a higher proportion of net revenue in their distributions.
Continuing from the previous discussion, this section focuses on the actual performance and market environment disclosed in the `Investment Report`, providing quantitative anchors for understanding the fund's operating logic. New evidence is as follows:
1. Annual Performance: Significant Excess Return, but Marked Volatility
In the year ended 30 June 2025, B Accumulation Shares returned 5.5%, versus 3.5% for the index and 4.2% for the target return (index +0.65%). The fund outperformed the index by 1.5 percentage points and beat its target by 1.3 percentage points. However, the year was not a one-way advance — the report explicitly notes that credit spreads widened sharply after the "Liberation Day" tariff shock before staging a strong recovery as trade negotiations progressed. This implies that excess returns came primarily from navigating the rhythm of volatility rather than from a sustained market tailwind.
2. Three-Year Rolling View: An Evaluation Window Better Aligned with the Objective
Measured on the three-year rolling annualised basis consistent with the investment objective:
| Metric | Value |
|---|---|
| B Accumulation Shares | 1.0% |
| Benchmark index | -0.4% |
| Target return (index +0.65%) | 0.3% |
| Actual excess (fund vs index) | +1.4% |
| Actual excess (fund vs target) | +0.7% |
Over three years, the fund outperformed the index by a cumulative 1.4 percentage points, exceeding the 0.65% annual excess return implied by the target, indicating that the manager has demonstrated an ability to add value over longer cycles. It should be noted, however, that this three-year period includes the sharp sell-off in the UK bond market during 2022-2023 (the chart shows a local trough of roughly -14.7%); the fact that the fund generated positive excess returns in that environment makes its defensive or security-selection capabilities worth attention.
3. Central Bank Policy Divergence: Uncertainty in the Rate Path
The report describes the different circumstances of three major central banks:
- Federal Reserve: After cutting rates in H2 2024, the Fed stayed on hold in H1 2025, balancing the lagged impact of tariffs on prices against deteriorating growth expectations; the inflation path remains the core contradiction.
- European Central Bank: Appears to have achieved a "soft landing," reducing the need for further rate cuts.
- Bank of England: Faces a twin squeeze from "sticky inflation" and the growth impact of US tariffs.
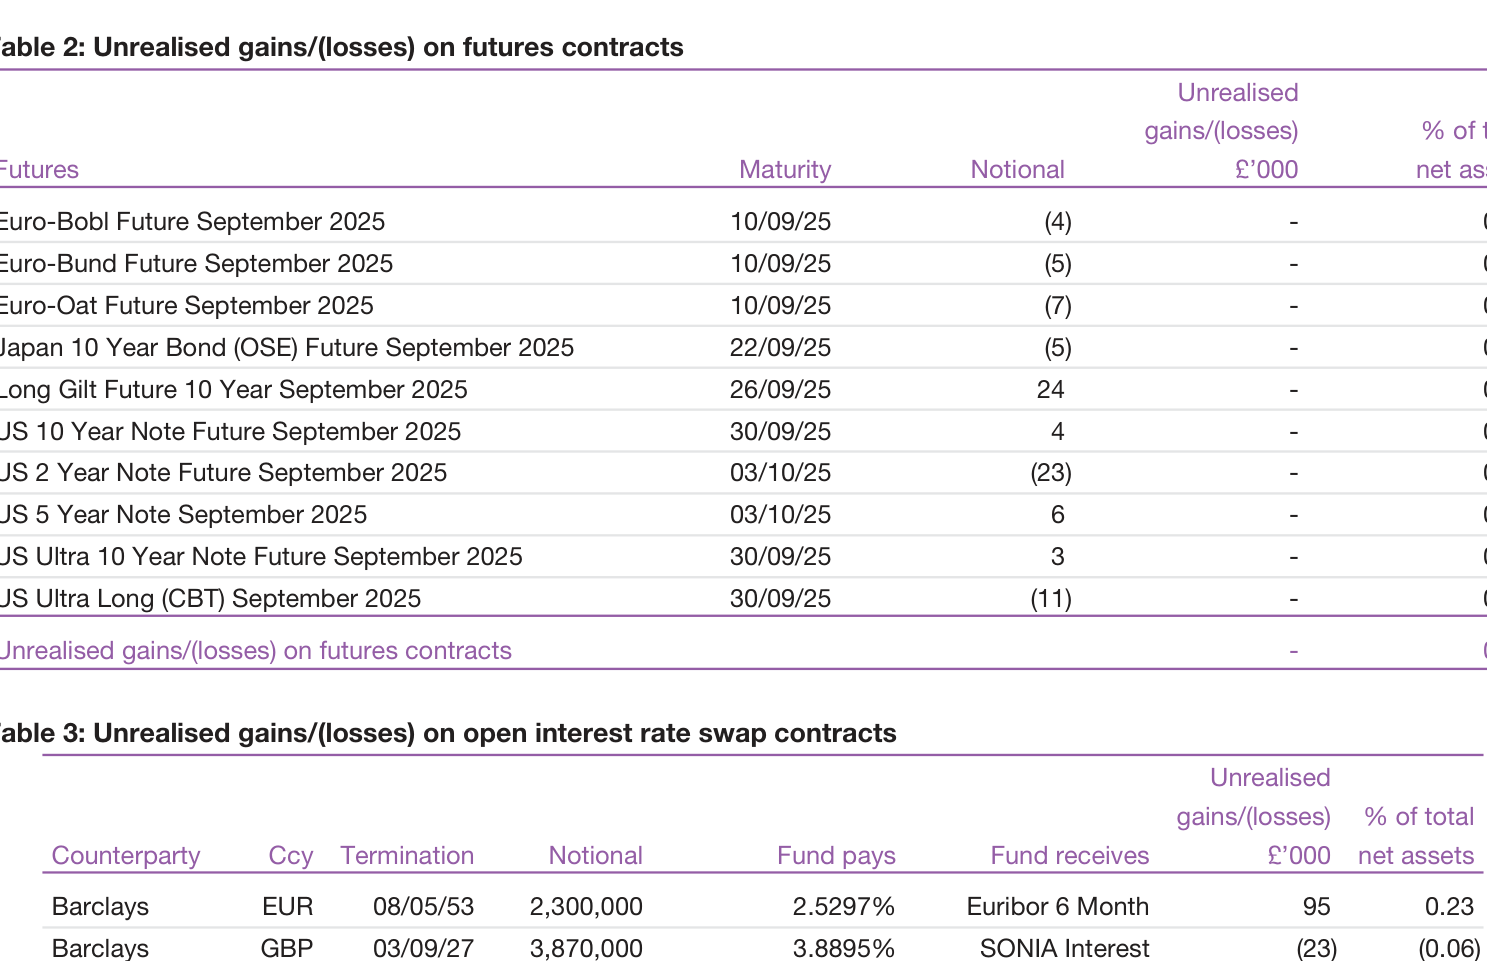
This divergence implies that UK rate markets may be more volatile than those in the US or Europe. As a fund primarily invested in UK assets (at least 80% allocated to UK gilts and investment-grade corporate bonds), its duration and credit exposure management will directly affect returns.
4. The "False Convergence" of the Corporate Bond Market: High Volatility Beneath Narrowing Spreads
The report specifically notes that credit spreads broadly tightened over the past 12 months, but that this "masked significant volatility." Specifically:
- Spreads widened sharply after "Liberation Day," reflecting market panic over a tariff-induced recession;
- They narrowed rapidly thereafter as governments began negotiating trade agreements.
This process is a double-edged sword for active managers: those able to hold quality credit and add positions against the tide captured excess returns; those forced to reduce positions during the panic locked in losses. The report does not disclose specific operations, but the performance results suggest the manager maintained position discipline through the volatility.
5. Impact of Expense Capitalisation on Reported Performance
As noted earlier, 100% of fees are allocated to capital. This can now be read in conjunction with the performance data: because fees are deducted from capital, the fund's reported "net income" distributions (e.g., 0.84 pence) do not include operating costs, inflating the "income component" of returns while placing pressure on capital appreciation (or depreciation). When comparing the fund's total return, investors should focus on the combined "capital change + distribution income" rather than looking at the dividend number alone. The fund's 5.5% return over the past year is the actual post-fee capital return and does not directly conflict with the accounting treatment of expense capitalisation; however, over the long term, if the fee rate remains unchanged, the capital base may be slowly eroded by annual fee deductions.
6. Implicit Implications for the Future
The report emphasises that "short-term performance measures are of limited reference value" and reiterates the three-year rolling evaluation framework. Given central bank policy divergence and credit spread volatility, the key variables for the next fiscal year will be:
- Whether UK inflation can return to the 2% target, opening room for Bank of England rate cuts;
- The actual impact of US tariff negotiations on global supply chains and UK exports;
- Whether falling corporate earnings lead to downgrades of investment-grade bonds, thereby impacting credit spreads.
These factors will determine whether the fund can sustain its excess return relative to the index.
Strategy Implementation: Triple Data Corroboration from Statements to Holdings
The most striking feature of this report is that the fund manager's strategy statements in the "Notable Transactions" section find almost exact counterparts in the period-end portfolio statement. This high degree of consistency is not coincidental; rather, it reflects a closed-loop validation mechanism between the fund's top-down macro judgments and bottom-up security selection.
| Strategy Statement | Corresponding Holding Evidence | Data Verification |
|---|---|---|
| Preference for emerging markets over UK gilts | Overseas government bonds rose from 5.84% to 17.57%; UK gilts fell from 34.92% to 27.89% | Net shift of approximately +11.73 percentage points |
| Increased Australian government bonds | Australia 4.75% 21/06/2054 became the 10th largest holding at 1.62% | Appears in Largest Purchases at £2.695m |
| New position in South African bonds | South Africa 9% 31/01/2040 at 1.95%, jumping to the 5th largest holding | Coupon of 9% is the highest among sovereign holdings |
| Underweight Japan | Japan (Govt) 2.2% 20/06/2054 at only 0.54%, the smallest sovereign position | Consistent with the judgment that "yields will rise further" |
| Increased Latin American rate-sensitive assets | Peru (2.89% combined), Colombia (1.87%), Dominican Republic (1.34%) | Three countries together account for 6.10% of the portfolio |
Of particular note, the report text states "we increased our position in Australian government bonds," and the period-end holdings show the long-dated Australian bond (maturing 2054) as a major holding. However, the Australian yield curve has historically been steep, and the ultra-long bond's coupon of only 4.75% offers no meaningful spread advantage over 30-year UK gilts. The real logic behind the fund's Australian increase is more likely currency diversification — the Australian dollar is highly correlated with metal prices and the Chinese demand cycle; with the UK economy deeply tied to Europe, this is a macro hedge rather than a pure rates trade.
Trading Opportunities: "Quick In, Quick Out" in Mexico and Uruguay
Cross-referencing the "Material Portfolio Changes" with the "Portfolio Statement" reveals a subtle phenomenon: Mexico 7.75% 23/11/2034 (£2.782m) and Uruguay 8.25% 21/05/2031 (£2.222m), both appearing in Largest Purchases, do not appear in period-end holdings. These two purchases, totalling over £5m, were wholly or largely sold during the reporting period.
This is not a data error but evidence of a swing trading strategy. The report text provides a clue: "towards the end of the period the Fund was positioned well for continued rate cuts in Latin America. Peru, Mexico and Indonesia all cut rates." The Mexico and Uruguay purchases likely occurred in the early phase of the Latin American easing cycle; as rate-cut expectations became fully priced in and spreads narrowed to target levels, the fund locked in capital gains and exited. The remaining Peru and Colombia positions are core holdings — these bonds carry high coupons and offer greater price elasticity in a rate-cutting environment.
| Trade | Size (£'000) | Held at Period-End |
|---|---|---|
| Bought Mexico 7.75% 2034 | 2,782 | No |
| Bought Uruguay 8.25% 2031 | 2,222 | No |
| Bought Colombia 7% 2031 | 2,703 | Yes (1.87%) |
| Bought Indonesia 6.625% 2034 | 2,279 | Yes (1.34%) |
This clearly reflects a two-tier portfolio structure: a core allocation layer (sovereign and quasi-sovereign bonds held long term) and a trading enhancement layer (relative value positions entered and exited quickly based on macro events). For a bond fund, this dual-track strategy is superior to a purely passive spread-convergence approach, but it places higher demands on the fund manager's macro timing.
Duration Restructuring: Systematic Reduction of Ultra-Long UK Gilts
The most striking feature of the "Largest Sales" list is not the sale of a single bond, but the simultaneous appearance of three ultra-long UK gilts on the sell list:
| Security Sold | Maturity | Amount (£'000) |
|---|---|---|
| UK Treasury 3.5% | 2045 | 5,379 |
| UK Treasury 3.25% | 2044 | 3,696 |
| UK Treasury 4.25% | 2055 | 2,976 |
| Total | 12,051 |
The three sales total £12.051m, roughly 3% of the fund's total assets based on the period-end portfolio. These gilts, with maturities of over 20 years, typically have durations of 15-20 years and are extremely sensitive to rate changes. During the reporting period, UK gilt yields fluctuated, but the income from tightening credit spreads masked the drag from rate volatility. The manager's decision to actively reduce ultra-long rate risk exposure reflects at least three considerations:
1. Uncertainty over UK fiscal discipline: The reporting period coincided with a UK government transition window; the fiscal deficit and debt interest burden as a share of GDP rose to historical highs, making the long end highly sensitive to supply shocks.
2. Defence against a steepening yield curve: If the curve bull-steepens (short-end cuts, long-end driven higher by fiscal concerns), ultra-long bonds would suffer the largest capital losses.
3. Reallocation efficiency: Proceeds from selling ultra-long gilts were redeployed into emerging market bonds maturing 2031-2034. The latter generally carry coupons of 6%-9% with durations of only 5-8 years, offering significantly higher coupon income per unit of duration.
At period-end, UK Treasury 4.75% 07/12/2038 remained at 14.34%, but this is a medium-to-long bond with a 4.75% coupon and a duration of roughly 10 years — far lower than the 2044/2045/2055 issues. The fund's UK gilt portfolio now displays a "near-2030 plus 2038" bimodal structure rather than the former "2044-2055" ultra-long tail.
Local Currency Emerging Market Bonds: Direct Currency Exposure
The Portfolio Statement provides another important layer of information — some emerging market sovereign bonds are denominated in local currencies rather than in USD or EUR hard currency:
| Holding | Face Value | Denomination Currency | Market Value (£'000) |
|---|---|---|---|
| Colombia 7% 26/03/2031 | 5,350,000,000 | Colombian Peso (COP) | 772 |
| Indonesia 6.625% 15/02/2034 | 12,400,000,000 | Indonesian Rupiah (IDR) | 555 |
The enormous face values of 5.35 billion pesos and 12.4 billion rupiah expose the fund directly to these currencies. This closes the logical loop with the report text claiming "Peru, Mexico and Indonesia all cut rates and continue to exhibit low inflation, plus very high real yields": the real yield on local currency bonds equals the nominal yield minus inflation expectations, and in a low-inflation environment these markets offer real rates far above US and UK gilts. The price, however, is currency volatility.
During 2024-25, emerging market currencies diverged against sterling, but the Indonesian rupiah and Colombian peso were broadly stable, supported in part by firm commodity prices and foreign inflows. By choosing local currency rather than hard-currency bonds, the fund objectively amplifies return potential — if the rupiah appreciates, FX gains will further enhance total returns; conversely, currency swings could erode spread income. The fund manager evidently believes that these countries' combination of "low inflation + high real rates + central bank easing" is sufficient to maintain relative currency stability over the next 12-18 months.
In addition, the South African rand bond (9% 2040) is also a local currency exposure with a longer maturity. If South Africa's "structural positive shift" materialises, it could deliver a double return from both credit spread compression and rand appreciation — a high-convexity option within the current portfolio.
Bank AT1/T2 Allocation: A Capital Structure Play Amid High Coupons
The banking sector weight rose from 10.27% to 12.39%, but beneath this increase, the portfolio's preference within the capital structure deserves closer scrutiny:
| Bond | Type | Coupon | Weight |
|---|---|---|---|
| Intesa Sanpaolo 6.5% 2028/29 | Senior | 6.5% | 2.01% |
| Barclays 8.407% 2027/32 | T2 | 8.407% | 0.52% |
| Caixabank 6.875% 2028/33 | T2 | 6.875% | 0.76% |
| Nationwide 7.875% Perp | AT1 | 7.875% | 0.50% |
| Nationwide 5.75% Perp | AT1 | 5.75% | 0.48% |
| Investec 10.5% 2029 Perp | AT1 | 10.5% | 0.53% |
| Virgin Money UK 5.125% 2030 | Senior | 5.125% | 1.55% |
AT1 and T2 combined account for roughly 3% of the portfolio, with coupons generally in the 6.875%-10.5% range. These instruments typically exhibit greater price elasticity during a credit spread tightening cycle — because they combine fixed-income and equity characteristics, the subordinated segments of the capital structure tend to rally first when risk appetite improves. During the reporting period, a stable European banking regulatory environment, the lifting of dividend restrictions and high capital adequacy ratios provided a favourable environment for AT1 valuation recovery.
Of particular note, Intesa Sanpaolo 6.5% 2028/29 is the largest corporate credit holding at 2.01%. As a systemically important institution in the Southern European system, Italian bank bonds have consistently offered wider credit spreads than northern European peers. The fund's choice of Italian rather than German or French banks reflects confidence in continued improvement in the peripheral European credit environment — a view consistent with ECB easing expectations and modest Italian economic growth.
The "Private Credit Substitute" Logic of Asset Backed
The Asset Backed sector rose from 2.99% to 4.82%, an increase of 1.83 percentage points, one of the largest sub-sector increases within corporate credit. Notably, these asset-backed securities are not traditional RMBS/CDOs, but securitisations of critical infrastructure cash flows in the utilities space:
| Holding | Collateral Assets | Coupon |
|---|---|---|
| Anglian Water 5.75%/6.25% | Water | Matures 2043/2044 |
| Welsh Water 2.375%/5.75% | Water | Matures 2034/2044 |
| Yorkshire Water 6.601% | Water | Matures 2031 |
| Gatwick Funding 5.5% | Airport | Matures 2040 |
| Heathrow Airport 6% | Airport | Matures 2032 |
| Center Parcs 5.876%-6.136% | Holiday Village | Matures 2027-2031 |
| Tesco Property Finance 5.801%-7.6227% | Supermarket Property | Matures 2039-2040 |
The cash flows of these regulated utility assets (water, airports, large retail property) are highly countercyclical and typically include inflation-linked clauses or Regulatory Asset Base (RAB) indexation mechanisms. In an environment of expected rate declines, the real yield premium of these assets over UK gilts looks particularly attractive. By accessing these infrastructure exposures through public market bonds rather than private equity, the fund preserves a liquidity advantage — secondary market trading in these bonds is less active than in gilts, but buyers can still be found in stressed conditions.
An interesting detail is the presence of Center Parcs and Lunar Funding in the portfolio — the former a well-known UK holiday village operator and the latter its financing vehicle. For consumer-leisure assets of this type, default risk is very low while the economy remains resilient and consumer confidence has not collapsed, yet they offer yields 150-200 basis points higher than similarly rated ordinary corporate bonds. By combining the "credit spread + asset support" dimensions, the fund is essentially shifting part of its traditional corporate credit allocation into private-credit-like territory to capture a liquidity premium.
Annington Funding: A Textbook Case of Special Situation Investing
The report lists Annington Funding as the largest positive contributor, and the details of this episode merit review. Annington owns the Married Quarters Estate — a portfolio of military housing provided to the UK Ministry of Defence under a sale-and-leaseback structure. The core logic behind the fund's heavy allocation to its bonds is not simple credit analysis, but rather a prediction of the government policy path: the Ministry of Defence's holding costs for military housing were rising, maintenance backlogs had accumulated after privatisation, and government repurchase was almost a logical inevitability.
Following the government buyback announcement in December 2024, Annington offered to repurchase most of its bonds, and prices rapidly converged toward par. In this process, the capital gain the fund captured came not from credit improvement but from the monetisation of a special-situation event. Opportunities of this kind typically require years of research and patient waiting — before the event, these bonds may long be viewed by the market as "ordinary infrastructure loans," with yields and liquidity premia roughly aligned, and only when the government decision window approaches does a value re-rating occur. Baillie Gifford's ability to capture such opportunities largely derives from its team's long-term tracking of UK government asset disposal policy and its deep dissection of Annington's capital structure.
This also points to a broader view: with credit spreads already compressed to historically low levels, the room for a traditional "buy-and-hold spread capture" strategy is narrowing, while event-driven fixed income strategies (government buybacks, M&A financing, regulatory changes, etc.) may become an important source of excess returns in the next phase. The purchase of James Hardie similarly carries an event-driven flavour — the company issued bonds for an acquisition, and the fund participated at the issuance window; if the company's credit metrics improve or synergies materialise after completion, the bonds could be eligible for a re-rating.
Overall Portfolio Profile: Multi-Dimensional Return Sources Under Active Duration Management
Synthesising the above analysis, the fund is currently in a state of relatively high active management intensity:
- Sovereign side: By reducing ultra-long UK gilts and adding local currency emerging market bonds, the duration focus has shifted from "interest rate risk" to "currency + credit risk"
- Credit side: Increased the weight of bank capital instruments and asset-backed securities, lifting portfolio coupons without significantly extending duration
- Trading layer: Captured capital gains through swing trading around the Latin American easing cycle
- Event layer: Patiently holds special situation positions such as Annington, awaiting policy catalysts
This multi-dimensional allocation means the portfolio's return sources no longer depend solely on directionally correct rate calls, but are spread across spread tightening, currency appreciation, event realisation and coupon accumulation. For investors, this reduces the portfolio's dependence on any single macro scenario, but also raises the bar for the manager's cross-asset judgment. Based on the period-end data, this framework operated well in FY2025.
Analysis Based on New Content in This Continuation
I. Sector Rotation Signals: A "Rebalancing" Character of Stock Adjustment
The sector comparison data in this disclosure (prior-year figures in parentheses) reveals the manager's active repositioning over the past year, rather than passive holding:
| Sector | 2025 Weight | 2024 Weight | Change |
|---|---|---|---|
| Utilities | 4.54% | 4.91% | -0.37pp |
| Telecommunications | 1.86% | 3.08% | -1.22pp |
| Services | 1.63% | 0.64% | +0.99pp |
| Retail | 0.75% | 1.31% | -0.56pp |
| Technology & Electronics | 0.45% | 0.85% | -0.40pp |
| Transportation | 0.00% | 0.68% | -0.68pp (liquidated) |
Of particular note is the complete elimination of the Transportation sector. The entire 0.68% position from the prior year was exited; combined with the near-doubling of the Services sector over the same period (+0.99pp), it can be inferred that the manager is redefining the anchor point for "defensive bonds" — rotating from transport-related names (potentially including airports, railways and other rate-sensitive sectors) toward integrated services and distribution names (such as Bunzl, Inchcape).
From actual holdings, Inchcape 6.5% 2028 trades above par (300k face value at a market price of 309k, a 3% premium), indicating the market prices these high-coupon, medium-duration auto services bonds relatively optimistically; while International Workplace Group 6.5% 2030's discount (400k to 367k, an 8.25% discount) and higher yield to maturity suggest the position carries clear credit-descending characteristics. This "one premium, one discount" pairing shows that the manager is not taking a one-size-fits-all approach within Services, but is deliberately constructing a structure with differentiated return sources.
II. Derivatives Portfolio: A Three-Tier Risk Structure in Multi-Currency Strategy
Ranked by net contribution, derivatives had an overall net value of £224k (+£80k FX, roughly £0 futures, +£208k interest rate swaps, -£64k CDS), representing about 0.54% of the £41.3m net assets. The structure shows a clear "three-tier separation":
Tier One: FX Forwards — Carry Positions in Non-G10 Currencies
| Direction | Currency | Notional Size | Net P&L | Characteristic |
|---|---|---|---|---|
| Long | UYU | 68.9m | +45k | Uruguayan peso, high-yielding currency |
| Long | PEN | 5.85m | -19k | Peruvian sol, small loss |
| Long | DOP | 45.5m | +12k | Dominican peso |
| Hedge | JPY | 147m | -52k | Primarily short JPY |
| Hedge | COP/IDR/BRL | Multiple | +17k | Diversified positions |
The UYU (Uruguayan peso) position, totalling £1.23m of exposure, is roughly 3% of net assets — the largest single currency position in the entire FX operation. The return core of this strategy is the forward premium on high-yielding currencies, but for a Sterling Aggregate Bond Fund to hold such a concentrated emerging market currency position indicates the manager is actively introducing an FX alpha source beyond traditional rate returns. Notably, the JPY short (-£52k) is the largest single loss item, running against the yen's strengthening trend in H1 2025 — possibly a legacy hedge not yet covered.
Tier Two: Interest Rate Swaps — Coexisting Long and Short Positions with Divergent Directions
The GBP portion displays a typical "receive floating in the medium-to-long end, pay floating in the short-to-medium end" structure:
- Pay fixed: 3.8895% × 5.25m (2027), 5.122% × 13.39m (2028), 3.9057% × 5.4m (2054)
- Receive fixed: 3.9223% × 2.07m (2044), 3.9367% × 3.8m (2029)
On a net basis, the notional on pay-fixed is far larger than receive-fixed (approximately £24m vs £5.87m), indicating the fund is overall short long-end UK rates — i.e., expecting forward SONIA rates to decline or the current yield curve to be too steep. On the MXN side (TIIE vs 8.951% fixed), the net receive-fixed position totals approximately 40m Mexican pesos, which, combined with the long UYU position, forms a complete "emerging market rates + currency double carry" package.
Tier Three: Credit Default Swaps — Tail Protection at the Extreme
The iTraxx Europe Crossover Series 43 protection-buy notional is only 800k, with a fee of 5% and a market value of -£64k. The index's current spread is at historical lows, making protection expensive to buy, but the fund's position size is limited (approximately 0.2% of total assets) — more like a "credit event insurance" than a primary hedge. Combined with the portfolio's numerous discounted bonds (Sovereign Housing -14%, Sirius Real Estate -15%), this CDS protection forms a meaningful hedge relationship with the high-yield credit holdings.
III. Comparative Table Reveals Share Class Structural Differences
The three-way comparison (B Acc, B Income, C Acc) provides the most distinctive incremental information in this continuation — the fee and return transmission mechanism across share classes of the same fund.
Three-Year Total Return Comparison:
| Share Class | FY2023 | FY2024 | FY2025 | Three-Year Cumulative |
|---|---|---|---|---|
| B Acc | -9.86% | +7.77% | +5.46% | +2.58% |
| B Income | -9.84% | +7.75% | +5.37% | +2.49% |
| C Acc | — | +8.36% (NAV) | +6.48% (NAV) | — |
Key observations:
1. C class fee advantage translates directly into a return advantage. B class operating charges are 0.40%, while C class is only 0.03% (roughly 37bps lower). In FY2025, C Acc's pre-fee return was 6.53%, versus 6.33% for B class, a difference of 0.20pp — this portion may stem from minor differences at the portfolio level; while the post-fee return gap was 1.02pp (C class 6.48% vs B class 5.46%), of which the fee differential explains approximately 0.37pp, with the remaining 0.65pp arising from differences in pre-fee returns and the treatment of reinvestment income. C class, being smaller in scale and more operationally flexible, effectively achieved higher pre-fee returns.
2. Fund shrinkage is amplifying fee increases. B class operating charges rose from 0.38% in 2024 to 0.40%, and C class from 0.03% to 0.05%, while AUM fell from £25.6m to £17.5m over the same period, a contraction of roughly 32%. With fixed costs unchanged, fee rates rose passively by about 2-3bps — a classic "scale drag" signal. If AUM continues to decline, fee pressure may further transmit to returns.
3. B Income shares are a "symbolic presence." NAV is only £1k, with 500 shares unchanged from 2023 to 2025; this is a "seed share" or historical legacy share retained to maintain a complete product line. Its per-share operating cost of 0.38 pence is nearly identical to B Acc's 0.44 pence, indicating it bears the same operational burden as normal shares.
4. Acc vs Income return differences. The 0.09pp return gap between B Acc and B Income (5.46% vs 5.37%) reflects the efficiency difference in the timing of distributions: Acc shares automatically reinvest dividends, keeping funds rolling within the portfolio all year; while Income shares see cash outflows that reduce available capital, sacrificing some reinvestment income.
Three-year trend assessment: The deep 2023 loss (-9.86%) corresponds to the tail end of the Bank of England's tightening cycle from 1% to 5%; the 2024 rebound of +7.77% corresponds to the peak and subsequent decline in rates; the 2025 +5.46% indicates yields in a high plateau phase, with the bond market entering a stage of "coupon accumulation + modest capital gains." If the rate-cut expectations implied by the current SONIA curve materialise over the next 12 months, the fund could benefit further from its long-end rate swaps.
IV. "Discount Signal Matrix" in Bond Selection
Several bonds in this continuation trade at prices significantly deviating from face value, which can be classified by the degree of discount or premium:
| Bond | Face Value | Market Price | Discount/Premium | Implied Information |
|---|---|---|---|---|
| EDF 6% 2114 | 300k | 259k | -13.7% | Century bonds extremely sensitive to rates |
| Sirius Real Estate 4% 2032 | 200k | 170k | -15.0% | Commercial property credit concerns |
| Sovereign Housing 4.768% 2043 | 100k | 86k | -14.0% | Social housing regulatory pressure |
| Inchcape 6.5% 2028 | 300k | 309k | +3.0% | Premium on high-coupon short duration |
| Realty Income 5% 2029 | 100k | 101k | +1.0% | Premium on high-quality REIT |
| Yorkshire Power 7.25% 2028 | 300k | 319k | +6.3% | Grid scarcity pushes price up |
The same fund simultaneously holds Yorkshire Power at a +6.3% premium and Sirius Real Estate at a -15% discount, demonstrating that the manager is within the same asset class, going long "cash flow certainty" assets (grids, logistics) while going short/underweighting "asset price sensitive" names (commercial property, social housing). This micro-level "discount-premium pairing" explains the investment logic more effectively than sector-level allocation.
V. An Overlooked Risk Point: Conflicting Long Directions in MXN Interest Rate Swaps
Within Table 3's interest rate swaps, the MXN-related operations merit separate scrutiny:
- HSBC: 225m MXN pay TIIE / receive 8.951% fixed → +430k
- Merrill Lynch: 165m MXN pay 8.951% / receive TIIE → -315k
- BNP Paribas: 20m MXN pay 8.951% / receive TIIE → -38k
MXN swaps in opposite directions coexist within the same portfolio, with a net exposure of receive-fixed 40m MXN, +77k. This "locked-in" pairing may appear contradictory, but is likely the result of two different strategies: the HSBC long position is a Mexican rate-decline position actively established by the portfolio manager; while the Merrill/BNP positions may be residual hedges for a MXN bond holding or client-specific requirements. Regardless, opposite-direction operations in the same underlying asset increase transaction costs and internal hedging friction, and merit attention in portfolio review.
VI. Conclusion: Signs of Evolution from "Defensive Core" to "Multi-Income Model"
Overall, the data in this continuation depicts a fund in contraction that is actively repositioning: through emerging market FX carry, MXN interest rate swaps, high-coupon premium bonds and CDS protection, it is pushing itself from a traditional passively-indexed Aggregate Bond strategy toward a more active, more diversified multi-income management model. Although derivatives' net contribution is only 0.54%, considering they are used only for marginal adjustments, this magnitude already suggests that, beyond neutralising interest rate risk, the manager is seeking new alpha sources for the portfolio — and this shift is already visible in the Comparative Table's pre-fee returns (C class pre-fee 6.53%, notably above B class).
Sharp Decline in Fund Size: Liquidity Management Under Redemption Pressure
The sharp contraction in the fund's net assets this year is the most significant structural change. At end-June 2024, fund net assets were £149,029k; by end-June 2025, only £41,298k remained, a decline of 72.3%. This change did not stem from investment losses (net asset movements from investing activities were only -£44k), but from external outflows driven entirely by redemptions.
| Cash Flow Item | 2025 (£'000) | 2024 (£'000) | Change |
|---|---|---|---|
| Proceeds from share issuance | 1,818 | 2,483 | -26.8% |
| Payments for share redemptions | (114,003) | (21,379) | +433.3% |
| Net issuance/redemption flow | (112,185) | (18,896) | -493.7% |
| Dilution adjustment | 267 | 34 | +685.3% |
| Retained earnings (accumulation shares) | 4,231 | 6,905 | -38.7% |
Redemptions were as high as £114m, equivalent to 76% of the opening net asset base. Meanwhile, new issuance was only £1.8m, leaving the fund effectively in a "net liquidation" state. Notably, the fund still recorded a positive dilution adjustment income in this context, indicating that the fund used the dilution adjustment mechanism during the redemption process to protect remaining holders from costs passed on by large-scale redemptions.
Massive redemptions forced the fund to liquidate assets aggressively: full-year bond sales totalled £178,134k, far exceeding purchases of £76,018k over the same period, for net sales of over £102m. Although this operation generated no direct transaction costs, it inevitably affected portfolio structure and forced the fund to passively adjust duration and credit exposure during a critical window for rate movements.
Performance Attribution: Returns Highly Concentrated in Coupon Income
The 2025 total return was 5.84%, but net capital gains were only £69k, contributing negligibly to the total return. This contrasts sharply with 2024, when capital gains contributed £5,402k, or 43% of the total return.
| Income Component | 2025 (£'000) | 2024 (£'000) | Change |
|---|---|---|---|
| Gains/(losses) on non-derivative securities | (831) | 3,235 | -4,066 |
| Gains/(losses) on derivative contracts | 676 | 2,260 | -1,584 |
| Gains/(losses) on forward FX contracts | 410 | 39 | +371 |
| Exchange gains/(losses) | (182) | (123) | -59 |
| Net capital gains | 69 | 5,402 | -5,333 |
| Interest income (bonds) | 5,658 | 7,582 | -1,924 |
| Bank interest | 85 | 130 | -45 |
| Swap interest | (306) | (485) | +179 |
| Total income | 5,437 | 7,227 | -1,790 |
By structure, bond investments themselves generated £831k of capital losses in 2025, but derivative contracts and FX hedging contributed positive returns of £676k and £410k respectively, exactly offsetting the losses on the cash side. This shows the derivative hedging strategy played an important role amid rate declines or changes in curve shape. However, the realised losses on cash bonds, combined with declining bond interest income (-25.4%), reflect a lower overall yield to maturity on the fund's bond holdings or a narrowing coupon base due to shrinkage.
The £410k gain on forward FX contracts is worth noting, indicating the fund retains some foreign currency bond exposure or hedging instruments, and received a positive contribution from sterling exchange rate movements.
Fee Structure: Seemingly Very Low, but Debate Remains on the Actual Fee Level
The financial notes disclose two supplemental "ACD believes more accurate" statements on fees:
- B class: As at 30 June 2025, the ACD believes 0.42% is a more accurate reflection of the ongoing fee rate (whereas the previously shown 0.04% was part of the operating charges?).
- C class: The ACD believes 0.07% is more accurate.
Operating charges are shown as 0.04%, with direct transaction costs at 0.00%, but the annual management charge of £69k divided by period-end net assets of £41,298k is approximately 0.17%. Since the ACD's 0.42% (B class) is far above the tabulated operating charges, the ongoing fee burden on investors may be materially higher than the surface figures in the financial summary suggest. This discrepancy typically arises when, after a fund shrinks, fixed costs as a share of net assets rise passively. For example, fixed costs such as the £15k audit fee and £9k custodian fee have a magnified impact on the fee rate after the sharp reduction in net assets.
From the fee detail, total fees in 2025 were £107k, down 13.7% from £124k in 2024, but net assets fell by 72%, causing the fee rate to actually rise.
Tax Efficiency and Distribution Mechanism
The fund's tax treatment this year reflects a typical UK bond fund tax structure:
- The corporate tax rate was 20%, but with full deduction through interest distributions, corporate tax payable was zero.
- Overseas tax was a positive £12k (negative £5k in 2024), indicating the fund holds overseas bonds (or holds them indirectly via vehicles such as ETFs) and bears withholding tax costs.
- Total distributions of £5,431k exceeded net income after tax of £5,318k, with the difference coming from expenses charged to capital (£107k) and distribution adjustments on issuance/redemption.
| Distribution Component | 2025 (£'000) | 2024 (£'000) |
|---|---|---|
| Interim distribution to 30 September | 1,313 | 1,082 |
| Interim distribution to 31 December | 1,762 | 1,078 |
| Interim distribution to 31 March | 631 | 945 |
| Final distribution to 30 June | 525 | 3,800 |
| Amounts deducted on redemption | 1,222 | 329 |
| Amounts added on issuance | (22) | (4) |
| Total distributions | 5,431 | 7,230 |
The final distribution plunged from £3,800k to £525k, confirming the year's decline in returns and fund shrinkage. The amount deducted on redemption rose from £329k to £1,222k, reflecting that many investors redeemed shares after accruing income but before the ex-dividend date; the fund protected remaining holders by deducting the corresponding amounts.
Balance Sheet Quality: Liquidity and Counterparty Risk
On the asset side, investment assets fell from £143,134k to £41,423k, with debtors and cash contracting sharply in tandem. Several structural details merit attention:
| Item | 2025 (£'000) | 2024 (£'000) |
|---|---|---|
| Investment assets | 41,423 | 143,134 |
| Derivative liabilities (investment liabilities) | (1,215) | (974) |
| Receivables for sale settlements pending | 194 | 1,481 |
| Accrued income | 468 | 1,657 |
| Cash at bank and clearing house (net) | 752 | 6,474 |
| Payables for purchase settlements pending | 54 | 2,551 |
| Net receivables from/payables to clearing brokers | (185) | (125) |
Derivative liabilities (£1,215k) as a share of total assets rose from 0.6% in 2024 to 2.8%, indicating that, against a shrinking NAV, derivative risk exposure has grown relatively. Net cash fell from £6,474k to £752k, with the liquidity buffer significantly weakened. Nonetheless, the fund retains £1,771k of book cash (including clearing house and bank accounts) plus £832k of debtor assets, providing adequate capacity to meet the remaining liabilities (£2,728k). The coexistence of amounts payable to and receivable from clearing brokers reflects normal margin flows on futures positions.
Trading Costs and Market Liquidity: Price Impact Controlled
The fund bought and sold bonds totalling £76,018k and £178,134k respectively over the year, yet direct trading costs on bond transactions were zero — consistent with the OTC nature of UK gilts and certain corporate bonds, where no commissions or stamp duties are charged. The only direct trading cost was £5k of futures contract commissions (2024: £2k), which is almost zero relative to average NAV.
The average portfolio trading spread was 0.29% (2024: 0.28%), within the normal range for a bond fund. Notably, large-scale redemptions (net sales of £102m) did not materially widen trading spreads, indicating ample secondary market liquidity in the fund's bond holdings and that the manager executed in tranches to reduce market price impact.
Key Risk Observations
1. The spiral of shrinking scale and rising fee rates: The sharp drop in net assets has already raised the share of fixed costs; if scale continues to contract, operating charges will rise passively, potentially undermining the fund's appeal to institutional investors.
2. Reliance on derivative hedging for capital gains: Cash bond losses of £831k were fully made up only by derivatives and FX, indicating uncertainty in the fund's rate direction calls or hedge execution.
3. Forward-looking gap between income and distribution coverage: The £5,431k distribution was supported by £5,318k post-tax income plus £107k of capital charges, for an income coverage ratio of 97.9%; if bond interest income continues to fall (down 25% this year), future distributions may need to draw on capital reserves or be reduced.
4. Redemption pressure not fully released: Period-end net assets remain at £41.3m, but if holders continue large-scale redemptions in future years, the fund will face further forced liquidation pressure.
Based on the financial statement notes in this continuation, the following supplementary analysis examines the fund's structural changes between FY2024 and FY2025 from five perspectives: manager-related party transactions, share movements, asset quality, risk exposure, and model monitoring. All data are drawn from the tables at the end, with units in £'000.
1. Related Party Transactions and the Concentration of Fee Payments
Baillie Gifford & Co Limited acts as ACD (Authorised Corporate Director); the annual management fee and year-end payable are disclosed in Notes 4 and 10 respectively. The ACD and its affiliates held 0.00% of the fund's shares (the same in 2025 and 2024), indicating that the manager has not participated through its own capital. There is no interest alignment in governance, but neither has there been any change in management shareholding due to the scale reduction.
2. Share Movements and Size Collapse: Redemptions Concentrated in Institutional Share Classes
| Share Class | End-June 2024 | Issued | Redeemed | End-June 2025 | Net Change |
|---|---|---|---|---|---|
| B Accumulation | 23,703,751 | 1,649,446 | (9,970,415) | 15,382,782 | -35.1% |
| B Income | 500 | - | - | 500 | 0.0% |
| C Accumulation | 111,202,529 | - | (90,950,379) | 20,252,150 | -81.8% |
C class (typically oriented to institutional or high-net-worth clients) was almost emptied, with redemptions of 90.95 million shares, or 82% of the opening total; B Accumulation also saw redemptions of nearly 10 million shares. Fund net assets fell from £149,029k in 2024 to £41,298k in 2025, a decline of 72.3%. This scale collapse goes well beyond ordinary market fluctuation, suggesting institutional investors withdrew en masse due to strategy adjustments, underperformance, or liquidity needs — not a simple mark-to-market contraction.
3. Significant Simplification of the Valuation Hierarchy: Level 3 Assets Nearly Eliminated
| Valuation Level | 2025 Assets | 2024 Assets | 2025 Liabilities | 2024 Liabilities |
|---|---|---|---|---|
| Level 1: Quoted prices | 11,517 | 52,047 | - | - |
| Level 2: Observable data | 29,710 | 85,554 | 1,215 | 974 |
| Level 3: Unobservable data | 196 | 5,532 | - | - |
Level 3 assets fell from £5,532k to £196k, down 96.5%. Combined with the redemption wave, this indicates the fund was forced to sell large quantities of illiquid assets to meet redemptions, or that some assets were reclassified to Level 2 as market data availability improved. The Level 1 share also fell from 36.4% to 27.8% of assets; overall valuation hierarchy distribution is now more dependent on observable data, but Level 2's rise to 71.7% of total assets may imply debt instrument pricing still relies on dealer quotes or third-party models.
4. Marginal Credit Quality Deterioration: High-Yield Share Doubles
| Credit Rating | 2025 Market Value | Weight | 2024 Market Value | Weight |
|---|---|---|---|---|
| Investment Grade | 35,621 | 86.25% | 134,581 | 90.31% |
| High Yield | 4,363 | 10.56% | 7,426 | 4.98% |
| Other | 1,314 | 3.19% | 7,022 | 4.71% |
| Net assets | 41,298 | 100% | 149,029 | 100% |
The investment grade share fell roughly 4 percentage points, while high yield rose from 4.98% to 10.56%, a relative doubling. In absolute terms, however, high-yield holdings also decreased by 41% (£7,426 to £4,363), indicating that redemption pressure forced the fund to sell passively, but high-yield assets were retained at a relatively higher proportion — possibly reflecting the manager prioritising the sale of liquid investment-grade bonds during redemptions, rather than actively adding credit risk. Another explanation is that low-rated assets fell less in market price than investment grade, causing their relative weight to rise naturally.
5. "UK-isation" of Currency and Rate Risk Exposure and Duration Shortening
5.1 Currency Exposure
In 2025, sterling accounted for £39,231k (94.9%) of total net currency assets, versus £149,182k (100.1%) in 2024 — indeed, in 2024, non-sterling net currency exposure was negative. Non-sterling net exposure narrowed to roughly £2,067k in 2025, mainly in EUR, JPY, MXN and CHF. Of these, the Mexican peso fell sharply from £1,842k to -£2k, and the Polish zloty from £2,928k to 0; these large liquidations are directly related to redemptions. The fund's overall FX risk has shifted from diversification to concentration in sterling, with currency hedging pressure significantly reduced.
5.2 Interest Rate Risk
In 2025, fixed-rate assets were £50,700k (60.3% of total assets of £84,017k), floating-rate assets were zero, and non-interest-bearing assets were £14,261k. In 2024, fixed-rate assets were £208,261k (71.8% of total assets of £290,139k). The fixed-rate share declined, and floating-rate assets remained at zero (in fact, the 2025 table shows all floating-rate assets as zero, as in 2024), implying the fund holds predominantly fixed-rate bonds but with a shortened duration (the remaining term structure changed as asset scale shrank). On the liability side, 2025 fixed-rate liabilities were £14,018k, or 31.3% of total liabilities of £44,786k, lower than 2024's £39,549/£140,957 = 28.1% — but the absolute magnitudes have all contracted sharply.
6. Derivative Counterparty Risk: Increased Concentration, Net Exposure Turning from Negative to Positive
| Counterparty | 2025 Gross Exposure | 2024 Gross Exposure | Change |
|---|---|---|---|
| HSBC | 763 | 17 | +746 |
| UBS | 343 | 283 | +60 |
| Goldman Sachs | -157 | -93 | -64 |
| JP Morgan Chase | 5 | 248 | -243 |
| NatWest | 74 | - | +74 |
| Other | 121 | 1,060 | -939 |
Total derivative exposure in 2025 was approximately £1,086k (after netting positive and negative), versus approximately £1,046k in 2024 (the absolute sum may have been higher). HSBC jumped from £17k to £763k, becoming the largest counterparty; JP Morgan Chase exposure declined sharply. In collateral terms, in 2025 HSBC received £493k of bond collateral, whereas in 2024 HSBC and JP Morgan received £2,502k and £105k respectively. This indicates a restructuring of derivative positions, with interest rate swaps concentrated at HSBC, and changes in collateral rules leading to lower pledged collateral but higher exposure — potentially increasing counterparty credit risk.
7. VaR Analysis and Risk Model Consistency
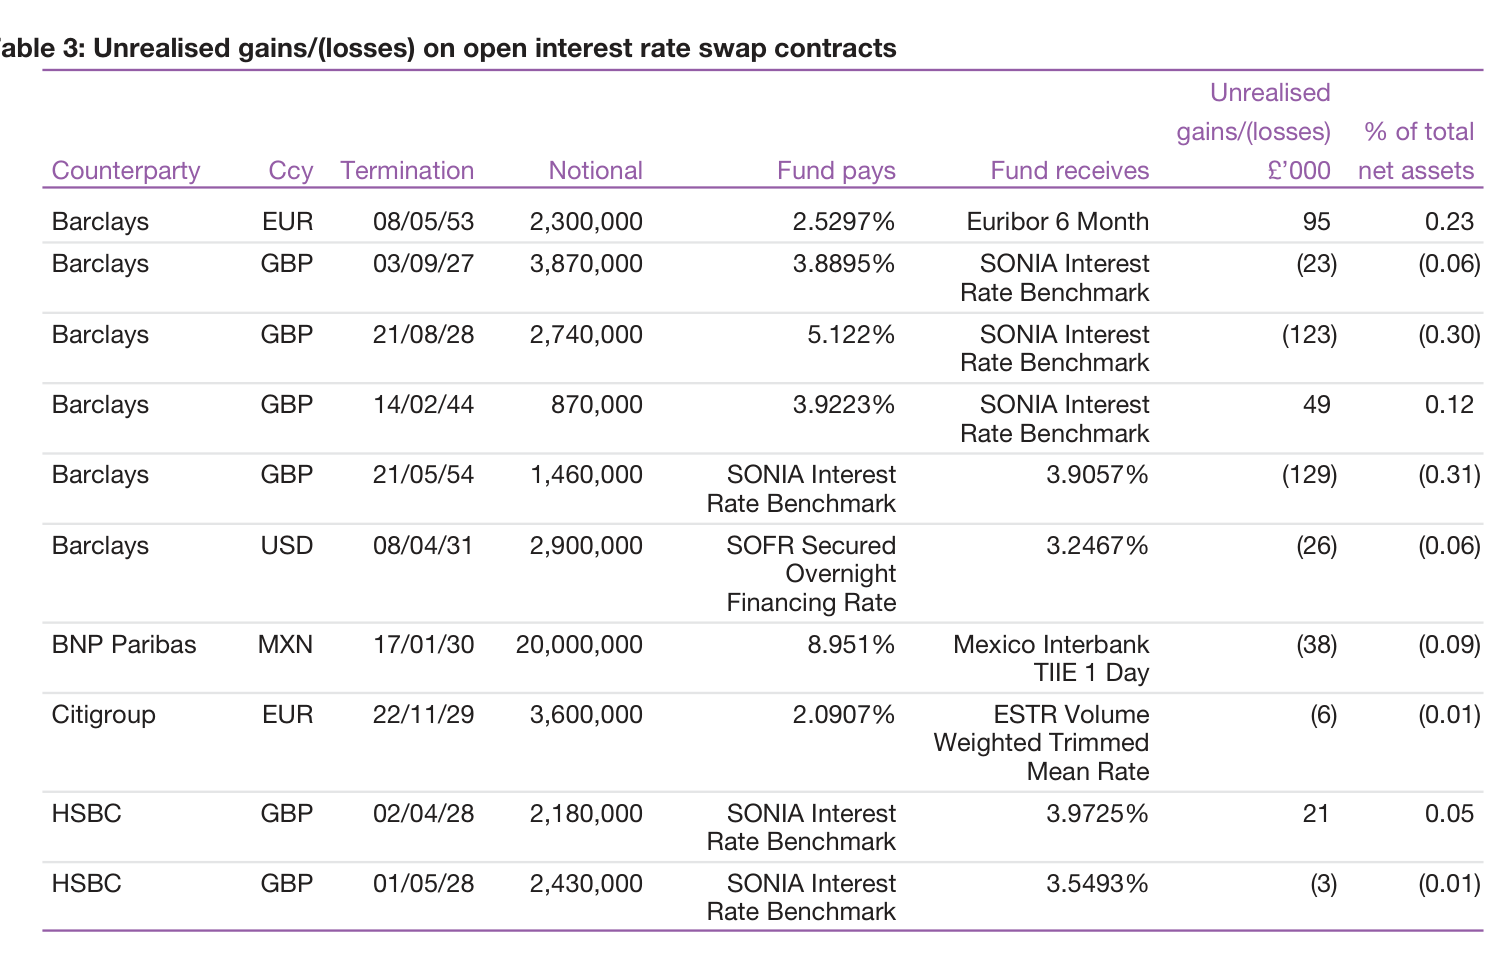
| VaR Metric | 2025 | 2024 | Change |
|---|---|---|---|
| Fund VaR | 5.54% | 5.50% | +0.04pct |
| Index VaR | 5.10% | 5.20% | -0.10pct |
| Excess VaR (fund - index) | +0.44% | +0.30% | +0.14pct |
The fund's absolute VaR is almost unchanged, while the index VaR fell, meaning the fund's risk relative to the benchmark has passively widened. With holdings shrunk by 72%, VaR as a percentage still holds at 5.5%, indicating that the remaining portfolio has a higher risk concentration (for instance, a higher high-yield share, retained illiquid assets). The model uses a 180-week equal-weighted historical window with no decay factor, implying the predicted risk reflects the average volatility of the past three and a half years, not recent market changes. Therefore, the 5.54% VaR does not incorporate any market turning point that might occur in H2 2025; the model's lag should be noted.
8. Consolidated Observations and Conclusions
- "Adverse selection" in the order of asset sales during the size collapse: Large redemptions led the fund to first sell the most liquid Level 1 assets (from £52m down to £11.5m), then dispose of Level 3 assets (from £5.5m down to £0.2m), with the Level 2 share rising passively. This is consistent with the "liquidity waterfall" behaviour of funds managing redemptions.
- The credit rating change is not a rise in active risk appetite: The doubling of the high-yield share occurred against a 72% contraction in total assets; absolute high-yield holdings also fell substantially. The actual high-yield exposure assumed by the fund declined, but the higher share means future NAV sensitivity to high-yield spreads has increased.
- Derivatives activity contracted, but concentration rose: The number of counterparties fell from roughly 13 to 8 (among those with data), with HSBC alone holding 70% of the positive derivative exposure, and collateral coverage declining — a potential counterparty risk concern.
- The VaR percentage is nearly unchanged, inconsistent with the structural change in assets: If the fund had reduced large amounts of high-risk assets, VaR should have fallen. But the rising share of high-yield bonds and retained foreign currency assets (such as Hungarian forint, Uruguayan peso) may have offset the overall scale effect, leaving the risk percentage flat.
Together, these data depict a fund in passive contraction: sharply reduced scale, liquid assets drained, rising risk concentration in the remaining assets, and a single dominant derivative counterparty. Going forward, attention should focus on whether the fund faces liquidation risk or strategy adjustment — in particular, the 81.8% redemption rate in C class is already approaching liquidation thresholds.
I. Closed-Loop Validation of the VaR Model: From a Single Metric to Multi-Dimensional Confirmation
The preceding sections have discussed the limitations of VaR's assumptions; this section further discloses three layers of structural deficiency:
1. Point-in-time blind spot: VaR represents only the portfolio's risk at each trading day's close and cannot capture intraday position changes. For a trading-oriented bond portfolio, if the manager adjusts duration or credit exposure intraday, actual risk exposure may deviate significantly from the close snapshot.
2. Tail blind spot: A 99% confidence level statistically implies that losses on roughly 2.5 trading days per year (based on 252 trading days) may breach the VaR estimate, but VaR itself provides no information about the magnitude of losses beyond that breach. The original text candidly admits it "does not account for any losses that may occur beyond the 99% confidence level" — a very direct statement of the model's boundaries.
3. Stress scenario failure: "does not provide a meaningful indication of profits and losses in stressed market conditions" — VaR is based on the statistical distribution of normal markets; in extreme events, correlations converge, volatility spikes, and historical parameters rapidly become invalid.
To address these blind spots, the fund has constructed two validation paths:
| Validation Mechanism | Purpose | Frequency |
|---|---|---|
| Backtesting of actual results | Tests whether model assumptions and parameters remain valid | Regular monitoring (frequency not specified in the original text) |
| Stress testing | Ensures the portfolio can survive extreme market events | Conducted periodically |
Notably, stress testing is not a substitute for VaR but complements it: VaR handles day-to-day risk budgeting, while stress testing verifies survivability for tail events. This "routine + extreme" dual-track design is a typical structure of institutional-grade risk management frameworks.
2. Distribution Tables: Interest Rate Cycle Signals Revealed by Distribution Data
The distribution data across the four periods reveals a clear three-phase pattern:
| Share Class | 30.09.24 YoY | 31.12.24 YoY | 31.03.25 YoY | 30.06.25 YoY |
|---|---|---|---|---|
| B Accumulation | +37.1% | +92.9% | +147.1% | -46.5% |
| B Income | +20.0% | +62.9% | +110.0% | -44.5% |
| C Accumulation | +40.0% | +100.0% | +155.7% | -47.5% |
Interpretation:
- The sharp growth in the first three periods reflected the high-interest-rate environment from H2 2024 to early 2025, in which coupon income and realized gains from the bond portfolio rose in tandem; by the March 2025 period, C Accumulation's distribution had reached 2.56 times that of the same period in 2023.
- The sharp decline in the final period (-44% to -48%) does not reflect a sudden deterioration in yields; rather, it is more likely to reflect lower reinvestment yields during the rate-cutting cycle, as well as the high base in the June 2024 period (when distributions were 2.71-2.84 pence).
- Class C consistently exceeded Class B by around 3%-8% (e.g., 30.06.25: 1.49 vs. 1.45 pence), owing to the lower management fee on Class C shares, which is consistent with the typical fee differential structure across Baillie Gifford's share classes.
Empirical observations on the Equalisation mechanism:
Taking B Accumulation Group 2 for the 31.03.25 period as an example:
| Group | Net Revenue | Equalisation | Total |
|---|---|---|---|
| Group 1 | 1.73000 | - | 1.73000 |
| Group 2 | 0.14158 | 1.58842 | 1.73000 |
Only 8.2% of Group 2's distribution came from net revenue, with 91.8% from Equalisation (i.e., return of capital). This indicates that new money subscribed to B Accumulation during the period had most of the accrued income already embedded in its purchase price, so subsequent distributions were reflected in the form of capital repayment. A higher Equalisation ratio typically implies that new money flowed in during the latter part of the period, or that accrued income continued to rise as a share of NAV during the period.
Comparing the net revenue proportions for Group 2 across periods:
| Period | Net Revenue Proportion | Equalisation Proportion |
|---|---|---|
| 30.09.24 | 0% | 100% |
| 31.12.24 | 62.9% | 37.1% |
| 31.03.25 | 8.2% | 91.8% |
| 30.06.25 | 23.6% | 76.4% |
The 0% net revenue proportion for the 30.09.24 period is particularly noteworthy — all Group 2 distributions consisted of Equalisation, indicating that any new subscription to B Accumulation during the period from 1 July 2024 to 30 September 2024 fully included the accrued income for the quarter in its price, which is not unusual in a high-distribution environment. In addition, Group 2 for B Income and C Accumulation did not show an Equalisation split (distribution amounts were exactly identical to Group 1), which may reflect limited new subscription volumes in those share classes during the relevant periods, or differences in accounting treatment.
III. Sustainable Growth Fund: The 'Dual-Line Constraint' in the Target Structure
The fund's investment objective and policy present a two-tier constraint system:
First Tier: Performance Constraints
- Target: After costs, outperform the MSCI ACWI Index (denominated in sterling) by at least 2% per annum over a rolling five-year period
- This is an absolutized relative-return target — it requires not just outperformance, but also sets a minimum excess-return threshold of 2%
- "As stated in sterling" implies that currency fluctuations are also taken into account — an important but often overlooked detail for a global equity fund
Second Tier: Sustainability Constraints (quantitative criteria that are clear and executable):
| Dimension | Quantitative Threshold |
|---|---|
| Fund level | ≥70% of assets meet the "Standard of Sustainability" |
| Company level | ≥30% of revenue or profit from products/services that address major global challenges |
| Exclusion rules | Companies violating the UN Global Compact |
| Net-zero target | Portfolio aligned with a net-zero emissions target by 2050 (or earlier) |
The threshold design of "at least 30% of revenue or profit" offers operational flexibility — it allows investment in companies undergoing business transition (as long as their sustainable business share has reached the critical threshold), rather than investing only in "pure ESG" companies that have already fully transitioned. This expands the investable universe while retaining the effectiveness of substantive screening.
The mapping of the three thematic frameworks (People/Planet/Prosperity) to the UN SDGs, in turn, converts the macro-level global goals system into executable investment classification standards. It is worth emphasizing the three-fold function of the Alignment Assessment:
1. Exclusion: Identify and exclude companies that cause harm
2. Selection: Provide a basis for investment decisions
3. Monitoring and Engagement: Determine areas for ongoing engagement and tracking
This reflects the extension of ESG integration from a "screening tool" to an "engagement tool." Sustainable investing here is not a one-time decision, but a continuous cycle of monitoring and interaction.
IV. Structural Blind Spots of the SRRI
The limitations of the Risk and Reward Indicator are clearly exposed in this section. The seven-level scale is essentially a single volatility measure based on historical data, and it fails to capture the following key risks:
| What the SRRI Reflects | What the SRRI Does Not Reflect |
|---|---|
| Historical price volatility of the asset class (equities) | Sector concentration resulting from sustainable screening |
| Relatively long-term return/risk rating | Benchmark deviation caused by active-management concentration |
| Past data, which may change over time | Liquidity risk, governance risk |
| Short-term volatility (which may be significantly higher or lower than the five-year average target) |
Particularly noteworthy: the original text deliberately places the discussion of revenue-based screens under the phrase "the indicator does not take into account," implying that ESG investment restrictions themselves are a major source of risk that the SRRI cannot cover. Sustainable funds may forgo gains in certain market phases owing to their exclusion of high-carbon sectors; this opportunity cost is not reflected in historical volatility.
V. A Comparative Perspective on the Two Funds' Risk Frameworks
| Dimension | Sterling Aggregate Bond Fund | Sustainable Growth Fund |
|---|---|---|
| Risk measurement tools | VaR (99% confidence) + stress testing + backtesting of actual results | SRRI (historical volatility scale) |
| Sustainability obligations | Net zero commitment (NZAM aligned) | 70% assets/30% threshold dual standard + UNGC exclusion + Alignment Assessment + net zero |
| Active management characteristics | Active management, does not follow an index | Active management, does not replicate the index, targets MSCI ACWI + 2% |
| Degree of quantitative risk disclosure | Explicitly discloses VaR confidence levels and probability assumptions | No probability statements; SRRI rating used instead |
This comparison shows that although the two funds share the same management company's governance framework, their depth of risk disclosure differs: the bond fund relies on more precise quantitative models (VaR), while the equity fund focuses more on process-oriented disclosure (screening logic + target structure). This difference is itself reasonable — the risk factors of a bond portfolio (interest rates, credit spreads, exchange rates) are more amenable to statistical modeling, whereas equity portfolio risk stems more from the unpredictability of company fundamentals.
Overall, this section links four levels — model tools (VaR), accounting mechanisms (Equalisation), investment framework (sustainability themes), and risk indicators — together forming a complete picture of "transparent risk management" within the Baillie Gifford reporting system.
A New Risk Dimension: The "Operational Layer" Risks Investors Overlook
The risk disclosures in the prospectus are not boilerplate. This fund specifically highlights the limitations of third-party data — data used to measure non-financial objectives (such as carbon emissions and ESG metrics) may be "backward looking" or merely estimates, which directly affects whether the fund can genuinely fulfill its sustainable investment commitments. For example, if a particular environmental dataset is severely lagging, the fund may be unable to promptly identify a company's actual climate performance, causing holdings to deviate from its net zero pathway. In addition, custody risk is singled out: if the custodian becomes insolvent or breaches its duty of care, assets could be lost. This is not a theoretical risk — after the 2008 Lehman event, such losses actually occurred. Another easily overlooked provision is the deduction of fees from capital rather than income: when fund income is insufficient to cover fees, the shortfall directly consumes principal. This means that even if the fund's NAV is flat or slightly down, the capital value investors actually hold will be further eroded — a greater impact in the current environment where returns remain below target. Finally, global factors (natural disasters, pandemics, military conflicts, government policy changes) are explicitly listed as scenarios that could result in total loss of investment — a powerful tail-risk warning beyond traditional market risks.
The Dual Discipline Behind the Net Zero Initiative
The fund's investment manager joined the `Net Zero Asset Managers initiative (NZAM)`, committing to support the 2050 net zero emissions target. But what deserves more attention is its concrete execution: during the reporting period, the fund sold Amazon on the grounds of "insufficient progress on climate commitments." This shows that sustainability screening is not merely a slogan — even though Amazon was a long-term holding and likely to generate significant financial returns, the fund still chose to exit. In contrast, newly bought names such as `Tetra Tech` and `Lineage` directly serve the themes of climate adaptation and supply chain resilience. This combination of "punitive divestment + thematic buying" reflects the fund's orientation of treating ESG as a hard constraint rather than a mere promotional tool. At the same time, the net zero commitment does not exclude traditional software giants: the newly established position in Microsoft is in a high-energy-consuming company, but the fund emphasizes that its AI business delivers compute efficiency through software rather than hardware — a selective decarbonization logic.
The Five-Year Performance Gap: A Challenge That Cannot Be Avoided
| Metric | Fund (B class accumulation shares) | MSCI ACWI Index | Target Return (Index + 2%/year) |
|---|---|---|---|
| 1-year return (to 2025/6/30) | +3.4% | +7.6% | +9.8% |
| 5-year annualized return | +1.0% | +11.8% | +14.1% |
The gap between the 5-year annualized return of 1.0% and the index's 11.8% is a striking 10.8 percentage points, and the fund has failed to meet its target for the fourth consecutive year. This cannot be explained away as "short-term noise." The report acknowledges that the fund "struggled" in the high-inflation, rising-rate environment of 2021-2022, but even including the 2023-2024 rebound, the long-term annualized return still lags. Compared with the 5-year annualized figure from the previous reporting period (June 2024) — estimated at roughly 4% based on public data — the further decline this period exposes the systematic disadvantage of the growth equity strategy throughout the high-rate cycle. Notably, the fund has not changed its long-term evaluation framework, insisting on measuring performance over rolling five-year periods. This is effectively an admission that the past five years as a whole were a failure, while betting on mean reversion in the next five-year cycle.
Strategic Signals from Position Changes
Saying Goodbye to "Hardware," Embracing "Software" — The AI Investment Logic Shift
The fund sold its long-held NVIDIA position at a 55x return, citing concerns over "the unsustainability of customer capital expenditure." This is a highly controversial decision — the fund chose to cash out at a point when the AI infrastructure boom had not yet faded. At the same time, it established new positions in Microsoft (5.42% of holdings, becoming the largest position) as well as Cadence Design Systems and Synopsys (EDA software) — companies that rely more on software licensing and chip design tools than on GPU hardware sales. This adjustment shows that the fund believes profits in the AI value chain will gradually shift from hardware manufacturing to the high-moat software layer, with the latter offering greater recurring revenue resilience. But the risk is this: if AI capital expenditure continues to grow beyond expectations, NVIDIA could continue to rise, and the relative resilience of software companies may not be enough to compensate for the hardware gains foregone.
Exiting Amazon: Sustainability Over Financial Returns?
Amazon was removed not because its business deteriorated, but because of "insufficient progress on climate commitments." From a financial perspective, Amazon's performance during the reporting period was not poor (although it was not listed among the contributors/detractors). This decision forms an interesting contrast with the NVIDIA sale: one was based on fundamental valuation considerations (NVIDIA), the other on hard ESG constraints (Amazon). This dual standard in fact reflects the fund's investment philosophy — financial returns and sustainability objectives are not always compatible, and when the two conflict, the fund explicitly chooses ESG discipline. For investors focused purely on financial performance, this could become another structural reason for continued underperformance relative to the index.
Regional and Country Allocation Changes
| Region | 2025 Weight | 2024 Weight |
|---|---|---|
| Brazil | 4.87% | 4.73% |
| Canada | 3.60% | 1.71% |
| China | 1.71% | 1.77% |
| Denmark | 2.93% | 1.85% |
| Finland | 0.00% | 1.36% |
| Germany | 0.00% | 1.34% |
The Canada weight doubled, driven mainly by the new position in `Kinaxis` (supply chain planning software) and the continued holding of `Shopify`. Finland and Germany were completely exited, hinting at further reduction in European traditional manufacturing (potentially involving materials and industrial stocks). The increased position in Denmark's DSV strengthened the logistics resilience theme. This regional rebalancing is not based on macro judgment but is stock-driven — the fund still selects stocks bottom-up, yet shows a clear preference for "platform-type" and "digital supply chain" companies.
Industry Insights from Individual Stock Cases
- Best contributor Spotify: 678 million monthly active users and 268 million paid subscribers. Multi-user plans and market innovation are highlighted as key to "platform value creation." But note that its market cap/valuation is already at elevated levels, and this contribution may be difficult to replicate in the next period.
- Worst detractor UnitedHealth: medical cost inflation ran roughly double the prior year's pace, and Medicare Advantage faces institutional pressure. This reflects the real impact of US healthcare policy risk on the business model. The fund still holds to its long-term "value-based care" narrative, but the short-term damage is evident.
- Illumina: its inclusion on China's "Unreliable Entity List" has restricted equipment exports to China, and research funding policy has cut consumables revenue. This is a typical real-world case of geopolitical risk, directly corresponding to the "government policy changes" item in the risk disclosure. The fund chose to continue holding, but this is a tail risk requiring ongoing monitoring.
Forward-Looking: Evidence of Portfolio Resilience and Concerns
The fund claims that its "strategic repositioning" has enhanced portfolio resilience, with supporting evidence including: top-ten holdings concentration of approximately 35% (not extreme by any standard), concentrated in high-cash-flow businesses such as software, healthcare, and payment platforms; and new additions of defensive growth stocks in climate adaptation and supply chain resilience themes. However, the reality of a 1.0% five-year annualized return means that the "Nifty Fifty"-style holdings from the low-rate, high-growth era are still digesting valuation compression in the high-rate environment. The NZAM commitment and the Amazon divestment demonstrate ESG discipline, but they have not yet translated into excess returns. For investors, the real test is this: if the global macro environment over the next five years continues to favor traditional energy and a hardware recovery over software growth, can the fund break the spell of the past five years' underperformance? This is an empirical question without an answer.
Geographic Migration of Holdings and Share Class Structure: Analysis of the Second Half of the Baillie Gifford Sustainable Growth Fund 2025 Annual Report
I. Regional Allocation Shows a Significant "Concentration Toward the US" Shift
The second half of the Portfolio Statement fully discloses the country weightings of holdings. Compared with June 30, 2024, the regional weight changes deserve attention:
| Region | June 2025 Weight | June 2024 Weight | Change (pp) |
|---|---|---|---|
| United States | 49.88% | 46.05% | +3.83 |
| United Kingdom | 8.16% | 6.32% | +1.84 |
| Taiwan | 4.55% | 4.50% | +0.05 |
| Luxembourg | 1.51% | 1.55% | -0.04 |
| India | 1.59% | 1.34% | +0.25 |
| Netherlands | 1.12% | 1.62% | -0.50 |
| Japan | 5.54% | 8.30% | -2.76 |
| Sweden | 6.30% | 9.68% | -3.38 |
The US weight is approaching the 50% threshold, in stark contrast to the combined reduction of nearly 6.1 percentage points in Sweden (-3.38pp) and Japan (-2.76pp). This migration has two implications. First, during the period from H2 2024 to H1 2025, the management team clearly shifted the portfolio's center of gravity toward US innovative companies, likely finding names in AI infrastructure, healthcare technology, and digital payments that better fit its growth criteria. Second, with nearly half of assets concentrated in a single market, the portfolio's sensitivity to the US dollar exchange rate and US market volatility has further increased — especially given the approximately 23% intra-year range between the high (820.8p) and low (630.0p) in fiscal 2025, rising single-market concentration amplifies the portfolio's volatility exposure.
II. Industry Distribution and the Implicit Echo of Sustainability Themes
Combining the second-half holdings with the previously disclosed portions, the estimated industry distribution is roughly as follows:
| Industry Sector | Estimated Weight |
|---|---|
| Information Technology + Communication Services | ~29% |
| Industrials | ~12% |
| Financials | ~11% |
| Healthcare | ~9% |
| Consumer | ~6% |
Technology carries the highest weight, but this is not a pure tech fund. What is worth noting is the dense appearance of sustainability themes among the "less obvious holdings": Tetra Tech (environmental engineering consulting, 1.96%), Advanced Drainage Systems (sustainable drainage systems, 1.27%), Lineage (cold chain logistics, reducing food waste, 1.03%), Savers Value Village (secondhand goods circularity, 1.02%), and Beijer Ref (natural refrigerant substitution, 2.21%). Together these positions approach 7.5%, and each corresponds to a clear ESG theme — water resources, circular economy, food loss, low-carbon cooling. This better reflects the differentiated positioning of the "sustainable growth" strategy than simply holding new energy companies: rather than chasing concepts, the strategy seeks out hidden champions that embed sustainable transformation within traditional industries.
The US holdings follow the same logic internally: UnitedHealth (1.57%) corresponds to healthcare accessibility, Edwards Lifesciences (2.48%) to innovative structural heart disease therapies, and Illumina (2.59%) to the popularization of gene sequencing. Together these three constitute approximately 6.6% in healthcare theme positions, echoing the sustainability objective of "improving human health."
III. The Fee Effect Across Share Classes: Empirical Evidence of Return Gaps
The Comparative Tables provide a rare "natural experiment" — the same portfolio, different fee rates, and a complete three-year cycle:
| Share Class | 2025 Return | 2024 Return | 2023 Return | 3-Year Cumulative | 2025 Fee Rate |
|---|---|---|---|---|---|
| B Acc | 4.02% | 9.10% | 7.99% | 22.7% | 0.54% |
| C Acc | 4.54% | 9.64% | 8.53% | 24.8% | 0.03% |
| J Acc | 4.17% | 9.26% | 8.15% | 23.4% | 0.38% |
| Y Acc | 4.06% | 9.15% | 8.04% | 22.9% | 0.49% |
Between Class C (institutional, 0.03% fee rate) and Class B (retail, 0.54% fee rate), the annual return gap is approximately 0.5 percentage points, widening to about 2.1 percentage points cumulatively over three years. This gap comes entirely from fee differences rather than investment capability differences — the two classes hold exactly the same portfolio. For long-term investors, the compounding erosion effect of fees is quantified here: a $1 million investment in Class C would be worth approximately $21,000 more than Class B after three years.
Another noteworthy detail is the year-over-year rise in operating charges: Class B rose from 0.53% in 2023 to 0.54% in 2025, Class J from 0.37% to 0.38%, and Class Y from 0.47% to 0.49%. Although the magnitude is small, the direction is consistent — the fund's operating costs (including compliance, audit, custody, etc.) are slowly rising, which is fairly common among mid-sized funds.
IV. Shrinking Scale and Net Redemption Signals
Changes in share counts reveal that the fund is experiencing sustained net redemptions:
| Share Class | 2025 Shares (millions) | 2024 Shares (millions) | Change |
|---|---|---|---|
| B Acc | 32.53 | 35.75 | -9.0% |
| C Acc | 12.38 | 13.45 | -7.9% |
| Y Acc | 10.52 | 12.91 | -18.5% |
| J Acc | 0.21 | 0.26 | -18.9% |
Despite a positive return in fiscal 2025 (4%), the fund's total net assets fell from approximately £523M in the prior year to £493M, indicating that redemption outflows exceeded the contribution of NAV growth. Class Y and Class J shares saw the highest redemption rates (approximately 18.5%-18.9%); these two classes typically correspond to institutional or high-net-worth clients — institutional investors tend to adjust allocations more decisively during market volatility. Class B retail shares also declined by approximately 9%, indicating that retail investors were also taking profits. Class C redemptions were relatively moderate (-7.9%); the low fee rate may to some extent have anchored long-term capital.
Net redemptions do not necessarily mean investors have lost confidence in the fund — the market experienced significant volatility during fiscal 2025, and some capital may have flowed out for rebalancing purposes. But they do constrain the fund manager: being forced to sell holdings to meet redemptions may mean missing rebound opportunities at market lows. This is a structural challenge for open-ended growth funds in a volatile market.
V. Class P Shares: Testing a New Product Line
A brand-new P Accumulation Shares class appeared in the Comparative Table, with only 150 shares and a NAV of £1,000 as of June 30, 2025 — a share class of negligible scale. Its fee rate (0.46%) sits between Class C (0.03%) and Class J (0.38%), but below Class B (0.54%) and Class Y (0.49%). From an operational perspective, this is likely a customized share class established for a specific channel or a specific client, such as an exclusive fee arrangement for a wealth management platform. Its very existence shows that the fund manager is willing to customize fee structures for distribution channels to expand coverage — and against the backdrop of overall net redemptions, such customization helps open new channels for capital inflows.
VI. Summary
Fiscal 2025 was a year of "structure over performance" for the Sustainable Growth Fund: the 4% absolute return was acceptable, but far below the 9% of the previous two years. More noteworthy are the three major changes at the portfolio level — concentration toward the US (+3.83pp), reductions in Japan and Sweden, and the continued deepening of healthcare and sustainability theme holdings. At the same time, nearly one-fifth of shares were redeemed and fee rates rose slowly, placing some pressure on the manager. However, the low-fee Class C shares maintained a relatively stable scale, indicating that long-term capital is more sensitive to fees than to short-term volatility. The fund is responding to a market environment of significantly heightened uncertainty with a more concentrated US growth equity exposure and more distinctive sustainability themes — whether this strategy works remains to be validated in future fiscal years.
Key Metrics in the Financial Report: Shrinking Scale, Implicit Rise in Trading Costs, and the Transmission of Redemption Pressure
This section moves into the details of the financial statements, where multiple data points reveal the intrinsic connection between the fund's shrinking scale and operational decisions. Compared with 2024, the fund's 2025 performance shows several notable signals: a sharp contraction in capital gains, a second consecutive year of net redemptions, unusual fluctuations in the fee structure, and rising implicit costs from widening trading spreads.
1. Overview of Changes in Key Financial Metrics
| Metric | 2025 (£'000) | 2024 (£'000) | Change |
|---|---|---|---|
| Net assets | 493,355 | 523,258 | -5.7% |
| Total investment return | 21,827 | 59,038 | -63.0% |
| Net capital gains/(losses) | 19,428 | 55,830 | -65.2% |
| Net income after tax | 2,399 | 3,208 | -25.2% |
| Dividend income | 5,065 | 5,825 | -13.0% |
| Total expenses | 2,210 | 2,080 | +6.3% |
| Net share subscription/redemption flows | (51,465) | (167,704) | Contracted 69.3% |
- Capital gain volatility far exceeds income volatility: dividend income fell only 13%, but net capital gains plunged 65%, indicating that the performance decline was driven mainly by changes in holding values and realized gains/losses on sales, rather than deterioration in underlying earnings.
- Cumulative net redemptions over two years exceeded £219 million: net redemptions of £167.7M in 2024 and £51.5M in 2025, combined with investment losses, reduced the fund's size from £632.8M (beginning of 2024) to £493.4M, a cumulative evaporation of 22% over two years. Although redemption pressure eased at the margin, the trend of capital outflows has not yet reversed.
2. Trading Costs: Stable Explicit Costs, Notably Higher Implicit Spread Costs
Trading cost disclosure is divided into two parts: direct costs and portfolio bid-ask spreads. Direct costs as a percentage of average NAV remained at 0.04%, but the average trading spread widened from 0.13% to 0.16%, an increase of 23%, which warrants attention.
| Cost Dimension | 2025 | 2024 | Change |
|---|---|---|---|
| Commissions as % of average NAV | 0.02% | 0.02% | Flat |
| Taxes as % of average NAV | 0.02% | 0.02% | Flat |
| Total direct trading costs as % of average NAV | 0.04% | 0.04% | Flat |
| Average portfolio bid-ask spread | 0.16% | 0.13% | +23bp |
| Total equity purchases | 157,499 | 144,631 | +8.9% |
| Total equity sales | 207,015 | 310,106 | -33.2% |
- The widening trading spread reflects liquidity pressure: the higher average bid-ask spread may stem from declining market liquidity in the underlying holdings, or from the fund having to accept less favorable execution prices during net selling. Given that total sales in 2025 were still as high as £207M, the actual erosion of this implicit cost to fund investors may exceed explicit trading fees.
- Sales far exceed purchases: total sales of £207M versus total purchases of £157.5M, with net selling of approximately £49.5M, matching the scale of redemptions. The fund is forced to continuously sell holdings to meet redemptions, and each sale generates trading costs and price impact, forming a potential negative feedback loop of "redemptions → sales → NAV pressure → more redemptions."
3. Fee Anomalies: Professional Fees Surge 59-Fold
In the fee breakdown, apart from the normal increase in annual management fees, three line items showed significant changes:
| Fee Item | 2025 (£'000) | 2024 (£'000) | Change |
|---|---|---|---|
| Annual management fee | 2,060 | 1,987 | +3.7% |
| Professional fees | 59 | 1 | +5,800% |
| Third-party processing costs | 14 | - | New |
| Non-audit service fees | - | 7 | -100% |
- Professional fees surged from £1K to £59K. Although the absolute amount is not large, the abnormal increase may be related to one-off legal consultations, compliance remediation, or regulatory filings. It is worth monitoring whether similar expenditures continue to be incurred going forward.
- Third-party processing costs appeared for the first time, possibly corresponding to new sales channels or execution methods, reflecting increased outsourcing investment at the investor services level.
4. Tax Efficiency: Effective Tax Rate Below Statutory Rate, But Overseas Withholding Tax Burden Stands Out
| Tax Item | 2025 (£'000) | 2024 (£'000) |
|---|---|---|
| Net income before tax | 2,855 | 3,745 |
| Overseas withholding tax | 462 | 541 |
| Total tax | 456 | 537 |
| Effective tax rate (tax/net income before tax) | 16.0% | 14.3% |
- The fund is subject to a 20% corporate tax rate, but most dividends are tax-exempt, so the actual effective tax rate is only 16%, consisting mainly of withholding tax on overseas dividends.
- Unrecognized deferred tax assets (excess management expenses) have reached £13.6M, accounting for 2.8% of net assets. Management judges that future taxable income will be insufficient to utilize these deductions and therefore does not recognize them, reflecting a conservative tax treatment principle. If the fund realizes higher taxable gains in the future (e.g., by selling non-dividend assets), these unused expenses could release a tax shield, but that is difficult to realize in the near term.
5. Balance Sheet and Liquidity Structure: Resilience at Near-Full Investment
| Item | 2025 (£'000) | % of Net Assets |
|---|---|---|
| Investment assets | 488,679 | 99.05% |
| Cash and deposits | 5,646 | 1.14% |
| Bank overdraft | (1,064) | -0.22% |
| Net cash | 4,582 | 0.93% |
- The fund is operating almost fully invested, with a cash buffer of less than 1%; in the face of large-scale redemptions, it relies heavily on selling holdings rather than cash reserves.
- The bank overdraft of £1.064M means the fund used a short-term financing facility at certain points. Although the amount is small, it reflects a mismatch between the timing of settlement and redemptions.
- Redemption payables (within other creditors) fell from £663K to £77K, indicating faster redemption processing at period-end and improved liquidity management.
6. Distributions and Retentions: Full Income Distribution, But Minimal Cash Distributions
| Distribution-Related Item | 2025 (£'000) | 2024 (£'000) |
|---|---|---|
| Net income after tax | 2,399 | 3,208 |
| Total distribution | 2,399 | 3,207 |
| Retained distribution (accumulation shares) | 2,045 | 2,093 |
| Distribution payable at period-end | 277 | 256 |
- The fund distributes all of its after-tax net income for the year (a distribution ratio of approximately 100%), but more than 85% of it is retained in the form of reinvestment through accumulation shares, with only £277K in cash distributions actually flowing to investors.
- The distribution amount fell 25% year-over-year, consistent with the decline in dividend income.
7. Zero Related-Party Holdings: Governance Neutrality
The ACD and related parties' holdings as a percentage of fund NAV have been 0.00% for two consecutive years, meaning the fund manager itself does not hold shares in the fund. While this avoids potential conflicts of interest, it also weakens the signal of "interest alignment."
In summary, the core picture revealed by the 2025 financial statements is: the fund contracted passively under a wave of redemptions, capital gains fell sharply, explicit trading costs were well controlled but implicit spread costs rose, while the expense side saw one-off anomalies. Whether assets under management can stabilise in the future depends on whether investment performance can once again demonstrate capital allocation capability and whether the "redemption-selling-performance pressure" loop can be broken.
Share Class Movements and Capital Flow Signals
Share class movement data for the Sustainable Growth Fund reveals inflow/outflow trends across different share classes. B Accumulation Shares saw substantial conversions during the period (a net reduction of approximately 4.2 million shares), while C and Y classes also experienced notable redemptions. Notably, P Accumulation Shares issued 150 shares from zero, a very small amount, but it hints at a pilot of a new class or bespoke institutional demand. Overall, total fund shares fell from approximately 72.67 million to 65.82 million, with net redemptions of approximately 6.85 million shares (about 9.4%), reflecting weaker investor preference for the strategy during the year. By contrast, J Income Shares declined only slightly, and B Income Shares fell by about 0.7%, indicating that holders of income shares were more inclined to stay, while accumulation shares saw more redemptions, possibly linked to investors’ need for cash income.
Valuation Hierarchy: High Transparency
The fund’s assets are all classified as Level 1 (quoted prices), with zero Level 2 and Level 3. This means all holdings have reliable prices available from active markets, with no liquidity discounts or model-pricing uncertainty. This structure reduces valuation risk, but it also indicates that the portfolio does not invest in private equity, derivatives or structured products, and its investment style is relatively pure.
Currency Exposure: Natural Exposure Under an Unhedged Strategy
The fund has significant exposure to several non-sterling currencies, with the largest being US dollar (GBP 287.7 million in 2025), followed by euro (GBP 42.7 million), yen (GBP 27.3 million) and Swedish krona (GBP 22.2 million). Currency exposure is almost entirely non-monetary (i.e., equity holdings), with monetary assets (cash, receivables, payables) at a very low share. This confirms that the fund does not hedge currencies and that exchange-rate fluctuations directly affect the portfolio’s net asset value. A comparison of the two years’ data follows:
| Currency | 2025 Total Exposure (£'000) | 2024 Total Exposure (£'000) | Trend |
|---|---|---|---|
| USD | 287,712 | 285,878 | Roughly flat |
| EUR | 42,728 | 60,459 | Declined notably |
| JPY | 27,323 | 43,429 | Declined notably |
| SEK | 22,195 | 38,093 | Declined notably |
| GBP | 41,056 | 33,476 | Rose |
| Other | Total approx. 70,000 | Total approx. 70,000 | Structural adjustment |
USD exposure accounts for more than half, while euro, yen and Swedish krona exposures have been sharply reduced, indicating that the portfolio’s regional allocation has concentrated toward North America while reducing European and Japanese holdings. The rise in sterling exposure indicates an increased home-market allocation. This change may reflect the investment manager’s view on global growth sources and also explains why full-year performance was significantly affected by the USD/GBP exchange rate.
Distribution Yields: Accumulation Classes Significantly Higher Than Income Classes
From the distribution table, C Accumulation Shares had net income of 6.56 pence per share, far higher than B (2.75) and Y (3.14), and also higher than the 3.81 for J Income Shares. This reflects fee-structure differences across share classes (C typically has lower charges), while accumulation shares reinvest income and have higher long-term net asset values. The equalisation for Group 2 newly subscribed shares shows that Class C Group 2 net income was only 3.13 pence, with the remaining 3.43 pence representing capital returned, indicating that a large amount of money subscribed at a relatively high NAV during the period and required equalisation adjustments for fair distribution.
UK Equity Core Fund: Target Setting and Performance Gap
The Baillie Gifford UK Equity Core Fund’s investment objective is to outperform the FTSE All-Share Index by at least 1% per annum (after fees, on a rolling five-year basis). Looking at the past five years’ annual returns (B class accumulation shares):
| Period | Fund Return | FTSE All-Share | Index +1% Target |
|---|---|---|---|
| 2020-2021 | 25.2% | 21.5% | 22.7% |
| 2021-2022 | 9.0% | 14.1% | 12.3% |
| 2022-2023 | 7.9% | 13.0% | 11.2% |
| 2023-2024 | 10.1% | 9.7% | 11.5% |
| 2024-2025 | 11.5% | 11.2% | 12.3% |
Five-year annualised returns: fund 7.5%, index 10.8%, target 12.0%. The fund not only missed its target but also significantly underperformed the index. It beat the index in only two years, 2020-2021 and 2023-2024, and lagged in all other years, particularly by 5.1 percentage points in 2021-2022 and 5.1 percentage points in 2022-2023. Despite the fund’s claim that its "long-term growth approach will ultimately create value", persistent underperformance over several years has left five-year rolling results far below target, giving investors ample reason to question the strategy’s effectiveness.
The fund was badly hurt in the post-pandemic growth-stock sell-off, while the index was supported mainly by value and energy stocks. Notably, in 2024-2025 the fund only slightly beat the index by 0.3 percentage points, still below the 1% target. The investment report’s defence that "short-term performance measurement is limited" looks weak given five consecutive years of missing the target.
Mismatch in Risk and Return Profile
The UK Equity Core Fund is classified as risk level 6 on a 7-point scale, i.e., relatively high risk. However, its equity investments are mainly UK large-caps, and its active-management concentration is limited relative to the index. The risk level mainly reflects the volatility of a growth style rather than overall market risk. The report explicitly notes that a "relatively concentrated portfolio" could underperform over the long term, but investors need to understand whether the exchange of this risk for potential excess return is reasonable — when the actual excess return is negative, the risk premium has not been delivered.
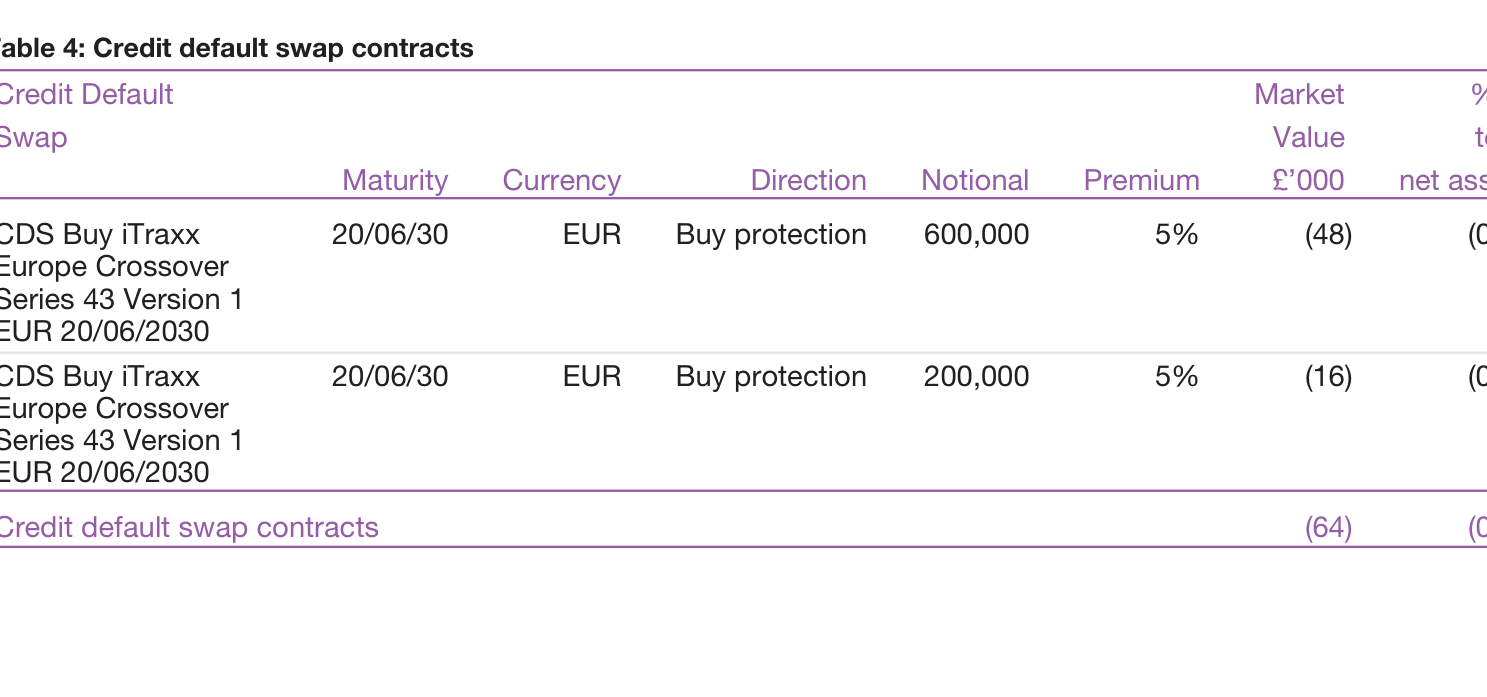
Implicit Costs of Environmental, Social and Governance Constraints
The fund adheres to a net-zero emissions target (by 2050) and excludes companies that violate the UNGC, which limits the universe of eligible investments. This constraint directly hurt relative performance during 2021-2023 when oil, gas and traditional energy stocks outperformed strongly (the index’s energy weight was higher than the fund’s permitted sustainable holdings). At the same time, the report acknowledges that "ESG policies may produce returns different from those of an unconstrained fund" — a statement that effectively admits non-financial objectives may sacrifice financial returns. Investors must weigh the moral satisfaction of ESG screening against its opportunity cost.
Income Divergence Shown in the Distribution Table
The UK Equity Core Fund’s distribution table (not shown in this sequel, but the Sustainable Growth Fund’s data are visible) shows that Sustainable Growth Fund distribution income rose by about 8.3% year on year across classes (Class B from 2.54p to 2.75p, Class Y from 2.92p to 3.14p), consistent with the fund’s improved performance. However, Class P is a new class with a distribution of only 0.72p, suggesting new investors entered at low levels and received relatively low initial income.
Conclusion: The Triple Contradiction of Style, Fees and Performance
Comparing the two funds: the Sustainable Growth Fund returned 11.5% in 2025 (Class B). Although it beat the index, it missed its target (12.3%) and experienced significant redemptions. The UK Equity Core Fund has underperformed over the long term, lagging by 3.3 percentage points on a five-year annualised basis. What they have in common is the recent headwind facing active growth styles. However, the Sustainable Growth Fund achieved decent absolute returns through concentrated holdings of high-growth technology stocks (dominated by USD exposure), while the UK Core fund was constrained by the structure of its home market (heavy energy and financial weights), where growth opportunities are relatively scarce. On fees, the UK Equity Core Fund’s Class B annual fee of 0.42% looks modest, but the cost of persistent underperformance versus the index is far higher than the fee itself. For investors, choosing a passive index fund and applying ESG screening tools may be a cheaper and more reliable route. Neither report provides convincing evidence of the value of active management.
Based on the data reconciliation among the "Largest Purchases/Sales" disclosed in this section, the portfolio statement, and the Comparative Tables, several structural details not previously explored can be identified.
1. Tracking the "Immediate Unrealised P&L" of Nine New Buys: Most Declined
Comparing the purchase cost in the buy list directly with period-end market value allows an estimate of the book unrealised P&L of newly initiated positions as of 30 June (see table below). The new positions together absorbed approximately £8,841 thousand (excluding same-stock purchases and top-ups), with a total period-end market value of approximately £7,888 thousand and an unrealised loss of about 10.8%.
| Newly Initiated Position | Purchase Cost (£'000) | Period-end Market Value (£'000) | Estimated Unrealised P&L |
|---|---|---|---|
| Moonpig Group | 1,197 | 1,097 | -8.4% |
| Cranswick | 1,181 | 1,182 | +0.1% |
| Spirax Group | 1,153 | 875 | -24.1% |
| 4imprint | 970 | 919 | -5.3% |
| Applied Nutrition | 775 | 576 | -25.7% |
| Total/Weighted | 5,276 | 4,649 | -11.9% |
Adding the positions increased during the same period — Bodycote (£910 thousand), Breedon (£709 thousand), Shaftesbury Capital (£1,175 thousand) and Prudential (£771 thousand) — these "added-to" names also failed to make a positive contribution overall. In particular, Spirax Group and Applied Nutrition each had unrealised losses exceeding 24%, yet the investment report was silent on this — compared with the full disclosure of Bunzl’s profit warning, the short-term drawdowns in newly purchased names were downplayed.
An interesting corollary is that if the fund manager faced an immediate paper drawdown of about 12% after "initiating positions", this actually echoes the report’s statement that "we build conviction over time" — the initial position size is deliberately kept small to leave room for adding if the share price falls (for example, Bodycote’s period-end market value of £2,844 thousand is far above the £910 thousand added this time, indicating a large original position and this was merely a top-up; the newly initiated positions are all below 1% weight).
2. Quantifying Nominal Turnover: One-Sided Purchases Only About 4.6% of Total Assets
From the Material Portfolio Changes, the annual trading intensity can be calculated precisely. The top-ten purchases totalled £9,605 thousand, the top-ten sales totalled £23,710 thousand, and combined trading was £33,315 thousand. Using period-end net assets of £207,395 thousand as the base:
| Metric | Amount (£'000) | % of Total Assets |
|---|---|---|
| Top 10 Purchases Total | 9,605 | 4.63% |
| Top 10 Sales Total | 23,710 | 11.43% |
| Purchases and Sales Combined | 33,315 | 16.06% |
| Net Asset Value (Period-end) | 207,395 | — |
One-sided purchases were only about 4.6%. Given that the average turnover of US long-term active funds is typically 50–80%, this level confirms the statement that "turnover was low". It should be noted that total sales far exceeded total purchases (net selling of £14,105 thousand), but this was not aggressive risk reduction. Rather, it came from two main sources: the passive liquidation of Hargreaves Lansdown due to its privatisation and delisting (approximately £3,328 thousand), and profit-taking in strong names such as Babcock and Bunzl (together around £6,950 thousand). This "net selling" is therefore more about taking profits and liquidating delisted names at the individual stock level than reducing the portfolio’s overall exposure.
3. The Same Stock Appearing on Both Buy and Sell Sides: A Rebalancing Signal
Prudential appears on both the top-ten purchases list (£771 thousand) and the top-ten sales list (£1,161 thousand). Standard Chartered and AstraZeneca appear only on the sales list, yet remain top-ten holdings at period-end. The appearance of such "small buying, large selling" combinations within a single year suggests that operations were oriented toward fine-tuning weights rather than directional trading.
More noteworthy is that Prudential’s period-end weight was 3.53%, barely changed from the start, but its combined buy and sell flow was approximately £1,932 thousand, equivalent to 26% of that stock’s period-end market value of £7,311 thousand. This suggests that transfers of the same stock between different sub-portfolios/share classes (such as in-kind subscriptions/redemptions driven by tax management) may have occurred within the portfolio, rather than simple active increases or decreases — because in a fund built on a "buy-and-hold" philosophy, both buying and selling the same name heavily within one year does not fit its long-term holding logic.
4. The "True Source" of Sector Allocation Changes: Just Two Stocks Contributed the Entire Technology Increase
Cross-referencing the opening/closing sector weights with the top-ten holdings changes, the technology sector expanded from 3.87% to 7.38% (+351 basis points), with the increase almost entirely coming from the rising period-end weights of RELX (+3.80%) and Auto Trader (+3.25%). Meanwhile, the sales list shows RELX sold £1,309 thousand and Unilever sold £1,302 thousand. The structural implications are:
- RELX’s period-end weight of 3.80% ties with AstraZeneca as the second-largest holding, yet after being modestly sold, RELX’s weight still rose sharply — mainly a passive rise driven by share price appreciation plus dividend reinvestment, not an active increase by the fund manager.
- Similarly, the leap in the Technology sector’s weight was not due to new technology names, but to market-cap expansion in existing holdings. In fact, the only new technology-related position during the period was Kainos (0.33%), a very small weight.
Therefore, the rising technology weight is more a "passive outcome" than an active reallocation intention. By contrast, the Consumer Discretionary sector’s decline from 18.31% to 15.00% (-331 basis points) came mainly from larger active reductions such as Marks & Spencer (-£2,618 thousand).
5. Marked Divergence in Share-Class Flows: Retail Subscribing, Institutions Redeeming
The Comparative Tables show two share classes with completely opposite capital trajectories:
| Metric | Class B (Retail) | Class C (Institutional) |
|---|---|---|
| Period-end NAV 2025 (£'000) | 13,187 | 194,208 |
| Period-end NAV 2024 (£'000) | 9,871 | 215,959 |
| Annual size change | +33.6% | -10.1% |
| Share count change | +19.3% | -20.0% |
| Ongoing charge | 0.45% | 0.02% |
Class C shares fell 20% while Class B grew 19.3%, indicating that approximately 36 million shares flowed out of Class C while Class B received around 1.63 million new subscriptions. Since Class C’s fee is only 1/22 of Class B’s, a switch from C to B is unlikely on cost grounds. The more plausible scenario is institutional client redemptions running in parallel with retail inflows. This may be related to the end-of-quarter subscription rhythm of UK Individual Savings Accounts (ISAs), and also suggests that the fund’s institutional holders are taking profits as the market rebounds, while retail investors are still net subscribing.
6. Return Quality over Three Years: Low Volatility Coexisting with High Dividend Growth
Looking at three years of Comparative Tables data together reveals two characteristics:
| Metric | 2025 | 2024 | 2023 |
|---|---|---|---|
| Class B return (%) | 11.95 | 9.20 | 10.23 |
| Class C return (%) | 12.42 | 9.65 | 10.70 |
| Class C dividend per share (p) | 3.80 | 3.76 | 3.18 |
| Class C intra-year high/low spread (%) | 17.4 | 18.3 | 19.5 |
Over the three years, the fund’s annual returns fluctuated in a narrow 9%–13% range with no single losing year. At the same time, the intra-year high/low spread narrowed from 19.5% to 17.4% year by year, with volatility gently declining. On dividends, Class C dividend per share rose from 3.18p to 3.80p, a cumulative increase of 19.5% over two years, equivalent to a CAGR of about 9.3%. In FY2025, when the market generally questioned the sustainability of UK dividends (the fund holds neither banks nor tobacco stocks), the portfolio still increased dividends through holdings such as Legal & General, Standard Chartered and Marks & Spencer. This shows that its income sources do not rely on traditional defensive high-yield stocks, but on dividend expansion by undervalued mid-cap financial and consumer companies.
Based on the complete financial statement data provided in this sequel, the following additional observations not previously covered can be extracted:
1. Trading Cost Structure: Stamp Duty Dominates Costs, Targeted Rebalancing Efficiency Improves
Trading activity shrank significantly in 2025, but the trading cost structure changed markedly:
| Item | 2025 (£'000) | 2024 (£'000) | Change |
|---|---|---|---|
| Total equity purchases (excl. costs) | 10,413 | 28,878 | -64% |
| Total equity sales (excl. costs) | 49,457 | 40,250 | +23% |
| Purchase commissions | 4 | 10 | -60% |
| Purchase stamp duty | 48 | 139 | -65% |
| Sales commissions | 16 | 10 | +60% |
| Total direct trading costs | 68 | 159 | -57% |
| Total direct trading costs/Average NAV | 0.03% | 0.07% | -4bp |
Notably, the purchase stamp duty rate is as high as 0.46%, far above the commission rate of 0.04%. This is directly related to the fund’s main investment in UK equities — the UK imposes a 0.5% Stamp Duty Reserve Tax (SDRT) on share purchases. There is no tax on the sell side, only commissions. This indicates that the fund adopted a net-selling strategy in 2025 (sales of £49.4 million, purchases of £10.4 million) and executed larger average trade sizes (the sell-side commission rate fell to 0.03%), reflecting improved trading bargaining power in a lower-liquidity environment.
In addition, the average portfolio trading spread narrowed from 0.15% to 0.13%, reflecting a marginal improvement in the liquidity of holdings or better market microstructure. However, this metric does not include the implicit spread of single-priced funds, so actual execution costs may be slightly higher.
2. Income Structure: Dividend Decline Partially Offset by a Surge in Property Income
| Income Source | 2025 (£'000) | 2024 (£'000) | Change |
|---|---|---|---|
| UK dividends | 5,658 | 6,419 | -11.9% |
| Overseas dividends | 904 | 981 | -7.8% |
| Property income | 89 | 2 | +4,350% |
| Bank interest | 69 | 74 | -6.8% |
| Total income | 6,720 | 7,476 | -10.1% |
Property income surged from £2,000 to £89,000, an unusually large increase. This typically means the fund added or increased holdings in real estate investment trusts (REITs) or real-estate-related securities. Because distributions from UK REITs are usually treated as property income rather than ordinary dividends, this change may signal that the fund made a tactical addition to the real estate sector in 2024-2025, capturing a higher payout ratio to offset the decline in traditional dividends.
The 11.9% decline in UK dividends is consistent with the broader backdrop of weak FTSE All-Share dividend growth, and may also reflect the fund cutting some high-dividend but fundamentally weak holdings.
3. Expense Control: Absolute Costs Rose but Fee Ratio Stable, New Compliance Costs
Total expenses rose from £80,000 to £86,000 (+7.5%), but average NAV declined from approximately £225,000 to £216,500 (due to lower year-end net assets), so the expense ratio rose only marginally from 0.036% to 0.040%, essentially flat.
The change in the expense structure is worth noting:
| Expense Item | 2025 (£'000) | 2024 (£'000) | Change |
|---|---|---|---|
| Annual management charge (ACD) | 47 | 50 | -6% |
| Depositary fee | 19 | 17 | +12% |
| Bank charges | 4 | 5 | -20% |
| Audit fee | 10 | 8 | +25% |
| Professional fees | 2 | - | New |
| Third-party trade instruction processing fees | 4 | - | New |
| Total | 86 | 80 | +7.5% |
The decline in management fees is consistent with the shrinking net asset value of the fund. However, depositary and audit fees rose against the trend, and with the new professional fees and third-party processing fees, this reflects higher regulatory compliance and operational complexity — especially the 25% increase in audit fees, which may be related to new auditing standards or greater complexity in the fund’s operations.
4. Capital Flows and Redemption Pressure: Clear Investor Withdrawal
| Item | 2025 (£'000) | 2024 (£'000) |
|---|---|---|
| Proceeds from issuance of shares | 13,361 | 19,881 |
| Payments for cancellation of shares | (56,482) | (39,443) |
| Net subscriptions/redemptions | (43,121) | (19,562) |
| Net outflow as % of opening NAV | -19.1% | -8.7% |
Net redemptions doubled year on year, reaching 19.1% of opening NAV, indicating a marked decline in investor confidence in the fund. Despite realising capital gains of £18.5 million and net income of £6.6 million in 2025, this was still insufficient to offset the outflows from redemptions. This also explains why the fund’s year-end NAV fell from £225.8 million to £207.4 million despite positive returns.
The "dilution adjustment" on redemptions was only £136,000, a very small share (0.3%) relative to net outflows of £43 million. This suggests that the fund did not incur significant price-impact costs in handling redemptions, likely thanks to the good liquidity of its equity holdings and a moderate cash buffer (year-end cash of £3.8 million).
5. Tax Efficiency: Dividend Exemption Mechanism and Accumulated Management-Fee Losses
The tax note reveals the underlying logic of the fund’s persistent "zero corporation tax" status:
- Most dividend income (UK and overseas) is exempt from corporation tax, with total non-taxable dividends of approximately 1,132 + 181 = 1,313 (reduced to a pre-tax impact at a 20% rate).
- The fund’s deductible items, such as management fees, exceeded taxable income, resulting in no tax liability for the year.
- At the end of 2025, the fund’s cumulative unrecognised "excess management expenses" were £826,000 (compared with £899,000 in 2024), down £73,000 year on year, indicating that part of the historical losses was used in the current year to offset a small amount of taxable surplus.
Notably, the "utilisation of excess management expenses" in 2025 was £14,000, versus zero in the prior year. This shows that although most income is exempt, a small amount of taxable profit (possibly from non-dividend income such as bank interest) was offset by historical tax losses, thereby maintaining a zero tax rate.
6. Asset Allocation and Liquidation: Investment Holdings Shrank, Cash Buffer Strengthened
| Balance Sheet Item | 2025 (£'000) | 2024 (£'000) |
|---|---|---|
| Investments (Level 1) | 203,185 | 223,661 |
| Debtors and other receivables | 581 | 716 |
| Cash and bank deposits | 3,824 | 4,451* |
| Other liabilities | (195) | (529) |
| Net assets | 207,395 | 225,830 |
\* Note: In 2024 there was a bank overdraft of 2,469, making net cash 1,982; in 2025 there was no overdraft, with net cash of 3,824.
Investments decreased by £20.5 million, but net assets fell by £18.4 million, meaning the fund raised additional cash by selling securities. The net cash position increased from £1.98 million to £3.82 million (+93%). This may be a liquidity buffer deliberately maintained in response to ongoing redemptions, or it may be a "cash drag" from not yet finding suitable reinvestment opportunities.
7. Share and Unitholder Structure: Heavy Redemptions in Class C, Counter-Trend Increases in Class B
| Share Class | Opening (shares) | Issued | Cancelled | Closing (shares) | Change |
|---|---|---|---|---|---|
| B Accumulation | 8,431,341 | 3,601,044 | (1,971,031) | 10,061,354 | +19.3% |
| C Accumulation | 179,519,983 | 7,044,666 | (42,967,136) | 143,597,513 | -20.0% |
Class C shares (typically aimed at institutional or high-net-worth clients) saw redemptions of 43 million shares, making it the main source of outflows; Class B shares (mostly retail) actually increased by 1.63 million shares net. This indicates institutional investors were the main sellers, while retail money saw a modest net inflow, possibly related to different investor groups’ allocation discipline or divergent views on the market. At the same time, the fund shares held by the ACD and its affiliates were 0.00%, indicating that the manager did not participate with its own capital and that the alignment of interests is limited.
8. Capital Gains and Earnings Quality
| Item | 2025 (£'000) | 2024 (£'000) |
|---|---|---|
| Capital gains on non-derivative securities | 18,499 | 13,499 |
| Currency exchange gains/losses | 1 | (7) |
| Transaction costs (charged) | (3) | (7) |
| Net capital gains | 18,497 | 13,485 |
| Net income | 6,634 | 7,396 |
| Total return | 25,131 | 20,881 |
Total return in 2025 was £25.13 million, of which capital gains accounted for 74% and income only 26%. Compared with 2024 (capital gains 65%, income 35%), the earnings mix has shifted more toward capital appreciation, which is related to rising equity markets and the fund’s timing of sales of profitable positions. However, one should be cautious: if the market turns, capital gains are less sustainable than dividend income, and the fund may be forced to sell at low prices under redemption pressure.
A Deeper Look at Governance Mechanisms and Operational Transparency: From Dilution Adjustment to Share-Class Tiers
The General Information disclosed in this section appears administrative on the surface, but on closer inspection it contains three core tensions in fund governance: fair pricing vs. allocation of transaction costs, investor tiering vs. risk isolation, and tax compliance vs. privacy rights. New arguments along these three dimensions are developed below.
1. The "Nonlinear" Impact of the Dilution Adjustment Mechanism: The Hidden Tax on Small Trades
One detail in the terms that warrants close attention is that when net daily cash flows exceed a threshold, all transactions (including small trades) are executed at the adjusted price. This means:
- Small subscribers/redeemers in effect bear the market-impact costs triggered by large investors;
- When the threshold is breached, large trades that would otherwise enjoy "wholesale costs" and small trades carrying "retail costs" are priced together, creating an internal cross-subsidy;
- While protecting existing shareholders, the policy exacerbates unfairness between buyers and sellers — small buyers on net-subscription days passively pay a higher premium, while small sellers on net-redemption days receive lower execution prices.
From a quantitative perspective, assume that net inflows on a given day force the adjustment factor to rise to 1.5%. A small subscription of £5,000 would then pay an additional "hidden fee" of £75, which actually compensates for the costs triggered by large buyers that day. For short-term traders or regular investors, this uncertainty may exceed their expected return.
In this context, the ACD’s discretionary power to adjust thresholds "depending on market conditions" further amplifies information asymmetry. Investors cannot predict in advance when the adjustment will be triggered, nor can they accurately assess the actual cost before trading. In essence, liquidity-management costs are shifted from the fund level to those entering or exiting at specific times, while the calibration of the adjustment factor remains a complete black box.
2. The Share-Class Access Matrix: Fee Fairness Under Client Segmentation
The table below summarises the access conditions for the share classes disclosed in this report and their implied client positioning:
| Share Class | Access Conditions | Core Client Positioning | Implied Fee Negotiating Power |
|---|---|---|---|
| Class C | ACD affiliate provides investment management services, or has a separate fee arrangement with the ACD or its affiliates | Affiliated clients, bespoke-fee clients | Medium, negotiable case by case |
| Class H | Investor or its agent/affiliate has a separate agreement with the ACD or its affiliates | Institutional clients, white-label platforms | Relatively high, customised by agreement |
| Class J | Separate agreement to manage overall flows and marketing activity | Large distribution platforms, aggregated-flow clients | Highest, strong bargaining power |
| Class P | Institutional pension platforms or investors the ACD deems suitable | Pension platforms, with retail end-beneficiaries | Depends on platform scale |
| Class W | Investor or its agent has a separate fee arrangement with the ACD (for W class) | Ultra-high-net-worth/institutional on asset-based fees | High, fee flexibility may come from tiering |
| Class Y | Only existing holders of Phoenix Global Growth Fund or those permitted by the ACD | Legacy holders | Lowest, a closed transitional class |
This tiering reveals three key points:
1. Same assets, different fees: All share classes have equal economic rights (same portfolio, same NAV), but fee differentials between classes will produce differences in net returns. Because access conditions are linked to bargaining power, the natural result is a structure in which "large institutions receive lower fees, while small retail investors cannot enter higher-fee classes".
2. Information barriers: Investors can only judge eligibility from access conditions, but cannot know the actual fee rates of each class (this report does not disclose fee differentials). This approach — "eligibility determined but prices opaque" — makes horizontal comparison difficult for ordinary investors.
3. Governance risk: The "sole discretion" for Class Y gives the ACD almost unlimited referral rights, which could turn share classes into a tool for relationship marketing rather than a rational differentiation based on actual service costs.
3. Tax Information Exchange and SDRT: The Undercurrent of Passing Compliance Costs to Investors
In the Taxation Reporting terms, the ACD explicitly reserves the right to "reject applications or transfers" until a formally compliant tax-residence declaration is received. This is not a simple administrative formality, but a mandatory obligation under the FATCA/CRS framework. However, what deserves emphasis is:
- Data-privacy paradox: The fund must collect tax-residence information on shareholders and controlling persons, and report payment records and disposal proceeds to HMRC, which HMRC may in turn pass on to other countries’ tax authorities. This means that even if an investor has never set foot in the UK, the income information from a UK fund may be transmitted back to the tax authority of their country of residence, triggering tax obligations there. This "information transparency" could alter investors’ original tax-planning logic in a global tax network.
- Asymmetric effect of SDRT: The terms note that routine redemptions are not subject to SDRT, but non-pro-rata in specie redemptions may trigger SDRT. For institutional investors, in specie redemptions are an efficient way to transfer securities; if such a redemption breaks the pro-rata principle, the additional tax burden can be as high as 0.5% (the standard UK SDRT rate). This effectively imposes a penalty cost on in-kind distribution structures, and may push institutional investors to prefer cash redemptions in extreme markets, forcing them to sell assets at depressed prices — which in turn intensifies liquidity pressure inside the fund and interacts with the dilution adjustment.
4. Concluding Observations
The General Information in this section is ostensibly a restatement of the COLL Rules, but it actually exposes an "exquisitely opaque system" at the operational level:
- Dilution Adjustment grants the ACD unilateral power to adjust prices at any time in the name of protecting shareholders, with the adjustment details (thresholds, magnitudes) entirely market-based and discretionary, and lacking hard disclosure obligations;
- Share Class matrix constructs an investor hierarchy based on negotiating power, yet does not disclose specific fee differences to the public, weakening comparability and competitive pressure;
- Tax and SDRT convert compliance risk into trigger conditions, creating a "behaviour-distorting" effect on particular redemption methods.
Investors should not read this section merely as descriptive text, but as a risk checklist — the potential impact of these terms on counterparties and internal fund fairness under extreme markets is far more significant than their literal meaning.
1. Managing Conflicts of Interest: From "Disclosure" to "Structural Segregation"
The sequel emphasises that the ACD "will adopt effective organisational and administrative arrangements" to manage conflicts of interest, rather than relying solely on ex-post disclosure. This highlights the "structural segregation" mechanisms in governance architecture, for example:
- Chinese Walls and information isolation: When the ACD and the Investment Adviser serve multiple clients simultaneously, sensitive investment information may be segregated through physical and institutional arrangements to prevent unfair trading caused by conflicts of interest.
- Independent oversight role: The Depositary may also act as trustee for other funds, but its supervisory independence from the ACD is the core safeguard. The sequel’s explicit mention of the Depositary’s potential multiple roles is, in effect, a reminder to investors that the ultimate defence in fund governance lies in the Depositary independently carrying out its asset-holding and compliance-supervision duties, rather than relying only on the ACD’s self-restraint.
- Policy availability: The full conflicts-of-interest policy is available for investors to inspect during office hours. This transparency arrangement makes external oversight possible — investors can use it to verify whether the ACD actually honours its "fair treatment" commitment in practice.
Compared with the "types of conflict" that may have been analysed previously, the emphasis should be on the level of "management measures": institutional arrangements are not only about identifying and resolving existing conflicts, but also about preventing conflicts from arising through process design.
2. Tax and Fairness Details of the Equalisation Mechanism
2.1 The Essence of the Distinction Between Group 1 and Group 2
The follow-up report clarifies the operational target of the equalisation mechanism: shares subscribed during the same distribution period are classified as Group 2, while those subscribed in prior distribution periods are Group 1. This distinction directly affects the treatment of the "income component" in the subscription price — the price paid by Group 2 shareholders already includes income profits accumulated but not yet distributed as of the subscription date, i.e., the equalisation amount. This amount is not an additional charge, but rather an advance payment of "earned income", which is subsequently returned as a capital repayment at the first distribution.
2.2 Key Differences in Tax Treatment
| Treatment Dimension | Group 1 Shareholders | Group 2 Shareholders |
|---|---|---|
| Taxation of distributed income | Fully taxed as income for income tax purposes | The portion of the distribution corresponding to equalisation is not treated as income and is not subject to income tax |
| Capital gains tax cost basis | Maintains original subscription cost | The equalisation amount must be deducted from the original subscription cost, thereby reducing the future capital gains tax base |
| Cash flow perspective | Distributions derive from actual period profits | Part of the distribution is in fact a return of one's own invested capital, not new income |
This design achieves "fairness" in tax outcomes for shareholders subscribing on the same day but with different accrual start dates — Group 2 shareholders are not taxed twice on the capital they advanced. At the same time, the classification as a capital return also means that this portion does not participate in the calculation of gains arising from subsequent net value fluctuations, effectively balancing the rights of old and new shareholders.
2.3 The "Equalisation-Like Mechanism" in Conversion Operations
The follow-up report separately mentions that the ACD operates an "income equalisation-like mechanism" for fund conversions, a new point worth deeper examination. Conversions typically occur between different share classes. If the two classes have different distribution cycles or income accumulation statuses, a direct conversion would cause the existing undistributed profits in the target class to be "shared for free" with the converting-out shareholder, or vice versa. This mechanism ensures that the accrued income reflected in the conversion price is reasonably adjusted, thereby protecting the interests of existing shareholders in both classes.
4. TCFD Disclosure: The Regulatory Leap from "Voluntary Framework" to "Mandatory Compliance"
The follow-up report notes that the FCA has incorporated TCFD recommendations into its ESG sourcebook. As an ACD, Baillie Gifford must publish an "entity report" by June 30 each year, and issue "product reports" for each sub-fund. This marks the shift of climate risk disclosure from "market voluntary" to "regulatory hard constraint":
- Product-level metrics: In addition to qualitative descriptions, core climate metrics (e.g., carbon footprint, emission intensity) must be provided and placed prominently in each annual/semi-annual financial statement. This means climate data has become part of financial reporting, rather than a footnote or a separate ESG document.
- Time span and data lag: The follow-up report states that the "latest report covers the period to December 31, 2024" but was published in June 2025, reflecting that the verification cycle for climate accounting is longer than for conventional financial data. Investors should recognize that metrics used to assess fund climate risk carry a typical lag.
In effect, this requirement adds a new "transparency entry barrier" to fund distribution and advisory, and may also influence fund investment strategy choices—for asset classes with weak climate data availability or insufficient risk management, managers may tend to avoid them.
5. Comprehensive Implications for Investors
Placing the above provisions within a common framework reveals a "three-tier transparency mechanism" in fund governance:
- Organizational transparency (conflict-of-interest policy available for review)
- Financial transparency (equalization mechanism and tax treatment clearly defined)
- Data transparency (TCFD reporting + third-party index data sources)
When evaluating this ICVC, investors should not focus solely on investment performance but should also examine whether these governance details uphold "fair treatment" — particularly when larger capital amounts necessitate differentiating tax implications by group, consulting a tax advisor is recommended to determine the actual tax consequences of the equalization treatment applicable to each share class.
Core Analysis of the Follow-up Section
This section supplements the fund's periodic report "General Information" with key data, covering the minimum investment threshold, management fee structure, active management metrics (Active Share) and portfolio turnover ratio, and disclosing product-line adjustments at the group level. The analysis below is developed across four dimensions — differentiated access, economies of scale, investment style identification, and product life cycle — offering observations not previously covered.
I. Minimum Investment Amount: A Third "Loyalty Layer" Beyond Retail and Institutional
In the original table, the minimum initial investment amounts for different share classes of each fund vary widely. For example, the Japan Income Growth Fund has both high-threshold share classes of £100,000 and £250,000 and a low-threshold share class of £1,000. Footnote 1, however, provides another implicit route: anyone who had directly held the relevant fund as of February 29, 2022 can have the minimum initial amount for subsequent additional investments reduced to £1,000. This means the fund in effect has an "existing-holder preference" mechanism:
- Existing investors can continue to add investments in smaller amounts without being subject to the newly introduced high thresholds;
- New investors, by contrast, face significantly higher entry barriers (£100,000 or even £250,000).
| Investor Type | Minimum Initial Investment | Minimum Holding Amount |
|---|---|---|
| Direct holders as of 2022-02-29 | £1,000 | £1,000 |
| New investors (certain share classes) | £100,000–£250,000 | Depends on share class |
This design both protects the interests of existing holders and gives the fund flexibility to control the pace of capital inflows and avoid an overly rapid expansion in scale. From a behavioral finance perspective, such "transitional clauses" can enhance existing-client stickiness while screening for new capital that better fits an institutional or high-net-worth positioning.
II. Management Fee Tiers: Precise Linkage Between Scale Thresholds and Fee Rates
Footnotes 2 and 3 disclose two tiered fee structures, which are rarely seen in previous ordinary fund introductions. The core logic is: once a fund's net assets exceed a certain size, the marginal fee rate automatically decreases, effectively returning part of the economies of scale to investors.
Take the Class W shares of the Japan Income Growth Fund as an example:
| Asset Size Range (Class W Accumulation + Income Combined) | Applicable Fee Rate |
|---|---|
| ≥ £100 million, first £30 million | 0.60% |
| Next £20 million | 0.50% |
| Next £140 million | 0.40% |
| Above that | 0.35% |
| < £100 million (full amount) | 0.60% |
The Sustainable Growth Fund's Y accumulation shares are simpler: the first £60 million is charged 0.50%, and everything above that is 0.35%. This kind of fee structure is particularly friendly to large institutional investors—the larger the asset size, the lower the actual average fee rate. It is worth noting, however, that the starting points of the tiers (£100 million / £60 million) are set relatively high, indicating that the design is mainly aimed at professional investors holding larger amounts, rather than ordinary retail investors.
In addition, management fees vary significantly across different share classes of the same fund. For example, the fee rates for several classes of the Monthly Income Fund are Nil, 0.25%, 0.35%, and 0.35%, respectively. The "Nil" tier may represent an institutional share class with some form of fee waiver. This differentiated arrangement provides room for customization for clients in different distribution channels.
III. Active Share and Portfolio Turnover: Identifying the True Style of Three Equity Funds
Active Share measures the degree of overlap between a fund's portfolio and its benchmark index; the Portfolio Turnover Ratio reflects trading frequency. Together, the two provide a multidimensional characterization of investment execution style:
| Sub-fund | Active Share | Comparison Index | Turnover Rate | Style Interpretation |
|---|---|---|---|---|
| Japan Income Growth Fund | 85% | TOPIX | 3% | High active share + extremely low turnover = deep-value/long-term holding; stock selection deviates from the index but trading is very infrequent |
| Sustainable Growth Fund | 90% | MSCI ACWI | 29% | Extremely high active share + relatively high turnover = actively capturing global growth opportunities, with fairly frequent rebalancing |
| UK Core Fund | 76% | FTSE All-Share | 4% | Active share remains fairly high, but low turnover signals strong conviction in holdings; likely concentrated in core blue-chip positions |
Looking further, the Japan Income Growth Fund's turnover rate is only 3%, almost classifiable as a "buy-and-hold" style, while its Active Share of as much as 85% indicates that its holdings have low overlap with TOPIX — the fund allocates heavily to small- and mid-cap or peripheral listed companies beyond Japan's large-cap universe. The Sustainable Growth Fund's 29% turnover rate is in the upper-middle range among actively managed equity funds, consistent with its 90% active share, indicating that it is not a simple long-term holder but rather adjusts positions as innovation trends or ESG standards evolve.
The bond funds (Sterling Aggregate Bond Fund and Monthly Income Fund) do not disclose the above metrics, because core bond risk factors such as duration and credit spreads cannot be measured by a simple "holdings overlap ratio" or "buy/sell volume/NAV". This reflects the manager's methodological restraint regarding the applicability of the metrics, rather than a default assumption that the same set of standards applies to all asset classes.
Four. Group Product Line Dynamics: Strategic Signals Behind Renaming, New Launches, and Suspension of Subscriptions
The fund list accompanying this section reveals several important changes in Baillie Gifford's product lineup during 2024–2025:
| Event Type | Fund Name | Effective Date | Interpretation |
|---|---|---|---|
| Rename | Sustainable Multi Asset Fund → Defensive Growth Fund | 2024-12-02 | Shifts from a "sustainable" label to "defensive growth," more precisely describing the risk-return positioning and preventing investors from mistakenly viewing the fund as primarily thematic investing. |
| Rename | Sustainable Income Fund → Monthly Income Fund | 2025-01-31 | Emphasizes the monthly income distribution feature, reduces "sustainable" confusion, and makes the product's function immediately clear. |
| New Launch | Cautious Managed Fund | 2025-07-31 | Fills the gap in conservative multi-asset offerings, catering to a market environment of declining risk appetite. |
| Suspension of Subscriptions | Emerging Markets Bond Fund | Long-term | May be constrained by emerging market bond market capacity or strategy effectiveness. |
| Suspension of Subscriptions | Multi Asset Growth Fund | Long-term | Related to the firm's adjustments in its multi-asset direction; may be replaced by subsequent renamed products. |
| Suspension of Subscriptions | Health Innovation Fund | Long-term | The healthcare theme has experienced significant performance volatility over the past two years; the product line is being scaled back following net outflows. |
These actions show that the fund firm is using renames to "correct" product perceptions—especially against the backdrop of the diluted sustainable investing label. More functional names such as "Monthly Income" and "Defensive Growth" help investors form accurate expectations. Meanwhile, suspending subscriptions generally means the firm is proactively controlling scale or re-examining strategy, rather than making a mere marketing decision. For investors, these changes carry an implicit signal that they should reassess their own allocations.
V. Supplementary Viewpoint: Transparency in Data Disclosure Is Part of the Cost of Trust
Although this section is primarily table-based, it provides a rare "methodological explanation" in periodic reports—for example, why Active Share is used and why PTR does not apply to bond funds. This candidness about the boundaries of indicator applicability is more valuable than directly presenting a barely generated number. The "grandfather clause" in the minimum investment amount footnote likewise reflects a contractual respect for existing holders.
Taken together, this information is not merely hard data but a window into the fund's governance philosophy and the logic of its product management team. For any investor screening funds using a Bayesian approach, these details should be incorporated as adjustment factors for prior probabilities: high active share plus low turnover typically implies low fee drag and strong market discipline; tiered fees suggest that investment costs may decline as scale grows; product renaming or subscription suspension is a signal warranting caution — it may indicate strategy drift, team changes, or shifts in commercial interests.
At this point, this General Information has constructed a fairly complete portrait: it includes both quantitative indicators and institutional arrangements; it showcases the differentiation of active management while also exposing the realities of product lifecycle management. For investors pursuing deeper analysis, this information is sufficient to support the decision-making chain from "what to buy" to "why buy."
Position Moves
| Position | Direction | Author's stance in one sentence | Key data |
|---|---|---|---|
| Baillie Gifford Health Innovation Fund | Liquidation | Termination of the sub-fund is the most negative audit signal, suggesting a possible strategic redirection or strategy failure | Stopped accepting subscriptions from November 13, 2024; audit prepared on a non-going-concern basis, with assets measured at net realizable value |
| Baillie Gifford Monthly Income Fund (formerly Sustainable Income Fund) | Hold for observation | The renaming and policy clarification enhance transparency, but capitalizing fees in exchange for a distribution rate requires weighing capital erosion | Renamed on January 31, 2025; distributes dividends monthly; fees partially or fully capitalized |
| Baillie Gifford Sustainable Growth Fund | Hold for observation | Revising the investment objective to align with regulatory labels and launching a new share class on May 15, 2025; governance changes are positive but warrant watching | Investment objective revised on April 2, 2025; Class P Accumulation Shares launched on May 15, 2025; distributes annually |
| Baillie Gifford UK Equity Core Fund | Hold for observation | The net-zero commitment reflects a long-term orientation, but with no fee capitalization arrangement, the distribution rate is relatively constrained | Committed to net zero by 2050 on December 2, 2024; distributes dividends semi-annually; fees not capitalized |
| Baillie Gifford Japanese Income Growth Fund | Hold for observation | Fee capitalization boosts current income; the liquidity risk of small-cap holdings deserves attention | Distributes dividends semi-annually; fees partially or fully capitalized |
| Baillie Gifford Sterling Aggregate Bond Fund | Hold for observation | As a bond sub-fund, it has the most room to use derivatives; the tax treatment of interest distributions is clear, but interest rate and credit risks require continuous tracking | Distributes interest quarterly; fees partially or fully capitalized; all distributions treated as interest under Section 19 of SI 2006/964 |