Baillie Gifford UK & Balanced Funds ICVC Interim Report - July 2025
In plain words
This is a half-year update for a Baillie Gifford global growth fund. The manager stays focused on picking quality companies for the long term and doesn't trade on macro forecasts, though short-term swings are expected. Over a quarter of the fund is invested in AI-related businesses. During the period it added Japanese semiconductor equipment makers, sold miners and industrial cyclicals, and bought DoorDash and Dollar General. NVIDIA, the top holding at about 6%, was both the biggest buy and biggest sell—trimming profits while keeping a core stake. New positions include Kokusai Electric (semiconductor equipment) and Paycom (HR software). Still, the fund has lagged its benchmark badly over five years and faced large redemptions.
This report covers the operations of Baillie Gifford UK & Balanced Funds ICVC as of July 31, 2025. The company is a UK open-ended investment company (OEIC) offering eight sub-funds, with single pricing applied across all shares. The report notes that the ACD is required under COLL regulations to con
Fund Overview
This section is the introduction to the semi-annual report of Baillie Gifford UK & Balanced Funds ICVC. It covers only the corporate structure, compliance arrangements and fund investment framework, and contains no performance, holdings or manager commentary.
- The company is a UK open-ended investment company (OEIC) incorporated in Scotland, regulated by the FCA, with shareholder liability limited to the amount subscribed; as at 31 July 2025 it had eight sub-funds, all UK UCITS retail schemes, valued daily on a single-pricing basis, each with its own fee structure and subscription limits.
- There were no cross-holdings between sub-funds during the reporting period: as at 31 July 2025, no sub-fund held shares of another sub-fund.
- The Prospectus and Articles of Association were last amended on 30 April 2025; under COLL rules, the ACD is required to carry out an annual value assessment of each sub-fund, considering at least seven criteria (quality of service, performance, ACD costs, economies of scale, comparable market rates, comparable services and share classes), with a reference date of 31 March; the latest composite report, as at 31 March 2025, has been published.
Fund Investment Framework (Global Alpha Growth Fund)
The fund is an actively managed global equity fund that aims to outperform the MSCI ACWI Index by at least 2% per annum (after fees) over a rolling five-year period.
- Investment objective: to outperform the MSCI ACWI Index by at least 2% per annum, in sterling terms and after costs, over a rolling five-year period; the report explicitly cautions that share prices may be highly volatile in the short term and that there is no guarantee the objective will be achieved.
- Investment policy: at least 90% of assets invested in equities of listed companies in any industry globally, actively managed and not replicating any index.
- Risk characteristics: active stock selection combined with relatively concentrated holdings may lead to prolonged underperformance relative to the benchmark or in absolute terms in certain market environments; custody risk, liquidity risk and global macro shock risk are also listed.
Fund Matters
The only fund-level change in this section is the addition of a Class P accumulation share class to the Global Alpha Growth Fund.
- On 15 May 2025, Baillie Gifford Global Alpha Growth Fund launched Class P Accumulation Shares.
- The remainder is regulatory background: the eight sub-funds are all UK UCITS retail schemes, and shareholder liability is limited to the amount subscribed; the commentary in this report does not constitute a recommendation or advice.
Tactical Shift in Portfolio Allocation: From Regional Rebalancing to Deepening the AI Ecosystem
I. Valuation Signals Implied by Regional Allocation Changes
Comparing current holdings with the prior period (figures in parentheses), one can identify clear tactical adjustments at the regional level by the fund manager:
| Region | Current Weight | Prior Weight | Change |
|---|---|---|---|
| United States | 63.08% | 61.75% | +1.33pp |
| Japan | 4.63% | 3.67% | +0.96pp |
| Netherlands | 5.33% | 4.74% | +0.59pp |
| Sweden | 1.22% | 2.42% | -1.20pp |
| Denmark | 0.75% | 1.69% | -0.94pp |
| Ireland | 3.02% | 3.61% | -0.59pp |
The significant reduction in Sweden deserves attention. Only Epiroc B (mining equipment) and Spotify (streaming) remain in the portfolio; other Swedish holdings previously in the portfolio, such as Atlas Copco B (compressor leader), were sold (see £21.98 million in Largest Sales). Atlas Copco and Epiroc share a common origin, and both are industrial equipment makers; the simultaneous and substantial trimming of exposure to this sector may reflect the fund manager's concern that the global capex cycle is peaking.
Japan was added to against the trend, rising to nearly 5% of the total portfolio, with a new position in Kokusai Electric (atomic layer deposition equipment) alongside increases in Disco (precision semiconductor processing) and Olympus (medical endoscopy). The unique positioning of Japanese semiconductor equipment companies within the AI capex cycle is the core logic behind this round of additions.
II. The Depth of "AI Value Chain" Positioning Goes Far Beyond Surface Data
The report explicitly states that "more than a quarter of the portfolio is invested in companies that power AI, build AI, or benefit from AI", but the depth of this exposure is difficult to judge intuitively from holding names alone. Broken down, the AI exposure displays a clear three-layer structure:
| Layer | Role | Representative Holdings | Estimated Combined Weight |
|---|---|---|---|
| Compute layer | Chip design / manufacturing equipment | NVIDIA (6.04%), TSMC (3.59%), Kokusai Electric (0.74%), Disco (0.70%), ASM International (0.46%) | ~11.5% |
| Application layer | Enterprise software / AI agents | Salesforce (new purchase), AppLovin (1.07%), Cloudflare (1.03%) | ~3% |
| Enabler layer | Data centers / power / automation | Comfort Systems (0.75%), Analog Devices (new purchase), On Semiconductor (new purchase) | ~2.5% |
It is worth noting that NVIDIA is simultaneously the largest holding (6.04%), the largest purchase (£30.32 million) and the largest sale (£29.28 million). This simultaneous buying and selling shows the fund manager actively managing the position at elevated levels — locking in some profits as the AI narrative continues to build, while keeping the core position intact.
III. The "Rebalancing" Logic Revealed by Trading Activity
A side-by-side comparison of the top five in Largest Purchases and Largest Sales clearly shows the direction of capital rotation:
| Sold | Amount (£'000) | Purchased | Amount (£'000) |
|---|---|---|---|
| NVIDIA | 29,283 | NVIDIA | 30,316 |
| Analog Devices | 23,926 | DoorDash | 29,703 |
| Martin Marietta | 23,852 | Paycom | 23,671 |
| Atlas Copco B | 21,980 | MSCI | 20,857 |
| BHP Group | 20,410 | Dollar General | 20,009 |
The sale of BHP Group is an important signal — as the world's largest mining company, BHP's exit echoes the trimming of Swedish industrial stocks, further confirming the fund manager's caution toward traditional cyclical industries. At the same time, the purchases of Dollar General (discount retail) and Chewy (pet e-commerce) indicate the fund is seeking defensive consumer growth amid economic uncertainty.
New positions also display a clear "barbell strategy":
- One end is AI infrastructure: Kokusai Electric (semiconductor equipment), FTAI Aviation (aircraft engine maintenance), On Semiconductor (power semiconductors)
- The other end is digital enterprise services: Paycom (HR software), Salesforce (CRM + AI Agent), Cloudflare (cloud security)
IV. Rebalancing of Concentration and Risk Diversification
The top ten holdings account for approximately 37.44% of the portfolio, slightly lower than the fund's typical allocation, reflecting an intention to reduce volatility through diversification. However, concentration risk in individual holdings deserves attention:
- NVIDIA accounts for 6.04% — the only security in the top ten exceeding 5%, and its fluctuations have a notable impact on the portfolio's NAV
- Prosus (3.43%) and TSMC (3.59%) rank fifth and fourth, respectively, both highly correlated with Tencent and China's AI supply chain
- The top three holdings (NVIDIA + Meta + Microsoft) total 15.7%, with both Meta and Microsoft being core beneficiaries of AI infrastructure
V. Target Deviation Analysis: Near-Term Pressure vs. Long-Term Correction
| Metric | 6-Month Return | 5-Year Annualised Return |
|---|---|---|
| Fund Class B shares | 1.0% | 6.9% |
| MSCI ACWI | 1.6% | 13.1% |
| Target return (index + 2%) | 2.6% | 15.4% |
| Excess return (vs. index) | -0.6pp | -6.2pp p.a. |
A negative excess return of 6.2 percentage points per annum over five years means the fund has not only significantly underperformed its benchmark but has also deviated entirely from the investment objective of "outperforming the index by 2% per annum". It should be noted, however, that this time window happens to cover the full cycle of the sharp growth-stock drawdown in 2021-2022. If one takes July 2023 as the starting point and calculates the three-year rolling return, the picture could be markedly different — during the reporting period the fund accumulated a return of approximately 15.0% (from data in the chart), versus approximately 26.3% for the index over the same period, with the gap having narrowed significantly.
VI. Stance on "Short-Term Noise" and Confidence in Ongoing Portfolio Adjustments
The report repeatedly emphasises the validity of the "five-year assessment period", but at the operational level the fund manager has not been waiting passively — over the past six months there has been intensive trading on both the buy and sell sides, with portfolio turnover significantly higher than many comparable global growth funds. This strategy of "professing a long-term approach while making adjustments in practice" is, in essence, an attempt to improve the portfolio's odds structure through continuous micro-adjustments while adhering to a long-termist framework.
It is particularly worth noting that the fund retains approximately 20% of the portfolio allocated to non-U.S. markets (U.S. weight of 63.08%, while China + Hong Kong + Taiwan + Japan + South Korea + Singapore + India total approximately 15.4%), and this allocation provided an important source of resilience during the market rebound following "Liberation Day".
In-Depth Observations from Holdings Details to Financial Data
This section discloses holdings details and related financial data for 29 stocks whose names begin with D through W, significantly broadening the information dimension. Building on these new disclosures, the analysis can be extended in five areas: concentration, capital flows, fee structure, liquidity management and product strategy.
I. High Portfolio Concentration with a Tech Platform and Semiconductor Tilt
The newly disclosed holdings account for approximately 46.4% of total assets, and of these 29 stocks alone, the top 10 account for approximately 28.4% and the top 3 for 15.7%. For a global equity fund, the largest single-stock weight reaches 6.04% (NVIDIA), and the top three holdings are all U.S. tech giants. This is consistent with Baillie Gifford's "long-term global growth" strategy, while also revealing the fund's stylistic dependence on U.S. equities.
| Rank | Company | % of Net Assets |
|---|---|---|
| 1 | NVIDIA | 6.04 |
| 2 | Meta Platforms | 4.88 |
| 3 | Microsoft | 4.78 |
| 4 | DoorDash | 2.25 |
| 5 | Mastercard | 2.19 |
| 6 | Martin Marietta Materials | 2.06 |
| 7 | Service Corp Intl. | 1.95 |
| 8 | Elevance Health | 1.58 |
| 9 | Royalty Pharma | 1.62 |
| 10 | Moody's | 1.04 |
A cross-industry breakdown shows that the semiconductor supply chain (NVIDIA, ON Semi, TI, Enphase, Entegris) totals approximately 8.3%; cloud computing and software platforms (Microsoft, Datadog, Salesforce, The Trade Desk, Meta, Uber) total approximately 13.1%; and financial data and payments (Mastercard, MSCI, Moody's, S&P Global, Paycom) total approximately 6.3%. This indicates that the portfolio's high exposure to "productivity technology" and "consumer technology" is not random, but rather a deliberate concentration in long-term structural growth tracks under active management. The cost of concentration is amplified volatility — the SRRI has remained at 6 for four consecutive reporting periods, confirming the stability of its risk profile at the higher end.
II. Dual Pressure of Modest Losses and Large-Scale Net Redemptions in H1
According to the Statement of Total Return, the fund recorded a net capital loss in the six months ended 31 July 2025, in sharp contrast to the substantial capital gains in the same period of the prior year. Notably, major U.S. equity indices generally rose over the same period, so the loss is more correlated with portfolio structure than with market trends, indirectly suggesting that certain holdings declined markedly or were affected by negative currency effects.
| Item (£'000) | H1 2025 | H1 2024 | Change |
|---|---|---|---|
| Net capital gains/losses | -4,836 | +222,839 | Swung from profit to loss |
| Total income | 9,410 | 12,027 | -21.7% |
| Expenses | -1,883 | -3,674 | -48.8% |
| Net income after tax | 6,734 | 7,238 | -7.0% |
| Distributions | -3,950 | -5,298 | -25.4% |
| Net change in net assets from investment activities | -2,052 | +224,779 | Deteriorated sharply |
At the same time, net subscription and redemption flows show the fund is under sustained redemption pressure. Net redemptions in the reporting period were £238.65 million, narrower than the £401.5 million in the same period of the prior year, but still nearly 16 times the £15.5 million of subscriptions. Net assets fell from £2,350 million at the beginning of the period to £2,113 million at the end, a decline of approximately 10.1%.
III. Structural Divergence Across Share Classes: High-Fee Shares Nearly Wiped Out
Share-class data reveal an investor behaviour worth noting: the number of Class A shares (highest ongoing charge of 1.44%) plunged from 457,617 to 12,131, a decline of 97.3%; while Class C (lowest charge of 0.02%) fell only 6.3%.
| Share Class | Shares at 31.01.2025 | Shares at 31.07.2025 | Change | Ongoing Charge |
|---|---|---|---|---|
| A Accumulation | 457,617 | 12,131 | -97.3% | 1.44% |
| B Accumulation | 98,779,650 | 72,097,586 | -27.0% | 0.59% |
| B Income | 44,296,915 | 41,636,900 | -6.0% | 0.59% |
| C Accumulation | 282,139,250 | 264,451,374 | -6.3% | 0.02% |
| C Income | 4,294,345 | 3,989,586 | -7.1% | 0.02% |
| L Accumulation | 200 | 200 | 0.0% | 0.53% |
| P Accumulation (launched 15 May 2025) | n/a | 200 | — | 0.52% |
This divergence implies that investors have a lower tolerance for weak performance in a high-fee environment, while institutional investors in lower-fee classes have remained relatively stable. The near-wipeout redemptions in Class A may be the result of concentrated exits by pension or high-net-worth channels; such "fee-sensitive redemptions" are not uncommon in large-scale outflows, but the magnitude here is notable.
IV. Cash Defense and Liquidity Management: Net Other Assets Turned Positive from Negative
The Balance Sheet shows that the fund increased its cash buffer while shrinking in size: cash and bank deposits rose from £17.5 million to £32.2 million, an increase of nearly 84%; at the same time, a bank overdraft of £4.8 million appeared, indicating the fund used short-term financing instruments to manage the timing of cash inflows and outflows. Net other assets moved from -1.07% at the beginning of the period to +1.34% at the end, turning positive from negative, reflecting an increased liquidity buffer while the portfolio continued to address redemptions and rebalancing needs.
This defensive posture, combined with the declines in "Net capital losses" and "Net assets attributable to shareholders" in the financial report, suggests the manager may have reduced equity exposure in Q2, either passively or actively. As the report does not disclose trading activity, it is impossible to determine whether the increased liquidity was a passive result of redemption pressure or an active defensive choice.
V. Paris-Aligned Fund Link: A Parallel Sustainable-Themed Product
At the end of the report, another sub-fund in the same range appears: the Global Alpha Paris-Aligned Fund. It continues the approach of Global Alpha Growth — active stock selection, concentrated holdings and the pursuit of excess returns — but adds an additional constraint of a "carbon footprint lower than the MSCI ACWI Paris-Aligned Index".
Compared with Global Alpha Growth: the target benchmark shifts from MSCI ACWI to a Paris-Agreement-screened MSCI index variant; a hard constraint on the ESG objective dimension is added alongside excess returns; and the investment policy similarly confronts the risk warning that concentration can lead to periodic underperformance, indicating that its style skeleton is in the same lineage as Baillie Gifford's flagship active strategy, with sustainable screening conditions layered on top.
The existence of this parallel fund shows that Baillie Gifford is replicating its long-term growth strategy into the sustainable product track. Global Alpha Growth Fund itself has no ESG objective, with ESG considerations reflected only in individual stock selection (e.g., holding clean energy stocks such as Enphase and healthcare financial innovation companies such as Royalty Pharma), making the two funds a "sister" product line.
VI. Valuation Drawdown Pressure Implied by NAV Fluctuation Ranges
Looking at price data, all share classes experienced a fairly deep drawdown during the reporting period. Taking Class C accumulation shares as an example, the lowest price of 435.9 pence occurred during the reporting period, while the NAV at the beginning of the period was around 468.6 pence, implying that the portfolio suffered a paper drawdown of at least 7% in Q2 before recovering to the period-end level of 573.7 pence. The spread between the annual high and low prices is also notable: Class B recorded a high of 526.7 pence and a low of 398.0 pence during the reporting period, a peak-to-trough range of 32.3%.
Such high amplitude is to be expected for a growth fund, but combined with the negative net capital loss in the financial results, it further corroborates the severe divergence within the portfolio in H1: a small number of heavily held tech stocks (such as NVIDIA and Meta) contributed the majority of gains, while other small- and mid-cap growth stocks (such as DoorDash, Enphase, Dutch Bros and others) may have dragged on overall performance. The portfolio's structural characteristic — "the large holdings set the direction, the long tail contributes the volatility" — thus becomes clearer.
These data points provide a new frame of reference for assessing the state of Baillie Gifford's flagship global growth strategy in 2025: concentration, volatility, fee divergence, net outflows, and liquidity defense. Although the fund retains the skeleton of "high conviction, long horizon," the fragility of its relative performance is being put to the test.
Follow-up Analysis: From the "Paris-Aligned" Label to a Reassessment of Portfolio Governance Logic
In addition to continuing the description of the investment objectives, the follow-up document effectively deconstructs "Paris-Aligned" from a piece of marketing rhetoric into an operational, verifiable investment mechanism that nonetheless has clearly defined boundaries. This section focuses on three sets of contradictions in the text that investors are likely to skim past: the openness of the screening logic, the blind spots in carbon data measurement, and the dynamic tension between performance and climate commitments.
I. Screening Mechanics: Exclusion as the Backbone, Engagement as the Wings, but the "Alignment" Yardstick Is Not Uniform
The document states that the investment policy is "at least 90% invested in global equities," and then introduces quantitative and qualitative screening. The key formulation is:
> excluding carbon intensive companies that do not, or will not, play a role in the transition to a low-carbon future
This sentence defines the exclusion targets as "carbon-intensive companies that do not, or will not, participate in the transition," meaning companies that are currently high-carbon but are deemed to have a transition pathway can still be admitted to the pool. This is fundamentally different from a pure ESG exclusion strategy (such as outright exclusion of fossil fuels). Combined with the later statement that "all portfolio companies are actively assessed and prioritised for engagement," it is clear that the fund adopts a hybrid governance path of "exclusion + engagement":
- Exclusion: removes carbon-intensive companies without a credible transition narrative;
- Engagement: uses shareholder dialogue to advance the net-zero path of companies already in the pool.
This mechanism is internally consistent in operation, but it has two major ambiguities:
1. The determination of "will play a role" relies on forward-looking assumptions, with no publicly disclosed quantitative thresholds, and is ultimately decided by the subjective opinion of the Investment Adviser (the phrase "in the Investment Adviser's opinion" in the text serves as both a disclaimer and an authorization statement);
2. The priority, frequency, and exit conditions of engagement are not disclosed — that is, the text imposes no "hard constraint" stipulating when the fund would divest a portfolio company that fails to reach net-zero milestones within a reasonable timeframe.
This makes "Paris-Aligned" more of a management-oriented label than a results-oriented commitment.
II. Carbon Data Methodology: Three Structural Limitations Undermine the Credibility of the Metric
The document devotes considerable space to disclosing the limitations of the WAGHGI calculation methodology — uncommon in fund documents — and each point merits individual unpacking:
| Disclosure in the original | Structural implication | Potential impact on investors |
|---|---|---|
| "Only those investments that have available data will be included in the calculation" | Incomplete data coverage; companies with missing data are excluded from both the numerator and the denominator | The fund's WAGHGI may be systematically understated — particularly if the companies with missing data happen to be high-carbon |
| "Carbon data uses the methodology of only one provider" | Single data provider with no cross-validation | Data errors are amplified in one direction, and a methodology switch would cause non-performance-related jumps in WAGHGI |
| "some data may be estimated" | Proportion of estimated values unknown | Estimation errors for carbon emissions — especially at companies that are unlisted or under-disclosed — can reach double-digit percentages |
Taken together, these three points mean that the fund's disclosed WAGHGI is an approximation based on incomplete, single-source, and partly estimated data, and neither its precision nor its comparability should be overestimated. More tellingly, the text acknowledges:
> the Fund may invest in single companies that are high emitters
This directly confirms that meeting carbon-intensity targets at the portfolio level does not mean every holding is low-carbon. This is candid disclosure, but it also reveals the inclusiveness of the "Paris-Aligned" label — it permits the existence of high-carbon individual stocks, as long as the portfolio average is below the benchmark.
Based on the identifiable figures in the text, the fund's WAGHGI shows a pronounced downward trend (from approximately 165.5 to 64.6 or 72.5, a decline of roughly 56%–61%). At the same time, however, the two low values of 33.4 and 54.2 that appear in the text, if they correspond to benchmark indices, suggest that the fund's absolute level of carbon intensity remains higher than certain broad-based/Paris-Aligned benchmarks. Due to the confusing chart labels, the exact correspondence cannot be confirmed, but at a minimum this shows that "improvement" in carbon intensity and "absolute low carbon" are two different things — investors should not equate a trend with meeting the target.
III. Temporal Mismatch in Performance Targets: A Rolling Five-Year Horizon vs. a Fund Not Yet Five Years Old
The fund was launched on April 15, 2021, and by July 2025 has been operating for only about 4.3 years — squarely in the awkward position of "not yet having completed its first full five-year assessment period." The text states:
> We believe that short-term performance measurements are of limited relevance in assessing investment ability
This kind of defense is hardly unfamiliar in the fund industry, but for a product marketed on "Paris-Aligned" credentials, it exposes a vacuum in the evaluation framework:
- Performance benchmark: MSCI ACWI Index + 2% (rolling 5 years)
- Carbon benchmark: WAGHGI below the MSCI ACWI EU Paris Aligned Requirements Index
- The two objectives can almost never be validated simultaneously within the same short-term cycle
The semi-annual data provide a cross-section for reference: the fund's Class B shares returned 1.0%, the index 1.6%, and the target return 2.6% — the fund lagged the index by 0.6 percentage points and the target by 1.6 percentage points. Short-term underperformance is not in itself cause for concern, but given that the fund experienced a drawdown of approximately -19.8% in 2021/22, while the index over the same period (with data points in the chart showing low-single-digit positive returns or slight declines) was relatively resilient, the fact that the fund's volatility has been significantly higher than the benchmark since inception is already an established fact.
Even more noteworthy: across the past five calendar-year periods, the fund significantly outperformed in some years (positive returns on the order of 20% and 17%) and suffered sharp drawdowns in others. This high-volatility profile runs directly counter to the defensive expectations usually associated with "Paris-Aligned." The reason is that the fund's core holdings remain high-quality growth stocks, not low-carbon infrastructure or energy-transition leaders.
IV. Principal Holdings: What Does a Paris-Aligned Portfolio Actually Hold?
The top ten holdings total approximately 40.28% — a relatively high concentration — and the structure is far more complex than a "green theme":
| Holding | Weight | Role in a Paris-Aligned Context |
|---|---|---|
| NVIDIA | 5.92% | Core of AI computing power; carbon emissions mainly from supply chain and electricity consumption |
| Microsoft | 5.16% | Has active carbon-reduction commitments, but large absolute emissions |
| Meta Platforms | 4.96% | High data-center carbon intensity; significant renewable energy procurement |
| Amazon | 4.35% | A hybrid carbon emitter combining logistics and cloud computing |
| Prosus | 3.35% | Indirectly holds Chinese internet assets via Tencent; low carbon intensity |
| TSMC | 3.26% | Advanced semiconductor manufacturing; a highly electricity- and water-intensive industry |
| DoorDash | 2.34% | Gig-economy platform; low carbon intensity |
| Mastercard | 2.20% | Financial infrastructure; extremely low carbon intensity |
| Service Corp. | 2.03% | Funeral services; defensive; low carbon intensity |
| Royalty Pharma | 1.71% | Pharmaceutical royalties; extremely low carbon intensity |
The top four holdings are all large-cap U.S. technology stocks, together accounting for 20.39%. These companies are not "climate solution" providers in the typical sense; rather, they are the infrastructure layer of the digital economy. The fund's logic for holding them derives more from growth than from emissions-reduction contribution.
This echoes the statement in the text that "over a quarter of the portfolio invests in companies that power, build or benefit from AI." Indeed, at least five of the top ten (NVIDIA, Microsoft, Meta, Amazon, TSMC) directly benefit from the AI capex cycle. This reveals an important fact:
The fund's "Paris-Aligned" path is not centered on shifting toward green industries, but on heavily weighting the structural growth of the digital economy while excluding traditional high-carbon emitters.
This is a strategy of "growth first, substituting low- and mid-carbon industries for high-carbon ones," and it differs markedly from "deep green" investing (renewables, energy storage, circular economy). The new holdings — Paycom (HR software), FTAI Aviation (aircraft engine maintenance), and WillScot (modular buildings and storage solutions) — further confirm this point: these are not "climate solution stocks," but their carbon intensity is naturally low, and they possess earnings-growth momentum.
V. Key Information Glossed Over in the Risk Disclosures
The document devotes considerable space to the risk disclosure section, but most of it consists of standard boilerplate clauses. Three points, however, deserve amplified reading:
1. "charges are taken from income... if insufficient, the rest will be taken from capital"
This means that if the fund operates in a low-dividend environment, fees will be deducted from capital, directly reducing net asset value. For a fund dominated by growth companies, dividend yields are typically low, and the mechanism by which fees erode capital is not a tail risk — it is the norm.
2. "Custody of assets involves a risk of loss if a custodian becomes insolvent"
The word "involves" is used to describe custodian risk in understated terms, yet the systemic importance of the global custody chain could indeed become a single point of failure under stress scenarios.
3. "It may be difficult to sell investments held by the Fund in a timely manner"
This liquidity risk warning matches the reality of the fund's holdings of small- and mid-cap growth stocks (such as Dutch Bros and WillScot). The top ten holdings are highly liquid, but the tail of the portfolio — those high-valuation, thinly traded growth stocks — may be the first to lose liquidity in a falling market.
VI. Conclusion: A Paris-Aligned Product Prospectus That Is "Honest but Easily Misread"
This follow-up document does not sidestep the key limitations: poor carbon data quality, portfolio-level averaging that masks individual high-carbon holdings, the mismatch between short-term performance and long-term objectives, and a screening process that relies on subjective judgment. For professional investors, these disclosures are a plus and reflect a degree of transparency.
But the problem is precisely this: when these limitations are packaged within grand commitments such as "Paris Agreement alignment" and "net zero by 2050 or sooner," ordinary investors can easily misread "management intent" as "environmental impact." The fund's actual strategy is:
- Overweighting global digital-technology growth leaders, conditional on excluding traditional high-carbon industries;
- Using the sustained decline in the portfolio's average carbon intensity (from approximately 165 to approximately 65) as evidence of climate alignment;
- While anchoring performance on outperforming the MSCI ACWI Index by 2% over a rolling five-year period.
These two sets of objectives can indeed run in parallel, but they share the same premise: that the low physical carbon intensity of the digital economy can continue to translate into excess returns. If the AI bubble bursts in the future, or if market style rotates toward value/energy, the fund will face the dual pressure of performance underperformance and a rebound in its carbon-intensity metric — because the portfolio contains no traditional energy, utilities, or other counterbalancing sectors to smooth carbon-intensity fluctuations.
This is the most fundamental "hidden leverage" of a Paris-Aligned portfolio: the decline in the carbon-intensity metric is achieved through industry exclusion and a growth-stock tilt, and its stability depends entirely on the persistence of a single growth narrative.
I. AUM Movements: Structural Noise from Share-Class Migration Behind the Net Outflows
As of July 31, 2025, the fund's net assets stood at £305.074m, down 9.8% from the opening figure of £338.168m. The headline numbers show net redemptions of £33.000m over six months (subscriptions of £3.693m vs. redemptions of £36.693m), but a closer look at the share-class details reveals that the redemption figure has been significantly amplified by internal share-class migration:
| Share Class | 2025.01.31 (shares) | 2025.07.31 (shares) | Change |
|---|---|---|---|
| B Accumulation | 3,336,379 | 16,975,761 | +408.8% |
| B Income | 18,977,547 | 10,789 | −99.94% |
| C Accumulation | 241,261,091 | 221,523,725 | −8.2% |
| C Income | 49,042,270 | 39,985,303 | −18.5% |
B Income has almost entirely "disappeared," while B Accumulation has simultaneously surged by more than 400% — a classic pattern of institutional clients converting income-class shares into accumulation-class shares, rather than a genuine exit. If this conversion factor is stripped out, the actual scale of net investor redemptions should be smaller than the £33m disclosed in the report. This detail is crucial for understanding the fund's flows — the holder structure of this Paris-Aligned thematic fund is undergoing migration, not a large-scale loss of conviction.
At the same time, the proportion of Class C shares (institutional class) continued to rise — the combined Class C weight in total assets moved from approximately 85.8% at the start of the period to approximately 85.7% at the end, maintaining overwhelming dominance. The ongoing-charge differential between Class C and Class B (0.02% vs. 0.59%) makes the product highly attractive to large institutions.
II. Trading Matrix: The NVIDIA "Round-Trip" Reveals Rebalancing Logic, Not a Directional Retreat
NVIDIA appears at the top of both the largest-buy list (£3.991m) and the largest-sell list (£5.298m), with a net reduction of approximately £1.3m over the period, yet it remained the largest holding at period-end at £18.060m (5.92%). This means the fund executed approximately 25% turnover on a core position at the £19m level — realizing partial profits at elevated levels and then rebuilding to maintain core exposure; a typical swing-trading maneuver for concentrated holdings.
Classifying all buy and sell targets by business profile clearly reveals two threads in the rebalancing — reducing platform-style consumer internet and increasing AI infrastructure and B2B software:
| Direction | Representative Names | Trade Amount (£'000) | Business Profile |
|---|---|---|---|
| Add | NVIDIA, On Semi, Cloudflare | 3,991 / 2,607 / 2,658 | AI compute / semiconductors / edge cloud |
| Add | Salesforce, EPAM, Paycom | 2,954 / 2,151 / 3,437 | Enterprise software / digital services |
| Add | MSCI, Edenred, FTAI Aviation | 2,972 / 2,864 / 2,400 | Financial data / payments / aviation leasing |
| Reduce | Doordash, Uber, Netflix, Amazon, Chewy | 4,522 / 2,925 / 2,352 / 2,330 / 2,807 | Consumer platforms / e-commerce / streaming |
| Reduce | Analog Devices, Atlas Copco, Prosus | 3,867 / 3,463 / 3,094 | Analog chips / industrial equipment / discounted vehicle for Tencent assets |
Particularly noteworthy is Prosus N.V. — it was simultaneously the third-largest sell of the period (£3.094m), yet it remained the fifth-largest holding in the portfolio at period-end, at £10.222m (3.35%), and is the largest position in the European region. The position was trimmed but retained its core status, reflecting the fund's continued respect for the long-term value of the underlying Tencent assets, while merely reducing the valuation-recovery exposure created by the narrowing discount.
III. Financial Performance: The Double Squeeze of Vanishing Capital Gains and Shrinking Income Distributions
Net capital gains/losses for the period were −£1.029m, a stark contrast with the +£28.771m in the same period of 2024. But this contrast stems mainly from hedging and currency factors, not fundamental deterioration — because the period-end NAV remains in its historical high range (Class C Accumulation at 110.17p, only slightly below the period high of 111.0p), and the portfolio's market value is essentially flat. The swing of capital gains into negative territory may be related to foreign-exchange volatility, derivative hedging costs, and pullbacks in certain individual stocks, but it does not change the portfolio's long-term value center.
The income side is similarly under pressure:
| Income Metric | 2025 H1 (£'000) | 2024 H1 (£'000) | YoY Change |
|---|---|---|---|
| Total income | 1,256 | 1,434 | −12.4% |
| Net income (after tax) | 1,042 | 1,188 | −12.3% |
| Total distributions | 704 | 873 | −19.4% |
| Distribution coverage ratio | 67.6% | 73.5% | −5.9pct |
The direct cause of the income decline is the reduced weight of high-dividend holdings — Edenred, Dollar General, and others were trimmed during the period, while the new additions (NVIDIA, Cloudflare, Salesforce, etc.) are mostly low-dividend growth stocks. The income distribution for Class B shares was 0.00p for the period, and with Class B Income shares nearly wiped out, this share class has clearly entered a wind-down state.
IV. Balance Sheet: A Defensive Posture of Low Leverage and High Liquidity
At period-end, cash and bank balances stood at £4.147m, with bank overdrafts of £288k in addition, giving net cash of approximately £3.859m, or 1.26% of net assets — up from 0.72% at the start of the period. Against the backdrop of persistent net redemptions, the fund has maintained an ample liquidity buffer. Receivables fell from £1.429m to £0.491m, indicating improved trade settlement efficiency. Overall structural liabilities are extremely light (payables of only £0.475m), and asset quality is clean.
One legacy asset worth noting: the Sberbank holding of 491,340 shares remains on the books, but is valued at zero. This is now the third consecutive reporting period since the Russia-Ukraine conflict. Although the amount is negligible, the fund has maintained transparent disclosure of its "held but valued at zero" status — in the aftermath of sanctions that render the position unsaleable and unmonetizable, this is a treatment consistent with the principle of prudence.
V. The "Inherent Tension" Between Concentration and Paris Alignment
At period-end, the top ten holdings accounted for approximately 35.2% of net assets, and the top five approximately 28.7% — concentration remains elevated:
| Rank | Name | Market Value (£'000) | Weight |
|---|---|---|---|
| 1 | NVIDIA | 18,060 | 5.92% |
| 2 | Microsoft | 15,732 | 5.16% |
| 3 | Meta Platforms | 15,136 | 4.96% |
| 4 | Amazon.com | 13,277 | 4.35% |
| 5 | Prosus N.V. | 10,222 | 3.35% |
| 6 | TSMC | 9,956 | 3.26% |
| 7 | Doordash | 7,134 | 2.34% |
| 8 | Mastercard | 6,702 | 2.20% |
| 9 | Service Corp. Intl. | 6,195 | 2.03% |
| 10 | Royalty Pharma | 5,203 | 1.71% |
One striking feature is that the Paris-Aligned fund's holdings contain virtually no traditional "fossil-fuel giants," but feature substantial allocations to high-energy-consuming AI infrastructure beneficiaries (NVIDIA, TSMC, Microsoft, Amazon). This is precisely the real-world constraint of a Paris-Aligned strategy: it seeks winners in the transition toward a low-carbon economy, not merely low-emission companies — the electricity demand created by AI data centers has a dual character under climate goals, but the fund has clearly chosen the "technology-led decarbonization" narrative. Also worth noting is that the financial-data and ratings oligopoly has reached a combined weight of 3.14% (MSCI 0.99%, S&P Global 1.14%, Moody's 1.01%) — a hidden and distinctive thread within the portfolio: "selling shovels" in the age of index investing. It fits the asset-light logic of Paris Alignment while also avoiding the carbon-intensive exposure of the traditional financial industry.
VI. Fee Structure: The "Institutional Dividend" of Class C Shares Continues to Magnify
The ongoing charge on Class C shares is only 0.02%, versus 0.59% for Class B — a 30-fold gap. Based on period-end net assets, if the fund were held entirely in Class C shares, the annualized fee would be approximately £61k; the few remaining Class B shares generate almost no fee burden. By passing on the cost savings to large institutional holders through ultra-low fees, the fund explains why Class C shares have consistently outperformed Class B over the long term (Class C Accumulation period-end NAV of 110.17p vs. Class B Accumulation of 107.51p). In an era of relentless downward pressure on passive product fees, an active management fee of 0.02% has effectively moved into the pricing band of passive products — a key moat for Baillie Gifford in the competition among ESG active funds.
The following expands the analysis to additional points not covered in this follow-up document, continuing the existing framework and focusing on the deeper implications at the levels of strategy structure, mechanism design, and performance attribution.
1. The "Twin Pillar" Framework in the Investment Objective: The Implicit Trade-Off Between Income Growth and Capital Growth
The fund's investment objective is not a single composite statement of "income + growth," but rather consists of two independent constraints: dual growth of total income and total capital over a rolling five-year period, as well as a sustained yield premium relative to the MSCI ACWI Index. This "twin pillar" structure embeds a long-term contradiction at the level of strategy execution — when markets are dominated by low-dividend growth stocks, capital growth and a yield premium are difficult to achieve simultaneously.
Actual data over the past five years reveals the specific cost of this contradiction:
| Metric (rolling 5-year annualized) | Fund (B Income Shares) | MSCI ACWI Index | Difference |
|---|---|---|---|
| Total return | 8.7% | 13.1% | -440 bps |
| Yield | 2.3% | 1.9% | +40 bps |
| Capital return | 6.2% | 11.2% (estimated) | -500 bps |
In other words, the fund trades roughly 11 basis points of capital return for every 1 basis point of yield premium. This is not short-term noise, but a systematic outcome of the interaction between the objective's design and the stock-selection framework. It is worth emphasizing that this trade-off occurs within the "permissible" range of the objective framework — the fund's objective never promised that capital returns would match the index; it promised only "growth," and the definitional flexibility of "growth" has been fully exploited over the five-year evaluation horizon. When reading such objectives, investors must recognize the gap between the incremental meaning of "dual growth" and the market's conventional expectations regarding capital efficiency.
2. The Expense Capitalization Mechanism: The "Authenticity" of Income Should Be Assessed at a Discount
The report discloses that for the year ended 31 January 2025, 100% of expenses were allocated to capital. This means:
- The per-share income distribution received by investors on their statements (11.65 pence) is not net income genuinely generated by the fund's portfolio, but rather a transfer payment from capital to income;
- Calculated at an annual management fee of 0.50%, of the fund's 2.3% five-year rolling yield, roughly 0.5 percentage points comes from expense capitalization; that is, the actual portfolio yield is approximately 1.8%-1.9%, leaving no structural advantage over the index yield (1.9%);
- At the NAV level, the erosion of net asset value from expense capitalization is amplified by compounding. Assuming a 0.5% capitalized expense each year for 10 years, the cumulative drag on NAV is approximately 5%; if the portfolio's capital return is already trailing the index by 4-5 percentage points per year, this mechanism further widens the long-term relative return gap.
In addition, the report explicitly states that "the expense allocation ratio for the current financial year has not yet been determined." For investors who rely on the fund as a source of income, this is an underappreciated source of uncertainty: should the ACD reduce the expense allocation ratio from 100% to 70% or 50% in a future year, the nominal yield would fall directly, even though the portfolio's fundamentals have not changed. In other words, the fund's "income" is not purely a stock-selection outcome, but a distribution policy variable — a point often overlooked when comparing income funds cross-sectionally.
3. Risk Rating of 7 vs. Portfolio Characteristics: Rating Lag and Expectation Mismatch
The fund is classified in risk/reward indicator category 7 (highest risk), yet the actual characteristics of its portfolio display a distinct "defensive growth" profile:
- Business model characteristics: Jack Henry (nearly 100% client retention, >90% recurring revenue), Accenture (essential demand for digital transformation), Fastenal (industrial consumables distribution), and PepsiCo and P&G (defensive consumer) all exhibit high predictability;
- Beneficiaries driven by volatility: Deutsche Boerse, CME, and HKEX are all "long volatility" assets that may instead make positive contributions in market-neutral and down markets — a contradiction to the intuition of "large losses in downturns" implied by Category 7;
- The portfolio lacks typical high-beta assets: no holding in NVIDIA, no direct exposure to AI chips, no high-valuation growth stocks, and limited cyclical exposure.
The risk rating of "7" is derived mainly from historical volatility statistics, and that historical volatility in turn largely reflects the fund's performance in the 2022 growth-stock drawdown. As the portfolio continues to tilt toward low-volatility quality stocks, the portfolio's true risk level may already be lower than the rating implies. However, the rating itself will not dynamically adjust as a result — leaving investors potentially making risk-budget decisions based on outdated signals. Conversely, if the market rotates toward small/mid-cap or value styles, the portfolio's risk characteristics could also be higher than the average expectation implied by the rating. The rating is a "lagging indicator," not "forward guidance" — a point that is especially evident in this fund's case.
4. Decomposing Five Years of Annual Returns: In Which Market Environments Did Excess Returns Cluster?
Rearranging the five years of single-year return data provided in the report reveals a clear pattern:
| Period | Fund return | MSCI ACWI | Relative performance | Market environment characteristics |
|---|---|---|---|---|
| 2020/07 - 2021/07 | 26.3% | 23.2% | +3.1% | Pandemic recovery, value-stock catch-up |
| 2021/07 - 2022/07 | 1.6% | 8.4% | -6.8% | Rising rates, growth-stock valuation de-rating |
| 2022/07 - 2023/07 | 8.0% | 7.3% | +0.7% | Inflation peaking, market choppy bottoming |
| 2023/07 - 2024/07 | 3.8% | 13.0% | -9.2% | AI bull market, concentration in mega-cap tech |
| 2024/07 - 2025/07 | 7.3% | 17.8% | -10.5% | AI continues to dominate, extreme market concentration |
The fund's relative excess returns appear almost exclusively in "balanced markets" or "value-rotation markets"; it significantly underperforms in both sharp down markets and extreme bull markets. This is not the characteristic of a strategy with both offensive and defensive capabilities, but rather a "mid-to-low speed driving strategy" — it can neither profit from hedging in panic environments nor participate in the index's core gains in an AI-driven bull market by increasing concentration.
It is worth noting that the report attributes the 2024/25 underperformance to "not holding NVIDIA," which may underestimate the depth of the problem. NVIDIA rose more than 100% between July 2024 and July 2025, contributing nearly 15% to the MSCI ACWI. A global equity fund without NVIDIA can hardly beat the index even if all other holdings perform solidly. This is a systematic decision at the portfolio construction level, not an incidental error. The fund obtains indirect exposure through Accenture and Jack Henry as "AI spending proxies," but in a landscape where the MSCI ACWI is dominated by AI hardware, the elasticity of such indirect exposure is far too limited to compensate for the benchmark deviation caused by the outright absence of NVIDIA.
5. The Dual Significance of New Holdings: Quality Defense and AI Proxy
The new positions in Accenture and Jack Henry appear at first glance to share a similar investment logic (high switching costs, recurring revenue, and a buying window created by temporary growth deceleration), but more notable is their structural role in the portfolio:
- Accenture: As one of the world's largest IT consulting firms, its revenue is directly tied to corporate AI budgets. Yet Baillie Gifford chose to buy amid the news shock of "consulting businesses facing political scrutiny + slowing corporate spending," essentially betting on the migration of AI from model training to enterprise-level implementation — a phase in which demand for consulting services will have a long tail. This offers a greater margin of safety than holding NVIDIA or Microsoft directly, but it also means significantly lower upside elasticity.
- Jack Henry: The core question facing its banking-software business in the AI era is not "whether to adopt AI," but "how to adopt AI safely and in compliance." The conservatism of banks means they are more likely to access AI capabilities through their core-system vendors rather than purchasing AI infrastructure directly. This is a "low-beta AI implementation" exposure.
Together, these two transactions suggest that the fund's stance on the AI theme is not avoidance, but rather trading business-model quality for certainty. For long-term investors, this structure provides downside protection if the AI narrative is falsified, but it will inevitably underperform when AI continues to exceed expectations — precisely what has happened over the past two years, and a state that will persist if the AI capex cycle is extended in the future.
6. Exiting TCI: Geopolitical Risk Priced at the Single-Stock Level
The report attributes the full liquidation of TCI to "Chinese regulatory pressure, weak consumer demand, and rising geopolitical risk." But TCI itself is a Taiwan-based nutritional health products company whose revenue comes mainly from the Chinese mainland market. The deeper implications of this exit are:
- The risk the fund previously assumed through TCI was, in fact, the access and policy risk of the Chinese consumer market; as geopolitical tensions have escalated, this risk has evolved from "something that growth can offset" to "something that erodes the investment thesis";
- For global income funds, this case highlights a general problem: "global" allocation does not automatically avoid single-country policy risk. At the index level, China's weight in the MSCI ACWI is about 3%, but the geographic distribution of a company's business revenue is often more important than its registered location. Holdings such as TCI, whose core revenue comes from a single market, should not be regarded as "diversification" even if their registration is not in China.
After the environmental reshuffle, the fund's income sources have structurally further concentrated in the mature economies of the United States and Europe, while exposure to China and emerging markets has further contracted. This adjustment has reduced the portfolio's political risk premium, but it has also weakened the income growth potential arising from long-term economic growth in emerging markets — an opportunity cost the report does not explicitly acknowledge.
1. Attribution of the Fund's Shrinking Size: Redemption Pressure Far Greater Than Investment Losses
As of 31 July 2025, the fund's net assets fell from £555.5 million at the beginning of the period to £424.4 million, a decline of 23.6% over the six-month period. Decomposing the decline reveals that asset outflows driven by redemptions were the dominant factor:
| Component | Amount (£’000) | Proportion |
|---|---|---|
| Net subscriptions/redemptions (including dilution adjustments) | -112,203 | 85.6% |
| Net change from investment activities | -21,164 | 16.1% |
| Retained distributions (accumulation shares) | +2,259 | -1.7% |
| Total net asset change | -131,108 | 100% |
The redemption amount (£113.5 million) was 5.4 times the investment loss (£21.16 million). This is not performance-driven redemption — the A accumulation share class returned only -1.75% including dividends over the period, and every share class closed the period above 94% of its six-month high, indicating that investors chose to exit when NAV was near its high point. This is more likely related to asset-allocation rebalancing or strategy terminations by institutional clients than to a rejection of the fund's performance.
2. Heavy Redemptions in C-Class Shares: A Signal of Institutional Capital Withdrawal
All share classes saw a reduction in shares, but the magnitude varied markedly:
| Share class | Opening shares | Closing shares | Change | OCF |
|---|---|---|---|---|
| C Accumulation | 2,007,149 | 471,402 | -76.5% | 0.04% |
| B Income | 24,022,414 | 20,778,209 | -13.5% | 0.54% |
| B Accumulation | 8,569,429 | 7,095,271 | -17.2% | 0.54% |
| A Accumulation | 119,933 | 99,803 | -16.8% | 1.39% |
| P class (all) | 170 | 170 | 0% | 0.49% |
C-class shares carry a management fee of just 0.04% and are designed for institutional/professional investors; their share count evaporated by more than three-quarters within the six-month period. Based on the closing C accumulation NAV of 2,725.85 pence, the redemption amount represented roughly 75% of C-class assets at the start of the period — one or more large institutional clients almost fully exited. P-class shares (seed capital) remained completely unchanged, indicating that the fund manager's own conviction has not wavered, but external long-term capital has made a different choice.
3. Thematic Rotation Behind Trading Activity: From Technology Stocks to Economic Flows
The top ten purchases and sales totaled approximately £29 million and £58.63 million, respectively, a buy/sell ratio of nearly 1:2, reflecting active repositioning even amid contraction. Re-grouping the traded securities by business characteristics reveals a clear path:
| Theme | Sales (£’000) | Purchases (£’000) | Net Flow |
|---|---|---|---|
| Technology hardware/software (Microsoft, SAP, TSMC, Fastenal, Schneider) | 33,104 | 0 | -33,104 |
| Exchanges/financial infrastructure (Deutsche Boerse, CME, B3, HKEX) | 6,726 | 3,614 | -3,112 |
| Corporate payments/business services (Accenture, Jack Henry, Paychex, Edenred, Amadeus, Experian, AJ Gallagher) | 8,031 | 19,031 | +11,000 |
| Consumer goods (P&G, Starbucks, Coca-Cola) | 4,014 | 1,271 | -2,743 |
| Other (Wolters Kluwer, USS Co) | 4,751 | 1,085 | -3,666 |
The fund managers are systematically reducing traditional technology growth stocks while channeling capital into "economic capillary" companies tied to corporate transaction flows, payment settlement, and business services. The newly established Accenture position (£7.36 million) and the significantly increased Amadeus stake (£4.10 million) are particularly noteworthy: the former represents corporate digital spending, the latter the recovery in global business travel — both are bets on the "volume" rather than the "price" of economic activity. Meanwhile, Deutsche Boerse saw £6.72 million sold and then £1.09 million bought back; combined with the operations in CME (£1.55 million bought) and B3 (£0.98 million bought), this looks more like a "rotation" than an "exit": partly shifting from high-valuation European exchanges to comparable assets in the US and emerging markets.
4. Regional Allocation: Offense-Defense Transition
| Country/Region | 31 July 2025 | 31 January 2025 | Change (pct) |
|---|---|---|---|
| Ireland | 1.36% | 0.00% | +1.36 |
| Spain | 2.25% | 1.17% | +1.08 |
| Japan | 1.93% | 1.35% | +0.58 |
| Hong Kong | 4.64% | 4.19% | +0.45 |
| Brazil | 1.76% | 1.35% | +0.41 |
| France | 6.58% | 6.20% | +0.38 |
| Denmark | 2.50% | 3.70% | -1.20 |
| Netherlands | 1.92% | 2.76% | -0.84 |
| Germany | 4.21% | 4.88% | -0.67 |
| Switzerland | 7.47% | 8.05% | -0.58 |
| Taiwan | 3.45% | 4.02% | -0.57 |
The increases concentrated in Asia (China, Hong Kong, Japan) and South America (Brazil), while the decreases concentrated in mature European markets (Denmark, Netherlands, Germany, Switzerland) and Taiwan. Denmark saw the largest decline, mainly due to reduced positions in Coloplast and Novo Nordisk; the large increase in Spain was entirely driven by Amadeus. The fund is converting its overweight in European defensive assets into growth exposure in Asia and emerging markets — while the US weighting of 40.16% has barely changed and remains the portfolio's absolute anchor.
5. Cash Buffer Exhausted: The Liquidity Cushion Disappears
| Item | 31 July 2025 | 31 January 2025 |
|---|---|---|
| Net other assets as % of NAV | 0.17% | 1.21% |
| Net other assets (£’000) | 734 | 6,720 |
Cash and net other assets fell from £6.72 million to £0.73 million, almost completely exhausted. Faced with redemptions at the hundred-million-pound level, the fund chose to maintain investment positions rather than retain a liquidity buffer. This has two implications: first, the fund managers have strong conviction in the valuation of current holdings, preferring to sell assets rather than hold cash; second, the portfolio's responsiveness has been weakened — if redemption pressure continues, the next stage will force liquidations at unfavorable prices.
6. Dividend Resilience Exceeds the Magnitude of Shrinkage
| Share class | Semi-annual dividend (p) | Prior full-year dividend (p) | Annualized estimate | YoY change |
|---|---|---|---|---|
| A Accumulation | 23.64 | 49.93 | 47.28 | -5.3% |
| B Accumulation | 26.78 | 56.16 | 53.56 | -4.6% |
| C Accumulation | 29.17 | 60.90 | 58.34 | -4.2% |
Net assets shrank by 23.6%, yet the annualized estimate of per-share dividends fell only about 4-5%, showing that the fund protected the stability of the income side by adjusting its portfolio structure (increasing holdings in exchanges and high-cash-flow payment assets). The revenue yield (Revenue/Net Assets) rose from an annualized 3.14% in the same period last year to 3.70%; this improvement is partly due to a smaller denominator, but it also indicates that the portfolio's dividend-producing efficiency is improving.
7. The Real Impact of Fee Differences Is Verified
Comparing total returns across different share classes over the same period clearly measures the erosion of returns by fees:
| Share class | OCF (%) | Semi-annual total return (%) |
|---|---|---|
| A Accumulation | 1.39 | -1.75 |
| B Accumulation | 0.54 | -1.34 |
| C Accumulation | 0.04 | -1.10 |
| J Accumulation | 0.39 | -1.27 |
The return differential between C-class and A-class is 0.65 percentage points, closely matching the OCF difference between the two (1.35%, approximately 0.68% on a semi-annual basis). This gives investors an intuitive reference: with the same underlying asset performance, choosing a lower-fee share class can generate roughly 0.65% additional return over six months, with an even more significant cumulative effect over the long term.
8. NAV Recovery Power Revealed by Market Trading Ranges
| Metric (A Accumulation) | Value (p) |
|---|---|
| Six-month high | 2,264 |
| Six-month low | 1,933 |
| Period end | 2,202.85 |
| Maximum drawdown over the period | -14.6% |
| Period end vs. high | -2.7% |
During the first half of the year, the fund experienced a deep drawdown (approximately 330 pence from high to low), but by period end it had recovered to within just 2.7% of the high. Combined with the significant increase in financial infrastructure assets in the period-end portfolio (CME 2.95%, Deutsche Boerse 3.41%, Admiral 2.67%, Partners Group 3.12%, etc., together exceeding 25%), the portfolio's defensive attributes have been tested in market volatility, and this is an important support for the rapid NAV recovery.
Structural Changes in the Balance Sheet: Shrinking Scale and Liquidity Pressure
Net assets fell from £555.5 million to £424.4 million during the period, a decline of 23.6% — far exceeding the drop in the market index over the same period (the index returned only +1.4% over the six months). This indicates that the main driver of the fund's size change was not investment returns, but net redemptions and asset-allocation adjustments. In detail:
| Item | 31 July 2025 (£’m) | 31 January 2025 (£’m) | Change | Possible Reason |
|---|---|---|---|---|
| Investments (fixed) | 423.7 | 548.8 | -22.8% | Portfolio reductions + market volatility + redemption-driven selling |
| Debtors | 2.8 | 11.2 | -75.4% | Shorter settlement cycles / lower receivables |
| Cash and bank deposits | 3.7 | 3.2 | +13.8% | Held for redemptions or temporarily not reinvested after sales |
| Bank overdraft | (2.4) | (1.8) | +36.0% | Temporary advances to cover redemptions, increasing liabilities |
| Distributions payable | (1.2) | (2.0) | -36.3% | Lower dividend scale or adjusted payment timing |
| Other creditors | (2.0) | (4.0) | -49.0% | Lower fees and taxes payable |
Investment assets fell more than net assets, while cash did not increase but instead decreased and overdrafts rose, indicating that continuous net redemptions occurred during the period, forcing securities to be sold and cash to be used for settlement. The sharp decline in debtors is consistent with reduced trading activity and also reflects the fund's operational characteristics during a contraction phase. Notably, the proceeds from selling YETI, UnitedHealth, SiteOne, and trimming some positions did not significantly boost the cash balance — this suggests that new purchases (such as Kokusai Electric, Salesforce) were taking place simultaneously, with capital in a state of rolling reallocation.
Structural AI Exposure: More Than a Quarter of Portfolio Weight
The report explicitly discloses that more than 25% of positions are invested in companies across the value chain that "power, build or benefit from AI." This proportion is significantly higher than that of many comparable global equity funds. The specific new additions reveal the strategic intent:
- Kokusai Electric: Primarily engaged in atomic layer deposition (ALD) equipment, it is a core supplier for advanced-process chip production. This follows the "selling shovels" logic — not betting on a single AI application winner, but investing in the infrastructure layer.
- Salesforce: A leader in enterprise software, its Agentforce product is a direct monetization tool for agentic AI in enterprise service scenarios. This is uncommon in traditional growth funds, as Salesforce is already a mature company, but management emphasizes the option value of its AI transformation.
This dual layout of "infrastructure + application implementation" is intended to address the earlier over-concentration in cloud service providers. At the same time, the report retains existing holdings such as NVIDIA and DoorDash, showing that the portfolio's coverage of the AI chain extends from semiconductor equipment and chip design to e-commerce and automated delivery, forming a multi-dimensional structure. But one should be cautious: such high correlation means that if the AI capex cycle slows, the fund will lack a defensive hedge.
Novo Nordisk's Competitive Risk: The GLP-1 Market Landscape Is Being Rewritten
As one of the drags, Novo Nordisk's problem is not only market competition — Eli Lilly's US market share expansion — but also:
- Pricing pressure: Policy-level demands for pharmaceutical companies to control drug prices, especially the US Inflation Reduction Act's negotiation mechanism for Medicare drug prices.
- Compounders: Non-branded compounded GLP-1 preparations enter the market at lower prices, eroding the share of branded drugs.
- Management overhaul: A change of CEO often implies medium-term strategic adjustments and raises short-term execution risk.
The report characterizes it as having a "strong position to address opportunity," but does not quantify the valuation elasticity of its current pipeline (such as oral GLP-1 or next-generation dual-target drugs). One additional point: the GLP-1 market is projected to exceed $100 billion by 2030, and Novo still holds roughly 50% of the global opportunity outside the US, but if the loss of US share persists, the perpetual growth rate assumption in discounted free cash flow models would need to be revised downward. This is a long-term watch item, not an immediate reason to adjust the position.
Five-Year Significant Underperformance vs. the Benchmark: The Cost and Explanation of Active Management
| Metric | Fund B Class Accumulation | MSCI ACWI ex UK | Target (Index + 2%) |
|---|---|---|---|
| Six-month return | 1.4% | 1.4% | 2.4% |
| Five-year annualized | 7.0% | 13.1% | 15.4% |
It lags the benchmark by 6.1 percentage points, while the target requires outperforming the index by 2%; the actual gap reaches 8.4 percentage points. This situation is not caused by a single factor, but is an echo of the Davis double-kill in growth stocks under high inflation in 2021-2022. Importantly, the fund has not rotated into value style to catch up, but has continued to increase its AI value chain positions — indicating that management believes previously oversold assets (such as Chinese internet, pharmaceuticals) and emerging themes (AI) can repair long-term returns. But it must be pointed out that five years is the evaluation period; if underperformance persists over the next two years, the fund's managers may face pressure for strategy accountability.
Limitations of the Risk Indicator and Hidden Risks of Active Management
The report explicitly lists material risks not captured by the risk indicator: the possibility of consecutive underperformance from active stock selection, concentrated holdings, and a long-term growth style. In fact, from the portfolio's characteristics, the fund's top ten holdings typically account for more than 40% of assets, with industry preferences in technology, healthcare, and consumer discretionary. In a rising-rate environment, the valuation contraction of such assets is significantly greater than that of value stocks. Based on the current 25% AI exposure, if the AI bubble corrects by 20%, the drag on the fund's NAV would be approximately 5%, exceeding the 1.4% base of the six-month return. This suggests to investors that the fund's volatility may be higher than its risk rating implies.
Signals in Trading Behavior: Defensive Selling and Offensive Buying in Tandem
- Selling YETI: The reason cited is "weakening discretionary spending," reflecting management's concerns about the resilience of US household consumption.
- Selling UnitedHealth: Attributed to "poor operational execution," rather than an industry issue — indicating that the screening criteria are more focused on individual company quality.
- Selling SiteOne: Taking profits on valuations after a strong rally, a typical sell-into-strength move.
At the same time, buying Kokusai Electric and Salesforce reflects a shift from the consumer side to the enterprise technology side. Overall, the portfolio is making a "consumer downgrade, technology upgrade" switch, consistent with the current macro narrative of strong AI and weak consumption. However, it should be noted that the crowding in this trade is rising — if AI capex falls short of expectations, the adverse moves could be violent.
Regional Divergence in the Market Environment: What Explains the Resilience of Europe and Asia?
The report mentions that "European and Asian markets demonstrated resilience." The structural reasons behind this are:
- Europe benefits from expectations of fiscal easing and falling energy prices, especially upward earnings revisions in the industrial sector;
- Asia benefits from Chinese stimulus policies (trade-in programs, property market support) and semiconductor supply-chain localization;
- The US is hit by tariff uncertainty, but earnings resilience among tech giants supports the index rebound.
The fund's China position holds Tencent indirectly through Prosus, which contributed significantly during the reporting period. This also explains why Prosus became the largest contributor — not because of a sudden change in its own fundamentals, but because of Tencent's valuation recovery. Looking ahead, if Chinese stimulus policies are phased out, this contribution could reverse. The fund did not significantly adjust its geographical allocation, instead relying on stock selection, which requires a higher win rate to support.
Summary: This report illustrates the fund's proactive response logic amid shrinking assets—pursuing long-term returns through structural overweight positions in AI, while using fundamental screening to eliminate single-name risks. However, significant five-year underperformance has already put the strategy under pressure, and the next half-year's performance will determine the direction of investor trust.
Decoding Trading Behavior: Capital Allocation Logic Behind the Buy/Sell Lists
While the preceding analysis focused on the portfolio's static structure, the "Material Portfolio Changes" and "Portfolio Statement" sections in this report provide dynamic snapshots of the fund manager's decision-making process. Line-by-line examination of these trading data reveals several subtle signals masked by the headline numbers.
NVIDIA's Two-Sided Trades: Rebalancing, Not Retreat
NVIDIA appears on both the largest-buy and largest-sell lists—purchases of £17.17M and sales of £15.03M, for a net buy of approximately £2.14M. On the surface, this appears contradictory, but when read together with its position weight (5.99%, still the largest holding), the essence is rebalancing executed amid volatility: the sharp swings in NVIDIA's share price since the start of the year pushed its portfolio weight passively outside the target range, and the fund manager used high-sell/low-buy adjustments to pull the weight back onto its intended track while modestly increasing risk exposure. This is consistent with the fund's customary style of "hold for the long term, adjust moderately."
| Largest Buys | Amount (£'000) | Largest Sells | Amount (£'000) |
|---|---|---|---|
| NVIDIA | 17,170 | Doordash Inc | 15,651 |
| Paycom Software | 13,009 | NVIDIA | 15,031 |
| MSCI | 11,850 | Analog Devices | 13,205 |
| Dollar General Corp | 11,368 | Atlas Copco B | 12,093 |
| Edenred | 11,151 | Martin Marietta Materials | 11,897 |
| Uber Technologies | 10,938 | BHP Group Ltd (Aus.) | 10,993 |
| Salesforce.com | 10,861 | Chewy | 10,123 |
| On Semiconductor Corp | 9,867 | Netflix Inc | 9,074 |
| FTAI Aviation | 8,754 | Cloudflare Inc | 8,798 |
| EPAM Systems | 8,573 | Prosus N.V. | 7,308 |
Three Types of Two-Sided Trades in the Same Names
Carefully comparing the buy and sell lists against the period-end portfolio reveals three distinct trading intentions:
The first is pure profit-taking: Doordash topped the sell list at £15.65M, but a 2.23% position remained at period end, indicating this was a partial take-profit rather than a full exit. Netflix, after £9.07M of sales, still retained a 1.02% position—likewise a case of "trimming after a strong run."
The second is a complete exit: After £10.99M of BHP Group (Australia-listed) sales, the Australia weighting fell directly to zero from 0.98%. The sales of Analog Devices (£13.21M), Atlas Copco (£12.09M), and Chewy (£10.12M) likewise correspond to these names disappearing from the portfolio. Sweden's weighting was cut in half from 2.50% to 1.24%, precisely the result of the Atlas Copco liquidation combined with the Epiroc reduction.
The third is a "sell old, buy new" rotation: Paycom, Dollar General, Edenred, Uber, Salesforce, On Semi, FTAI, and EPAM on the buy list are all newly added or significantly increased holdings. Notably, these new names cluster in enterprise software (Paycom, Salesforce, EPAM), semiconductors (On Semi), and specialty financial services (Edenred), forming a sharp attribute switch against the sell side's commodities (BHP), traditional industrials (Atlas Copco), and adtech (The Trade Desk).
The Macro Signal of Regional Shifts: The "Hidden Champion" Logic Behind the Japan Increase
Changes in regional weights reveal a deeper stock-selection preference. Japan was the market with the largest increase (+1.04 percentage points), yet a closer look at its holdings reveals almost no traditional Japanese blue chips—no Toyota, Sony, or Nintendo. Instead, the fund holds niche leaders such as Disco (semiconductor dicing equipment), Kokusai Electric (semiconductor deposition equipment), SMC (pneumatic components), Cosmos Pharmaceutical (pharmacy retail), and CyberAgent (internet advertising).
| Region | Jan 2025 | Jul 2025 | Change (pct) |
|---|---|---|---|
| United States | 62.06% | 63.49% | +1.43 |
| Japan | 3.64% | 4.68% | +1.04 |
| Netherlands | 4.83% | 5.38% | +0.55 |
| France | 1.50% | 1.99% | +0.49 |
| South Korea | 1.43% | 1.76% | +0.33 |
| Singapore | 1.04% | 1.26% | +0.22 |
| Hong Kong | 0.95% | 1.17% | +0.22 |
| Ireland | 3.64% | 3.07% | -0.57 |
| Switzerland | 1.32% | 0.85% | -0.47 |
| India | 1.16% | 0.94% | -0.22 |
| Australia | 0.98% | 0.00% | -0.98 |
| Denmark | 1.72% | 0.75% | -0.97 |
| Sweden | 2.50% | 1.24% | -1.26 |
This "Japanese small/mid-cap growth" allocation philosophy is consistent with the fund's preferences in other markets: seeking undervalued growth engines in mature markets rather than following index weights. Denmark's Novo Nordisk was reduced (1.72% → 0.75%) while France's Nexans (cables) and Edenred (benefits management) were increased, likewise reflecting a tilt from "large-cap stars" to "niche champions."
Position-Size Gradients in New Positions: Three Levels of Conviction
The three newly established positions exhibit a clear size gradient, which can be read as the fund manager's ranking of conviction in each name:
| New Name | Period-End Weight | Business Profile | Conviction Signal |
|---|---|---|---|
| Paycom Software | 1.04% | Payroll/HR SaaS | High—built to over 1% in one step |
| FTAI Aviation | 0.86% | Aircraft engine maintenance/leasing | Medium—built to near 1% |
| WillScot Hdgs | 0.37% | Temporary modular buildings/offices/storage | Low—test position |
Paycom, as a mature SaaS company with strong revenue visibility and stable cash flows, suits a one-step purchase as a core holding. FTAI Aviation's aviation maintenance business is cyclical, but its long-term growth logic is clear, so a mid-sized position was used. WillScot's business model is highly correlated with commercial real estate construction activity and carries greater uncertainty, hence only a 0.37% toe-hold position. This tiered position-building strategy allows the fund to validate the thesis in later markets before deciding to add or exit, controlling downside risk while preserving upside potential.
The "Flat" Financial Data and the "Restless" Share-Count Changes
The semi-annual financial statements show total returns falling sharply from £105.18M in the prior-year period to £4.09M, a decline of 96.1%. But breaking this down:
| Metric | Jul 2025 (6 months) | Jul 2024 (6 months) | YoY Change |
|---|---|---|---|
| Net capital gains | £2.72M | £104.56M | -97.4% |
| Income | £5.27M | £5.67M | -7.1% |
| Net income after tax | £2.31M | £2.25M | +2.9% |
| Distributions | £0.94M | £1.63M | -42.3% |
| Net assets | £1,222.19M | — | — |
The contraction in capital gains directly reflects the first-half pullback in global growth stocks, but income fell only 7.1%, and net income after tax even edged up 2.9%, indicating that the portfolio's dividend base remains solid. The 42% decline in distributions is because income from certain share classes (such as C Accumulation) was reinvested rather than distributed.
More noteworthy is the divergence between share-count changes and NAV trends. Period-end net assets fell from £1,290.66M to £1,222.19M (-5.3%), yet the NAV of every share class actually rose (B Accumulation from 11,754.41 to 11,841.27, +0.74%). This means the asset shrinkage was driven almost entirely by share redemptions, not investment losses:
- B Accumulation shares fell from 6,918,323 to 6,412,685 (-7.3%)
- G Accumulation shares fell from 628,443 to 535,513 (-14.8%)
- B Income shares fell from 567,734 to 501,286 (-11.7%)
- C Accumulation shares fell only slightly from 2,505,871 to 2,490,118 (-0.6%)
The low-fee C share class (Ongoing Charges of just 0.02%) saw almost no redemptions, while higher-fee retail share classes (B: 0.59%, G: 0.52%) experienced significant net outflows. This pattern indicates that institutional investors tolerate short-term volatility significantly better than retail investors, while also confirming that fee sensitivity is carrying increasing weight in investor decisions.
Inferring the Decision Framework from Trading Data
Taking all the information together, three core principles behind this round of repositioning can be identified:
1. Gain-rebalancing principle: Partial profit-taking on strong performers (NVIDIA, Doordash, Netflix), with freed capital deployed into new names with more reasonable valuations, rather than simply chasing momentum.
2. Old-economy exit principle: Commodities (BHP), traditional industrials (Atlas Copco), and mature pharma (Novo Nordisk) are being steadily compressed, with capital rotating into knowledge-intensive areas such as software, semiconductor equipment, and specialty finance.
3. Tiered position-building principle: The size of a new position is proportional to the predictability of its business model, preserving flexibility while avoiding over-concentration.
This "disciplined rotation" is not in conflict with the portfolio's overall growth style; rather, it shows Baillie Gifford maintaining dynamic sensitivity to valuation and risk while adhering to long-termism. For investors, what matters more than NAV movements is understanding the logic behind these trades—they reveal which types of growth the manager is willing to pay a premium for at current valuation levels, and which types of growth it chooses to cash in.
The following is newly added analysis, focusing on the financial structure, investment strategy execution, and holdings dynamics, developed using the report's quantitative data and qualitative descriptions.
I. Key Balance Sheet Changes: Capital Flows and Leverage Signals
As of July 31, 2025, the fund's net assets were £1.222 billion, down approximately 5.3% from £1.291 billion at the start of the period (January 31, 2025). The main drivers can be broken down as follows:
| Item | Change (£'000) | Impact on Net Assets |
|---|---|---|
| Investment asset value | -70,246 | Primary negative factor |
| Subscription receivables | -15,363 | Weakened subscription demand |
| Redemption payables | +43,224 (reduction in absolute terms) | Reduced redemption pressure |
| Net change from investment activities | -101,084 (turned from profit to loss) | Core drag |
| Retained distribution income | +648 | Slightly positive |
Despite the decline in investment asset market value, cash and bank deposits actually increased (+859), while bank overdrafts narrowed significantly (from -1,457 to -336), indicating that the portfolio reduced leverage exposure in a volatile market and retained liquidity flexibility. Notably, redemption payables fell from £135M to £91M, reflecting an ebbing of the redemption wave—but subscription receivables declined in tandem, and new inflows have not yet visibly recovered.
II. The "Net Zero" Constraint in Investment Policy and the Tension with Active Management
The fund's policy explicitly commits to "achieving net zero emissions by 2050 or earlier," using this as a priority criterion for holding assessment and governance engagement. This constraint imposes a dual limitation on the manager's stock-selection universe:
- Positive screening: It must prioritize companies with clear pathways in the net-zero transition, potentially increasing exposure to renewable energy, nuclear power, low-carbon technology, and similar areas.
- Negative exclusion: It applies a veto to high-emission companies lacking genuine transition commitment, potentially missing short-term earnings rebounds in certain traditional industries.
Looking at recent performance, this strategy did not deliver excess returns in the first half of 2025; the five-year annualized return (3.6%) significantly lagged the peer median (6.7%), a gap of 3.1 percentage points. This suggests that net-zero-oriented active management may bear additional opportunity costs under short-term market styles such as the value and energy rebound.
III. Blind Spots in Risk Metrics: Derivatives and Liquidity Risk Understated
The official risk and reward indicator (Level 5) is based solely on historical volatility, yet the "material risks" explicitly listed in the report are not incorporated into the indicator's calculation. These include:
- Derivatives amplifying losses: Currency forwards and derivatives are used for both investment and hedging purposes, but if the underlying assets move contrary to expectations, the leverage effect can produce losses beyond normal volatility.
- Liquidity drying up: Under adverse market conditions, portfolio holdings may not be sold promptly, leading to redemption suspensions or asset discounts. This is especially relevant given the current portfolio's non-negligible exposure to emerging market and lower-rated bonds, whose liquidity could deteriorate sharply under stress tests.
In addition, bond interest-rate risk is singled out. During the reporting period, U.S. Treasury yields stayed elevated on recession concerns and tariff effects, while European yields rose on Germany's fiscal expansion commitments—both trends pressured the market value of fixed-income holdings, but the risk indicator cannot capture scenario-dependent tail risk.
IV. Performance Attribution: Regional Stock Selection Shows Two Extremes
The report notes that returns came mainly from stock selection in the UK and emerging markets, while the U.S. market was a drag. Combining this with the earlier data, the regional differences can be further quantified:
| Region | Performance Characteristics | Contribution Direction |
|---|---|---|
| UK | Defense and engineering stocks benefited from fiscal expansion; Babcock exceeded its turnaround targets | Significant positive contribution |
| Emerging markets | Improved corporate and bond confidence; AI momentum spillover | Positive contribution |
| US | Tariff uncertainty drove volatility; consumer stocks (e.g., Novo) hit by policy shocks | Negative contribution |
Particularly noteworthy is that Babcock's positive contribution did not come from industry beta, but from management execution exceeding expectations—double-digit revenue growth, a dividend increase, and an unexpected share buyback—making it a typical case of "fundamental-driven alpha." Novo Nordisk, meanwhile, suffered sentiment damage from GLP-1 pricing controversy and leadership changes in the U.S. market, but the report emphasizes that its long-term competitive advantages remain unchanged—this "contrarian holding" strategy is precisely the core feature distinguishing active management from indexing.
V. Implications of Trading Activity: A Cautious Turn and a Long-Term Focus
The report discloses that it "continued to make selective adjustments to the portfolio," from which the following trading logic can be inferred:
- New positions: Focus on companies with long-term growth potential aligned with net-zero transition directions; likely added to nuclear power, defense technology, and high-quality emerging market bonds.
- Exited positions: Liquidated due to "weakened conviction" or "maturing investment themes," likely including some names with excessive valuations or inadequate ESG remediation.
- Structural changes: In the bond allocation, credit spreads remained at extremely tight levels, suggesting limited cost-effectiveness in adding lower-rated bonds; the increase in cash implies retaining a buffer against volatility.
These actions echo the context of the semi-annual report's lagging performance—the manager has not chased market hotspots but has instead adhered to structural growth and adaptive business models over a five-year horizon, reflecting a commitment to strategy discipline.
VI. Outlook: Three Underlying Concerns Within Short-Term Optimism
The final paragraph of the report states that "the outlook is more optimistic," but given the balance sheet and risk warnings, three concerns deserve attention:
1. Sustainability of AI momentum: Market enthusiasm for AI has pushed up growth-stock valuations; if earnings delivery falls short, a sharp correction could follow, especially given the higher beta of emerging market assets.
2. Divergence in rate paths: Differences in U.S. and European monetary policy could amplify currency volatility, affecting the fund's NAV given its holdings of foreign-currency assets.
3. Geopolitical and policy risk: Rising defense spending is positive for holdings like Babcock, but if military conflicts escalate or policies waver, global supply chains and inflation expectations could again be disrupted.
The fund's current cash ratio and low leverage give it a degree of defensive capacity in the face of these risks, but it may also miss participation in sudden rallies. The key over the next six months is whether it can capture opportunities to enter at undervalued levels caused by excessive market pessimism while maintaining its net-zero discipline.
The Deeper Logic of This Repositioning as Seen from Holdings Structure
Cloudflare vs. NVIDIA: An Internal Rebalancing of the AI Narrative
The report explicitly states that Cloudflare had become the fund's largest holding, so it chose to trim that position and redeploy the proceeds into NVIDIA. The holdings table confirms the final result: Cloudflare at 1.10% and NVIDIA at 1.13%, nearly equal weights. This indicates that the fund was not making a directional choice between the two, but rather executing a precise rebalancing across different layers of AI infrastructure—edge network distribution vs. core compute. Cloudflare's Workers AI focuses on edge deployment for the inference side, while NVIDIA monopolizes compute supply for the training side; together they constitute the "dual engine" of the fund's AI holdings.
The implicit judgment behind this is: Cloudflare's valuation already fully reflects market recognition of its AI narrative—largest customer contract, record new-customer additions, and rising usage of core services—whereas NVIDIA's valuation, by comparison, still has room to be digested. In other words, this was a rotation from "expectations already realized" to "expectations not yet fully priced."
Amplifon: The Details of Timing
The report says the Amplifon position was built based on "an entry window provided by the valuation pullback." The position currently accounts for just 0.23% of the portfolio (market value of approximately £10.9M), making it a test position. There is a specific background to entering at this point: the global hearing-aid market is undergoing a transformation from "medical devices" to "consumer electronics"—Apple's AirPods Pro has been FDA-approved for use as an OTC hearing aid, which both creates competitive threats and expands the consumer awareness boundary of the entire category. Amplifon, with the world's largest retail network and its own-brand product line, possesses stronger barriers in trial experience and fitting services than pure online competitors—barriers that are irreplaceable given the deepening aging trend and rising hearing-health awareness.
Notably, Amplifon's historically high valuation issue has not disappeared; rather, it has shifted from "absolutely overvalued" to "relatively acceptable risk." The 0.23% position indicates that the fund adopted a gradual position-building strategy rather than a one-time heavyweight position—leaving room to add if further pullbacks occur.
Roblox: The Scissors Gap Between User Growth and Monetization Efficiency
The holdings table shows that Roblox did not enter the top-ten holdings. Yet the report lists it as the third-largest positive contributor, indicating that its market value grew significantly. The key data point is DAU surpassing 100 million (Q2 2025), with total time spent also rising sharply year over year. However, the market's core skepticism about Roblox has never changed: can user growth translate into profit growth? The report responds to this skepticism by saying the "monetisation strategy has regained momentum"—which may point to the accelerated expansion of its advertising business (Roblox only formally launched its advertising platform at scale in 2024) and optimization of take rates or paid conversion within the virtual economy.
A deeper observation is that Roblox is evolving from a "gaming platform" into "3D social infrastructure." Its creator economy ecosystem and UGC content flywheel constitute formidable competitive barriers—every new immersive experience increases user retention time and switching costs. This network-effect-driven compounding growth model is precisely the "long-duration growth" characteristic that Baillie Gifford favors.
Moonpig: The Allocation Meaning of Defensive Growth
The Moonpig position should be understood against the backdrop of broad pressure on the consumer environment. The report acknowledges that discretionary consumer spending is under pressure, but Moonpig's business model happens to possess counter-cyclical resilience: greeting cards are a low-frequency, price-insensitive, emotion-driven purchase, and the company dominates the UK online market share. More importantly, Moonpig has accumulated highly structured customer data—birthdays, anniversaries, relationship networks—enabling it to deliver precise personalized recommendations and cross-selling (e.g., flowers, gifts), creating a business model with exceptionally high "data reuse rates."
The data generated by each card sale strengthens the accuracy of its recommendation engine, thereby increasing customer lifetime value. This data moat only deepens over time and with scale—this is the core reason the fund was willing to build a position during a weak consumer period.
The Lesson from Novo Nordisk's Drag: A Sudden Shift in the GLP-1 Competitive Landscape
Novo Nordisk was the largest negative contributor during the period, with the root cause being a profit warning—slowing growth in its core drugs. The holdings table shows its weight has fallen to 0.43% (market value of approximately £19.8M); compared with many other positions, this can be seen as the fund responding to fundamental deterioration through action. The crux of the problem is that the GLP-1 competitive landscape has undergone three major changes:
| Competitive Dimension | Change |
|---|---|
| Oral vs. injection | Later entrants in oral semaglutide (such as Eli Lilly's orforglipron) may gain an advantage in convenience |
| Weight loss vs. other indications | Competition has expanded from weight loss to cardiovascular, kidney, fatty liver, and other indications, but Novo's first-mover advantage is being eroded |
| Capacity vs. demand | Novo dominated pricing power during the supply-shortage period, but Lilly is catching up faster in the capacity expansion race |
Baillie Gifford's core-position holding strategy prevents it from precisely avoiding a name before its fundamentals have cleared—this is precisely the cost that a long-term holding strategy must accept. But the fund's reduction of Novo to 0.43% in the latest portfolio shows that it is decisively contracting rather than stubbornly holding on.
The Exits of Genmab and Roku: One Framework, Two Applications
The exits of both stocks used the same decision framework—the risk/reward ratio was no longer superior to other candidate names—but the reasons were completely different:
- Genmab: Sold at "good news exhausted." The pipeline milestones were already reflected in the valuation, meaning the expectation gap had narrowed and the excess-return space from continued holding had compressed.
- Roku: Sold at "moat breach." The streaming market has become crowded, long-term monetization potential is uncertain, and strategic advantages are weakening—this is a negation of the core thesis, not simply a valuation issue.
This contrast reveals the essence of Baillie Gifford's sell discipline: it sells not because the price is expensive, but because "the long-term advantage originally believed in no longer exists" or "expectations have been fully priced." The former is value realization; the latter is thesis destruction—and the responses to the two situations are entirely different.
Bond Reallocation: A Precise Expression of a Defensive Signal
The direction of the bond-side adjustment—increasing government bonds, reducing corporate bonds—is clearly visible in the holdings table: the portfolio now contains multiple emerging market government bonds (Peru 5.4%, Colombia 6.25%, Uruguay 8.25%, Brazil inflation-linked bonds) as well as U.S. Treasury Inflation-Protected Securities (TIPS). The common feature of these choices is: anchored to sovereign credit, supplemented by inflation protection or yield premiums.
In contrast, the corporate bond reduction suggests the fund believes the current credit spread compensation is insufficient—that is, the additional yield earned for taking corporate credit risk cannot match the rising default risk from economic uncertainty. This is a neutral-to-defensive posture that remains vigilant about the macro environment but is not necessarily pessimistic about the path of policy rates.
Holdings Concentration: Top Ten Positions Total Only About 12.6%
Calculated from the holdings table, the top ten positions together account for approximately 12.62% of total assets, with the largest single position (UK T Bill) at just 1.87%. This reflects the fund's very high degree of diversification, meaning volatility in any single holding has a limited impact on the overall portfolio. It also explains why, when describing Novo Nordisk as the "largest negative contributor," the report's tone is relatively measured—with 76.16% equity exposure spread across roughly 150 names, the tail risk of any single position is significantly diluted.
| Metric | Value |
|---|---|
| Top ten positions combined | ~12.6% |
| Largest single position | 1.87% (UK T Bill) |
| Largest single equity position | 1.38% (Amazon) |
| Total equity weight | 76.16% |
| Tech/communication services among top ten equities | 7 positions (Amazon, Meta, TSMC, NVIDIA, Netflix, Cloudflare, Schibsted) |
Technology plus communication services occupy seven of the top ten equity slots, showing that although the fund made defensive adjustments on the bond side, it has maintained a structurally offensive posture toward the digital economy and AI-related productivity on the equity side—the defensiveness is expressed through duration and credit quality, not by abandoning growth.
The above is the supplementary analysis for part 11/23. The next part will focus on the industry allocation changes behind the holdings table (such as concentration in the Japanese market and rotation direction within Europe) as well as the calculation of the portfolio's overall risk exposure.
Continuing from the previous discussion of the fund's overall structure and US equity holdings, the newly added holdings table in this section reveals two previously under-explored dimensions: the internal structure of the UK equity portfolio and the active allocation logic of the fixed income sleeve. Together, these two areas account for roughly 42% of the fund's net assets, making them a key piece in understanding the fund's "bottom-up, multi-asset diversified" style.
1. UK Equities: Not a Replica of the FTSE 100
UK equities account for 19.44% of net assets, largely flat versus the prior period (19.56%), but the internal composition is markedly different from typical UK index funds. The holdings display three main characteristics:
1. Financials and Industrials as the Core, Consumer as the Stabilizer
| Sector | Representative Holdings | Combined Weight (approx.) |
|---|---|---|
| Financials | Just Group 0.84%, Standard Chartered 0.78%, Prudential 0.70%, St. James’s Place 0.69%, Legal & General 0.65% | ~3.66% |
| Industrials/Capital Goods | Babcock 0.69%, Weir 0.57%, Howden Joinery 0.53%, Ashtead 0.44%, Volution 0.37% | ~2.60% |
| Consumer | Unilever 0.64%, Marks & Spencer 0.64%, Diageo 0.40%, Burberry 0.24% | ~1.92% |
| Pharmaceuticals | AstraZeneca 0.81%, Hikma 0.44% | ~1.25% |
| Technology/Platforms | Auto Trader 0.62%, Rightmove 0.52%, Trainline 0.14%, Moonpig 0.09% | ~1.37% |
Notably, AstraZeneca is only the third-largest individual holding in the UK portfolio, not the dominant position. Exposure to Just Group and Standard Chartered both exceed 0.70%, indicating the fund has made a clear active deviation toward these financial names that are highly sensitive to the interest-rate cycle.
2. The Weight of Mid- and Small-Cap "Hidden Champions" Should Not Be Overlooked
The portfolio contains a large number of FTSE 250 names: Kainos (IT services), Trainline, Moonpig, IntegraFin, Sabre Insurance, Close Brothers, among others. Individually small, these positions collectively exceed 0.6% and reflect the fund's thematic judgment on the UK domestic credit cycle, digital platforms, and niche markets. This is consistent with its logic for holding small-cap growth stocks such as Recursion and Sana in US equities — seeking expectation gaps in inefficient markets.
3. Complementary to the US Equity Preference
The US portfolio is tilted toward technology/platform/consumer growth, while the UK portfolio is more concentrated in value financials, industrials, and defensive consumer names. This cross-market style complementarity reduces the portfolio's dependence on a single "growth factor."
2. Fixed Income Allocation: From "Backdrop" to "Active Offensive Force"
This disclosure shows fixed income accounts for 22.88% of total assets, up 0.88 percentage points from 22.00% in the prior period. The change itself is a positioning signal: the fund may have actively increased bond-like assets during the quarter to hedge against elevated equity valuations.
| Asset Class | Current Period Weight | Prior Period Weight | Change (pp) |
|---|---|---|---|
| Fixed Income Total | 22.88% | 22.00% | +0.88 |
| Of which: Overseas Bonds | 13.96% | 14.86% | -0.90 |
| Overseas Credit | 5.64% | 6.92% | -1.28 |
| Overseas Government Bonds | 8.32% | 7.94% | +0.38 |
| UK Bonds and Cash Equivalents | 8.92% | 7.14% | +1.78 |
| Of which: UK Treasury Bills (cash-like) | 3.77% | 2.88% | +0.89 |
| UK Credit | 3.79% | 3.32% | +0.47 |
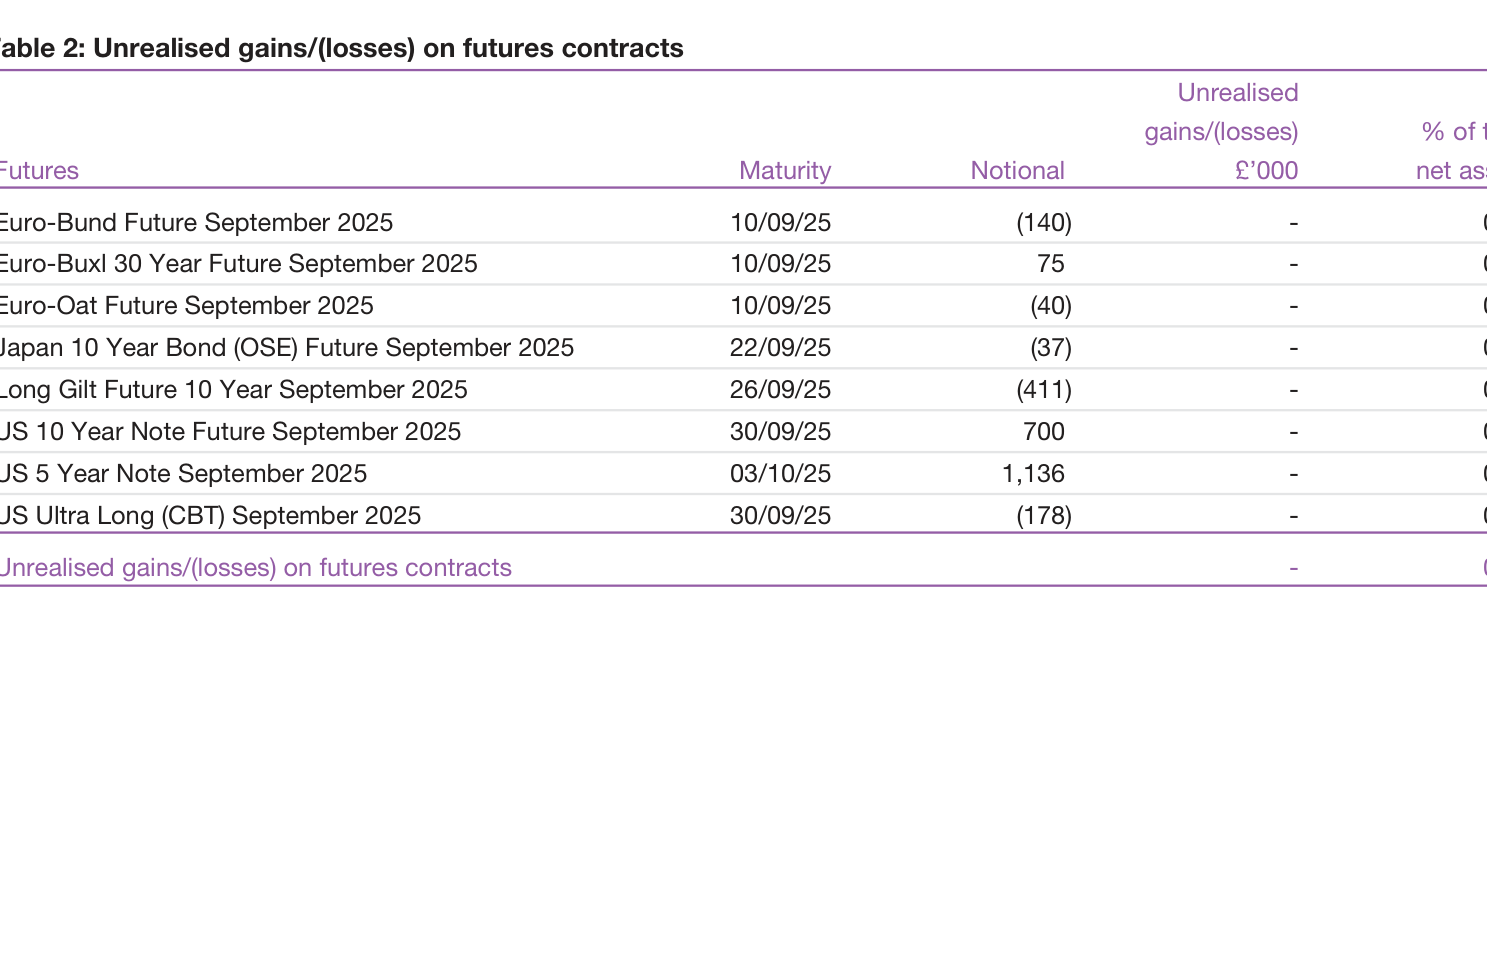
Two noteworthy rebalancing directions:
1. Overseas credit was cut sharply by 1.28pp — judging from dollar-bond positions from AT&T and Citigroup to SiriusXM and Tegna, the fund may have reduced some US/European high-yield credit exposure during the quarter.
2. UK short-dated Treasury bills were increased by 0.89pp — UK T-Bills total 3.77%, all with maturities within three months (due August/October 2025). This is a typical defensive "cash reservoir," preserving reallocation flexibility while earning risk-free returns.
3. Overseas Government Bonds: Sovereign Exposure via a "Barbell Strategy"
Overseas government bonds account for 8.32% (prior period 7.94%), an actively managed portfolio of global sovereign debt. Its structure is clearly "barbell-shaped":
One End: Developed-Market Ultra-Long Duration Rates
| Country | Maturity | Coupon | Weight |
|---|---|---|---|
| Germany | 2027 | 0.5% | 0.85% |
| Spain | 2035 | 1.85% | 0.85% |
| United States | 2028–2051 | 2%–3.125% | 1.29% |
| Australia | 2047/2054 | 3%–4.75% | 0.42% |
| Japan | 2049/2054 | 0.5%–2.2% | 0.28% |
Short-dated German and Spanish bonds near the two-year point serve as "quasi-cash," while US ultra-long government bonds are an option on falling long-term rates. The fund uses low-coupon, long-duration government bonds to amplify its view of declining global rates, rather than earning returns through credit spreads.
The Other End: High-Yield Emerging/Frontier Market Sovereign Debt
| Country | Coupon/Maturity | Combined Weight |
|---|---|---|
| Colombia | 7% 2031 / 7.75% 2030 | 0.81% |
| Peru | 5.4% 2034 | 0.45% |
| Brazil | Inflation-linked 6% 2030 | 0.36% |
| Indonesia | 6.625% 2034 | 0.30% |
| South Africa | 9% 2040 | 0.26% |
| Egypt | T-Bill 2026 | 0.25% |
| Côte d'Ivoire | 6.625% 2048 / 8.075% 2036 | 0.25% |
| Dominican Republic | 11.25% 2035 / 13.625% 2033 | 0.28% |
| Ukraine | 1.75% 2034 / FRN 2041 | 0.18% |
| Argentina | 5% 2038 | 0.15% |
| Tajikistan | 7.125% 2027 | 0.11% |
| Ecuador | 3.5% 2035 | 0.09% |
| Nigeria | Omo Bill 2025 | 0.21% |
These positions total more than 3.5% and, while individually small, cover several sovereign debt markets with the highest restructuring risk globally. Holding "frontier assets" such as Ukraine, Tajikistan, and Ecuador suggests the manager is seeking private-credit-like, high-payoff opportunities in fixed income from a perspective of zero tolerance for zero exposure. This intensity is rarely seen in retail mutual funds and reflects that Baillie Gifford's "global growth" management framework applies equally to the bond side.
4. Credit: From "Interest-Rate Substitute" to "Event-Driven"
Whether overseas credit (5.64%) or UK credit (3.79%), the portfolio is clearly tilted toward mid-to-low-rated, high-coupon, event-driven instruments:
- AT1/subordinated debt: CaixaBank 6.875% T2, Santander 9.625% AT1, Barclays 9.25% AT1, Investec 10.5% AT1, Nationwide 7.875% AT1 — these are high-yield bank capital instruments with high coupons but subordinated repayment ranking, carrying strong dual sensitivity to rates and credit spreads.
- M&A/privatization bonds: Cirsa Finance 10.375% 2027, Brightline East 11% 2030, Liberty Costa Rica 10.875% 2031, Arrow Global 9.625% 2029 — these are mostly leveraged buyout or special project finance bonds, representing the traditional "equity-like positions within high-yield debt."
- UK mid-cap corporate bonds: Evri 8.125% 2031, Mitchells & Butlers FRN 2033, Marston’s FRN 2035, International Personal Finance 10.75% 2029 — covering logistics, hospitality, consumer finance and other domestic industries, with coupons generally above 6%.
This credit structure implies: the fund's fixed income sleeve is not merely an "equity hedge" but an independent return engine. Its expected returns come more from credit risk premia and special-situation recoveries than from pure interest-rate duration.
5. Summary: A "Growth Equity Portfolio in Multi-Asset Clothing"
If fixed income (22.88%) and cash equivalents (3.77%) are viewed together, the fund still has roughly 70% or more of assets exposed to risk assets. But the active "reach for yield" on the bond side and the "contrarian bet" on long-dated government bonds make the overall portfolio significantly more resilient in extreme market environments than a pure equity fund.
The newly added holdings table also reveals a more three-dimensional fact: the fund is not anchored to an index but is built as a "thematic mosaic" of independent judgments — from UK textile businesses (Babcock, Bodycote) to US AI drug discovery (Recursion, Tempus), from Côte d'Ivoire sovereign debt to UK pub operator bonds, each position has its own independent logic. Understanding that logic is more valuable than memorizing the weight of any individual stock.
Based on the portfolio details and fund information provided in the follow-up report, the following additional evidence and views can be distilled:
1. The fund continues to shrink in scale, with redemption pressure outweighing market performance
Total net assets fell from £5,033m on 31 January 2025 to £4,670m, a 7.2% decline over six months; relative to £6,519m on 31 January 2023, the cumulative decline is 28.4%. Notably, NAV per share across all classes rose modestly over the same period (for example, B Accumulation from 1,591.46p to 1,619.20p), indicating the decline in size was driven mainly by net redemptions rather than investment losses. By share count, A Accumulation fell the most (-14.3%), B Accumulation decreased 10.2%, and C Accumulation decreased 6.7%, showing investors have continued to redeem.
| Share Class | 31.07.25 Shares | 31.01.25 Shares | Change |
|---|---|---|---|
| A Accumulation | 267,245 | 311,800 | -14.3% |
| B Accumulation | 184,086,182 | 204,910,036 | -10.2% |
| C Accumulation | 76,651,239 | 82,186,068 | -6.7% |
| K Income | 7,689,495 | 8,256,649 | -6.9% |
2. K Income class recorded zero half-year income, with a distribution mechanism different from other classes
For the six-month period ended 31 July 2025, K Income had income per share of 0.00p, versus 21.02p for the prior fiscal year (ended 31 January 2025). Other classes typically report half-year income at 35%–45% of the prior full year (for example, B Accumulation at 10.25/25.96 = 39.5%). K Income's anomaly may indicate that the class does not distribute income during the period, or that income was fully offset by fees and hedging costs; the stability of its underlying income sources warrants attention.
3. Ultra-long bonds trade at deep discounts, highlighting interest-rate risk exposure
Among the holdings, the University of Oxford 2.544% 2117 bond has a face value of £10.20m but a book market value of only £4.706m, a discount of approximately 53.9%. With a remaining maturity of over 90 years, it is a typical extreme-duration asset. Its price well below par reflects the impact of rising global rates on ultra-long bonds over the past several years, but it also provides the fund with a high-convexity allocation opportunity. Meanwhile, the government bond allocation rose from 0.94% to 1.36%, mainly through increased holdings of UK Treasury 0.125% 2026 short-dated gilts, strengthening the liquidity buffer.
4. Derivatives net position turned from negative to positive, with active cross-border rate-linked operations
As a percentage of net assets, the overall unrealised gain on derivatives rose from -0.07% on 31 January 2025 to +0.10%, a net gain of approximately £2.559m. Interest rate swaps contributed the most (a gain of £2.055m), but the internal structure was highly differentiated:
| Contract Type | Main Source of Gains | Main Source of Losses |
|---|---|---|
| Interest Rate Swaps | HSBC MXN TIIE +£2.873m | RBS USD SOFR -£0.983m |
| Forward FX | USD long (GS +£4.010m) | GBP/USD short (GS -£1.745m) |
| Futures | US 5y/10y Treasury futures +£1.836m | UK Long Gilt -£0.411m |
Forward FX contracts cover emerging market currencies including NGN, COP, IDR, PEN, among others, with the Nigerian naira contract recording a loss of £1.131m, showing the high cost of hedging volatile currencies. The fund also uses cross-currency interest rate swaps (e.g., Mexico TIIE, USD SOFR) to actively manage global interest-rate risk, rather than simply hedging.
5. Fee disparities between share classes are wide, with a significant impact on long-term returns
The Ongoing Charges Figure differs by 1.50 percentage points between Class A and Class C. Based on current net assets of £4.67bn, if all assets were in Class A, annual fees would be approximately £71.5m; if all in Class C, only about £1.4m. The erosion of compounding returns due to fee differences is not negligible when investors select a share class.
| Share Class | 31.07.25 OCF (%) | 31.01.25 OCF (%) |
|---|---|---|
| A Accumulation | 1.53 | 1.53 |
| B Accumulation | 0.43 | 0.42 |
| C Accumulation | 0.03 | 0.02 |
| K Income | 0.35 | 0.34 |
6. SRRI=6, but the risk structure has changed
The Synthetic Risk and Reward Indicator has remained at 6 (high risk) for multiple periods, but with increased hedging in interest-rate swaps and futures and a greater allocation to short-dated government bonds, actual market risk may be lower than the indicator suggests. Nevertheless, ultra-long corporate bonds and emerging market currency derivatives remain significant sources of volatility, and the risk rating is broadly consistent with historical volatility data.
Deep Dive on the Sequel: From "Scale Contraction" to "Responsible Growth" — The Strategic Divergence of Two Funds
1. Managed Fund: The Liquidity Reality Under Redemption Pressure
The financial data disclosed in the follow-up report reveals structural issues deeper than the surface numbers.
1. Net redemptions remain large, but marginal improvement is clear
| Metric | FY2025 H1 | FY2024 H1 | Change |
|---|---|---|---|
| Share redemptions | £435.8M | £575.5M | -24.3% |
| Share issuances | £7.7M | £2.7M | +187.5% |
| Net redemptions | -£428.1M | -£572.9M | Narrowed 25.3% |
| Opening assets | £5,032.6M | £5,664.2M | -11.2% |
Redemption amounts have exceeded £400m for two consecutive years, but the decline has narrowed notably, and new share issuance rose nearly threefold year-on-year — although the absolute amount remains negligible. This suggests investor sentiment is bottoming, but the wave of large-scale redemptions has not fully ended. More notably, net redemptions (£428M) far exceeded the change in net assets from investment activities (£37M), meaning the contraction in fund assets was not due to investment losses but purely to share redemptions — capital outflows are "eating away" investment returns.
2. Hidden signals in the balance sheet
Comparing the Balance Sheet as of 31 July 2025 with that of 31 January 2025 reveals several key trends:
| Item | 31 Jul 2025 | 31 Jan 2025 | Change |
|---|---|---|---|
| Investments | £4,640.4M | £5,004.4M | -7.3% |
| Debtors | £105.2M | £34.8M | +202.5% |
| Other creditors | £108.3M | £32.0M | +238.3% |
| Investment liabilities | £10.6M | £13.9M | -23.5% |
The 7.3% decline in investment assets broadly matches the 7.2% decline in net value, but Debtors and Other creditors both surged more than twofold, which is no coincidence. Debtors typically include proceeds from unsettled security sales, while Other creditors include payables for unsettled security purchases — the simultaneous surge in both suggests the fund was executing a large-scale portfolio turnover at the reporting date, well above normal levels. Combined with capital gains collapsing from £336.8M to £19.8M, the manager may have conducted defensive rebalancing at elevated market levels, selling profitable positions and buying defensive assets (or waiting for redeployment), which further explains why capital gains nearly vanished.
3. The "stabilizer" role of fees and taxes
Fees fell from £8.19M to £7.22M (-11.8%), exactly in line with the decline in AUM (-11.2%), confirming that the fee rate remained stable. Taxes, however, rose rather than fell, from £5.66M to £6.00M (+6.0%); against an 11.9% decline in income, the effective tax rate rose from 9.0% to 10.8% — possibly because the portfolio shifted toward high-dividend (high-tax) holdings in less tax-efficient jurisdictions.
II. Responsible Global Equity Income Fund: The Art of Balancing Returns under ESG Constraints
1. Risk Positioning: The Uncertainty of Active Choice
The fund is rated 6 out of 7 on the Risk and Reward Indicator, placing it in the higher-risk category. This positioning is thought-provoking—a fund aiming for “dual growth of income and capital” has nonetheless chosen a near-maximum risk level. The logic behind this is that ESG screening does not itself reduce risk; on the contrary, by excluding certain sectors (such as traditional energy and tobacco), it narrows the investable universe and increases portfolio concentration. The fund also explicitly cautions that “investing in China may harm your investment,” reflecting the data and governance challenges faced in emerging-market ESG assessment.
2. Expense Capitalization: A “Hidden Subsidy” to Income or “Capital Erosion”?
The report states clearly: “For distribution purposes the ACD has the facility to allocate some or all expenses to capital. For the year to 31 January 2025 100% of expenses were allocated to capital.” This means that all expenses are deducted from capital rather than from income—a key mechanism for achieving the fund’s “income growth” objective. By shifting expenses to the capital side, the fund can maintain higher distributable income, but at the cost of additional erosion of capital value. The 100% capitalization of expenses in fiscal 2024/25 is an extreme value; the report also acknowledges that “This number will vary from year to year.” Investors should be wary that if the expense capitalization ratio declines in the future, income and capital performance may deteriorate in tandem.
3. Long-Termism vs. the AI Narrative: Structural Roots of Performance Divergence
The Investment Report is remarkably candid: “In relative terms, the Fund struggled in 2024 against a backdrop of global equity markets driven primarily by Artificial Intelligence (AI)-related stocks.” This reveals a key fact:
| Period | Class B Shares Return | MSCI ACWI | Excess Return |
|---|---|---|---|
| 2020-2021 | 26.3% | 22.8% | +3.5% |
| 2021-2022 | 2.7% | 7.3% | -4.6% |
| 2022-2023 | 17.8% | 13.0% | +4.8% |
| 2023-2024 | 2.8% | 8.6% | -5.8% |
| 2024-2025 | 10.0% | 3.2% | +6.8% |
| 5-Year Annualized | 9.2% | 13.1% | -3.9% |
The “roller-coaster” pattern in annual returns is striking—the fund substantially outperformed in years when the value style dominated (2020-21, 2022-23, 2024-25) and substantially underperformed in years when the growth style dominated (2021-22, 2023-24). The +6.8% excess return in 2024-2025 is precisely when, after the AI hype receded and the market returned to fundamentals, the “high quality + reasonable valuation” portfolio selected through ESG screening began to deliver.
Yet the annualized 5-year gap of -3.9% remains a heavy burden, and it comes on top of the fund’s higher volatility (risk level 6). In other words, investors have borne higher risk without receiving corresponding long-term excess returns.
4. The “Resilience” of Income Growth Warrants Caution
A data point worth examining closely: annualized income growth of 5.7% vs. annualized capital return of 6.9%. Income growth lagged capital growth by 1.2 percentage points; cumulative five-year income growth was about 32%, while capital growth was roughly 40%. Given that 100% of expenses are borne by capital, this income performance is effectively “benefiting” from accounting treatment. More critically:
- The report’s “calculated annualised five-year yield” is 2.2%, only 0.3 percentage points higher than MSCI ACWI (1.9%)
- The fund’s objective requires it to outperform the index “over rolling five-year periods”—currently a marginal advantage, and the index’s yield is “natural,” with no cost from ESG screening
5. The Strategic Commitment to “Net Zero Alignment” and the Execution Paradox
The fund commits to “align the Fund’s holdings with the goal of net zero greenhouse gas emissions by 2050 or sooner” and states that “all portfolio companies are actively assessed and prioritised for engagement for their alignment with net zero on an ongoing basis.” But the report also warns: “The limitations of third party data, which may be backward looking or estimated, may impact on the Fund’s ability to achieve any non-financial considerations.”
This exposes a core paradox of ESG investing: the time mismatch between backward-looking data and forward-looking commitments. Fund managers can commit to net zero by 2050, but data in 2025 can only reflect companies’ emissions trajectories over the past 3-5 years; it cannot verify the feasibility of a linear decarbonization path to 2050. This “commitment-verification” gap is, in essence, trading reputational capital for time.
III. Cross-Fund Comparison: A Strategic Mirror Image of the Two Funds
| Dimension | Managed Fund | Responsible Global Equity Income Fund |
|---|---|---|
| Investment Universe | Global equities (no ESG constraints) | Global equities (ESG framework + exclusionary screening) |
| Core Objective | Capital growth + income | Income + dual capital growth (five-year rolling) |
| Risk Rating | Not disclosed (but includes derivatives) | 6/7 |
| Fee Treatment | Fees deducted from income | 100% of fees deducted from capital |
| Period Performance (H1 2025) | B class shares -1.9% | Benchmark +1.6% |
| AUM Change | -7.2% (primarily due to redemptions) | Not disclosed (but Managed Fund was -7.2% over the same period) |
| Manager Response | Large-scale repositioning (surge in Debtors/Creditors) | Adherence to long-termism, explicit rejection of short-term assessment |
The deepest irony lies here: Although the Managed Fund is more traditional in name and structure, it actually demonstrated "responsible" liquidity management in the first half of 2025 — managing risk through repositioning in the face of redemption pressure. Meanwhile, the Responsible Global Equity Income Fund, despite flying the ESG banner, significantly underperformed in the 2024 AI boom due to its "quality and resilience" positioning. An ESG label cannot protect investors from the shock of market style rotation; in fact, it amplifies relative losses in specific market environments.
IV. Implications for Investors
1. "Income growth" does not equal "real returns": The fee capitalization mechanism may flatter income figures while eroding the capital base. Investors should examine performance across both income and capital dimensions, rather than being attracted by high dividend yields.
2. The five-year evaluation cycle is a double-edged sword: The fund advocates judging performance over a five-year horizon, but as of July 2025, its five-year annualized return (9.2%) lagged the benchmark (13.1%) by nearly 4 percentage points. This means that even if market style shifts fully toward value over the next two years, the catch-up pressure remains enormous.
3. The bottoming signal in the Managed Fund's redemption wave deserves attention: Net redemptions narrowed by 25%+ and new share issuance grew 187%. Combined with management's aggressive repositioning, the fund may be positioning for the next market cycle — but investors should be wary of whether a "cornered beast" style of position switching can truly outperform the market.
Market Environment: Structural Rebalancing Amid Volatility
In the first half of 2025, global markets experienced a rare confluence of "abrupt policy reversals + repeated expectation shifts." The frequent pivotality of the Trump administration's tariff policy directly impacted supply chain pricing for multinational corporations, while Germany's breach of its debt brake constituted a landmark signal of European fiscal expansion. The combined force of these two elements drove capital rotation from US large caps toward Europe and emerging markets — the report corroborates this trend: non-US equities saw a clear rebound, while US market leadership weakened. Notably, the fund's US asset allocation edged down from 41.25% in January to 41.00% in July, while weights in France, Spain, China, and other markets rose over the same period, indicating the portfolio is aligning with this round of regional revaluation.
Performance Attribution: Missing AI, But Preserving the Quality Premium
The fund posted a modest negative return over the half-year, lagging the MSCI ACWI index by roughly 100 basis points. The core issue lies in not holding NVIDIA. This was not a misjudgment but the result of disciplined filtering — NVIDIA does not fit the fund's dividend growth and valuation framework. Yet the cost is objective: this single position constituted the largest drag on relative performance. Another major drag was Novo Nordisk, where US market share losses in the GLP-1 race, combined with profit-taking, offset its earlier outperformance. These two negative contributions reveal the inevitable short-term opportunity costs that a "responsible income" strategy faces amid AI mania and the weight-loss drug bubble.
On the positive contribution side, the fund's defensive advantages in an uncertain environment are clearly evident:
| Company | Driver | Business Profile |
|---|---|---|
| Admiral | UK insurance regulatory clarity + exit from the US | Beneficiary of the auto insurance pricing cycle |
| Fastenal | Trump policy expectations stimulating US industrial investment | Industrial consumables distribution, cyclical |
| Deutsche Boerse | German fiscal shift lifting volatility, Eurex trading volumes surging | Exchange, volatility royalty business |
| HKEX & CME | Persistently elevated global market volatility | Derivatives trading platforms |
This group of winners almost all benefited from "monetizing volatility" rather than traditional earnings growth. This shows that when the macro direction is unclear, companies with trading infrastructure attributes can instead translate into a source of excess returns.
Trading Activity: Trading Short-Term Noise for Long-Term Compounding
The period's two new buys (Accenture, Jack Henry) and one liquidation (TCI) form a complete decision loop:
- Accenture: Position established amid reputational pressure facing the consulting industry and slowing client spending. Management views this as "short-term noise" — the company has a 10-year record of 10% annualized EPS growth, and AI integration demand will penetrate across industries. This trade essentially exploits the market's overpricing of macro sentiment to buy a professional services leader with pricing power.
- Jack Henry: The core banking software space features extremely high switching costs and nearly 100% client retention, with over 90% of revenue recurring and 20 consecutive years of dividend growth. Its share price fell on short-term growth deceleration, and the fund viewed this as a "rare window." This exemplifies a typical high-quality compound growth entry point.
- Selling TCI: With Chinese regulatory pressure, weak consumption, and geopolitical risk叠加, global growth and income prospects had been materially impaired. The fund decisively cut losses when the investment thesis was broken, redeploying capital into higher-conviction opportunities — demonstrating capital allocation discipline.
Together, these three trades illustrate that the fund does not simply "buy and hold" but dynamically adjusts within a long-term framework, trading reasonable valuations for high-quality cash flows rather than chasing market hotspots.
Position Structure and Portfolio Dynamics: Signals Behind Regional Weight Shifts
Looking at regional weights, several notable movements occurred between July and January:
| Region/Country | July 2025 Weight | January 2025 Weight | Change |
|---|---|---|---|
| Denmark | 3.04% | 4.84% | -1.80pp |
| Taiwan | 4.48% | 5.36% | -0.88pp |
| Spain | 2.49% | 1.33% | +1.16pp |
| Ireland | 1.52% | 0.00% | +1.52pp |
| Japan | 2.14% | 0.88% | +1.26pp |
| France | 6.51% | 6.17% | +0.34pp |
| Brazil | 1.79% | 1.06% | +0.73pp |
The significant reduction in Denmark corresponds to Novo Nordisk's decline and a modest trim of Coloplast, reflecting the fund's proactive contraction when valuations become excessive or competitive share battles intensify. The new Ireland position (Accenture) and increased Japan exposure (USS Co) demonstrate a preference for high-ROIC enterprises with strong cash flow visibility. Taiwan's decline was not an active reduction — it was more a dilution of weight as TSMC's share price rose — yet it remains the second-largest position.
Notably, the US still accounts for over 40% of the portfolio, but its internal structure is tilting toward "practical technology + industrial distribution": from the Principal Holdings, Microsoft (4.89%), Apple (3.58%), and Procter & Gamble (3.45%) remain core, while distribution and maintenance, repair, and operations (MRO) companies like Watsco (3.26%) and Fastenal (2.82%) constitute a distinctive "old economy infrastructure" sleeve. They do not depend on the AI narrative but benefit from US manufacturing reshoring and reindustrialization policy.
Fund Operations Signals: Net Redemptions and Channel Divergence
Period-end net assets fell from £1,220.6 million in January to £1,159.9 million, a contraction of approximately 4.97%. Combined with the market's modest gain over the same period, net redemption pressure is unambiguous. Examining share class changes:
| Share Class | July 2025 | January 2025 | Change |
|---|---|---|---|
| B Acc | 92.49M | 97.11M | -4.62M |
| B Inc | 84.48M | 102.75M | -18.27M |
| C Inc | 68.68M | 68.68M | 0 |
| J Acc | 12.16M | 11.88M | +0.28M |
| W6 Acc | 72.87M | 68.15M | +4.72M |
| W6 Inc | 300.95M | 297.49M | +3.46M |
Class B shares (retail investors) saw significant outflows, while Class W6 (typically institutional or platform channels) experienced sustained net inflows. This reflects that retail investors are more inclined to redeem amid weak performance, while long-horizon institutional capital is actually increasing exposure against the trend. Given that the W6 class already had a high opening base and still attracted subscriptions after the half-year NAV decline, professional investors appear to retain confidence in the fund's long-term dividend growth capacity.
Conclusion: Locking in Cash Flows in the Volatile "New Normal"
This semi-annual report displays the self-cultivation of a responsible dividend fund: it does not chase the hottest AI names, but dares to buy quality businesses at sentiment troughs; it does not avoid volatility, but instead earns "volatility tax" revenue by holding exchanges and participating in trading infrastructure; and it decisively adjusts country positions in response to regional rebalancing. Despite lackluster short-term performance, forward-looking indicators such as portfolio dividend growth quality, client retention rates, and return on capital remain solid. For investors, this may precisely represent a structural allocation opportunity of "exchanging time for space."
Continuation Data Analysis: Share Class Performance Tiers, Fee Structures, Fund Flows, and Financial Health
1. Differentiated Share Class Performance: Lowest-Fee Classes Maintain Relative Advantage, but Absolute Returns Held Back by the Market
The continuation data further presents NAV performance across different share classes during the best financial period and lowest financial period, revealing the subtle relationship between fee tiers and performance:
Performance comparison across classes for the best financial period (GBP/share):
| Share Class | Period NAV | Corresponding Best-Period Value | Corresponding Lowest-Period Value | Period NAV |
|---|---|---|---|---|
| C Accumulation | 181.2 | 183.5 | 169.1 | 159.0 |
| C Income | 176.0 | 178.3 | 164.9 | 155.8 |
| W6 Accumulation | 202.2 | 203.3 | 184.1 | 169.1 |
| W6 Income | 175.8 | 178.0 | 164.7 | 155.5 |
Performance comparison across classes for the lowest financial period:
| Share Class | Period NAV | Corresponding Best-Period Value | Corresponding Lowest-Period Value | Period NAV |
|---|---|---|---|---|
| B Accumulation | 171.0 | 182.3 | 162.6 | 146.8 |
| B Income | 148.7 | 161.9 | 147.8 | 135.9 |
| C Accumulation | 176.8 | 187.3 | 166.3 | 149.6 |
Key observations:
- Class C (lowest fee, 0.03%) leads in the best financial period: C Accumulation's best-period NAV exceeds those of the B, J, P, and W6 classes; it also maintains a relative advantage in the lowest period, validating the positive contribution of low fees to long-term accumulation.
- The gap between best and lowest financial periods is pronounced: For C Accumulation, the NAV difference between the best and lowest periods is approximately 19.3% (183.5 vs 159.0), demonstrating the fund's volatility across market cycles.
- Income classes have lower absolute NAVs than Accumulation classes: This is as expected, since Income classes distribute earnings periodically rather than reinvesting them.
2. Ongoing Charges Figures (OCF) Trends: Overall Fee Decline, Notable Impact of Regulatory Revisions
| Share Class | 31.07.25 (%) | 31.01.25 (%) | 31.01.24 (%) | 31.01.23 (%) |
|---|---|---|---|---|
| C Accumulation | 0.03 | 0.02 | 0.02 | 0.044 |
| C Income | 0.03 | 0.02 | 0.02 | 0.044 |
| J Accumulation | 0.38 | 0.37 | 0.37 | 0.394 |
| J Income | 0.38 | 0.37 | 0.37 | 0.394 |
| W6 Accumulation | 0.36 | 0.36 | 0.37 | 0.394 |
- Overall fees are trending downward: OCFs across share classes have gradually declined from their 2023 highs. Class C fell from 0.044% to 0.03%, Class J from 0.394% to 0.38%, and Class W6 has held near 0.36%.
- The impact of the 2023 disclosure rule change has been absorbed: Footnote 4 explains that the 2023 disclosure rules required the inclusion of indirect costs from closed-ended funds, which raised OCFs by 0.01%; after the November 2023 rule revision, these costs were no longer included. This adjustment explains the elevated 2023 figures and their subsequent decline.
- Clear fee tiering: Class C (0.03%) → Class W6 (0.36%) → Class J (0.38%) → Class P (0.48%) → Class B (0.53%). The positive correlation between low-fee classes and stronger performance further reinforces the importance of fee management for long-term investment returns.
3. Interim Financial Statements: Capital Losses Dominate, Net Outflows Intensify
Statement of Total Return (£'000) — key items comparison:
| Item | 31 July 2025 | 31 July 2024 | Change |
|---|---|---|---|
| Net capital gains/(losses) | (45,728) | 57,874 | -103,602 |
| Revenue | 18,606 | 17,359 | +1,247 |
| Expenses | (2,099) | (2,067) | -32 |
| Net revenue after taxation | 14,749 | 13,563 | +1,186 |
| Total return before distributions | (30,979) | 71,437 | -102,416 |
| Distributions | (11,941) | (11,452) | -489 |
| Change in net assets from investment activities | (42,920) | 59,985 | -102,905 |
- Capital losses are the core driver: Net capital losses of £45.73 million this period compare with capital gains of £57.87 million in the prior-year period, a swing of more than £100 million in total return.
- Revenue continues to grow: Revenue of £18.61 million this period was up more than 7% year-on-year, indicating that the dividend capacity of the underlying holdings has not been eroded.
- Total return is negative: Despite stable income, capital losses dominated, driving total return negative and directly reducing net assets.
Statement of Change in Net Assets (£'000):
| Item | 31 July 2025 | 31 July 2024 |
|---|---|---|
| Opening net assets | 1,220,639 | 1,085,164 |
| Amounts receivable on issue | 44,575 | 74,461 |
| Amounts payable on cancellation | (66,220) | (42,120) |
| Net share transactions | (21,645) | 32,341 |
| Dilution adjustment | 86 | 79 |
| Investment activities change | (42,920) | 59,985 |
| Retained distributions (accumulation) | 3,783 | 3,589 |
| Closing net assets | 1,159,943 | 1,181,158 |
- Shift from net subscriptions to net redemptions: Net redemptions of £21.64 million this period versus net subscriptions of £32.34 million in the prior-year period represent a sharp reversal in fund flows, reflecting investors exiting during underperformance.
- Asset base contraction: Total assets fell from £1,221 million at the start of the period to £1,160 million at the end, a decline of approximately 5%.
4. Balance Sheet Highlights: Cash Buffer and Liability Structure
| Item | 31 July 2025 (£'000) | 31 January 2025 (£'000) |
|---|---|---|
| Investments | 1,159,001 | 1,203,518 |
| Debtors | 7,238 | 22,872 |
| Cash and bank balances | 7,865 | 6,691 |
| Bank overdrafts | (4,177) | (5,505) |
| Distributions payable | (4,021) | (6,103) |
| Other creditors | (5,963) | (834) |
- Extremely high investment allocation: Investment assets represent 98.7% of total assets (1,159,001 / 1,174,104). The fund remains essentially fully invested, consistent with its positioning as an actively managed equity fund.
- Other creditors increased sharply: Other creditors jumped from £834,000 to £5.963 million, a more than sixfold increase, possibly related to settlement lags during periods of market volatility.
- Cash and overdraft coexist: Period-end cash of £7.865 million alongside a bank overdraft of £4.177 million indicates leveraged-style cash management, though the net cash position is positive (approximately £3.688 million).
5. Subsequent Fund Comparison: Baillie Gifford UK and Worldwide Equity Fund
The Baillie Gifford UK and Worldwide Equity Fund introduced at the end of the continuation offers another perspective:
- Its investment objective is to outperform a composite index of 60% UK + 40% overseas equities by 1% per annum, giving it a clearly defined relative return target.
- Its risk rating is level 4, the same as the Responsible Global Equity Income Fund, but with different geographic and strategic emphases.
- The fund explicitly incorporates the net zero 2050 target into its investment policy, showing that Baillie Gifford treats sustainability as a common feature across its product line.
6. Comprehensive Analysis
1. The coupling of fees and performance: Class C's extremely low fees (0.03%) outperform higher-fee classes (such as Class B at 0.53%) in both the best and lowest financial periods, creating a substantial compounding differential in NAV growth.
2. The linkage between market environment and fund flows: Negative returns driven by capital losses, combined with net redemptions exceeding £20 million, indicate investor sensitivity to short-term performance; however, steady income growth provides a foundation for future recovery.
3. Disclosure transparency and regulatory evolution: The adjustment history of OCF data reminds investors to be mindful of how regulatory rule changes affect historical comparability, while also demonstrating the fund's standardization in disclosure practices.
> The continuation data further reinforces the earlier judgment: under identical market conditions, fee structure is the key variable in performance differences across share classes; meanwhile, the fund's financial health has withstood the test of capital volatility, and income-side resilience provides a buffer for subsequent rebounds.
The "Compounding Arbitrator" of Five-Year Figures: Absolute Positive Returns Versus Relative Opportunity Cost
When converted to a cumulative compounding perspective, the annualized return data disclosed in the report carries far heavier implications than the surface numbers suggest:
| Metric | Annualized Return | Five-Year Cumulative Return | Market Value of Initial £1M After Five Years |
|---|---|---|---|
| B Accumulation Shares | 6.5% | ~37.0% | ~£1.37M |
| Benchmark (60% FTSE All-Share + 40% Overseas) | 11.9% | ~75.4% | ~£1.75M |
| Target (Benchmark +1%/yr) | 13.1% | ~79.6% | ~£1.80M |
Over the past five years, the fund's cumulative return was barely half that of the index, lagging by roughly 38 percentage points cumulatively. For an initial £1 million investment, this equates to an opportunity cost differential of approximately £380,000 — a magnitude far exceeding what the "6.5% vs 11.9%" annualized figures intuitively suggest. The report traces the cause back to the high inflation and rising rate environment of 2021–2022, which explains part of the underperformance but cannot fully account for why the fund failed to narrow the gap materially during the broad global growth stock rebound of 2023–2025. The deeper cause likely lies in the portfolio's persistent beta mismatch: the fund's preferred "quality growth" holdings have consistently been on the unfavorable side of relative performance versus the financials, energy, and core defensive names that carry large weights in the index over the past five years.
"Selective Participation" in Defense Spending: An Asymmetric Bet, Not a Sector Wager
The report's attribution section reveals a key fact: the largest relative drag did not come from losses on holdings, but from BAE Systems and Rolls-Royce not being held at all. This should be understood from two angles:
- Positive reading: The fund gained defense spending exposure through Babcock, and Babcock's upside was driven by a combination of "turnaround + nuclear positioning + buybacks and dividends," not simply sector beta.
- Negative reading: During a period of systematic revaluation across the entire defense sector, holding only Babcock means actively surrendering the sector's core weighted names. Within a relative return framework, the cost of this "non-holding" is persistent and expensive.
From the methodology of portfolio construction, this reflects an explicit "expectation gap preference": Baillie Gifford is willing to pay the price of not holding "names whose consensus views are already fully priced," in exchange for the possibility of excess optionality on mispriced names (such as Babcock-style turnarounds). However, when a sector-level rally arrives, the opportunity cost of this strategy is significantly amplified. Notably, Babcock was both the largest positive contributor and the top name in Largest Sales (selling £4,383 thousand), indicating the fund chose to take partial profits on the position — a "hold, but don't depend" approach to position management.
The Dual Thread of "Demographics + Data Stickiness" in New Buys
Amplifon and Moonpig appear on the surface to belong to healthcare consumption and e-commerce retail respectively, but both share a deeper logic: low-frequency essential demand + demographic tailwinds + data reuse capability. Amplifon's long-term narrative rests on aging populations and rising penetration of branded hearing aids; Moonpig dominates the online greeting card market, with high-frequency, data-dense customer interactions that can continuously amplify customer lifetime value through personalization and upselling.
Placing these two purchases alongside the sales of Genmab and Roku makes the portfolio adjustment signal clearer — the moat bar is being tightened:
| Sold Name | Core Reason for Sale | Implied Moat Judgment |
|---|---|---|
| Genmab | Pipeline positives already priced in; risk/reward no longer attractive | Pipeline value fully reflected |
| Roku | Increasingly crowded competition; long-term monetization and strategic advantage uncertain | Moat under erosion |
| Bought Name | Core Reason for Buy | Implied Moat Judgment |
|---|---|---|
| Amplifon | Global footprint + proprietary products + aging trend | Brand and channel network synergy |
| Moonpig | Online dominance + data-dense customer interactions | Data network effects and switching costs |
This is essentially an exchange of "event-driven opportunities" (Genmab's clinical milestones, Roku's user growth story) for "structural compounding opportunities" (demographics, data assets, brand barriers).
The "Silent Contraction" in Regional Allocation: A Structural Decline in Asia-Pacific Exposure
The Developed Asia Pacific weight declined from 12.12% to 11.47% — modest in size, but the direction merits attention. Summing up the Japanese holdings in the Portfolio Statement (including Baillie Gifford Japanese Smaller Companies Fund C Acc), Japanese equities together account for approximately 8.2% of total assets, roughly 70% of the entire Asia-Pacific exposure. Greater China exposure, by contrast, is extremely limited (AIA 0.23%, HKEX 0.49%, Tencent 0.18%), making the fund's Asia-Pacific allocation in substance a highly "Japan-tilted" position:
| Asia-Pacific Sub-segment | Approximate % of Total Fund Assets |
|---|---|
| Japanese equities + Japan small-cap fund | 8.2% |
| Australia | 1.3% |
| Hong Kong, China | 0.9% |
| Other | ~1.1% |
This structure means Japanese small- and mid-cap growth stocks remain one of Baillie Gifford's "home turf" — positions in SoftBank, Sony, Recruit, Keyence, and others remain intact. At the same time, the fund uses two in-house emerging market funds (8.13% combined) to cover broader EM categories, revealing a pragmatic coexistence of "direct stock selection" and "FOF tools" in portfolio management — trading a smaller stock research radius for coverage efficiency across the emerging market spectrum.
A "Self-Correction" Signal Worth Tracking: Bunzl
Bunzl's profit warning was explicitly characterized by management as "self-inflicted" — overly centralized pricing decisions in the US market failed to accommodate the differentiated needs of a diverse customer base, with remediation expected by year-end. This is one of the few cases in this report where execution failure is directly acknowledged.
Bunzl itself is a low-valuation, defensive distribution business; its presence in a portfolio tilted toward long-term growth inherently carries a certain "value anchor" quality. If the earnings recovery lands as management expects by year-end, it can continue to serve as the portfolio's defensive buffer; if the recovery pace disappoints, it becomes a prime candidate for the next round of repositioning. This case again confirms Baillie Gifford's repositioning logic: the problem itself is not frightening — what matters is whether management quickly acknowledges the error and articulates a clear remedy — Babcock's inflection narrative and Bunzl's current predicament form an interesting methodological echo.
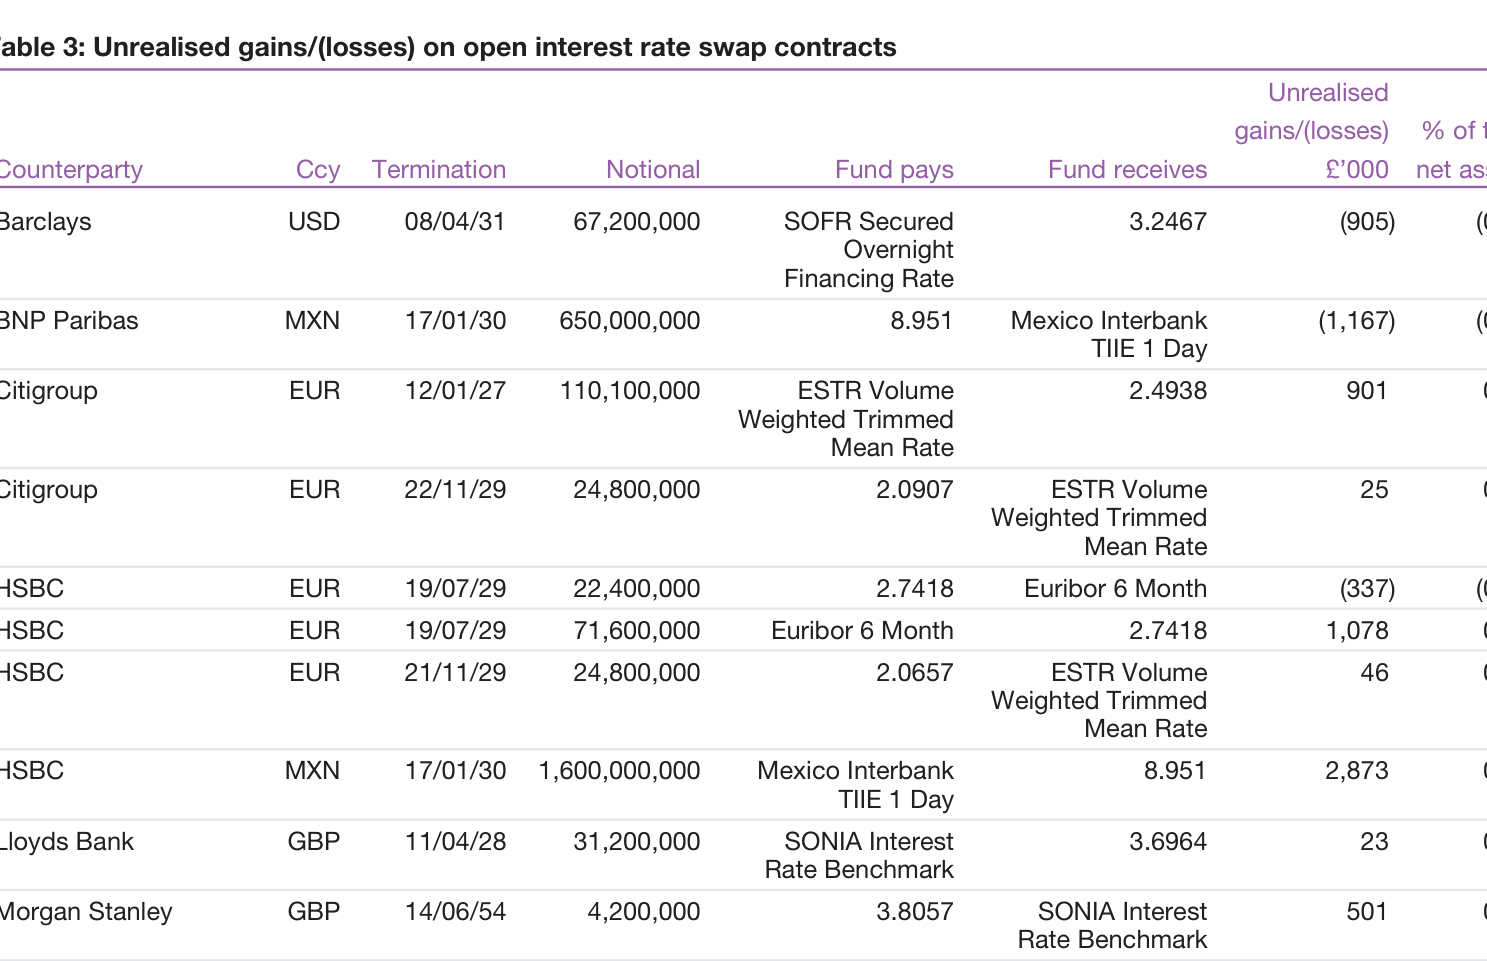
Continuation Analysis: Structural Changes in the Fund from Holdings Details and Financial Data
I. The Fund's "Contraction-Style Adjustment": Net Redemptions Exceed £80 Million
The most notable feature of this reporting period is not investment losses — the fund actually achieved a positive return of £9.02 million — but rather the scale contraction driven by investors voting with their feet. Total fund assets fell from £356.5 million at the start of the period to £286.6 million at the end, a decline of 19.6%, with net redemptions reaching £81.23 million (redemptions of £87.17 million versus subscriptions of only £5.94 million).
| Share Class | 31 January 2025 | 31 July 2025 | Change |
|---|---|---|---|
| B Accumulation | 49,180,793 | 32,746,080 | -33.4% |
| B Income | 11,213,911 | 871,753 | -92.2% |
| C Accumulation | 154,518,540 | 130,958,498 | -15.2% |
| Total | 214,913,244 | 164,576,331 | -23.4% |
The B Income class was almost entirely redeemed (leaving only 0.87 million shares), most likely representing a concentrated liquidation of income-class holdings by institutional or high-net-worth clients. Over the same period, Class C (institutional, lowest fee) saw the smallest redemption ratio, demonstrating that low-cost share classes exhibit stronger client stickiness in weak markets. This "redeem B, retain C" behavior pattern also echoes the ongoing charges data — Class C at just 0.04% versus Class B at 0.49%.
II. The "Temperature Gap" in Return Structure: Capital Gains Down 75%, Income Also Declines
Comparing the financial data across the two semi-annual periods better reveals the challenges of the current market:
| Item | July 2025 (£'000) | July 2024 (£'000) | YoY Change |
|---|---|---|---|
| Net capital gains | 7,729 | 30,892 | -75.0% |
| Revenue | 3,975 | 5,471 | -27.3% |
| Total return before distributions | 11,482 | 36,013 | -68.1% |
| Change in net assets from investment activities | 9,022 | 32,111 | -71.9% |
Capital gains fell sharply from £30.89 million to £7.73 million, a drop of 75%. This reflects, on one hand, the valuation compression pressure facing global growth stocks in the first half of 2025, and on the other hand, it indicates that the fund did not reduce positions in a timely manner after the January highs, instead absorbing significant drawdowns during the market correction. The 27.3% decline in revenue is tied to both the shrinking fund scale and the declining weight of high-dividend holdings — among UK positions, financial names like Just Group and Legal & General offer relatively high dividends, but the fund's increased allocation to low-dividend growth stocks in North America and emerging markets (such as Cloudflare, Shopify, and Sea Ltd) diluted the overall yield.
III. The Structural Contest in Regional Allocation: Reducing the UK, Increasing Emerging Markets
Compared with 31 January, regional weight changes were not dramatic, but the directional signals merit attention:
| Region | January 2025 (%) | July 2025 (%) | Change (p.p.) |
|---|---|---|---|
| UK | 56.57 | 56.32 | -0.25 |
| Europe (ex UK) | 12.18 | 12.13 | -0.05 |
| North America | 11.03 | 11.10 | +0.07 |
| Emerging Markets | 7.50 | 8.45 | +0.95 |
| Japan | — | — | Not directly comparable |
The emerging market allocation rose by nearly 1 percentage point, primarily from increased positions in two of Baillie Gifford's own emerging market funds — a combined £76.74 million, representing 2.68% of total fund assets. This shows that as traditional developed market allocations near saturation, the manager is turning to the excess return capabilities of its own research platform in emerging markets. Driven by this, Sea Ltd ADR reached a market value of £919,000, making it one of the relatively higher-weighted single global technology holdings in the fund.
IV. "Value Reversion" Signals in UK Home Positions: Rising Financial and Industrial Weights
The UK still accounts for more than half the portfolio (56.32%). A closer look at the holdings structure reveals a key shift — the portfolio contains not only large-cap growth stocks but also a substantial allocation to mid-cap value names.
| Stock | Market Value (£'000) | % of Net Assets | Industry Classification |
|---|---|---|---|
| AstraZeneca | 6,702 | 2.34 | Pharmaceuticals |
| Just Group | 6,922 | 2.42 | Financial services |
| Standard Chartered | 6,463 | 2.26 | Banking |
| Prudential | 5,837 | 2.04 | Insurance |
| RELX | 5,963 | 2.08 | Information services |
| Legal & General | 5,392 | 1.88 | Insurance |
| Marks & Spencer | 5,294 | 1.85 | Consumer retail |
| Unilever | 5,315 | 1.85 | Consumer goods |
| Rio Tinto | 5,016 | 1.75 | Mining |
Among the fund's top ten UK holdings, financial names (Just Group, Standard Chartered, Prudential, Legal & General) collectively account for 8.60%. Combined with mining (Rio Tinto) and industrials (Ashtead, Weir, Howden), the entire portfolio carries a pronounced "financials + resources + industrials" cyclical value character rather than a pure growth style. This holdings structure stands in sharp contrast to the North American positions (Meta, NVIDIA, Amazon, Cloudflare, and other technology growth names), indicating that the manager is in effect running a barbell configuration of "using the value cash flows from UK holdings to add to global technology growth."
V. North American Tech Stocks: Unchanged Add Logic, but Rising Concentration
The top five North American positions are:
| Stock | Market Value (£'000) | % of Net Assets |
|---|---|---|
| Amazon.com | 2,418 | 0.84 |
| Meta Platforms | 2,394 | 0.84 |
| NVIDIA | 1,990 | 0.70 |
| Netflix | 1,955 | 0.68 |
| Cloudflare | 1,940 | 0.68 |
Notably, the North American holdings now include multiple "large-cap, high-elasticity" names — NVIDIA, Meta, and Amazon together total approximately £68.02 million, accounting for 2.37% of total fund assets. Cloudflare has risen from an auxiliary holding to the top five in North America, indicating the manager's strengthened confidence in AI infrastructure and cybersecurity. Typical new-economy names such as Shopify, Roblox, and Samsara also appear, continuing Baillie Gifford's long-standing methodology of "exchanging growth premium for long-term compounding." However, in the current rate environment, the short-term volatility risk of these positions is correspondingly amplified.
VI. The "Dual Path" in Emerging Markets: Parallel Allocation via Funds and ADRs
In emerging market holdings, the manager employs two parallel paths:
1. Indirect allocation through in-house funds: Baillie Gifford Emerging Markets Growth Fund (3.78%) and Leading Companies Fund (4.35%), totaling £23.30 million, covering a broader range of emerging market names.
2. Direct holding of key companies via ADRs: Sea Ltd ADR positions at £919,000 in market value, reflecting a direct bet on a Southeast Asian digital economy leader.
This "master fund + sub-fund" two-tier structure enables the fund to effectively increase emerging market exposure without adding excessive single-market risk. Given the trend of global capital continuing to flow into emerging markets in the first half of 2025 (the MSCI Emerging Markets index outperformed developed markets), the timing of this increase is reasonable.
VII. Summary: A "Transition Period" Balance Sheet
Taken together, this reporting period represents the fund's transition period under the triple pressure of "scale contraction, style oscillation, and structural optimization." On the financial side, sharply lower capital gains coexist with shrinking income; on the scale side, Class B faced massive redemptions while Class C supported the core; on the allocation side, the dual-engine approach of UK value anchors and global technology growth remains the core methodology.
As of 31 July, the fund's NAV per share for Class C was 175.48 pence (a half-year gain of approximately 4.3%). While this outperformed some peers, growth has clearly decelerated compared with the same period in 2024. The key challenge facing the manager in the next phase is: how to stabilize the unitholder structure while improving earnings elasticity through holdings restructuring, amid an environment where investor confidence has not fully recovered. Based on the holdings data, management has clearly chosen the direction of "increasing emerging markets + consolidating technology growth" — a natural extension of Baillie Gifford's research framework and a bet on new global growth drivers.
This continuation section discloses substantive financial data for the first time, which can corroborate the earlier qualitative descriptions. The key points are threefold: the UK and Worldwide Equity Fund's balance sheet shows a sharp decline in net assets alongside data caliber contradictions; the UK Equity Alpha Fund has badly missed its five-year target; and three policies — net zero constraints, concentrated holdings, and capital-based fee deductions — provide an institutional explanation for the performance shortfall.
I. UK and Worldwide Equity Fund: Balance Sheet Shows Scale Contraction
As of 31 July 2025, the fund's net assets fell to £286.6 million (per the table), with asset-side contraction as the primary driver:
| Item | Jan 2025 £'000 | Jul 2025 £'000 | Change £'000 | % Change |
|---|---|---|---|---|
| Investments | 354,379 | 285,541 | -68,838 | -19.4% |
| Debtors | 4,324 | 403 | -3,921 | -90.7% |
| Cash and bank balances | 3,688 | 3,324 | -364 | -9.9% |
| Total assets | 362,391 | 289,268 | -73,123 | -20.2% |
| Bank overdrafts | 2,437 | 2,046 | -391 | -16.0% |
| Distributions payable | 148 | 8 | -140 | -94.6% |
| Other creditors | 3,296 | 629 | -2,667 | -80.9% |
| Total liabilities | 5,881 | 2,683 | -3,198 | -54.4% |
| Net assets | 356,510 | 286,585 | -69,925 | -19.6% |
Liability items are shown as positive amounts; a negative change indicates a reduction in the liability balance.
The decline in net assets cannot be simply attributed to market value fluctuations, because the liability side contracted sharply in parallel. Other creditors fell by £2.67 million (-80.9%) and distributions payable by 94.6%. This combination of simultaneous contraction on both the asset and liability sides typically points to net redemptions or proactive reduction of operating exposure, rather than pure market price movements. Since the semi-annual report does not disclose cash flow details, the exact composition cannot be confirmed, but investors have grounds to ask management to explain where the £70 million in net assets went.
More concerning is the data caliber contradiction. The opening net assets stated in the main text are 373,303 (£'000), while the corresponding figure in the balance sheet is 356,510 (£'000) — a difference of 16,793 (£'000), equivalent to 5.9% of period-end net assets:
| Source | Opening Net Assets £'000 | Closing Net Assets £'000 | Decline |
|---|---|---|---|
| Main text | 373,303 | 286,585 | -23.2% |
| Balance sheet | 356,510 | 286,585 | -19.6% |
| Difference | 16,793 | 0 | — |
The balance sheet's internal arithmetic (total assets - total liabilities = net assets) reconciles perfectly, so the 356,510 figure carries greater credibility. But the main text figure carries no footnote explanation whatsoever. A discrepancy of this magnitude in an unaudited semi-annual report reveals sloppiness in the preparation and review processes.
II. UK Equity Alpha Fund: Five-Year Strategy Failure Can No Longer Be Explained by "Short-Term" Factors
The fund's Class B accumulation share performance is as follows:
| Period | Fund | FTSE All-Share | Target Return | Gap vs Index |
|---|---|---|---|---|
| Feb 2025 to Jul 2025 | -0.8% | +7.5% | +8.6% | -8.3 percentage points |
| Rolling five-year annualized to Jul 2025 | -0.7% | +12.5% | +14.8% | -13.2 percentage points/yr |
Using simple compounding on the annualized returns, the five-year cumulative picture is even more striking:
| Measure | Annualized Return | Five-Year Cumulative Estimate |
|---|---|---|
| Fund Class B accumulation shares | -0.7% | ≈ -3.5% |
| FTSE All-Share Index | +12.5% | ≈ +80.2% |
| Target (Index + 2% annualized) | +14.8% | ≈ +99.4% |
The five-year cumulative gap between the fund and the index is approximately 84 percentage points. Translated into specific amounts: £100,000 invested five years ago would now leave approximately £96,500 in the fund account versus approximately £180,000 in the index account. For any retail investor, this is a material loss, not "style volatility."
The report attributes part of the short-term underperformance to not holding defense and value-weighted names, but a five-year gap of this magnitude far exceeds what stock selection can explain, pointing to a more systemic issue: the fund's concentrated holdings (30–50 names) and long-term growth style have been under sustained pressure in a rising rate and inflationary environment. The report acknowledges that 2021–2022 losses were severe — this is in fact the deepest source of drag over the five-year period.
III. The Opportunity Cost of Concentrated Holdings: Empty Positions as Negative Contributions
The report explicitly lists the names the fund "did not hold" that negatively impacted relative performance: Rolls-Royce, BAE Systems, British American Tobacco, and domestic retail banks. These constituents carry significant weight in the FTSE All-Share or led the market in phases. A fund holding only 30–50 stocks is by definition unable to cover all the index's heavyweight names.
Concentrated holdings generate excess returns when growth styles dominate, but they also amplify relative drawdowns multiplicatively during style shifts. The key issue is that the report does not decompose attribution into "not holding" versus "wrongly holding" — what portion of the losses came from heavy growth positions that fell? What portion of the gains was missed by not holding value names? Without granular attribution, investors cannot determine whether the 84-percentage-point cumulative gap is a style problem, a stock selection problem, or a product of both.
IV. Net Zero Constraints as a Hidden "Stock Selection Filter"
The fund's investment policy layers multiple constraints:
- At least 80% invested in UK companies;
- Highly concentrated holdings (30–50 names);
- Adherence to the UN Global Compact;
- Portfolio-level alignment with the 2050 net zero emissions target;
- Ongoing net zero consistency assessments for all companies in the portfolio.
Among these constraints, net zero alignment is the most far-reaching hidden filter. The energy (oil and gas), mining, banking, and tobacco sectors that carry heavy weight in the UK market are precisely the sectors most likely to be excluded or underweighted under a net zero framework. And these same sectors repeatedly outperformed during 2022–2025, driven by high dividends and valuation recovery.
The fund's objective is financial — to outperform the FTSE All-Share Index by 2% — yet its stock selection universe is narrowed by non-financial constraints. This means there is a structural mismatch between the benchmark (a broad-based index) and the investable universe (a narrow set with high-carbon sectors excluded). The report does not disclose the financial cost of this mismatch, nor does it offer any validation of the premise that "net zero constraints will ultimately enhance returns." A five-year cumulative shortfall of approximately 84 percentage points versus the index is at minimum empirical evidence that this premise has not yet been validated.
V. Fees Deducted from Capital: Principal Erosion When Yields Are Insufficient
The risk warning section states explicitly:
> Where possible, charges are taken from income. If insufficient, the rest will be taken from capital, reducing the capital value of the Fund.
The fund's income is no longer sufficient to cover all fees, so the fee shortfall is continuously deducted from capital. The Class B management fee is 0.47% — modest in absolute terms, but against a backdrop of -0.7% annualized fund returns, the fees are directly eroding principal rather than returns. This further depresses the unit NAV and weakens the future compounding base. For investors, this means "regardless of performance, principal is being consumed" — the fee structure amplifies the downward effect on NAV.
VI. The Accountability Gap in the Long-Termism Narrative
The most telling passage in the report is:
> Although periods of underperformance are inevitable given our style of investment, we fully appreciate that returns over the past few years will have disappointed investors in the Fund... we remain confident that our long-term growth approach will add value over time.
This statement has two problems.
First, the time horizon can be extended indefinitely. The fund's objective is set as "outperform the index by 2% on a rolling five-year basis," but when the actual five-year window has lagged by 13.2 percentage points per year, "long term" can only slide toward the next five-year window. Investors effectively bear an indefinite time cost.
Second, the strategy lacks a falsifiable review mechanism. The report does not specify quantitative conditions that would trigger a strategy review — for example, "X consecutive years of underperformance will initiate a strategy reassessment." Long-termism without boundaries degenerates into a disclaimer.
The report warns in the first sentence of the Investment Objective that "any rated fund may lead to investment losses" while expressing long-term confidence in the Investment Report. This tension between "warning of uncertainty on one hand, promising the future on the other" precisely demonstrates that management must respond to investor skepticism at the mechanism level, not merely through reaffirming philosophy.
One additional disclosure flaw merits attention: the Risk and Reward Indicator section marks a 1–7 scale, but no shaded marker appears in the main text to show where the fund actually falls. Investors cannot confirm the fund's actual risk level. For a concentrated portfolio fund with negative five-year annualized returns and significant volatility, the missing risk rating undermines the completeness of investment decision-making.
Summary
The key findings of this section can be organized into three layers: at the financial level, the UK and Worldwide Equity Fund's net assets contracted nearly 20% in the half-year, and the report contains an opening-balance data contradiction; at the performance level, the UK Equity Alpha Fund's five-year annualized return lags the index by 13.2 percentage points, with a cumulative gap of approximately 84 percentage points — far beyond short-term fluctuation territory; at the governance level, the stock selection restrictions of net zero constraints, the style exposure of concentrated holdings, and the structure of deducting fees from capital jointly constitute the institutional conditions for persistently weak performance. When investors next review this fund, they should focus on whether management is willing to disclose the financial cost of net zero constraints and whether it will set quantifiable triggers for strategy reassessment — rather than relying solely on the assertion that "long term will be better."
Quantitative Corroboration Beyond Management Commentary: Reverse-Engineering the Investment Logic from Trading Behavior and Financial Data
1. The Decision Meaning Behind Liquidating Hargreaves Lansdown: Passive Acceptance Rather Than Active Exit
The most significant trade of the period was the complete sale of Hargreaves Lansdown. The report explicitly states that "as long-term shareholders we were disappointed with the offer price," which reveals two key signals:
- Seller's stance: Baillie Gifford does not believe HL's intrinsic value has been fully realized; the sale was triggered entirely by the private equity acquisition, not an active exit due to deteriorating fundamentals.
- Opportunity cost assessment: The switch into Moonpig and Croda was not a simple replacement but the reallocation of the same capital into names management believes offer higher per-share potential returns. By comparison, HL still represented approximately 0.6% of the fund in early 2025 (inferred from the £2,783 thousand sale amount), while the combined purchase of Moonpig and Croda totaled £13,470 thousand, approximately 3.2% of fund NAV — a clear difference in position significance.
2. The Industrial Logic of New Positions: Consumer Resilience + Specialty Chemicals Cycle Reversal
- Moonpig (4.17%): The online greeting card business appears traditional, but its business model features subscription-style cash flows and low fulfillment costs. The purchase amount was £4,040 thousand for 81.70 million shares, an average cost of approximately £0.49/share, while the period-end market price was £2.14 (17,484 / 8,170), indicating an early entry point or extremely low cost basis with substantial unrealized gains. This behavior shows the fund seeking defensive growth within the discretionary consumer sector.
- Croda International (2.24%): Specialty chemicals companies are often viewed as cyclical, but Croda possesses high-margin barriers in life sciences and cosmetic active ingredients. The purchase was £9,430 thousand and the period-end market value was £9,384 thousand — nearly flat, indicating limited recent share price movement. The fund is betting on structural demand from the global health-conscious consumption trend, not the short-term economic cycle.
3. Trimming Top Positions: Quantitative Evidence of Valuation Discipline
Under the stated approach of "maintaining discipline when value rises," the specific reduction data are as follows:
| Stock | Period-End Position (%) | Sale Amount During Period (£'000) | Estimated Reduction Ratio |
|---|---|---|---|
| Games Workshop | 7.86 | 9,358 | ~2.1% |
| Auto Trader | 6.05 | 9,045 | ~2.6% |
| Experian | 5.94 | 8,659 | ~2.5% |
Taking Games Workshop as an example: period-end market value of £32,988 thousand with £9,358 thousand sold during the period, equivalent to roughly 22% of the opening position being trimmed. But the opening position was higher (approximately 9.4%), and after the reduction it remains the largest holding — indicating this was not a trend-based retreat but routine rebalancing after rising to the target weight cap. Notably, Games Workshop and Auto Trader both appear on the positive contribution list; the portions sold were precisely the "winners," consistent with the fund's established style of "long-term holding with moderate pruning."
4. 4imprint: Evidence of "Manageability" Under Tariff Risk
The report emphasizes "supplier base flexibility, strong customer relationships and market leadership" as hedges against tariff impacts. Supporting evidence can be found in the financial data:
- 4imprint holds a 5.39% position in the fund with a period-end market value of £22,646 thousand across 629,934 shares, implying approximately £35.95 per share. This represents a significant decline from early-year prices (roughly the £40–45 range), yet the fund did not reduce the position (sales of only £1,623 thousand); instead, it may have added on weakness (purchases of £3,652 thousand).
- With purchases exceeding sales, the fund was a net buyer of approximately £2,029 thousand during the tariff panic, suggesting management believed the market had overpriced the risk.
5. Trainline and Government Plans: Contrarian Holding Under Event-Driven Uncertainty
Trainline's position fell to 1.92%, with a period-end market value of £8,080 thousand. The report acknowledges policy uncertainty but emphasizes that its market dominance would be difficult to overturn. Key data:
- The fund recorded no purchases or sales of Trainline during the period (it does not appear in the transaction table), indicating fully passive holding with no adjustment for news flow.
- This contrasts with the active net buying of 4imprint; the "inaction" on Trainline reflects a more complex assessment: confidence in the moat, but an inability to quantify the policy shock, hence the choice to remain neutral.
6. Financial Structure: Scale Shrinkage and Investor Sentiment
| Metric | Current Period (31.07.25) | Prior Period (31.01.25) | Change |
|---|---|---|---|
| Total net assets (£'000) | 419,792 | 474,621 | -11.5% |
| Period net redemptions (£'000) | 50,547 | 86,891 (prior-year period) | - |
| Net capital gains/(losses) (£'000) | (8,692) | 30,538 (prior-year period) | - |
Redemptions (£50.5M) far exceeded capital losses (£8.7M), indicating that investor sentiment was the primary driver of asset shrinkage. However, fund income remained stable (£5,504 thousand) and expenses fell 18% (from 910 to 748), reflecting economies of scale and cost control. This shows no fundamental deterioration — rather, outflows under market style pressure.
7. Holdings Concentration: Reconfirmation of the Alpha Source
The top ten positions account for approximately 51.6% of total assets (summed from the table), with Games Workshop, Auto Trader, Experian, 4imprint, and AJ Bell alone representing 30.6%. This high concentration means:
- A single event (such as Games Workshop licensing developments) has an outsized impact on the portfolio;
- However, the fund's selected names all possess high ROIC, strong cash flows, and pricing power, so insufficient diversification is compensated by enterprise quality.
8. Valuation Anchor Shifts Revealed by Interim Data
Comparing the Portfolio Statement to January, the Technology sector weight fell from 17.73% to 15.52%, while Financials rose from 13.36% to 15.69%. Combined with the transaction table, the fund trimmed technology names such as Auto Trader and Softcat while adding financials such as AJ Bell and Prudential. This is not style drift but valuation-differential driven: technology growth stocks saw premium compression after earlier gains, while financials remained in cyclically undervalued territory. This dynamic inter-sector rebalancing reflects the fund's real-time calculation of "intrinsic value," not the simple chasing of hotspots.
Financial Data Snapshot: Scale Contraction and Liquidity Structure Changes
The balance sheet disclosed for this period shows total assets falling from 477,981 to 423,001, a decline of approximately 11.5%; net assets fell from 474,621 to 419,792, also a decline of nearly 11.5%. Key changes are as follows:
| Item | Current Period (£'000) | Prior Period (£'000) | Change | % Change |
|---|---|---|---|---|
| Investments | 408,511 | 461,352 | -52,841 | -11.5% |
| Debtors | 9,868 | 2,327 | +7,541 | +324% |
| Cash and bank balances | 4,622 | 14,302 | -9,680 | -67.7% |
| Total assets | 423,001 | 477,981 | -54,980 | -11.5% |
| Total liabilities | 3,209 | 3,360 | -151 | -4.5% |
| Net assets | 419,792 | 474,621 | -54,829 | -11.6% |
Additional observation: The decline in investment assets moved almost in lockstep with net assets, indicating the fund did not use leverage or expanded liabilities to maintain scale, but directly absorbed the asset-side contraction. One detail worth noting: the debtors line surged 324% while cash fell nearly 68%. This "cash → receivables" conversion may stem from unsettled redemptions or undistributed dividends yet to be transferred, or from in-transit trades executed near quarter-end. Given that liabilities remained broadly stable (down only 4.5%), the debtor expansion does not correspond to an increase on the liability side; instead, it hints that funds may have moved out of cash accounts but not yet completed asset settlement — reflecting a period-end timing mismatch rather than ongoing operational deterioration.
Basis of Preparation: SORP Framework and Policy Continuity
The statements are explicitly prepared in accordance with the Statement of Recommended Practice for UK Authorised Funds, as issued by the Investment Management Association (IMA) in May 2014. The accounting policies are fully consistent with the annual report for the year ended 31 January 2025, with no adjustments.
Background context can be added here: the 2014 SORP was subsequently superseded by the 2021 version, yet the fund continues to reference the older edition — this is not an error, as ICVC reports may retain the framework in effect at initial authorization, and regulation permits maintaining existing conventions absent material changes. For investors, policy consistency improves cross-period comparability, but it also means the fund has not adopted newer SORP guidance on ESG disclosure, climate risk, and related matters introduced in recent years — a factor that may affect its appeal to capital sensitive to sustainability disclosure.
Dilution Adjustment Mechanism: The Refined Operation of Swing Pricing
The General Information section devotes substantial space this period to the Dilution Adjustment, which is essentially the formalization of swing pricing. The core logic: when a fund faces net subscriptions or redemptions, the actual transaction costs (bid-ask spreads, commissions, taxes) cause implicit erosion for existing shareholders. To mitigate this impact, the ACD reserves the right to add an adjustment when calculating dealing prices — raising prices on net inflows and lowering them on net outflows — thereby transferring transaction costs to the investors initiating the trades.
Additional evidence: The policy has been upgraded from "may be triggered" to "applied by default." The document explicitly states it is "currently of the opinion that it is in the best interests of shareholders to make a dilution adjustment whenever dealings result in shares being issued or cancelled," meaning the adjustment is activated whenever there is a net change in shares, not merely in exceptional circumstances. This differs from the "selective swing" approach of most European UCITS funds, which typically trigger only when net flows exceed a threshold.
More refined still, the ACD has established "daily net inflow/outflow thresholds" and adjusts dynamically based on market liquidity conditions:
| Scenario | Adjustment Approach |
|---|---|
| Good market liquidity, low trading volumes | Base adjustment, covering only bid-ask spreads and explicit costs |
| Constrained market liquidity, large trades impacting prices | Increase adjustment magnitude to reflect slippage costs |
| Daily net flows exceed thresholds | Even small trades execute at the higher adjusted price |
Risk note: This "one-size-fits-all" approach may cause small retail investors to pay higher costs on days when thresholds are breached. The document itself acknowledges this ("smaller transactions ... will also trade at the price incorporating the higher adjustment"). In substance, this makes all same-day traders jointly bear the market impact costs of large fund flows — protecting the long-term interests of remaining shareholders, but unfavorable to high-frequency small regular savers.
Trigger conditions are enumerated across five dimensions: sustained net outflows, sustained net inflows, large purchases/sales relative to fund size, daily net amounts exceeding limits, and other circumstances the ACD deems to be in shareholders' interests. This represents the complete internalization of the third of the three approaches permitted under COLL Rules (direct absorption, imposition of dilution levies, and swing pricing).
Share Classes: Tiered Access and Institutional Customization
The fund offers multiple share classes from A to P (skipping I, O, etc.), each with explicit eligibility requirements, collectively forming an access matrix of "identity-agreement-fee":
| Class | Primary Eligibility Requirements |
|---|---|
| Class A | Requires a written agreement with the ACD or its affiliates (from 1 March 2022); existing holders grandfathered |
| Class C | Investment management services provided by an ACD affiliate, or separate fee arrangements |
| Class G | Investors in the former Baillie Gifford International Private Pension Fund, or at the ACD's discretion |
| Class J | Separate "fund flow and marketing activity" agreement with the ACD or its affiliates |
| Class K | Same as Class C — affiliate services or separate fee arrangements |
| Class L | Separate charging arrangements with the ACD or its affiliates |
| Class P | Institutional pension platform with an agreement, or approved at the ACD's discretion |
Additional observation: The multi-class structure is essentially the regulatory-compliant form of "price discrimination" — investors with different channels, different scales, and different service costs receive different fee rates and minimum investment amounts. For instance, the Class A written agreement requirement effectively blocks organic retail walk-ins, while Class P explicitly targets institutional pension platforms, indicating the fund is transitioning from a traditional retail product toward institutional customization. This evolution helps expand AUM but also increases operational complexity, as each class requires independent NAV, distribution, and tax accounting — a factor potentially related to the surge in debtors noted earlier: distribution payables and redemption settlements across multiple classes are more likely to generate in-transit items at quarter-end.
Notably, the document states that "all classes have equal rights on winding up," eliminating differences in liquidation priority across share classes. However, fee structures differ across classes, so actual unit NAV trajectories may diverge, leading to differences in real investor returns.
Tax and Compliance: SDRT, Tax Reporting, and Information Collection
SDRT (Stamp Duty Reserve Tax): Ordinary redemptions do not trigger SDRT, but non-pro rata in-specie redemptions may be taxable. This is a common rule for UK investment funds, but the specific mention this period may indicate an increased likelihood of the fund using in-kind transfers to avoid cash selling during market volatility, thereby elevating SDRT risk.
Tax reporting obligations: The ACD is required to collect and report to HMRC information on shareholders' identities, tax residency, tax status, and financial information, which may be transmitted to tax authorities in other jurisdictions. This corresponds to the localized implementation of FATCA and CRS. The document emphasizes that the ACD has the right to refuse distribution or transfer applications that do not provide required declarations — a "reverse freeze" power: where tax information is missing, investors may be unable to receive distributions or transfer shares normally. Additional observation: Such clauses shift tax compliance risk onto investors, but also provide the fund with a practical tool against "tax-opaque accounts," protecting the fund from penalties for failing to withhold taxes. For cross-border investors (particularly US and EU residents), self-certifications and tax identification numbers add to account maintenance costs.
Fee Disclosure Pathways
The document does not list specific fee rates but instead references two external documents: the Enhanced Disclosure of Fund Costs and Charges and the Baillie Gifford's Funds Costs and Charges Summary, both available at www.bailliegifford.com. This "citation-based disclosure" aligns with the FCA's preference for a new generation of cost information disclosure, but for the purposes of this concise report, investors seeking actual fee figures must proactively consult online materials rather than finding them directly in the text. Additional observation: Citation-based disclosure reduces print costs but may weaken the completeness of a "one-time read"; from a regulatory compliance standpoint, however, as long as the links are valid and the content is accessible, the requirements are satisfied.
Conflicts of Interest: From Policy Statements to Dynamic Adjustments
Although the Conflicts of Interest section at the end of General Information is not detailed, the main conflict sources can already be discerned from the Dilution Adjustment and Share Classes arrangements:
- The ACD's dual role: Both fund manager and executor of swing pricing. The ACD has the discretion to decide whether to adjust, and by how much, and explicitly states it "will not be bound by having made different decisions in similar circumstances" — implying that swing pricing determinations are unpredictable and could serve as a potential channel for preferential treatment. However, the document confines the decision basis to "protecting existing shareholders from dilution," providing a benchmark for regulatory review.
- Cross-subsidization across multiple share classes: Different classes carry different fee rates but share one unified portfolio. If one class experiences sustained net outflows while another sees net inflows, the ACD may adjust dealing prices based on thresholds, but the adjustment is applied identically in percentage terms across all classes — actually ensuring fairness: the document explicitly states "any dilution adjustment affects all classes by the same percentage," eliminating opportunities for inter-class timing arbitrage.
- The black box of market conditions and threshold setting: Thresholds "vary by fund and market conditions" but specific values are not disclosed, so investors cannot determine in advance whether a given day's purchase will be subject to an increased adjustment. This is both a reflection of flexibility and a source of opacity. The document acknowledges it is "not possible to predict when adjustments will be made," further compounding investors' informational disadvantage.
Overall assessment: The content of this Introduction reinforces the fund's positioning as an "institutional, low-transparency, high-operational-flexibility" product. The scale contraction and NAV changes reflected in the financial data, combined with the activization of dilution adjustments, the complex multi-class access, and the coercive power of tax information collection, together sketch a UK Equity Alpha fund in deep transition toward institutional clients while strengthening operational compliance barriers. For individual retail investors, unless specific agreement conditions are met, the entry threshold has risen materially — consistent with the broader UK fund industry trend of "retail contraction and institutional rise" in recent years.
1. Class W Share Access Mechanism: The Institutional Logic of Customized Fee Arrangements
Class W shares are open only to investors who have "entered into a separate fee agreement with the ACD or its affiliates." This design carries明显的 institutional customization characteristics within UK ICVCs (Investment Companies with Variable Capital). Unlike traditional share classes charged at fixed rates, Class W achieves fee personalization through individual agreements, meaning this class primarily targets large institutional investors or professional intermediaries with special fee negotiation power. Notably, in the subsequent minimum investment table, Class W thresholds are not uniform: for example, Baillie Gifford Global Alpha Growth Fund and Responsible Global Equity Income Fund have minimums of just £1,000, while other funds do not list one (possibly closed or subject to separate arrangement). This indicates that the core of Class W lies not in minimum investment amounts but in the exclusive attribute of the "fee agreement" — the investment threshold can be flexible, but the fee structure must be individually negotiated.
| Share Class | Key Characteristics | Minimum Investment Example (Global Alpha Growth Fund) |
|---|---|---|
| Class A | Retail, standard fees | £1,000 |
| Class B | Institutional, higher threshold | £100,000 |
| Class C | Large institutional | £250,000 |
| Class W | Separate fee agreement; threshold varies by fund | £1,000 (but requires separate fee agreement) |
2. The Dual-Track Mechanism of Conflict of Interest Management: Organizational Arrangements and Disclosure Backstop
The continuation explicitly states that the ACD and investment adviser may simultaneously manage other funds with similar investment objectives and may act as trustee or custodian for other entities. To address this, the ACD employs "effective organizational and administrative arrangements" to manage conflicts of interest and ensure fair treatment of shareholders; where conflicts cannot be managed, disclosure is used. This practice corresponds to the two pathways for conflict management under FCA COLL rules: first, structural measures such as firewalls, independent oversight, and remuneration segregation; second, transparent disclosure to inform investors. Notably, the text specifically mentions that "conflicts may also arise between the interests of different shareholders" — foreshadowing the fairness considerations in the Equalisation mechanism, as Group 1 and Group 2 shareholders naturally differ in distribution entitlements.
3. The Equalisation Mechanism: A Delicate Balance Between Capital Return and Tax Treatment
The Equalisation mechanism is the standard tool in the UK fund industry for handling "distribution fairness between mid-period subscribers and existing shareholders," but two aspects of the continuation's wording merit deeper examination:
- Grouping and calculation of equalisation: Group 2 shares include in their subscription price the accrued net income from the last distribution date to the subscription date (i.e., equalisation), which is returned to investors as part of the first distribution. The amount is calculated on an average basis across all Group 2 shareholders, so subtle differences exist between early and late subscribers' equalisation amounts — this averaging simplifies operations but may introduce minor inaccuracies for small subscriptions.
- Tax characterization: Equalisation is explicitly treated as a "return of capital" rather than income — it is not subject to income tax, but must be deducted from the share cost basis for capital gains tax purposes. This treatment has practical implications for investment strategy: in accumulation funds, the equalisation mechanism applies equally, but investors who sell before the distribution may not receive the equalisation return, relying instead on the fund's dilution adjustment to protect long-term holders.
The text further notes that "the ACD applies an income equalisation-like mechanism to conversions," which is a fairness treatment for the attribution of accrued income arising from conversions between different share classes (e.g., Class A to Class B), preventing conversion activity from disrupting income distributions to existing shareholders.
5. TCFD Reporting Requirements: The Shift from Voluntary Disclosure to Regulatory Mandate
The continuation discloses that the TCFD (Task Force on Climate-related Financial Disclosures) recommendations have been incorporated into the FCA's ESG sourcebook, requiring the ACD to publish entity-level and product-level reports by 30 June each year. Key points:
- Reporting cycle and lag: The reports cover the 12-month period ending 31 December, with a publication deadline of 30 June the following year — a six-month preparation window. Investors reviewing the mid-2025 report are actually seeing full-year 2024 climate data, which does not reflect the latest asset holdings — this time lag is essential to understanding the timeliness of TCFD metrics.
- Product report accessibility: The ACD publishes product reports under the "Literature/Individual Investors" path on its website but does not explicitly provide direct links. This "navigation-style disclosure" satisfies the regulatory requirement for "clear and prominent indication," yet may increase the search cost for investors in practice.
- Standardization of core climate metrics: Product reports must include a set of core climate indicators (such as carbon intensity, fossil fuel exposure), but different sub-funds may show significantly different values due to investment strategy variations. For example, the Scope 1 and Scope 2 emissions intensity comparison between the Paris-Aligned fund and the Managed Fund would be a direct basis for evaluating the fund manager's climate integration capability.
6. Structural Differences in Minimum Investment Amounts: Product Tiering and Channel Strategy
The table data reveals how different funds achieve market segmentation through minimum investment amounts (data only show minimum investments; annual management fees are not given in the continuation):
| Fund Name | Class A (£) | Class B (£) | Class C (£) | Class G (£) | Class J (£) | Class K (£) | Class L (£) | Class P (£) | Class W (£) |
|---|---|---|---|---|---|---|---|---|---|
| Global Alpha Growth | 1,000 | 100,000 | 250,000 | n/a | n/a | n/a | 1,000 | 250,000 | 1,000 |
| Global Alpha Paris-Aligned | n/a | 100,000 | 250,000 | n/a | n/a | n/a | n/a | n/a | n/a |
| Global Income Growth | 1,000 | 100,000 | 250,000 | n/a | 1,000 | n/a | n/a | 250,000 | n/a |
| International | 1,000 | 100,000 | 250,000 | 250,000 | n/a | n/a | n/a | n/a | n/a |
| Managed | 1,000 | 100,000 | 250,000 | n/a | n/a | 250,000 | n/a | n/a | n/a |
| Responsible Global Equity Income | n/a | 100,000 | 250,000 | n/a | 1,000 | n/a | n/a | 250,000 | 1,000 |
| UK and Worldwide Equity | n/a | 100,000 | 250,000 | n/a | n/a | n/a | n/a | n/a | n/a |
| UK Equity Alpha | 1,000 | 100,000 | 250,000 | n/a | n/a | n/a | n/a | n/a | n/a |
The analysis finds:
- Class A is generally retail-facing (£1,000), but Paris-Aligned, Responsible Global Equity Income, and UK and Worldwide Equity do not offer Class A, possibly because thematic funds rely more on professional channels.
- Class B and Class C form a complementary pair: Class B at £100,000 and Class C at £250,000 correspond to two institutional purchasing tiers.
- Class G appears only in the International Fund at £250,000 — a "global institutional" class unique to that fund.
- Class J and Class L are both low-threshold classes (£1,000), with Class J appearing in Global Income Growth and Responsible Global Equity Income, while Class L appears only in Global Alpha Growth — possibly related to different fee agreement models across funds.
- Class K is set at £250,000 in the Managed Fund and does not appear in other funds, suggesting Class K may be an institutional share designed for specific strategies (such as balanced management).
- Class W simultaneously offers a low threshold (£1,000) and customized fee agreements, indicating it is a flexible channel that attracts clients with low entry hurdles and then generates economics through fee negotiation.
This differentiated minimum investment matrix is, in essence, a refined pricing tool the ACD uses to serve the needs of different client segments, investment strategies, and sales channels, while also reflecting the different historical development paths and market positioning of each sub-fund.
Fee Tiers and Share Classes: Refined Design of Scale Discounts
The annual fee data disclosed this period reveals Baillie Gifford's meticulous tiering strategy across share classes. Taking Class W as the exemplar, the fund offers significant discounts to large investors through tiered rates. Using Note 1 of the `Baillie Gifford Global Alpha Growth Fund` as an example, once aggregate net assets reach £100 million, the first £60 million is charged at 0.57%, the next £540 million drops to 0.35%, and amounts above that are charged only 0.33%. This means that at the critical point just above £100 million, the average fee rate has already fallen from the single rate of 0.57% to approximately 0.482% — the higher the scale, the lower the average cost. Similarly, Note 2 of the `Baillie Gifford Responsible Global Equity Income Fund` applies a marginal rate of only 0.25% when assets exceed £750 million.
This tiered design has a dual effect: on one hand, it encourages large institutional capital to hold in concentrated form, enhancing asset stickiness; on the other hand, it causes smaller investors to bear relatively higher fee rates — below the threshold, the highest rate applies to the entire balance. Comparing the first table, where some share classes (potentially retail channels) carry annual fees as high as 1.50% (e.g., `Baillie Gifford Managed Fund`), the gap versus Class W's 0.32% is nearly 4.7 times — a clear institutional/retail price differential. The table below summarizes the lowest and highest fee tiers disclosed for each fund this period (based on available data):
| Fund | Lowest Annual Management Fee | Highest Annual Management Fee |
|---|---|---|
| Baillie Gifford Global Alpha Growth Fund | 0.33% (end tier) or 0.50% (Class L/P) | 1.42% |
| Baillie Gifford Global Alpha Paris-Aligned Fund | 0.57% | 0.57% |
| Baillie Gifford Global Income Growth Fund | 0.35% | 1.35% |
| Baillie Gifford International Fund | 0.50% (Class L/P?) | 1.42% |
| Baillie Gifford Managed Fund | 0.32% (Class K) | 1.50% |
| Baillie Gifford Responsible Global Equity Income Fund | 0.25% (end tier) or 0.45% | 0.50% (if applicable) |
| Baillie Gifford UK and Worldwide Equity Fund | 0.45% | 0.45% (single tier) |
| Baillie Gifford UK Equity Alpha Fund | 0.47% | 1.32% |
Notably, the `Baillie Gifford UK and Worldwide Equity Fund` shows only a single 0.45% tier with no other share classes displayed, possibly indicating a relatively simplified product structure. By contrast, `Baillie Gifford Global Alpha Paris-Aligned Fund` maintains a uniform 0.57% rate with no tiered discounts, which may reflect the operating cost rigidity of its ESG strategy.
Active Share and Portfolio Turnover: Empirical Evidence of the "Long-Termism" of High Active, Low Turnover
The combination of Active Share and Portfolio Turnover Ratio offers an important window into fund manager behavior. All sub-funds this period have Active Share between 77%–90%, firmly within the high active management range, indicating extremely low overlap with benchmark indices and a clear intent to generate excess returns through deep stock selection. Turnover ratios, however, are generally low (11%–27%), showing that portfolio adjustments are infrequent, holding periods are long, and the approach is highly consistent with Baillie Gifford's repeatedly declared "five-year horizon" investment philosophy.
Further calculating the "Active Share / Turnover" ratio quantifies the active deviation carried per unit of turnover:
| Sub-Fund | Active Share | Turnover | Ratio |
|---|---|---|---|
| Baillie Gifford UK Equity Alpha Fund | 90% | 12% | 7.5 |
| Baillie Gifford UK and Worldwide Equity Fund | 77% | 11% | 7.0 |
| Baillie Gifford Global Income Growth Fund | 86% | 17% | 5.1 |
| Baillie Gifford Responsible Global Equity Income Fund | 86% | 16% | 5.4 |
| Baillie Gifford Managed Fund | 80% | 15% | 5.3 |
| Baillie Gifford Global Alpha Paris-Aligned Fund | 78% | 27% | 2.9 |
| Baillie Gifford International Fund | 77% | 27% | 2.9 |
| Baillie Gifford Global Alpha Growth Fund | 78% | 26% | 3.0 |
A high ratio (such as 7.5) means the manager maintains an extremely high index deviation with very few trades — the conviction level in investment decisions is exceptionally high, with positions rarely changed in response to market fluctuations. Lower-ratio products (such as Global Alpha Growth / International), while equally high in active share, require more trading to sustain their stock-selection deviation, possibly reflecting more frequent rebalancing of growth stocks within the strategy or the exploitation of short-term valuation dislocations. Overall, turnover is far below the industry average (typically >50%), saving investors meaningful transaction costs and better facilitating tax deferral.
Another detail worth noting: the benchmarks for the `Managed Fund` and `UK and Worldwide Equity Fund` are peer groups (IA Sector Median and a custom composite index), so their Active Share figures are estimates. The notes clearly explain that due to the lack of stock-level data, index portfolios or representative indices were substituted. This means the Active Share figures for these two funds carry an error margin of roughly ± a few percentage points and should be interpreted cautiously in cross-fund comparisons — particularly since the `Managed Fund` is itself a balanced fund, making a direct comparison with pure equity funds not entirely fair.
Product Line Dynamics: Contraction and Expansion in Parallel, Focusing on Core Capabilities
The `The Group's Funds` list outlines Baillie Gifford's complete product system, spanning bonds, global growth, UK equities, Pacific, Japan, health innovation, and other areas. However, the footnotes reveal several key changes:
- `Baillie Gifford Emerging Markets Bond Fund`, `Multi Asset Growth Fund`, and `Health Innovation Fund` are all "no longer available for subscription" — closed to new investments. This typically signals proactive strategy contraction after weak performance or scale decline. The withdrawal of a bond fund (Emerging Markets Bond) and a high-concept thematic fund (Health Innovation) in particular may suggest management wishes to concentrate resources on its core competency of long-term global equity investing.
- `Baillie Gifford Cautious Managed Fund` was launched on 31 July 2025 — the only new product in this disclosure. Combined with the existing Managed Fund, the addition of the Cautious Managed Fund further enriches the risk gradient, making the balanced fund spectrum from cautious to aggressive more complete.
This "contraction + expansion" combination indicates that Baillie Gifford is dynamically adjusting its product line to match its "genuine long-term investor" brand positioning: exiting non-core areas or those where differentiated advantage is hard to establish, while adding solutions that can attract risk-averse clients but retain long-term appreciation potential.
Additionally, the two-tier ICVC structure (e.g., `Baillie Gifford Global Alpha Growth Fund` appears under the UK & Balanced Funds ICVC while `Baillie Gifford Global Discovery Fund` appears under the Investment Funds ICVC) reflects the common umbrella structure of UK open-ended funds. For investors, conversions across umbrella funds may involve additional redemption/subscription costs, though this falls outside the scope of this disclosure.
Implications for Investors: Using Metrics to See Through Homogenized Marketing
Combining the data on fees, Active Share, and turnover, three practical recommendations emerge:
1. Prioritize share classes with tiered fees (such as Class W), especially for institutions or high-net-worth individuals planning long-term large holdings. Even if the initial size is below £100 million, the average fee will naturally decline as subsequent additions cross the critical threshold — without the need to resubscribe.
2. Combine the two dimensions of Active Share and Turnover to identify managers' true preferences. Do not look only at high Active Share; also note the turnover rate. A combination like UK Equity Alpha (90% active, 12% turnover) embodies an extreme "buy and hold" style, suitable for investors seeking stable excess returns without wanting to bear excessive trading costs.
3. Remain cautious with funds where Active Share is estimated using peer group benchmarks (such as the Managed Fund). Because the benchmark's composition may understate the true difference from the actual portfolio, the true level of active management may be higher or lower than the reported figure and should be further validated against fund holdings disclosures.
In sum, although this annual disclosure is standardized information, cross-analyzing its fee tiers, Active Share, and turnover enables investors to identify each fund's strategic fingerprint more clearly without being misled by any single metric. Baillie Gifford's data shows that high active management does not mean high turnover — the execution quality of long-termism can equally be quantified.