Baillie Gifford Overseas Growth Funds ICVC Interim Report - October 2025
In plain words
This half-year report for Baillie Gifford's American fund says its goal is to beat the S&P 500 by 1.5% a year over five-year stretches, but for the five years to October 2025 it returned only 2.8% a year versus the index's 17.2%. The latest six months were stronger, at about 27.5%. The manager thinks the rebound is narrow and driven by a few tech stocks, so the fund sticks with long-term, fundamental investing. Top holding Cloudflare (network/security, won a large deal), NVIDIA (AI chip leader, but the fund owns less of it than the index does), and Shopify (e-commerce software, gaining merchants with AI tools) show the approach.
This report pertains to Baillie Gifford Overseas Growth Funds ICVC (UK Open-Ended Investment Company) as of October 31, 2025. The umbrella fund is an FCA-regulated UK UCITS retail scheme, registered in Scotland, with ten sub-funds covering regions including the United States, China, Asia Pacific, Em
Fund Matters
This chapter is a company-level overview and contains no sub-fund performance, holdings, or manager views; the substantive information points are limited to: a change to one sub-fund's investment policy, a new share class, a set of cross-fund holding data, and the routine value-assessment cadence.
- Policy change: Effective 5 August 2025, the maximum market-capitalisation limit of the Baillie Gifford Japanese Smaller Companies Fund changed from a fixed amount to a variable amount, and the turnover restriction was removed, simplifying the investment policy to market-cap criteria only (see the relevant sub-fund section for the revised policy).
- New share class: The Baillie Gifford Emerging Markets Leading Companies Fund launched its W6 share class on 3 November 2025 — a date after this report's cut-off (31 October 2025), and therefore a post-period event.
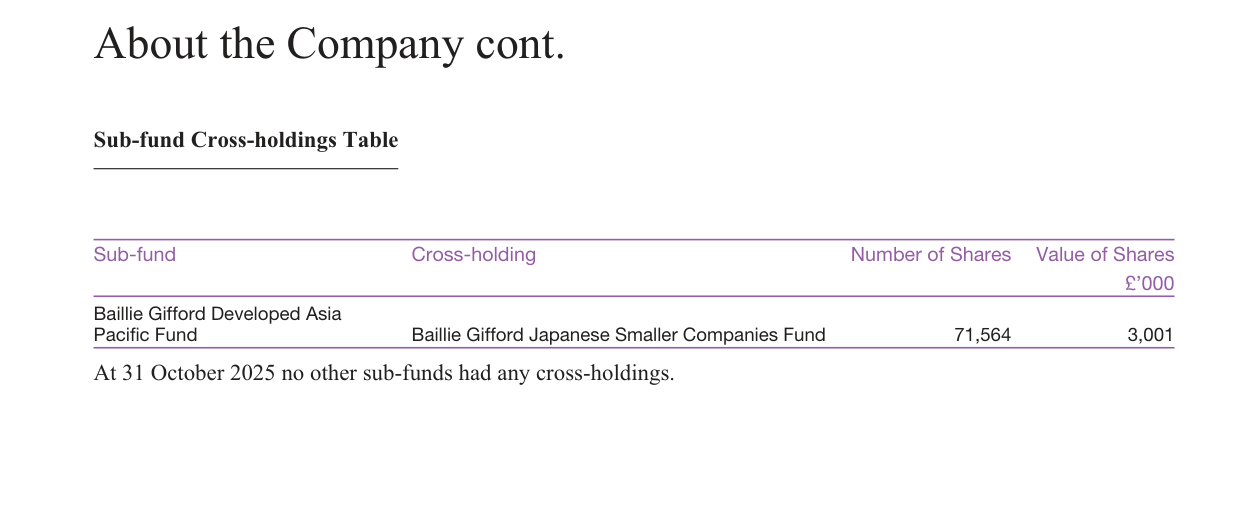
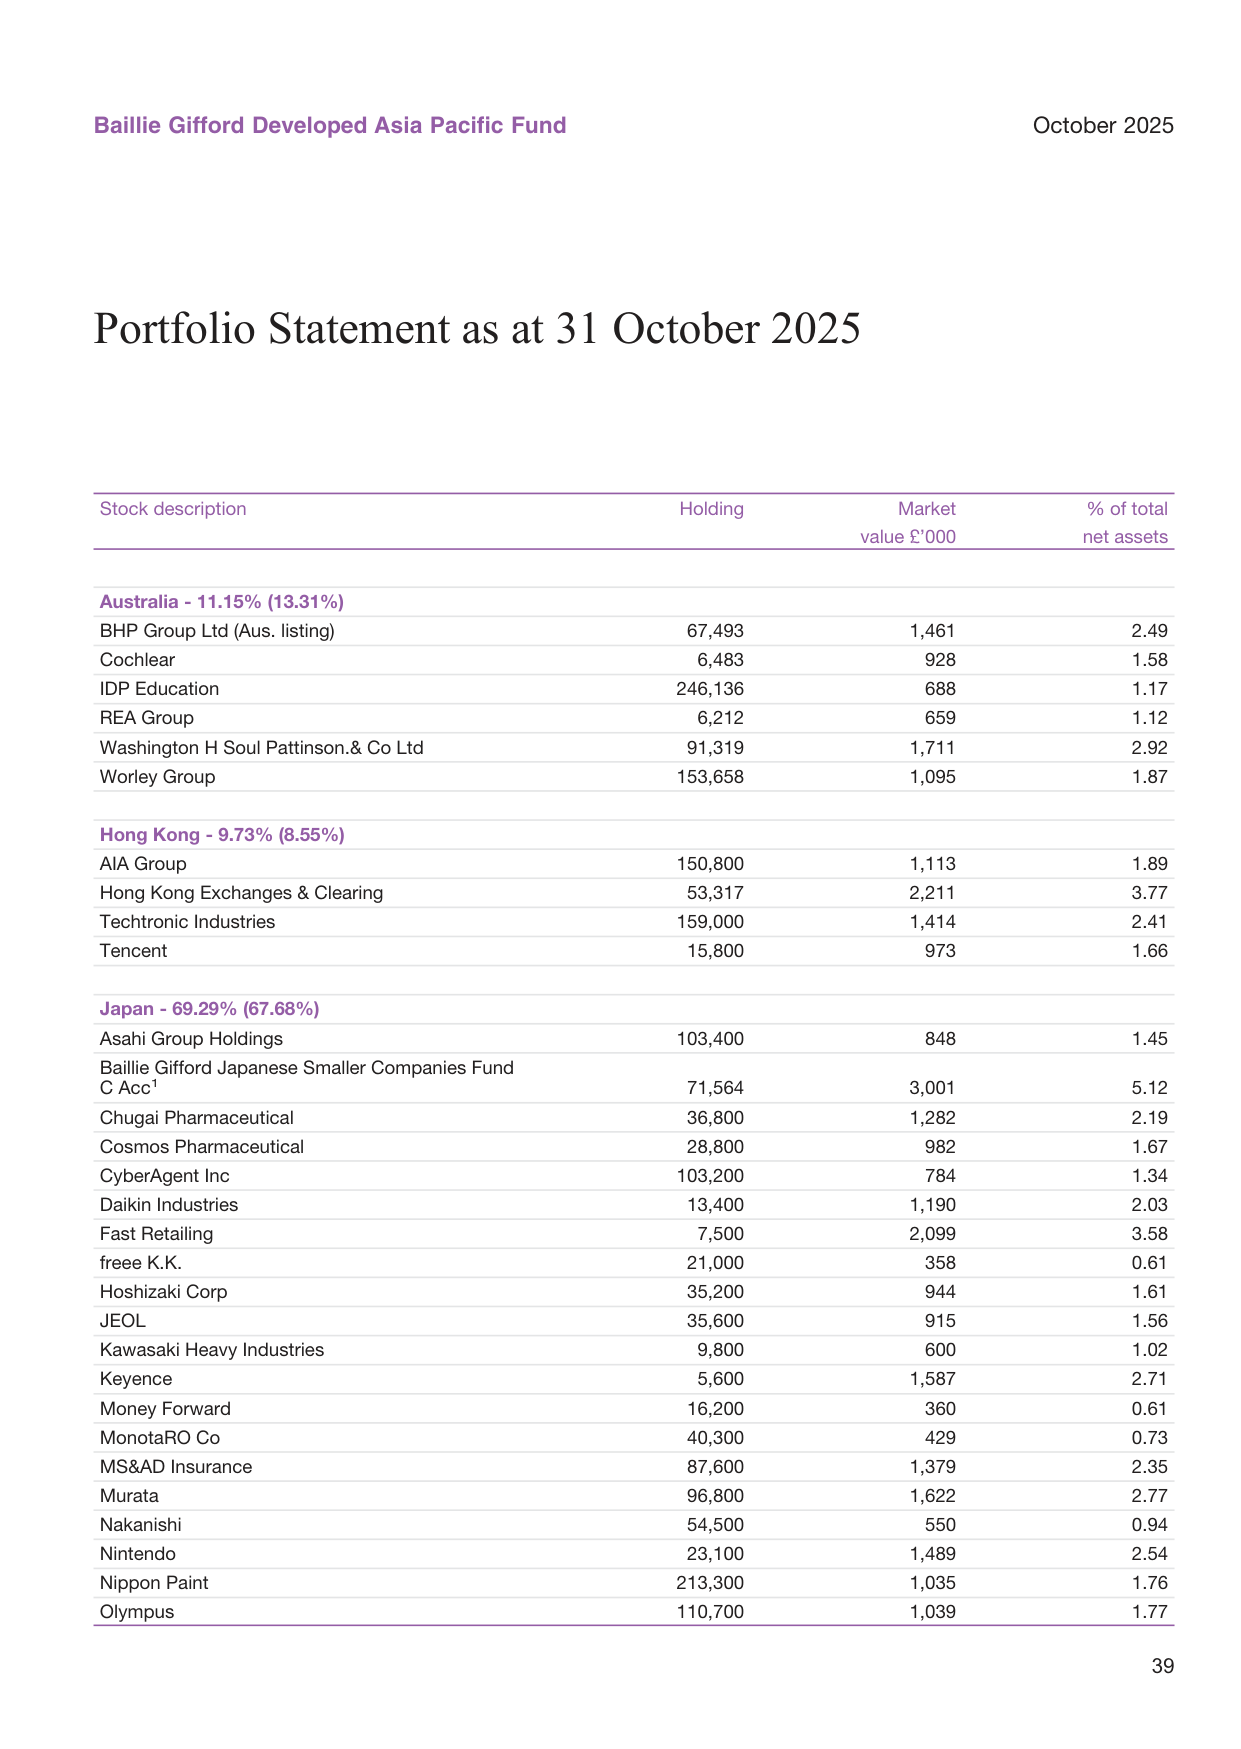
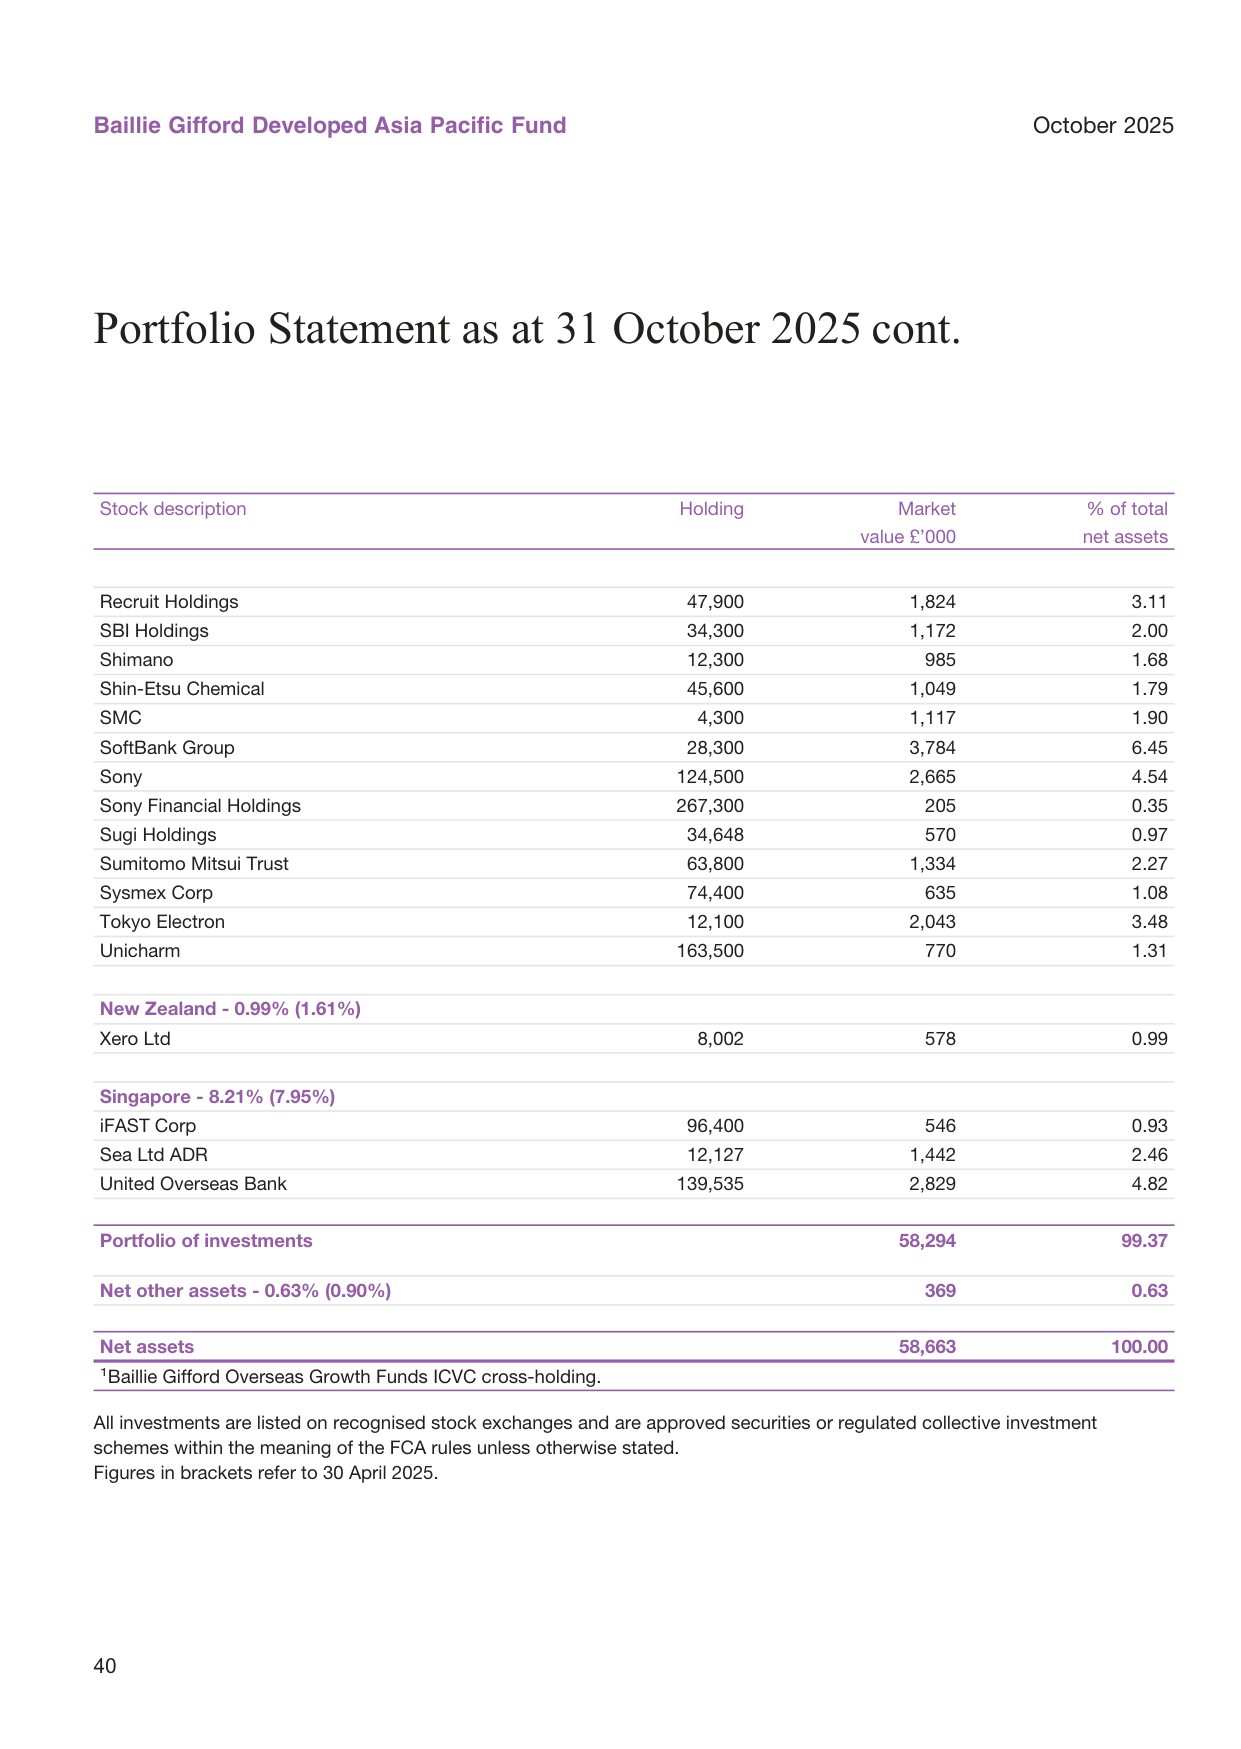
- Cross-fund holdings: As at 31 October 2025, the Baillie Gifford Developed Asia Pacific Fund held 71,564 shares in the Baillie Gifford Japanese Smaller Companies Fund, valued at £3,001,000; no other sub-fund held cross-fund positions.
- Value assessment: Under the COLL rules, the ACD assesses at least annually whether sub-fund charges are consistent with the overall value received by shareholders, covering seven criteria (quality of service, performance, manager costs, economies of scale, comparable market rates, comparable services, and share classes); the assessment reference date is 31 March each year, with conclusions and any remedial measures published by 31 July the following year. The latest assessment, as at 31 March 2025, has been published on the website — this is a routine regulatory disclosure, not an investment judgement.
American Fund — Investment Objective and Policy
In this chapter, the American Fund section provides only the objective and policy framework, with no performance or holdings data; notably, the objective is expressed as "at least 1.5%", yet the author simultaneously leaves room for intermittent underperformance from the concentrated portfolio.
From 1970 to 2025, the decomposition of the global equity risk premium (ERP) shows a long-term average of -140bp and a current reading of 151bp
- Objective: To outperform the S&P 500 Index by at least 1.5% per annum on a rolling five-year basis, in sterling terms, after fees. The author explicitly cautions that a concentrated portfolio combined with long-term growth objectives may produce prolonged periods of relative and absolute underperformance in certain market environments, and there is no guarantee the objective will be achieved over any time period — this is the fund manager's advance disclaimer on volatility, and readers should note that this is the perspective of the position-holder.
- Policy: At least 90% of assets invested in US companies (whether listed, incorporated, headquartered, or with principal business operations in the US), with no restriction on company size or industry; actively managed with a concentrated portfolio.
- Risk warning: In adverse market conditions, holdings may be difficult to sell in a timely manner, values may fall sharply, and in extreme circumstances trading in the fund may be suspended.
The following is the additional content of the follow-up analysis:
Blind Spots in Risk Classification
The fund is classified as Category 6 (out of 7) on the SRRI risk indicator, and this classification has an obvious structural flaw. The indicator is calculated primarily on the basis of historical volatility, but fails to capture the following key risks:
| Risk factor not captured | Manifestation |
|---|---|
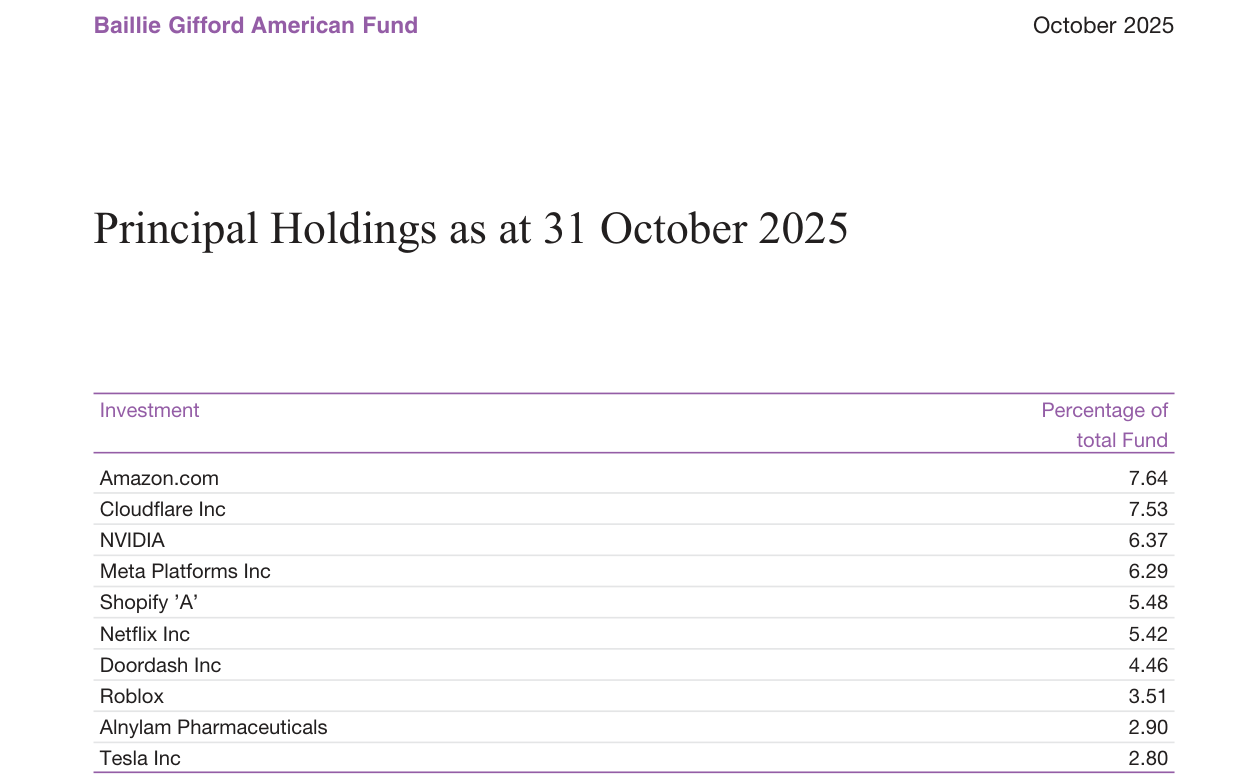
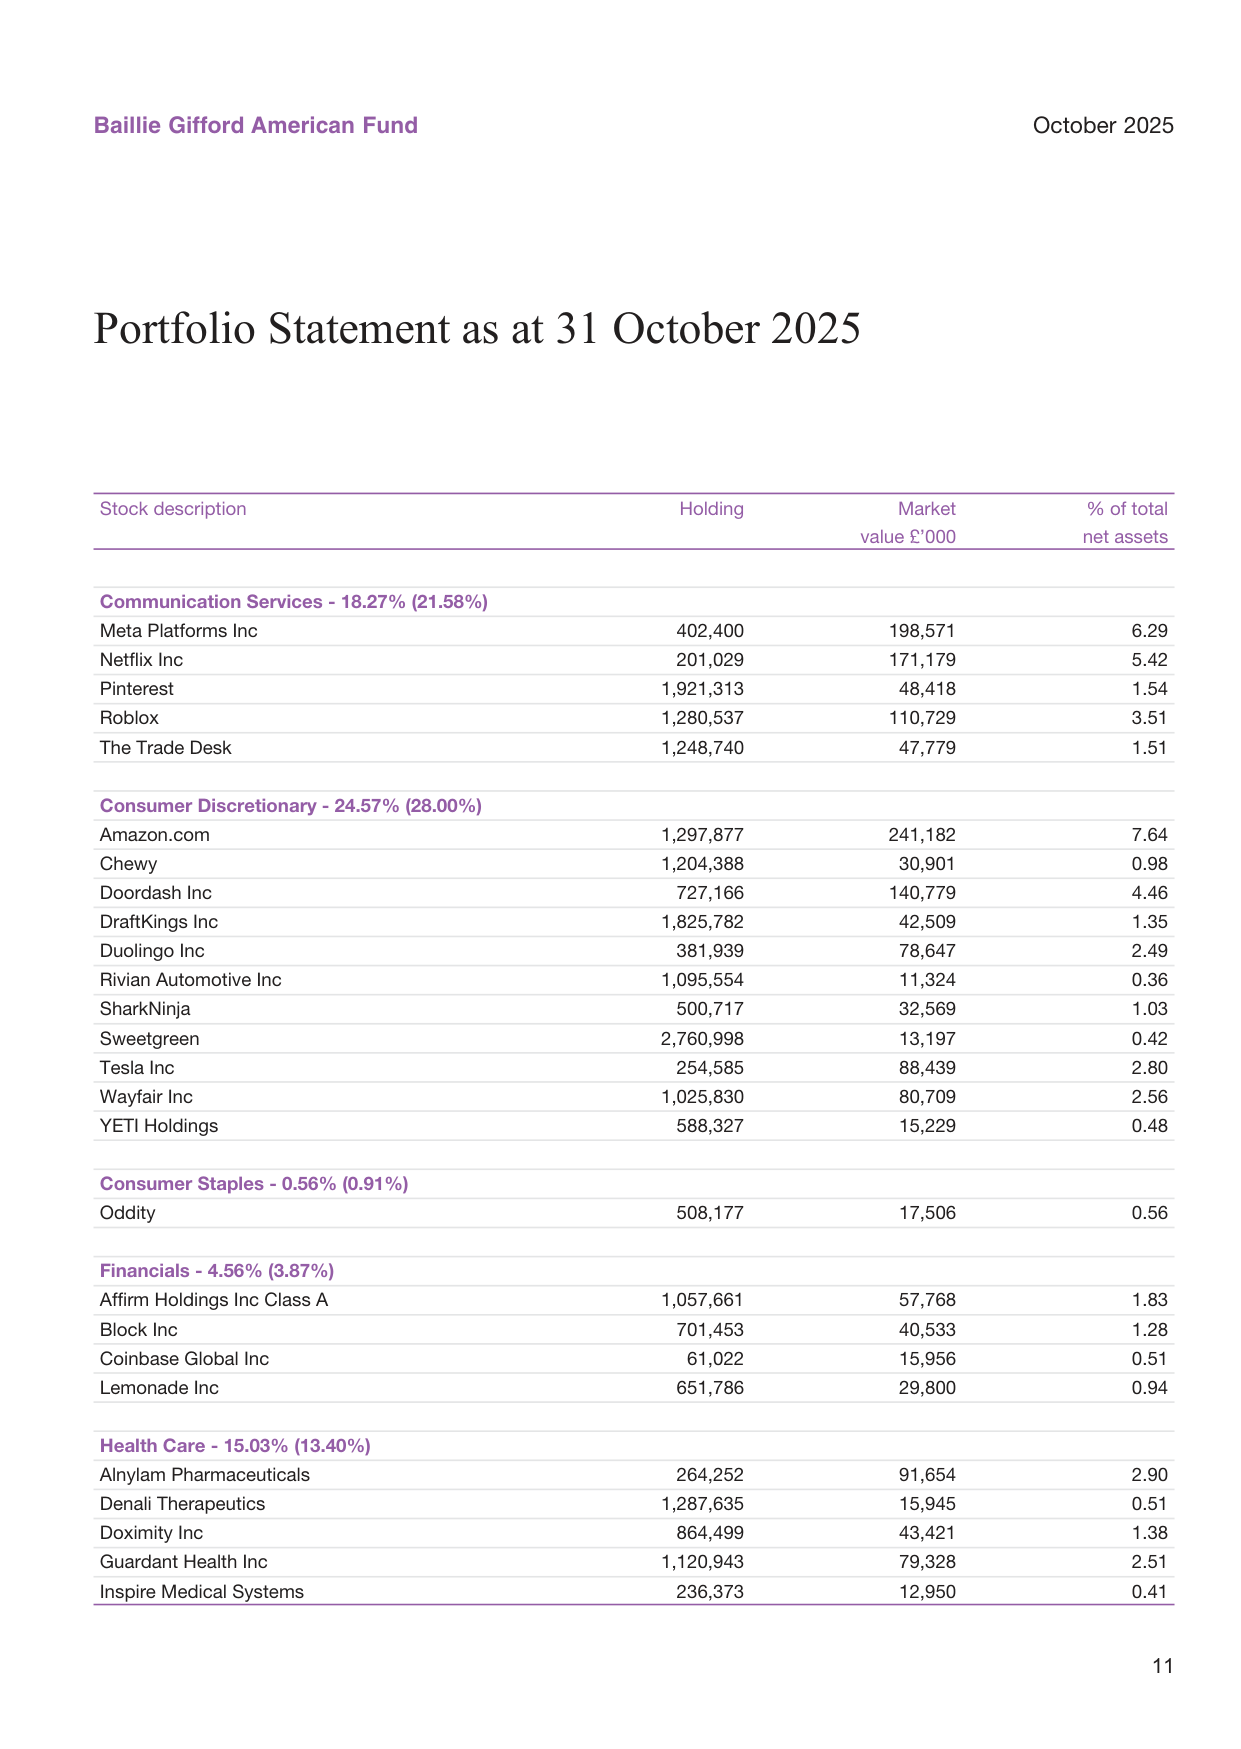
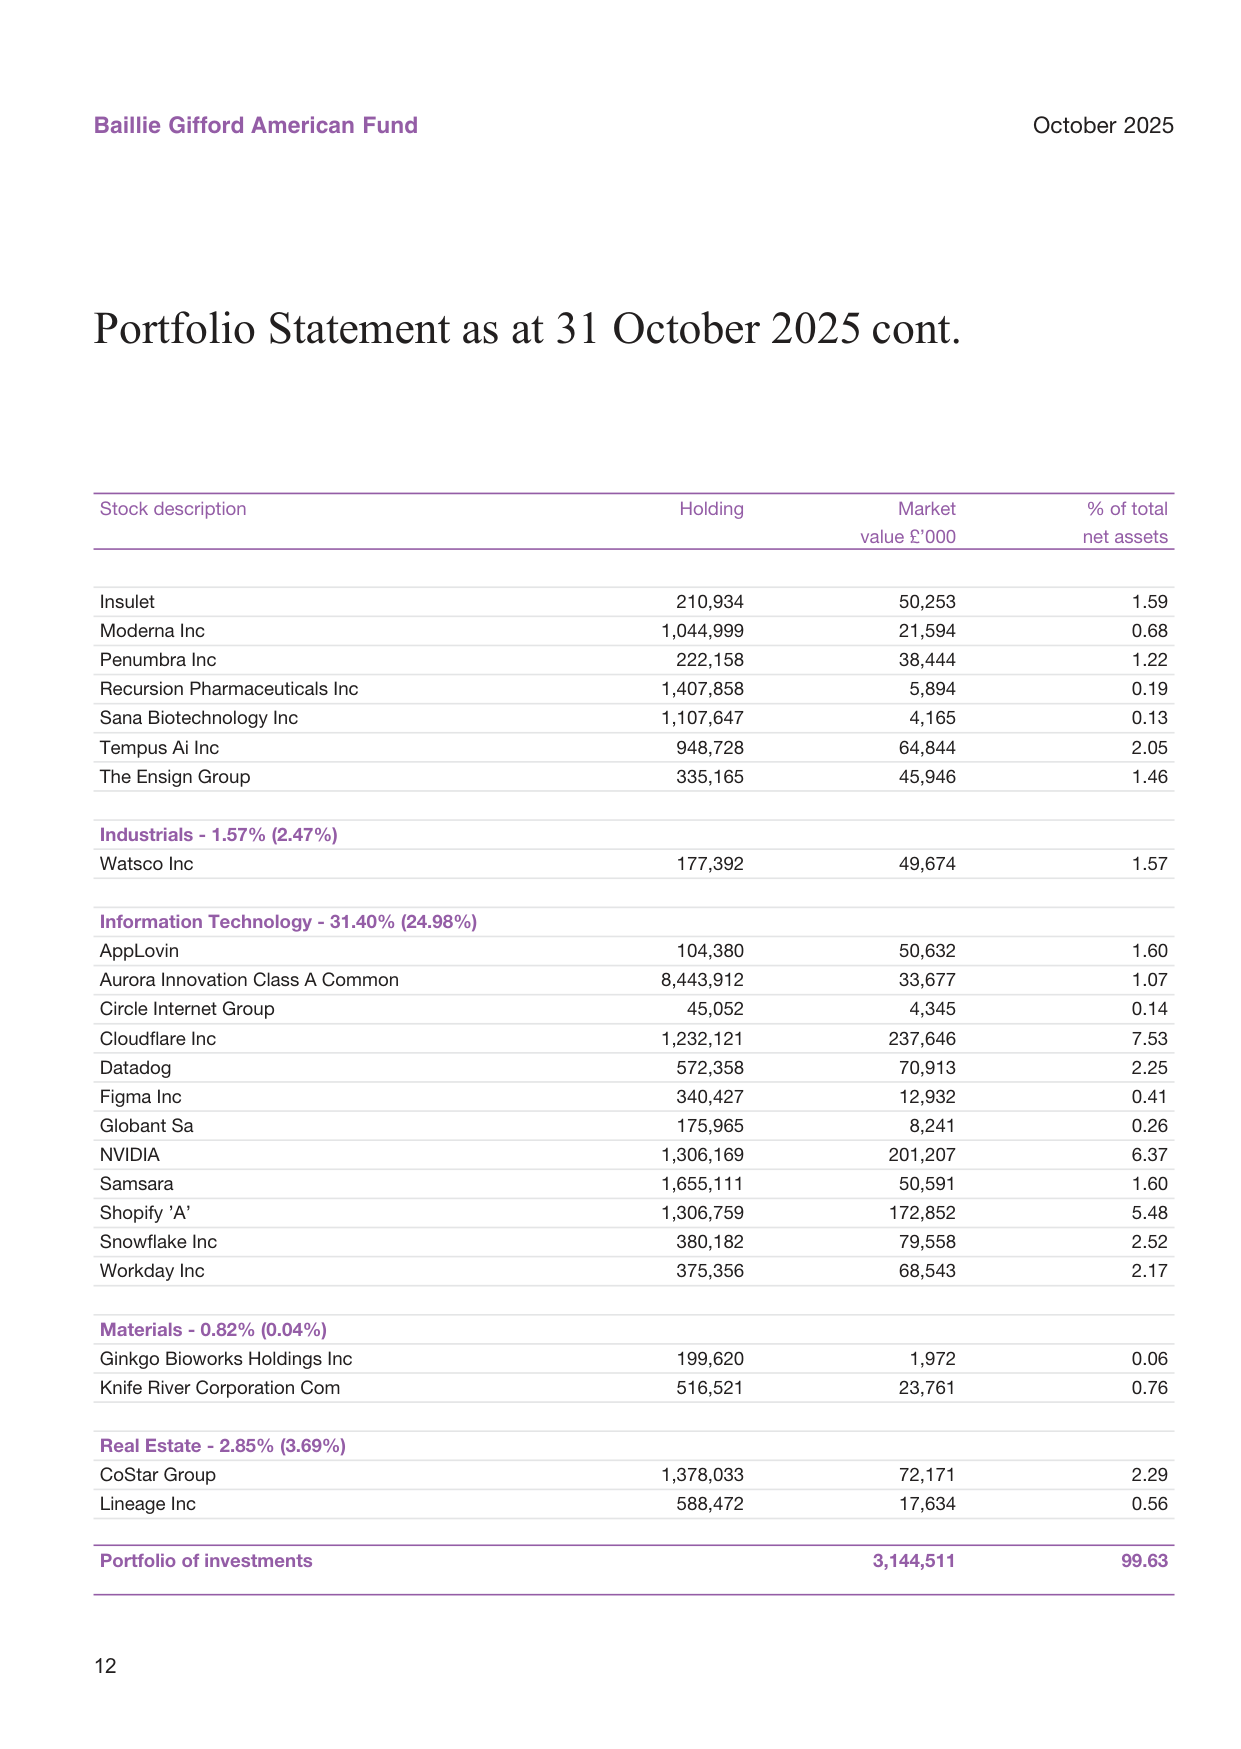
| Concentration risk | Top ten holdings together account for approximately 52.4% of net assets (Amazon 7.64% + Cloudflare 7.53% + NVIDIA 6.37% + Meta 6.29% + Shopify 5.48% + Netflix 5.42% + Doordash 4.46% + Roblox 3.51% + Alnylam 2.90% + Tesla 2.80%) |
| Liquidity risk | Small- and mid-cap holdings such as Sweetgreen (0.42%) and Sana Biotechnology (0.13%) may be difficult to exit quickly in extreme markets |
| Sector concentration | Communication Services + Consumer Discretionary + Health Care alone account for over 58% |
Equity assets have posted negative returns over the past year, with short-term risk premia generally in the -1.5 to -1.0 standard deviation range
The Serious Warning of Five-Year Performance
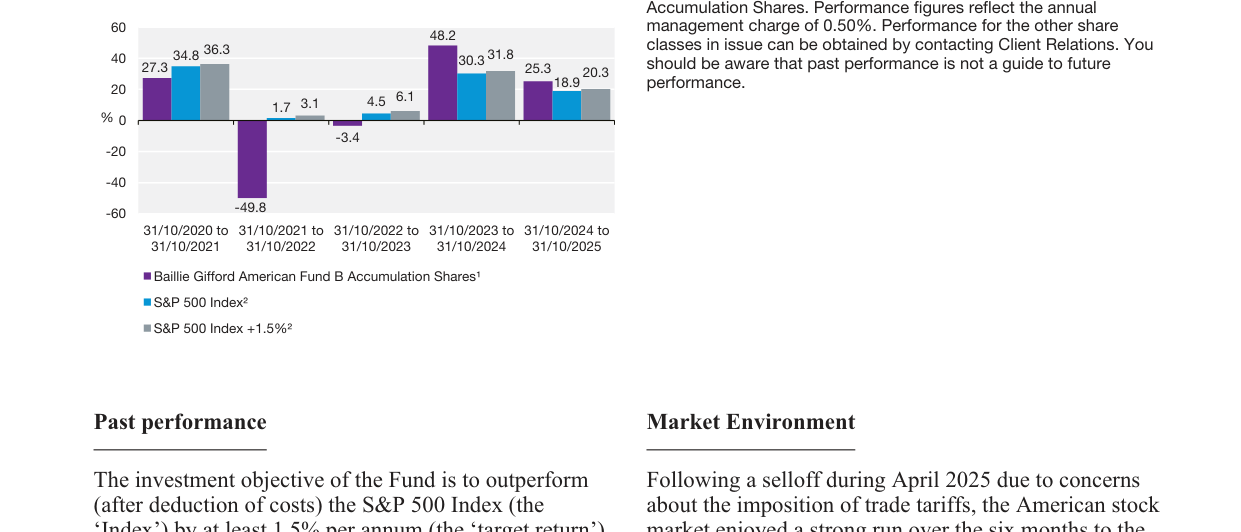
The fund acknowledges in the report that its five-year annualised return is only 2.8%, versus an index return of 17.2% over the same period — a gap of 14.4 percentage points. This figure deserves closer reading:
- The fund's performance objective is to exceed the index by 1.5% annualised on a rolling five-year basis after costs — the actual result not only failed to meet the objective, but significantly underperformed
- In the high-inflation and rate-hiking environment of 2021-2022, the fund's heavily held growth stocks suffered valuation compression, and the compounding effect of this blow has yet to be repaired
- Even though the most recent six-month return of 27.5% modestly exceeded the index's 25.7%, the damage to the five-year base remains severe
It is worth noting that the report partly attributes the underperformance of recent years to the external macro environment, yet the S&P 500 Index continued to rise over the same period, indicating that the cost of style deviation far exceeded overall market risk.
Shows expected returns and Sharpe ratios for global asset classes over the next 12 months; equities are expected to return approximately 4%-5% with a Sharpe ratio of 0.2-0.3
The "Narrow Rally" Nature of the Market Environment
The report describes the market rebound following the April 2025 tariff shock, within which an important judgement is implicit: the gains were highly concentrated in a handful of technology stocks. This creates a paradox:
- The fund's holding in NVIDIA has benefited from the AI wave, but because of its enormous weight in the index, the fund's underweight position has been a drag on relative performance
- In other words, the fund captured absolute returns (the rise in NVIDIA's share price) but lost on relative returns (the underweight caused underperformance versus the index)
- The report's emphasis on "company execution and fundamentals" is in effect a veiled criticism of the current market's valuation-only, concentrated-trading approach
The Divergent Logic of Stock-Level Contributions
Positive Contributors: Execution Validation for Platform Companies
Annualised expected returns and volatility for regional equity markets calculated using a multi-factor model; emerging markets offer higher expected returns (approximately 7%) but with greater volatility
| Company | Catalyst | Key data/event |
|---|---|---|
| Cloudflare | Enterprise and AI access-management demand | Secured a US$130 million landmark contract; growth accelerating |
| Shopify | AI tools + agentic shopping trend | Rising merchant adoption; platform enhancements driving productivity |
| Wayfair | Logistics network opening + physical stores | Castlegate network opened to third parties; market share gains |
The common characteristic of these three companies is "adaptive growth": expanding the addressable market through platform extension and AI enablement. The size of Cloudflare's contract relative to its market capitalisation is worth attention.
The Essential Differences Among Negative Contributors
Expected paths of global equity indices under different macroeconomic scenarios, overlaid with the current probability distribution
- Netflix: Fundamentals are solid (both revenue and profit growing), but investors worry about valuation and the opacity of subscription data creating "information asymmetry". The fund believes the advertising business and strategic partnerships are long-term value drivers — this is typical "patient capital" thinking, but the market is not buying it over the short cycle.
- Duolingo: A natural pullback after excessive prior gains; the company's AI-plus-gamification expansion path remains well regarded.
- NVIDIA: Not a fundamentals issue, but a portfolio weighting strategy issue — the fund's insufficient allocation to the AI leader reflects a conflict between its "high-valuation avoidance" style and the current market's core driving logic.
Strategic Signals in Portfolio Adjustments
Several important moves can be discerned from the Material Portfolio Changes:
Turnover Revealed by Trade Sizes
The largest purchase was NVIDIA at 81,966 (in £'000), while the largest sale was Cloudflare at 102,787. The Cloudflare sale exceeded any single purchase, indicating that the fund took partial profits after Cloudflare's sharp rise, even though it remains the second-largest holding (7.53%).
The Sector Intent Behind New Position Building
Shows the changing correlation between monthly returns of global equities and bonds since 1970; the correlation is currently close to 0
| Newly bought name | Sector/track | Positioning logic |
|---|---|---|
| Knife River | Construction materials | US infrastructure cycle + interstate transportation advantages |
| AppLovin | Mobile gaming advertising | AI-driven revolution in ad-spend efficiency |
| Circle Internet | Stablecoin issuance | Participation in the IPO of digital-payment infrastructure |
These new positions show the fund expanding from pure technology growth toward "the physical economy plus fintech". Knife River in particular is a classic value/cyclical name, markedly different from the fund's customary technology-growth style, and may represent an attempt at "style rebalancing".
The Implications of the Roku Exit
Roku, once a representative streaming-hardware/advertising platform, was fully exited (33,100 sold). Combined with the continued holdings in Netflix, The Trade Desk, Pinterest and other streaming/advertising chain names, this looks more like a consolidation move: abandoning the middle layer and focusing on the content side (Netflix) and the demand side (The Trade Desk).
Projected policy-rate paths for major global central banks; the Fed funds rate is expected to fall to around 3.5% in 2025
The Shift Map of Sector Weights
The sector changes can be extracted from the Portfolio Statement (the comparison base period is in brackets):
| Sector | Current weight | Base-period weight | Direction |
|---|---|---|---|
| Communication Services | 18.27% | 21.58% | ↓ 3.31pct |
| Consumer Discretionary | 24.57% | 28.00% | ↓ 3.43pct |
| Consumer Staples | 0.56% | 0.91% | ↓ 0.35pct |
| Financials | 4.56% | 3.87% | ↑ 0.69pct |
| Health Care | 15.03% | 13.40% | ↑ 1.63pct |
Historical path of risk premia driven by real rates and credit spreads; the current equity risk premium is approximately 240bp
The fund reduced retail/communications weights and increased health care and financials. Within the Health Care sector, heavy positions include Alnylam (2.90%), Guardant Health (2.51%) and Tempus AI (2.05%), showing that the fund is increasing its bets on life sciences and AI-enabled medicine.
The Fund Report's Self-Defence and Risks
One sentence in the report is worth noting: "We believe that short-term performance measurements are of limited relevance" — this is a standard long-term investing narrative. But the objective data show:
- A five-year annualised return of 2.8% means the initial investment was barely preserved over the period
- US money market funds returned approximately 4-5% annualised over the same period, implying a huge opportunity cost
- The fund uses the "five-year objective" to respond to short-term disappointment, yet it is precisely on the five-year horizon that it failed to meet its objective
This "style confidence" needs a historical track record to support it: Baillie Gifford once earned excess returns from long-term positions such as Amazon/Tesla, but most names in the current portfolio (Cloudflare, Shopify, Wayfair) have yet to prove they can consistently outperform across a full market cycle.
Potential Points of Attention for the Next Section
Comparison of the global services PMI and the ISM services index since 2018; both are currently in expansion territory
The remaining sections of the report may include: the full portfolio holdings detail, the fund's fee structure, and more detailed "Risk Warnings". The only fee information currently known mentions an annual management fee of 0.50% for the B share class, which is low for an actively managed fund, but also implies that performance differences stem mainly from stock-picking ability rather than fee drag. Going forward, one could watch for whether other cost items exist, such as performance fees or platform fees, and whether the fund imposes any limit on top-ten concentration.
Interpretation of Fund Holdings and Financial Data (six months to 31 October 2025)
1. Sector Weights: Heavy Addition to Technology, Cooling in Industrials and Real Estate
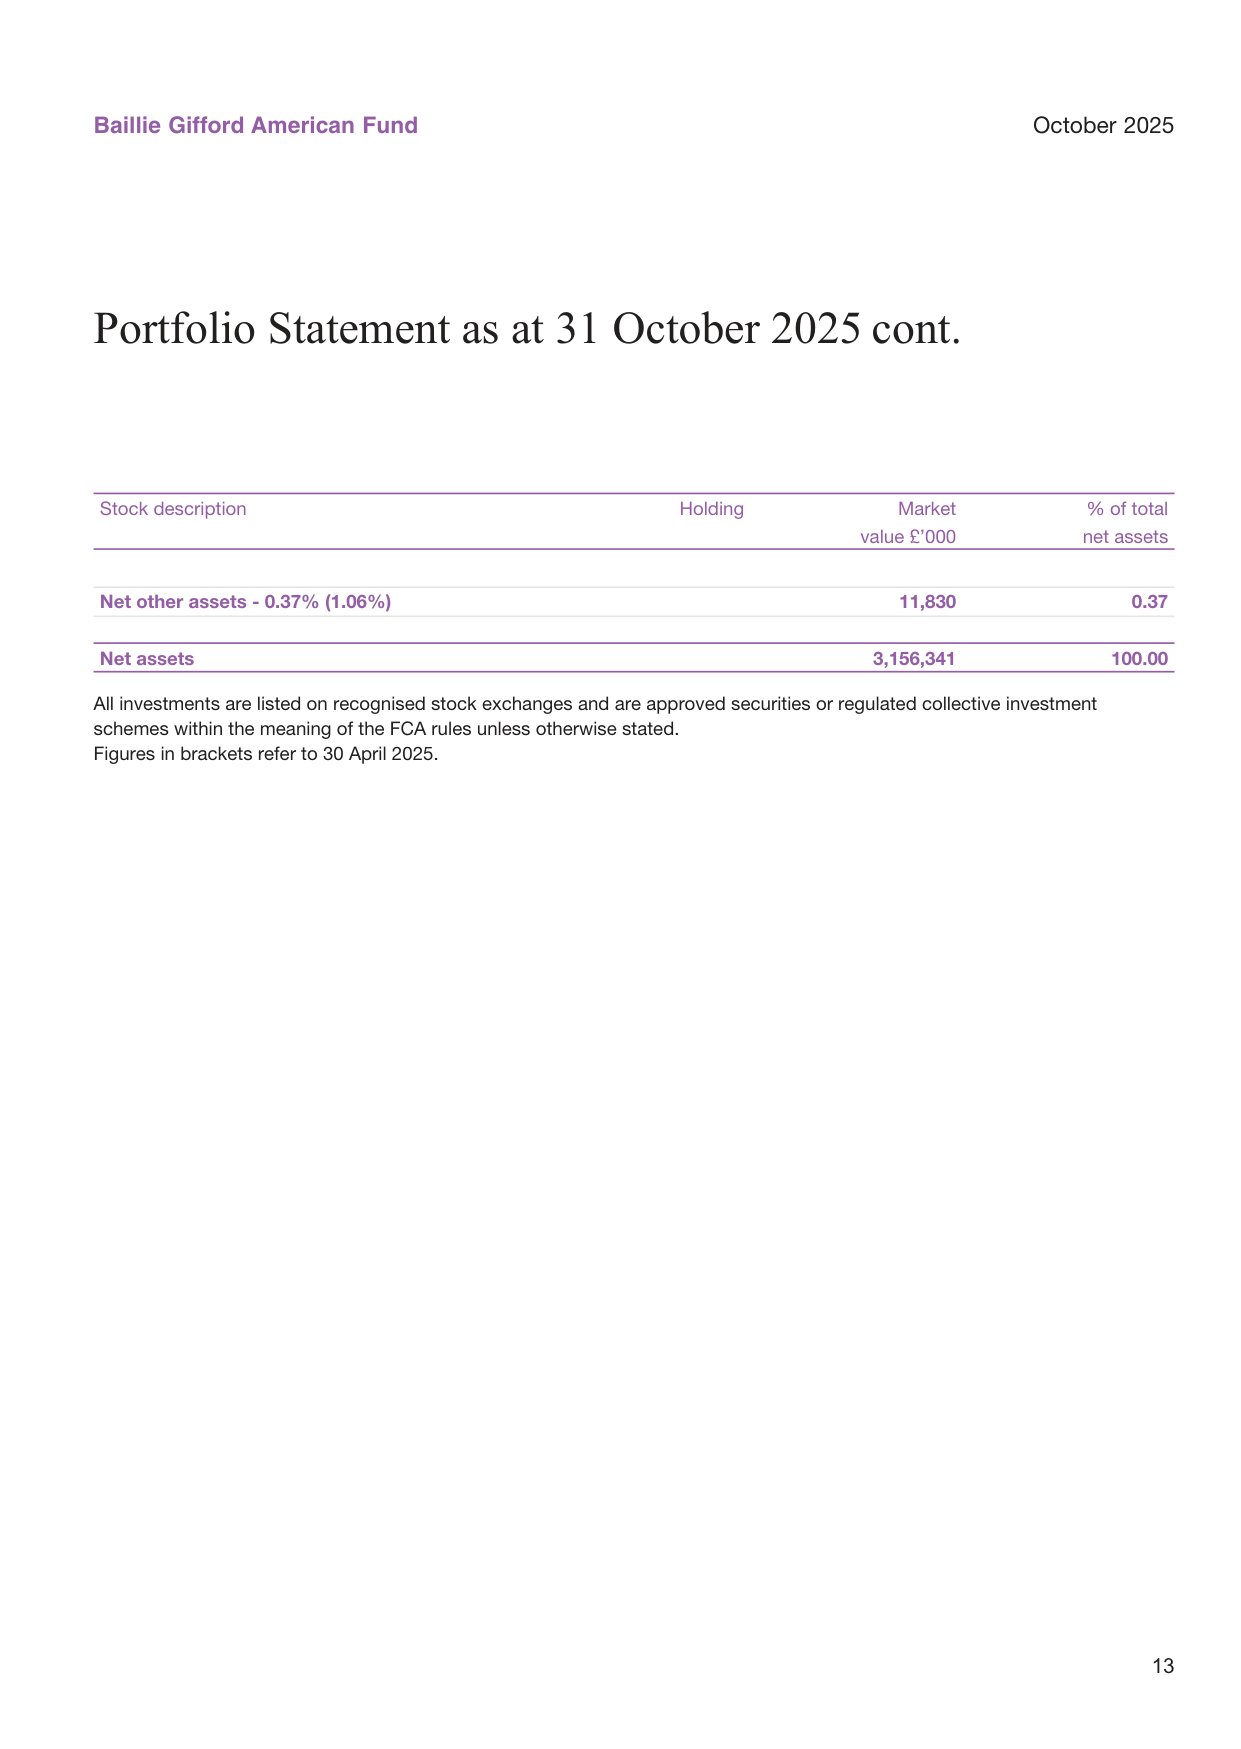
Based on the disclosed holdings data, the Information Technology weight rose sharply from 24.98% to 31.40%, an increase of 6.42 percentage points; while Industrials and Real Estate fell by 0.90 and 0.84 percentage points respectively. Materials rose from a near-negligible 0.04% to 0.82%. At the same time, net other assets contracted from 1.06% to 0.37%, meaning the fund is more fully invested, running close to fully invested.
Comparison of the global manufacturing PMI and the ISM manufacturing index since 2018; both are currently near the 50 boom-bust line
| Sector/item | 31.10.25 weight | 30.04.25 weight | Change (pp) |
|---|---|---|---|
| Information Technology | 31.40% | 24.98% | +6.42 |
| Real Estate | 2.85% | 3.69% | -0.84 |
| Industrials | 1.57% | 2.47% | -0.90 |
| Materials | 0.82% | 0.04% | +0.78 |
| Net other assets | 0.37% | 1.06% | -0.69 |
| Portfolio of investments | 99.63% | ~98.94%* | +0.69 |
*Estimated: 100% − 1.06 (net other assets).
This sector rotation reflects the fund actively increasing its pure technology-growth style exposure while trimming traditional industrial and real estate holdings, consistent with its long-term growth-stock investment logic.
2. Within IT: Cloudflare Jumps to Top Holding — "Cloud + AI + Software" Three-Legged Stool
US core PCE year-on-year inflation path, expected to ease gradually from 2.8% in 2024 to 2.0% in 2025
Within the technology holdings, Cloudflare overtook NVIDIA's 6.37% with 7.53% of net assets to become the fund's largest holding. Shopify followed at 5.48%. The three largest positions together account for approximately 19.38% of net assets — a relatively high concentration.
| Company | Market value (£'000) | % of net assets |
|---|---|---|
| Cloudflare | 237,646 | 7.53 |
| NVIDIA | 201,207 | 6.37 |
| Shopify 'A' | 172,852 | 5.48 |
| Snowflake | 79,558 | 2.52 |
| Datadog | 70,913 | 2.25 |
| Workday | 68,543 | 2.17 |
| AppLovin | 50,632 | 1.60 |
| Samsara | 50,591 | 1.60 |
| Aurora Innovation | 33,677 | 1.07 |
The BIS credit ratio shows the global credit cycle indicator near historical highs, suggesting recession risk over the next 12 months
Cloudflare's rise to the top means the fund has significantly increased its allocation weight to edge networking, cybersecurity and the AI infrastructure layer. NVIDIA remains core, but its proportion has been overtaken by Cloudflare, possibly reflecting the fund manager's rebalancing between AI compute and AI applications/infrastructure.
3. Flows and Asset Growth: Capital Appreciation Is the Only Driver, Redemption Pressure Visible
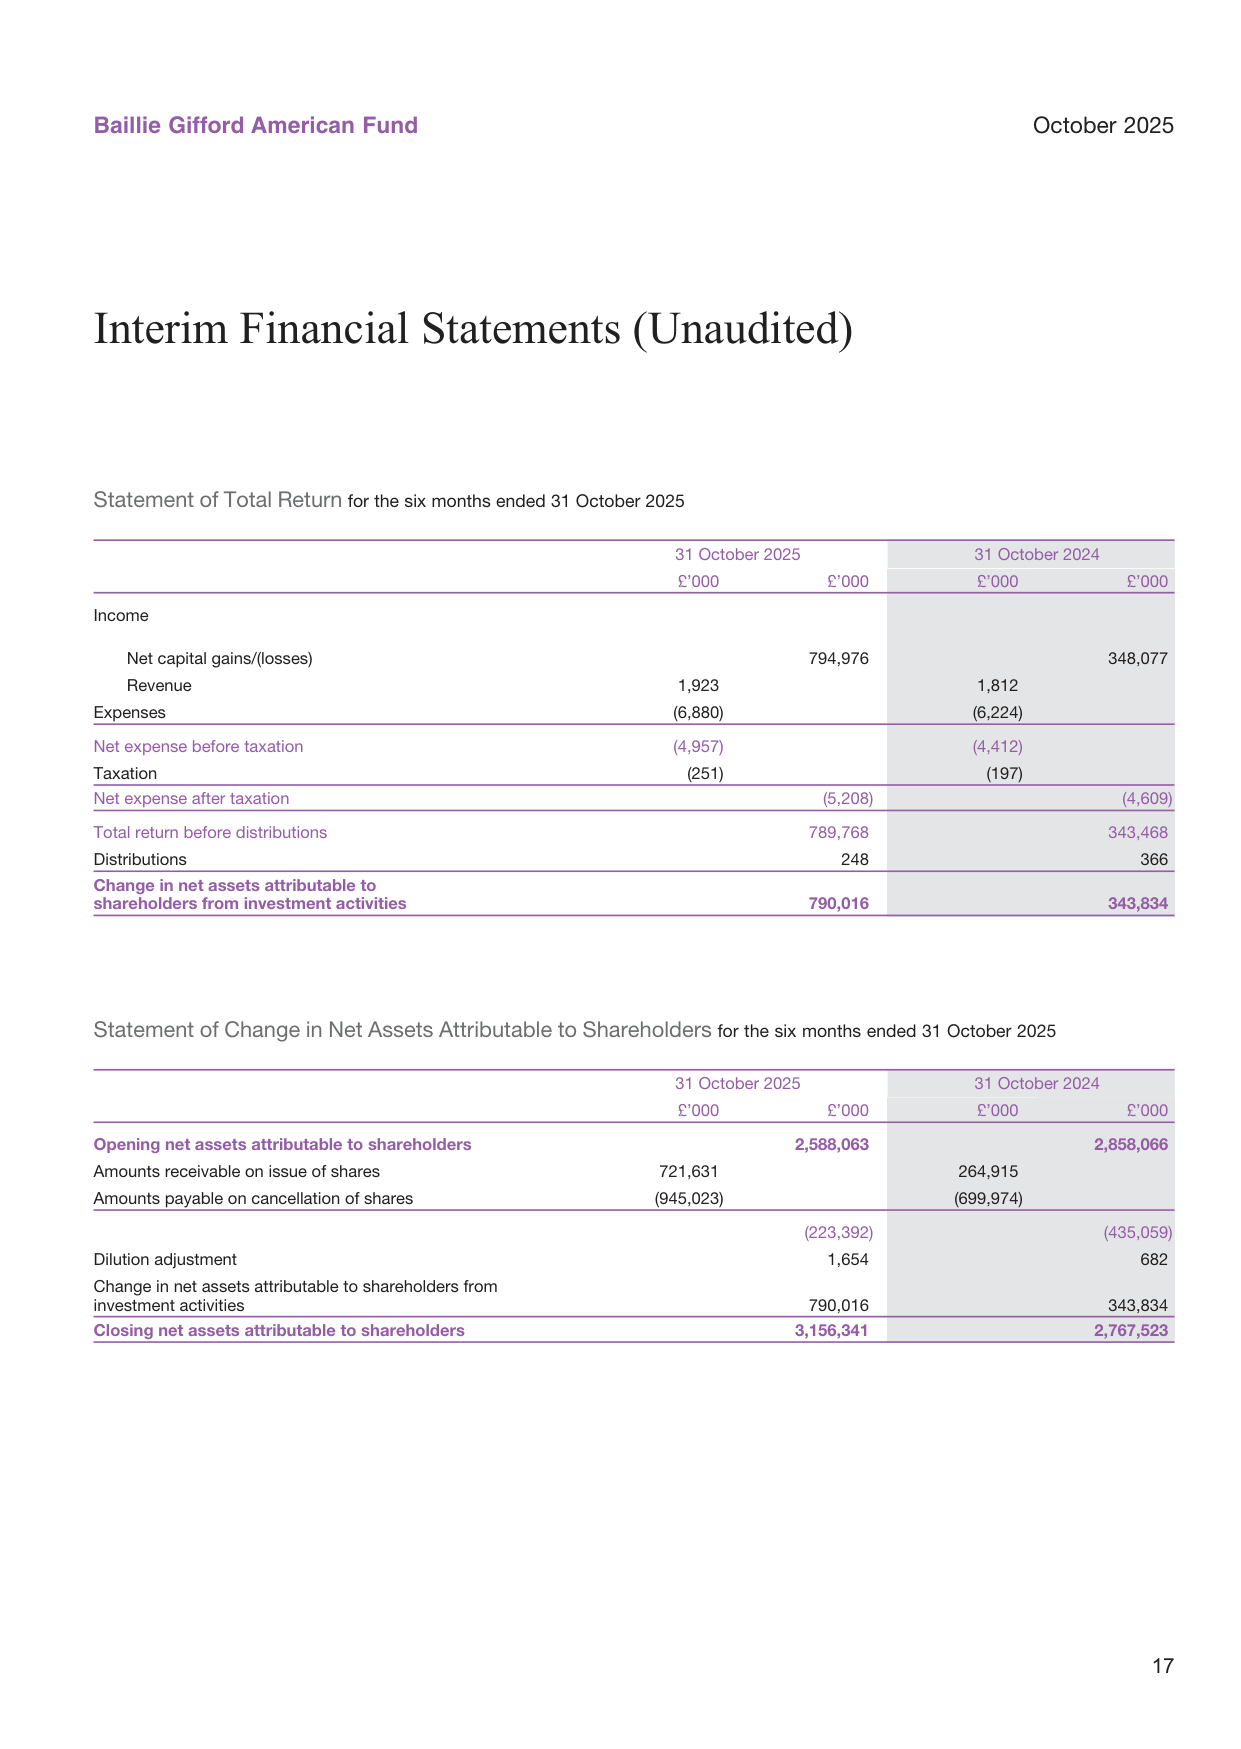
As at 31 October 2025, the fund's net assets increased from £2,588.1m at the start of the period to £3,156.3m, up 21.9%. However, net flows were negative over the period: subscriptions of £721.6m and redemptions of £945.0m, for net redemptions of £223.4m. In other words, asset growth was generated entirely by investment activity (£790.0m), not by new money inflows.
Comparison of global trade growth and industrial production growth; trade growth recovered from -1% in 2023 to around 2% in 2024
| Financial metric | 2025 six months (£'000) | 2024 comparative (£'000) |
|---|---|---|
| Period-end net assets | 3,156,341 | 2,767,523 |
| Net change from investment activity | 790,016 | 343,834 |
| Net subscriptions/(redemptions) | -223,392 | -435,059 |
| Net capital gains | 794,976 | 348,077 |
| Total income | 1,923 | 1,812 |
Total return for the reporting period was approximately 2.3 times the prior-year period, showing a marked recovery in the market environment for growth stocks. But heavy redemptions also tested the fund manager with a headwind: achieving net asset growth despite net redemptions of £223m relied chiefly on a sharp rise in the market value of holdings.
4. Share Class Performance: NAV Gains Near 30%, Fee Differences Affect Long-Term Returns
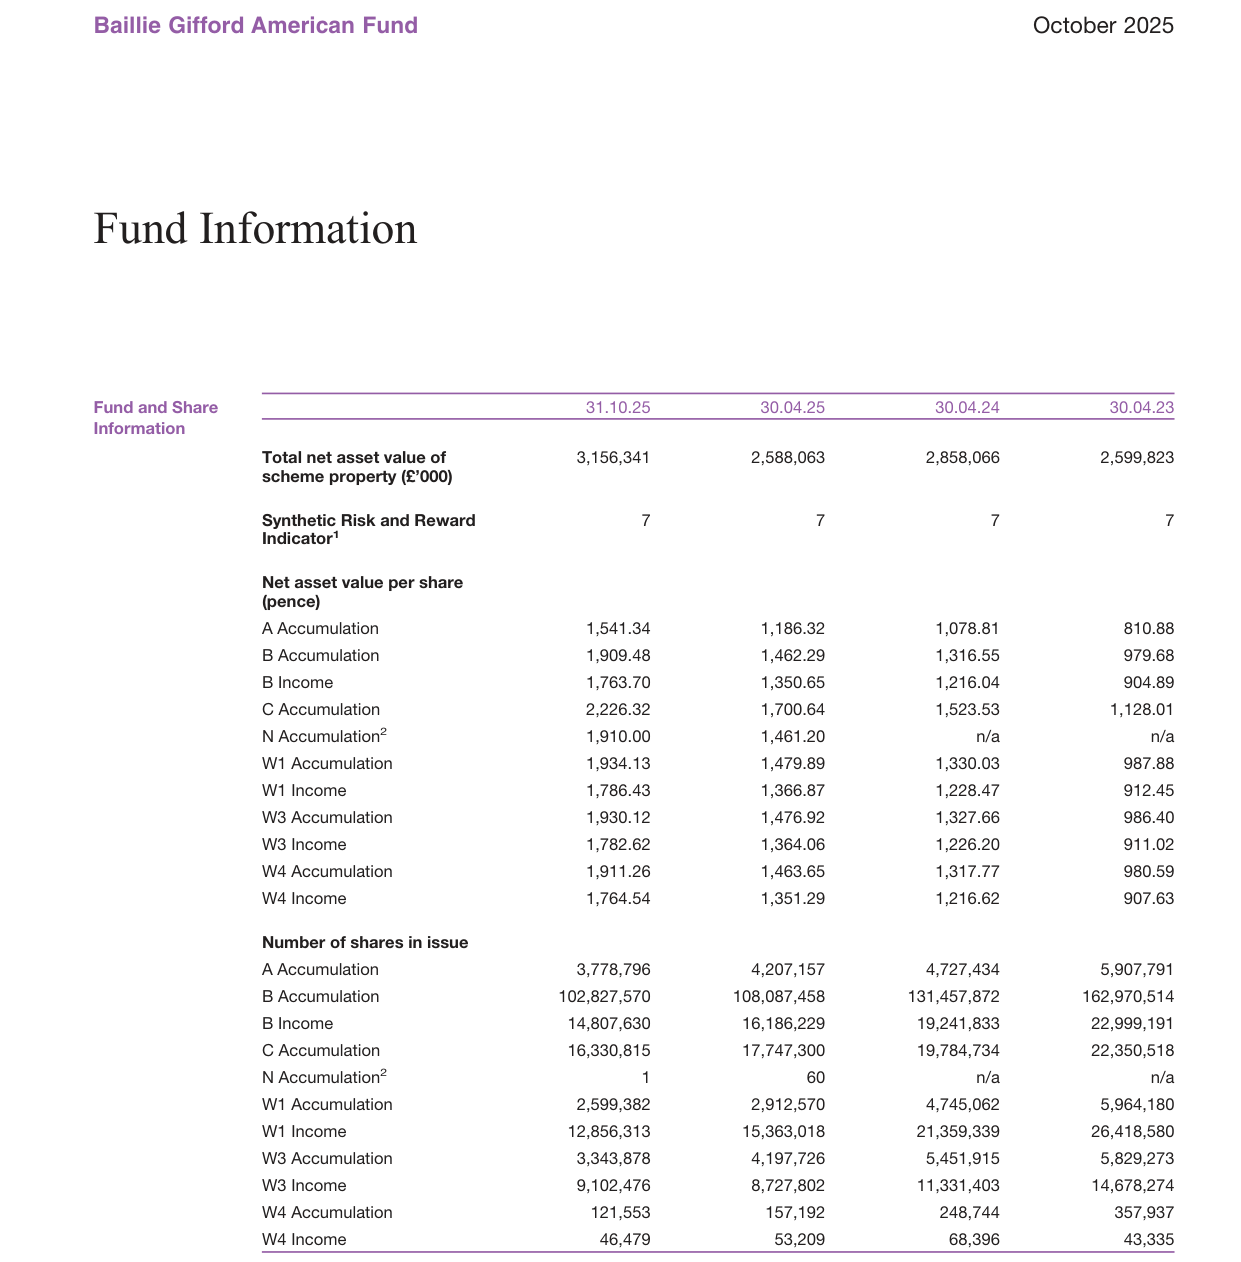
The NAV of the six accumulation share classes each rose by approximately 30% over six months, reflecting strong consistency in the fund's overall performance:
US industrial production indices; AI-related industry indices show notable growth, while traditional manufacturing grows at around 2%
| Share class | 31.10.25 NAV (pence) | 30.04.25 NAV (pence) | Increase |
|---|---|---|---|
| A Accumulation | 1,541.34 | 1,186.32 | +29.9% |
| B Accumulation | 1,909.48 | 1,462.29 | +30.6% |
| C Accumulation | 2,226.32 | 1,700.64 | +30.9% |
| W1 Accumulation | 1,934.13 | 1,479.89 | +30.7% |
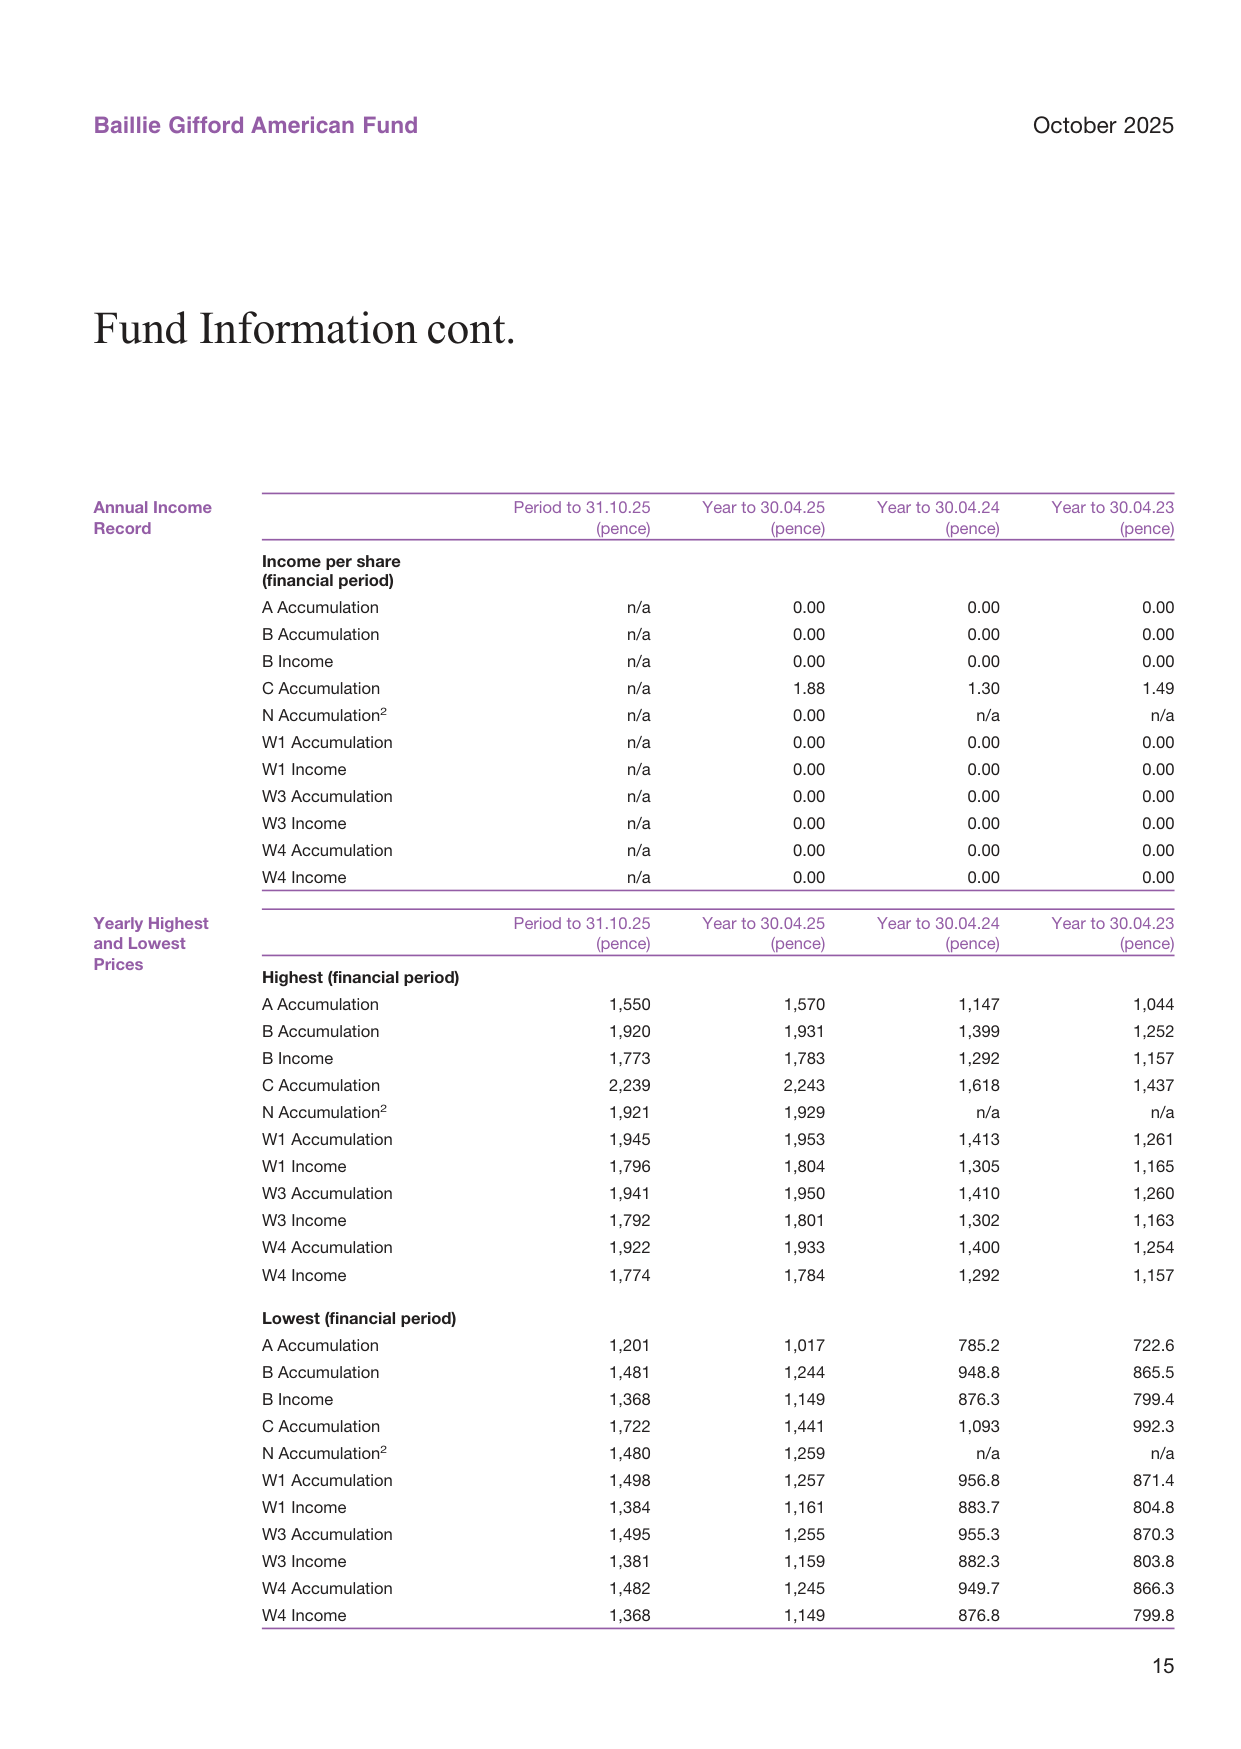
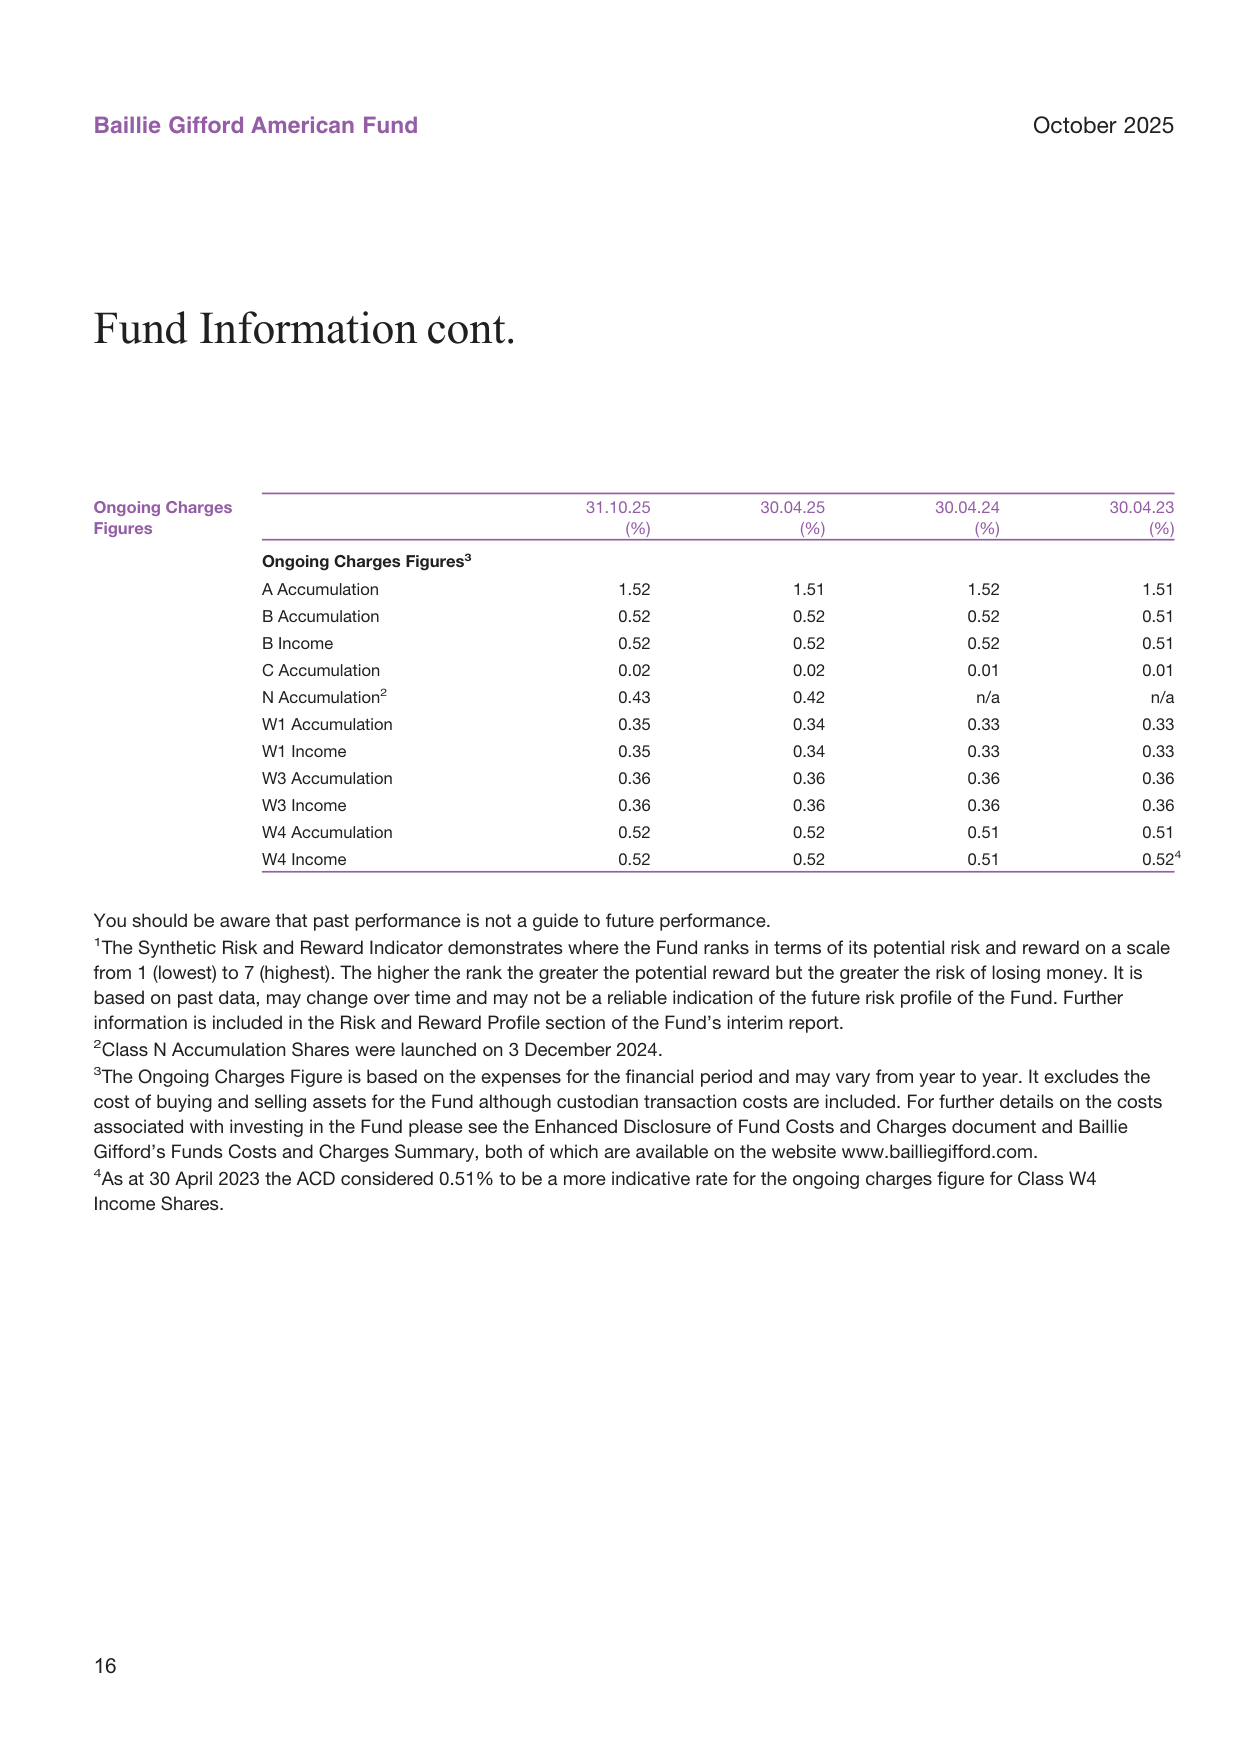
On fees, the C share class sits at the absolute low end with Ongoing Charges of 0.02% and posted the highest NAV increase over the period; the A share class has a fee rate as high as 1.52%, yet still recorded a return close to 30%. This shows that fees appear to have a limited impact on short-term performance, but under long-term compounding, the gap between the A and C classes will widen significantly.
| Share class | Ongoing Charges 31.10.25 | 30.04.25 |
|---|---|---|
| A Accumulation | 1.52% | 1.51% |
| B Accumulation | 0.52% | 0.52% |
| C Accumulation | 0.02% | 0.02% |
| W1 Accumulation | 0.35% | 0.34% |
Both auto sales (linear) and manufacturing output (linear) show cyclical fluctuations; both have rebounded in tandem recently
5. Balance Sheet Signals: Fully Invested Operation, Large Payables Emerge
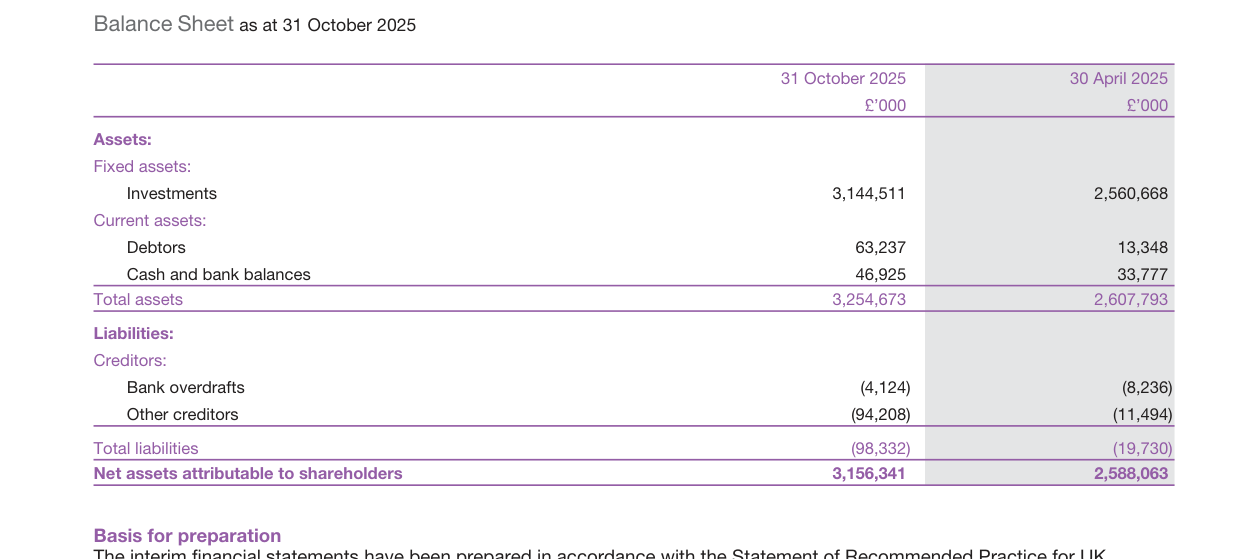
As at 31 October 2025, other payables increased sharply from £11.5m at the start of the period to £94.2m, while debtors rose from £13.3m to £63.2m. This is likely related to large subscription/redemption trades near the period end that had not yet settled. Cash deposits were £46.9m and bank overdrafts £4.1m, giving net cash of £42.8m — liquidity remains ample.
Net other assets fell from 1.06% to 0.37% of the portfolio, showing the fund is almost fully invested in securities with very little cash retained, further amplifying the impact of equity market volatility on NAV.
6. Risk and the Following Sections
The fund's Synthetic Risk and Reward Indicator remains at 7 (the highest risk level), and the approximately 30% return over the past six months is the typical behaviour of a high-volatility portfolio in a bull market. The report then moves to the China Fund section, whose investment objective explicitly flags risks specific to the Chinese market: market volatility, political and economic instability, market suspension risk, and liquidity/settlement/corporate governance/regulatory risks among others. This forms a differentiated risk structure versus the American Fund's developed-market holdings; one should watch whether the China Fund's holdings and performance can similarly benefit from the growth-stock rebound.
I. The Blind Zone of Risk Disclosure: A High Rating Does Not Equal True Risk
The ratio of US household net financial wealth to disposable income fell from 6.5x in 2020 to 5.8x in 2024
The risk and reward rating table places the fund in a relatively high risk band, but the deeper problem with this risk disclosure is that the rating system itself has three structural blind zones:
1. The coarse-grained judgement that "the asset class determines the risk". The rating is based primarily on the fund's investment in equities, not on risks specific to the Chinese market. For a fund that holds Chinese companies on a concentrated basis, the rating can neither distinguish the risk difference between large state-owned banks and small/mid-cap growth stocks, nor reflect the regulatory and policy risks of overseas-listed Chinese stocks.
2. The rating indicator does not include active management risk. The original text states explicitly: "The indicator does not take into account the relevant material risks: The Fund is actively managed." This means the risk rating reflects only the market volatility dimension, while risks arising from active stock selection — tracking error, style deviation, concentrated holdings — are entirely outside the rating framework. The actual performance of the past five years proves precisely this point: the most serious losses did not come from market beta, but from misjudged alpha in active management.
3. Liquidity risk and the risk of charges eroding capital are hidden from view. The original text mentions in only one paragraph that redemptions may be delayed under extreme market conditions and that custodian insolvency could cause losses, but for a China fund these two items are not tail risks — the abrupt collapse of Chinese stock liquidity since 2022 and the turmoil at several overseas banks have already verified the reality of such risks. Moreover, the "charges taken from capital" provision further compresses principal in loss-making years, effectively increasing investors' real burden when markets fall.
II. The Five-Year Examination Paper: The Quantified Gap Between Objective and Reality
Composition of global central bank foreign exchange reserves; the US dollar share fell from 65% in 2015 to 57% in 2024
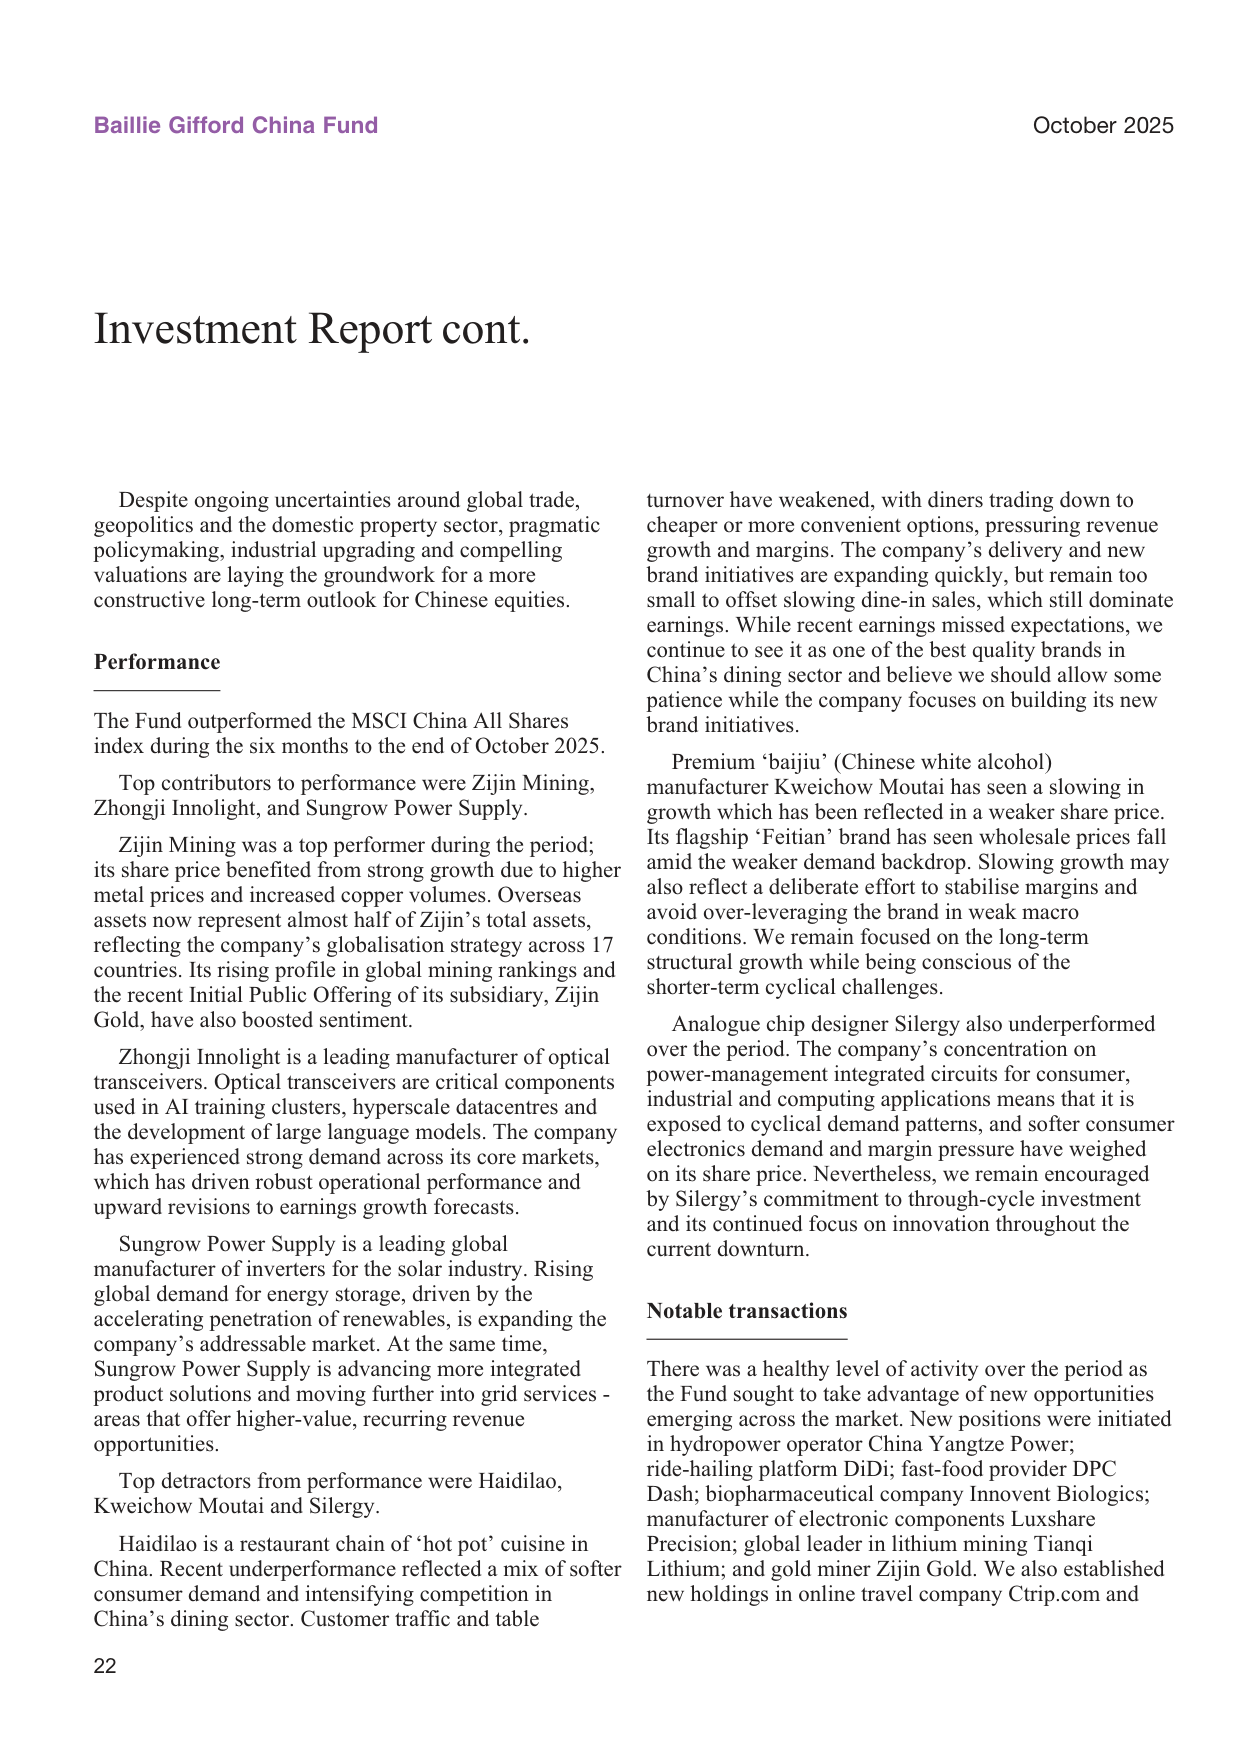
The fund set an objective of outperforming the index by 2 percentage points, but the report card of the past five years shows a clearly negative slope. Converting the key data into an investment scenario:
| Investment scenario | Annualised return | Five-year cumulative amount (£1,000 initial investment) | Cumulative gain/loss |
|---|---|---|---|
| B accumulation share class | -4.1% | £810.6 | -£189.4 |
| MSCI China All-Share Index | -0.7% | £965.5 | -£34.5 |
| Target return (index + 2%) | +1.4% | £1,071.9 | +£71.9 |
Once the metrics are broken down, it becomes clear at a glance:
- The fund lagged the index by an average of 3.4 percentage points per year, with a cumulative five-year gap of approximately £155;
- It lagged the preset objective by 5.5 percentage points per year, a cumulative five-year shortfall of approximately £261;
- Even with the strong 28.6% rebound of the most recent six months, the five-year horizon remains in negative-return territory, showing just how deep the earlier NAV damage was.
Local-currency bond yield spreads between emerging markets and developed markets; the spread narrowed from 400bp in 2022 to the current 150bp
Notably, between October 2021 and October 2022 the fund fell -30.1%, close to the index's -31.5%, and did not use active management to avoid the systemic drawdown. The coexistence of "sharp rebounds" and "deep drawdowns" is precisely the most typical NAV trauma pattern for a high-volatility, high-drawdown growth fund — the rebound is fast, but the compounding base has already been severely eroded.
III. The Engine of the Six-Month Rebound: Physical Assets and AI Compute Advancing Together
The six-month return of 28.6% delivered a modest outperformance versus the index's 27.4%, just matching the objective. The industrial-chain logic of the top three contributors has distinct contemporary characteristics:
| Company | Industry | Upside driver |
|---|---|---|
| Zijin Mining | Metals and mining | Higher copper and gold prices + overseas asset expansion + subsidiary IPO boost |
| Zhongji Innolight | Optical modules/AI infrastructure | Explosive demand from large-model training clusters for high-speed optical modules |
| Sungrow Power Supply | New-energy storage | Accelerating global storage penetration + expansion into high-value grid-service segments |
Decomposition of the US 10-year Treasury yield; the real-rate contribution is approximately 2.0% and the inflation-expectation contribution approximately 2.2%
These three cases reveal a clear stock-selection thread: the fund is shifting from the traditional internet-consumption narrative (Tencent, Alibaba and PDD remain core base holdings but are no longer the incremental engine) toward a twin-engine drive of "re-rating of China's physical assets" and "AI compute capex". Zijin Mining represents resource security, Zhongji Innolight represents AI hardware export capability, and Sungrow Power Supply represents the global competitiveness of new-energy equipment — together, the three point to the segments of China's economic industrial chain that truly hold global pricing power.
IV. A Barbell Portfolio: Rebalancing Defence and Growth
The top ten holdings together account for approximately 45.4%, with a clearly bipolar sector distribution:
| Category | Representative holdings | Combined weight |
|---|---|---|
| Internet platforms | Tencent (9.75%), Alibaba (9.07%), PDD (3.51%), NetEase (2.53%) | 24.86% |
| New energy and resources | CATL (4.25%), Zijin Mining (4.21%) | 8.46% |
| Financials | Ping An (3.47%), China Merchants Bank (3.22%) | 6.69% |
| Consumer | Kweichow Moutai (3.13%), Pop Mart (2.27%) | 5.40% |
The US 10-year minus 2-year Treasury spread; the spread turned from -100bp in 2023 to a current positive 40bp
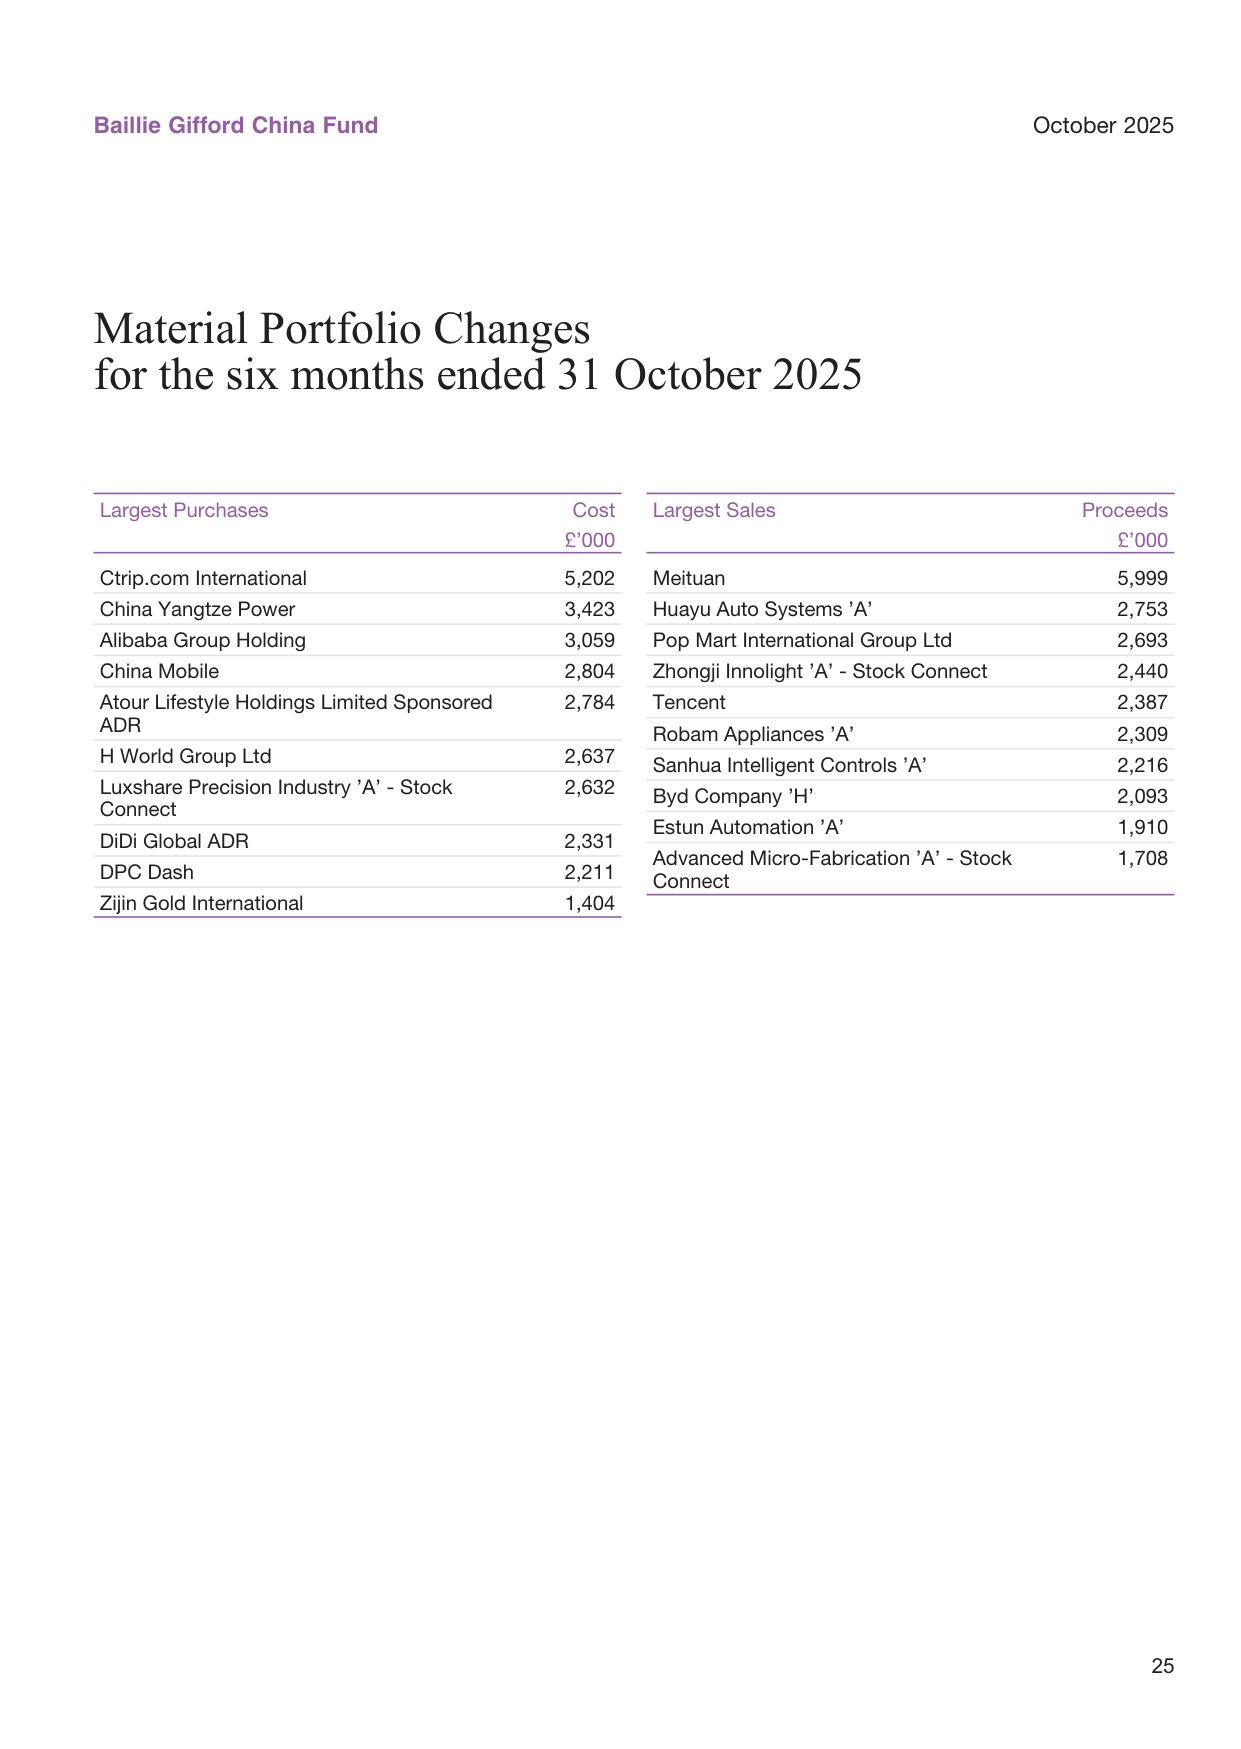
The new positions established in this period further reinforce this barbell structure: at one end are defensive cash-flow assets — China Yangtze Power (hydropower), Zijin Gold International (safe haven), Tianqi Lithium (resources); at the other end are economic-recovery-sensitive assets — DiDi (mobility), Trip.com and H World (travel and hotels), DPC Dash (restaurants), Innovent Biologics (innovative drugs). The reduction side is concentrated in software (Yonyou), medical devices (Sinocare), and traditional auto parts (Huayu Automotive) — industries all facing weakened growth logic or valuation ceilings.
This adjustment direction implies the manager's judgement that China's economy is experiencing "moderate recovery but structural divergence": unwilling to fully miss the elasticity of consumption recovery under policy stimulus, while locking in downside protection through utilities and gold — the overall approach leans toward defence-then-counterattack.
V. Implications for Investors: Distinguishing Rated Risk from Actual Risk
Combining the information in this section, several key insights can be distilled:
First, the risk rating is a static label, whereas actual risk is a dynamic process. Even if the rating table assigns a high rank, it cannot predict the complex behaviour of the Chinese stock market under the impact of multiple variables such as policy shifts, geopolitical conflict and foreign capital flows. The disclaimer "A fund in any rank can lose you your investment" may look like boilerplate, but in the reality of a five-year annualised -4.1% it is the most accurate annotation.
Comparison of high-yield and investment-grade credit spreads; high-yield spreads narrowed from a 2022 peak of 600bp to the current 320bp
Second, consumption stratification is the invisible master logic behind the portfolio adjustments. The declines in Kweichow Moutai and Haidilao are not coincidental — weak wholesale prices for premium baijiu and falling restaurant average order values reflect the same thing: traditional social and conspicuous consumption is contracting. The new additions of Pop Mart, Trip.com and H World correspond to the resilience of young people's self-pleasing consumption and mass travel demand. China's consumer market is not shrinking as a whole; rather, a profound consumption stratification is under way, and the fund portfolio has adjusted accordingly.
Third, the honesty and limitations of the five-year evaluation framework. The manager explicitly states that "short-term performance measurements are of limited relevance" and insists on judging its own ability over a five-year cycle. This stance is internally consistent in investment logic — growth investing requires time to be validated. But the reality is that over the past five years the fund not only failed to achieve its objective but also lagged the benchmark by 3.4 percentage points per year, indicating a systematic mismatch between strategy and market style. Whether the adjustments are sufficient to reverse this trend still requires observation over a longer cycle.
V. Full Picture of Holdings: Asset Allocation Thinking from the Portfolio Detail
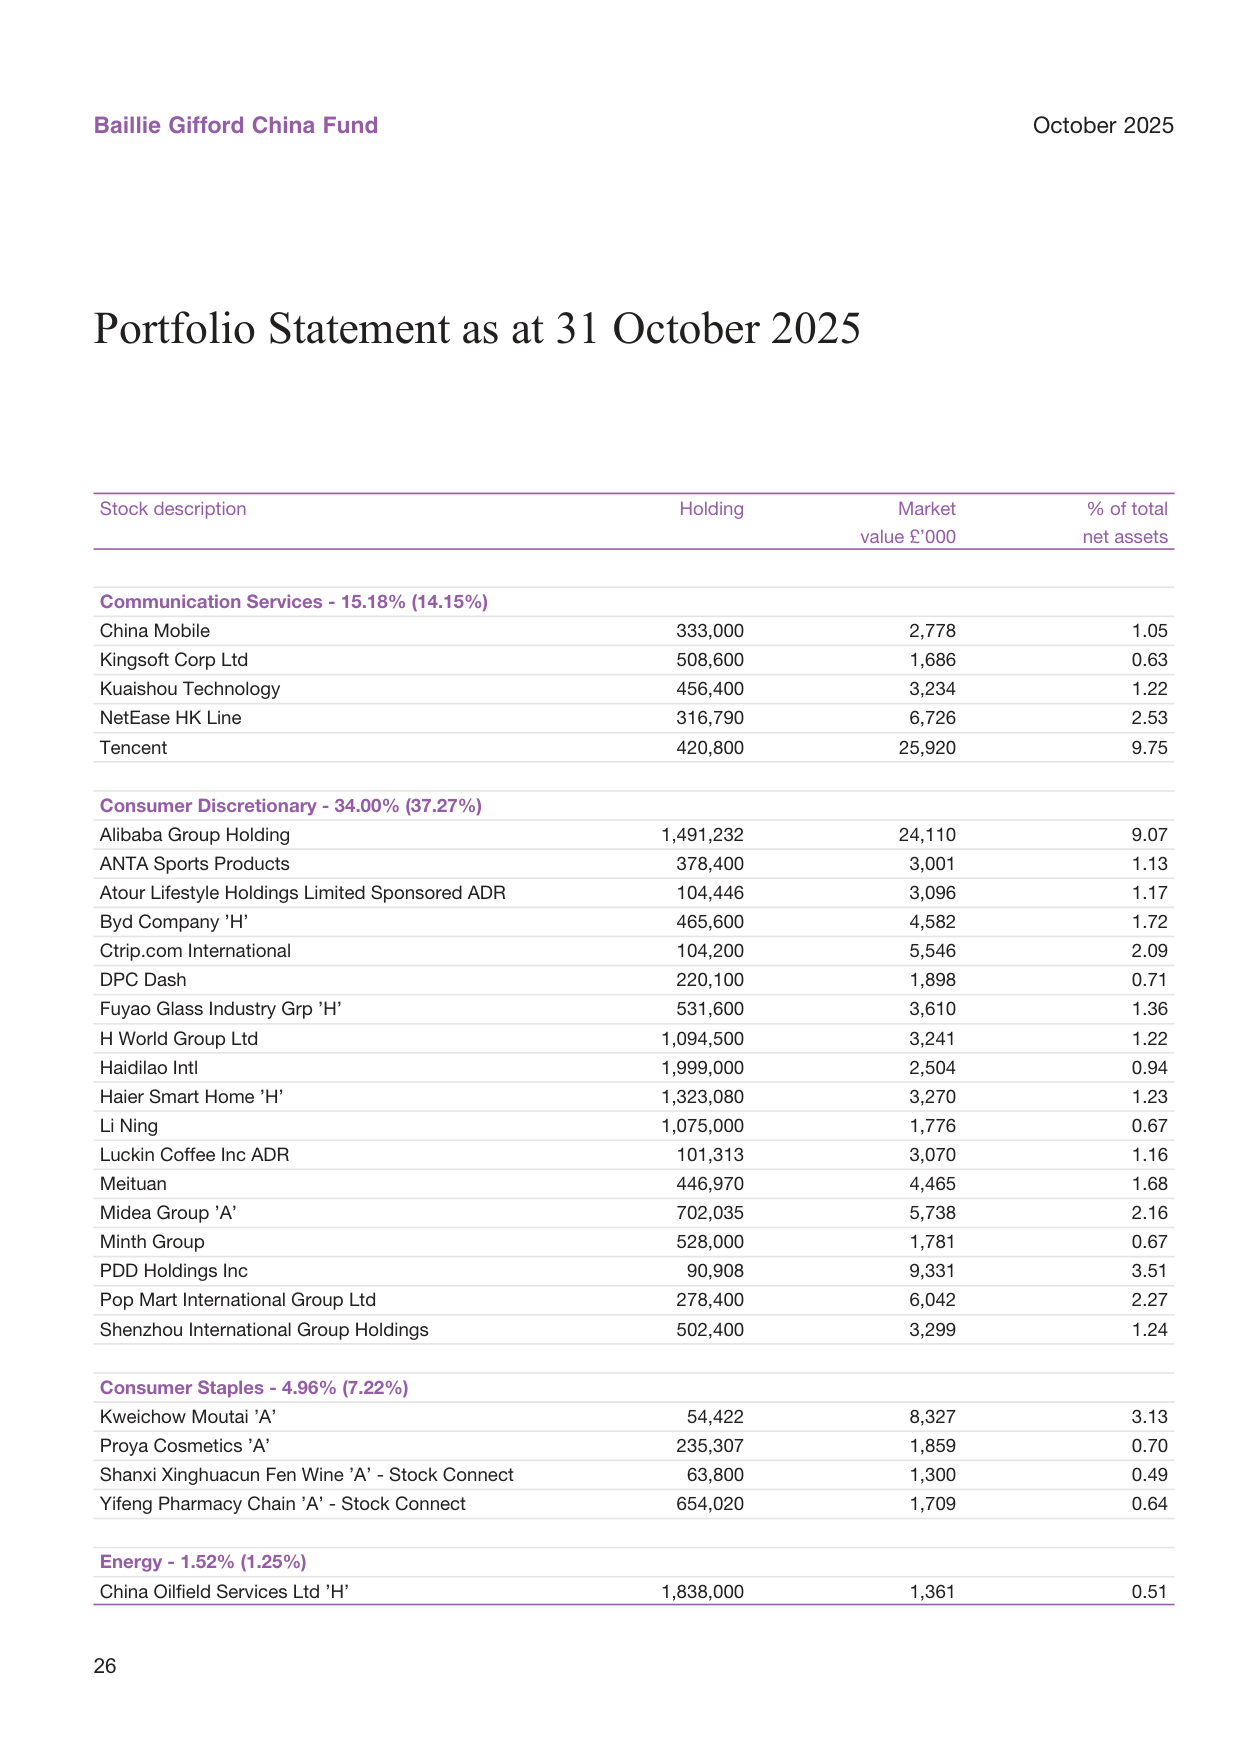
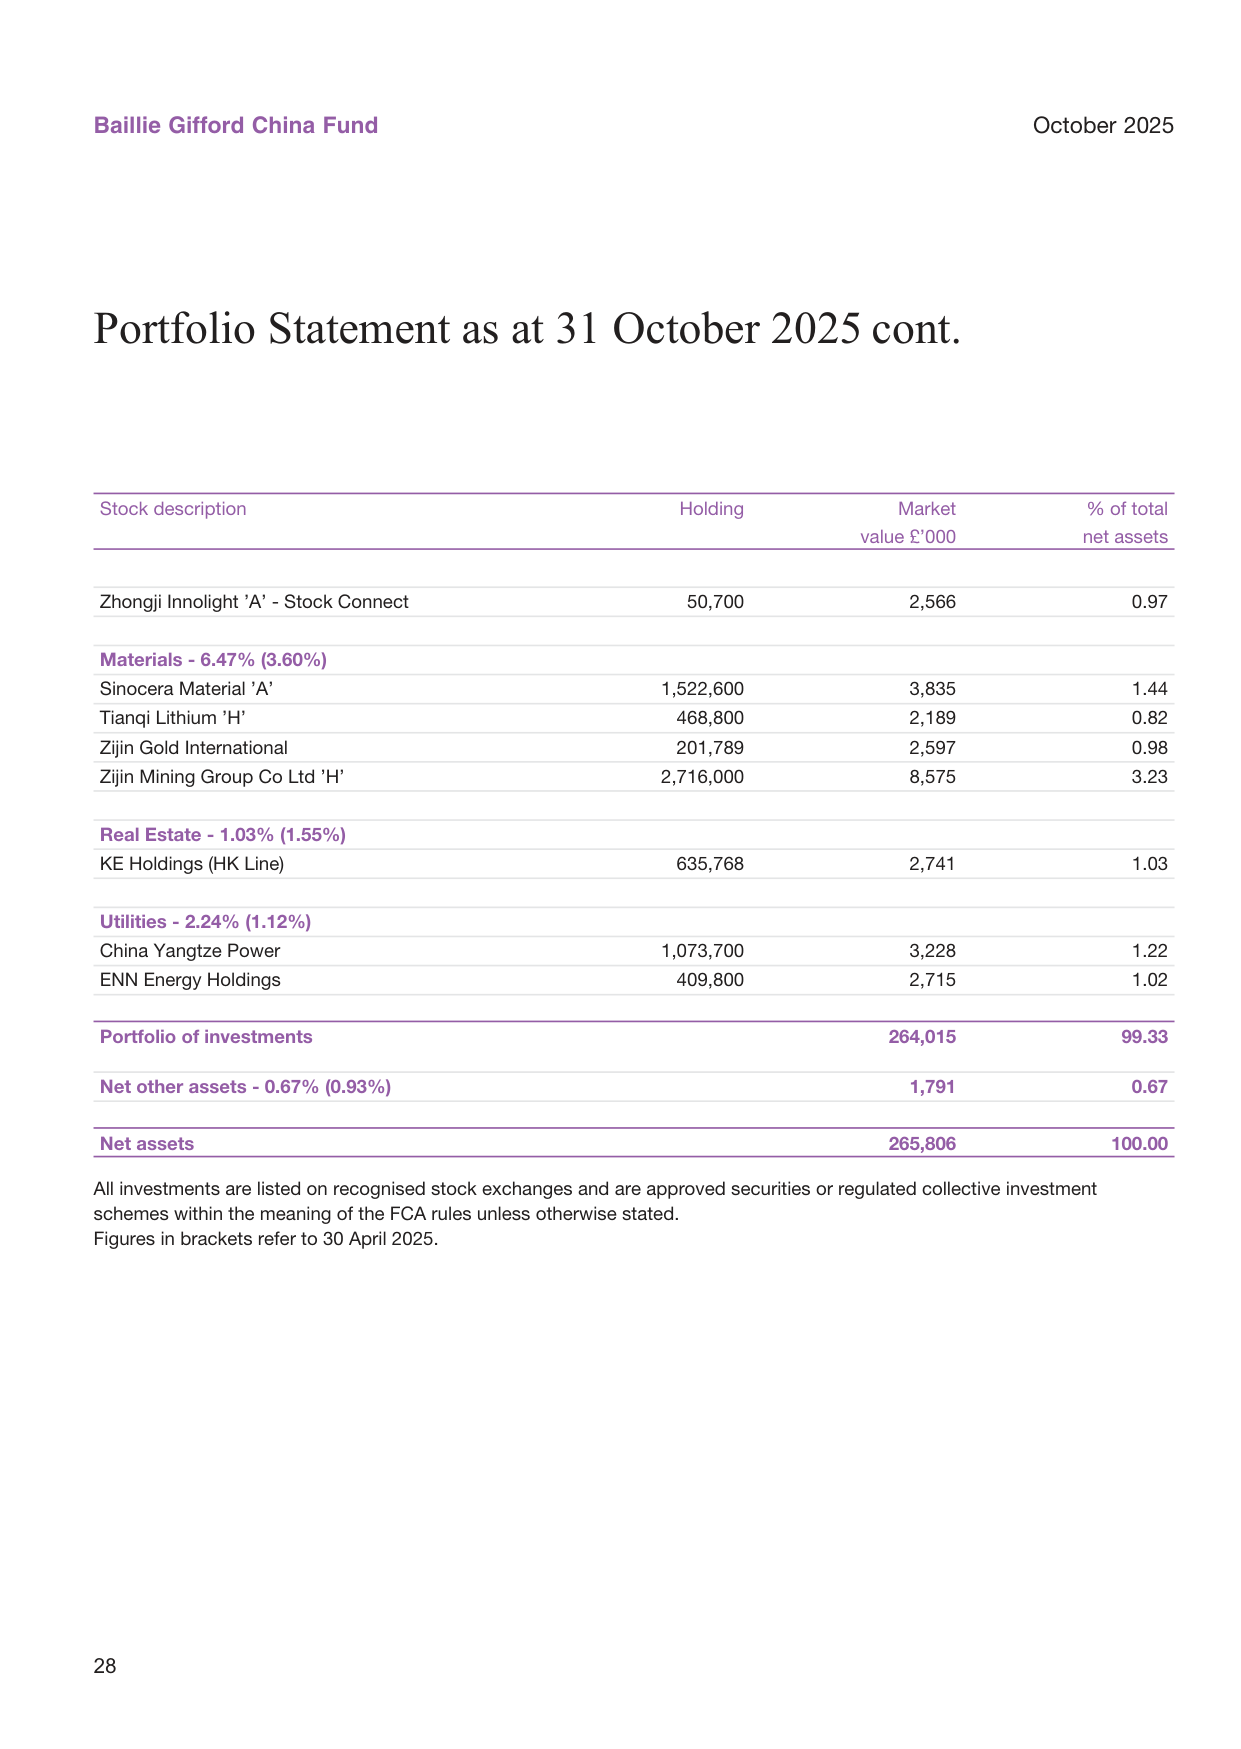
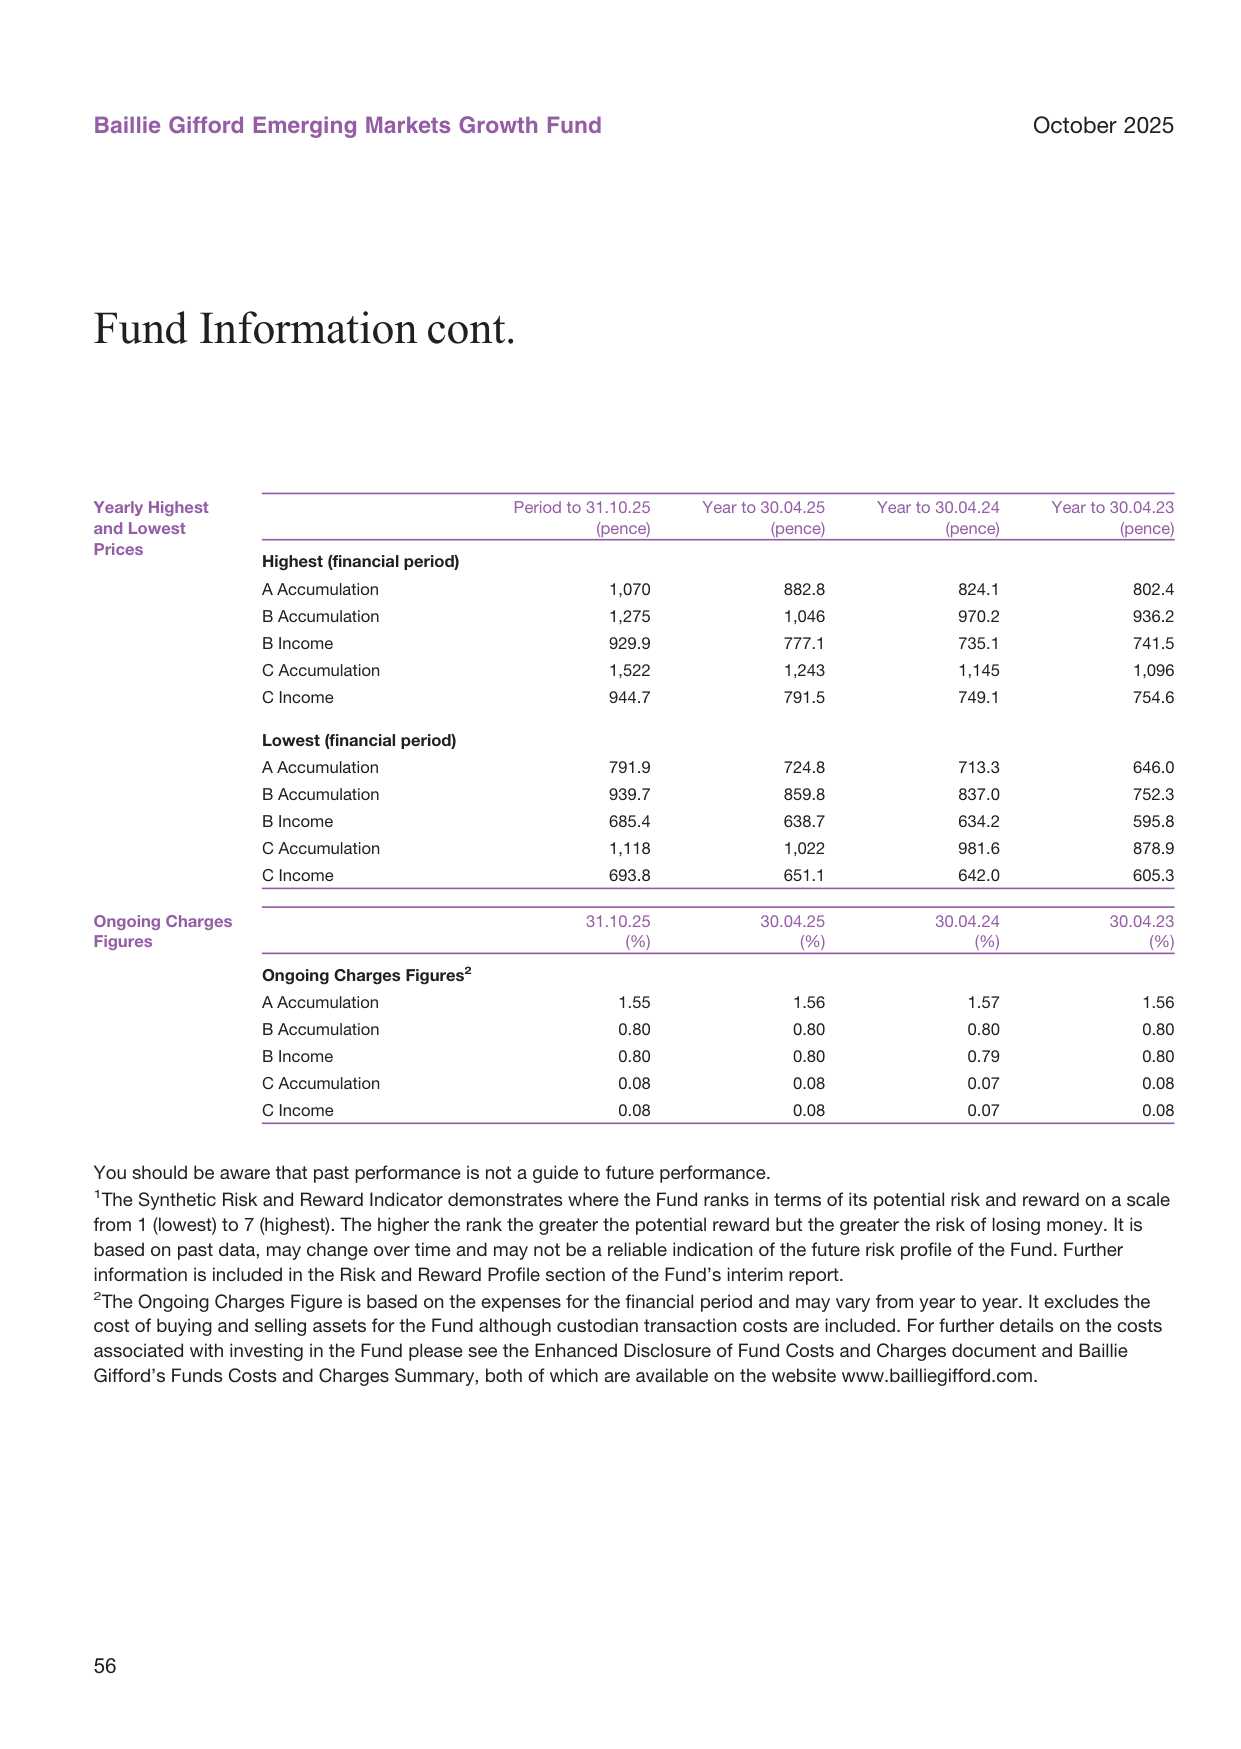
This complete holdings detail as at 31 October 2025 reveals the substance of the fund's adjustment direction over six months. A careful comparison of sector weight changes reveals a more refined logic than simply "overweighting the new economy".
5.1 Sector Weights: Resources and Manufacturing Step Up, Consumer Weights Clearly Give Way
Global corporate bond rating migration matrix, showing upgrades accounted for 35% of rating changes in 2024
| Sector | 31.10.25 weight | 30.04.25 weight | Change (pp) |
|---|---|---|---|
| Materials | 6.47% | 3.60% | +2.87 |
| Industrials | 15.02% | 12.78% | +2.24 |
| Utilities | 2.24% | 1.12% | +1.12 |
| Communication Services | 15.18% | 14.15% | +1.03 |
| Information Technology | 9.66% | 9.61% | +0.05 |
| Energy | 1.52% | 1.25% | +0.27 |
| Financials | 6.69% | 7.14% | -0.45 |
| Real Estate | 1.03% | 1.55% | -0.52 |
| Health Care | 2.56% | 3.38% | -0.82 |
| Consumer Staples | 4.96% | 7.22% | -2.26 |
| Consumer Discretionary | 34.00% | 37.27% | -3.27 |
Global M&A deal value and IPO proceeds; 2024 M&A deal value was approximately US$3 trillion
Behind the weight changes are two forces at work: first, the rise in market values from the overall rebound in Chinese assets; second, the fund manager's active structural adjustments. The Materials weight nearly doubled, while Consumer Discretionary and Consumer Staples together shrank by 5.53 percentage points — the most striking feature of this round of adjustment.
5.2 The Marked Increase in Materials: Resources Become a New Main Line
The Materials sector rose from 3.60% to 6.47%. Given that the fund's total assets grew 21.9% over the same period, price increases alone are insufficient to explain this change — active buying can be inferred. The specific holdings structure is clear at a glance:
| Security | Market value (£'000) | % of net assets |
|---|---|---|
| Zijin Mining Group 'H' | 8,575 | 3.23% |
| Zijin Gold International | 2,597 | 0.98% |
| Sinocera Material 'A' | 3,835 | 1.44% |
| Tianqi Lithium 'H' | 2,189 | 0.82% |
Bar chart of global M&A and IPO volumes; M&A value fell from US$5.5 trillion in 2021 to US$3.5 trillion in 2024
Zijin Mining and its spun-off Zijin Gold International together reach 4.21%; together with Tianqi Lithium (lithium) and Sinocera (electronic ceramics materials), resources have been upgraded from a marginal allocation to a core holding. This reflects the fund manager's judgement on long-term demand for upstream resources such as gold, copper and lithium: global re-industrialisation, the electricity consumption of AI compute infrastructure, and the expansion of the new-energy industrial chain all point to sustained tightness on the resource side.
5.3 Industrials: A Gathering Place for Manufacturing Upgrades
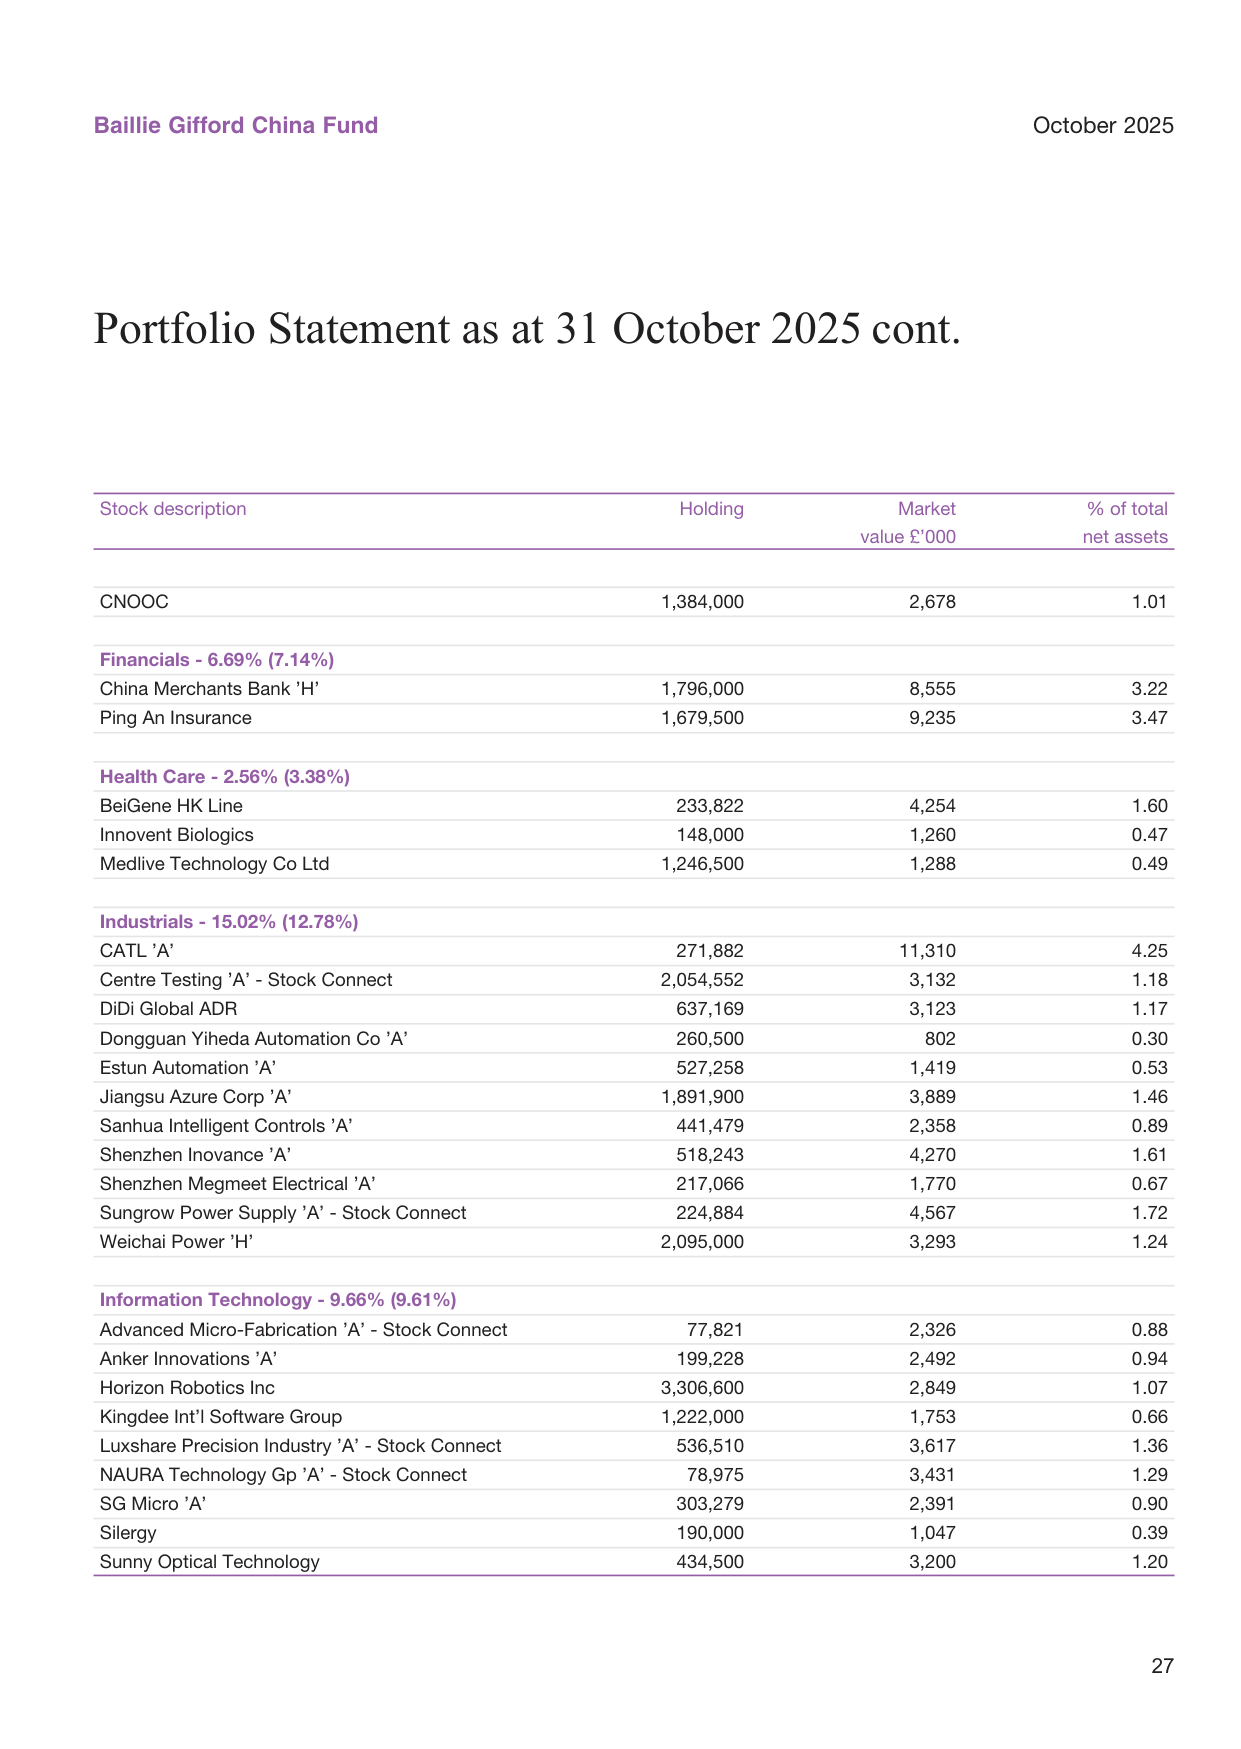
Industrials (15.02%) is already the second-largest sector after Consumer Discretionary, and its weight continues to rise. The holdings composition shows that within this sector the fund is positioned across multiple segments of China's manufacturing upgrade:
The S&P 500's forward 12-month price/earnings (PE) ratio; the current 18.5x is slightly above the 25-year historical average of 17.5x
| Company | Market value (£'000) | % of net assets | Corresponding track |
|---|---|---|---|
| CATL 'A' | 11,310 | 4.25% | EV batteries/energy storage |
| Sungrow Power Supply 'A' | 4,567 | 1.72% | PV inverters/energy storage |
| Shenzhen Inovance 'A' | 4,270 | 1.61% | Industrial automation/EV electronic controls |
| Jiangsu Azure Corp 'A' | 3,889 | 1.46% | Smart manufacturing equipment |
| DiDi Global ADR | 3,123 | 1.17% | Mobility platform |
| Weichai Power 'H' | 3,293 | 1.24% | Heavy trucks/hydrogen engines |
| Centre Testing 'A' | 3,132 | 1.18% | Third-party testing |
| Sanhua Intelligent Controls 'A' | 2,358 | 0.89% | Thermal management |
| Shenzhen Megmeet Electrical 'A' | 1,770 | 0.67% | Power electronics |
| Estun Automation 'A' | 1,419 | 0.53% | Industrial robotics |
| Dongguan Yiheda Automation 'A' | 802 | 0.30% | Automation components |
The density of automation (Inovance, Estun, Yiheda), new-energy equipment (CATL, Sungrow) and advanced manufacturing (Weichai, Sanhua) is high. The value of the Industrials sector lies not in any single heavyweight stock, but in its systematic coverage of the long-term theme of "China's manufacturing upgrade", and its exposure is broader and more diversified than the semiconductor sector.
5.4 Consumer Staples Contraction: Rebalancing Beyond Baijiu
Comparison of the MSCI World Index relative return and the US 10-year Treasury yield; the relative return of equities is 4.5%
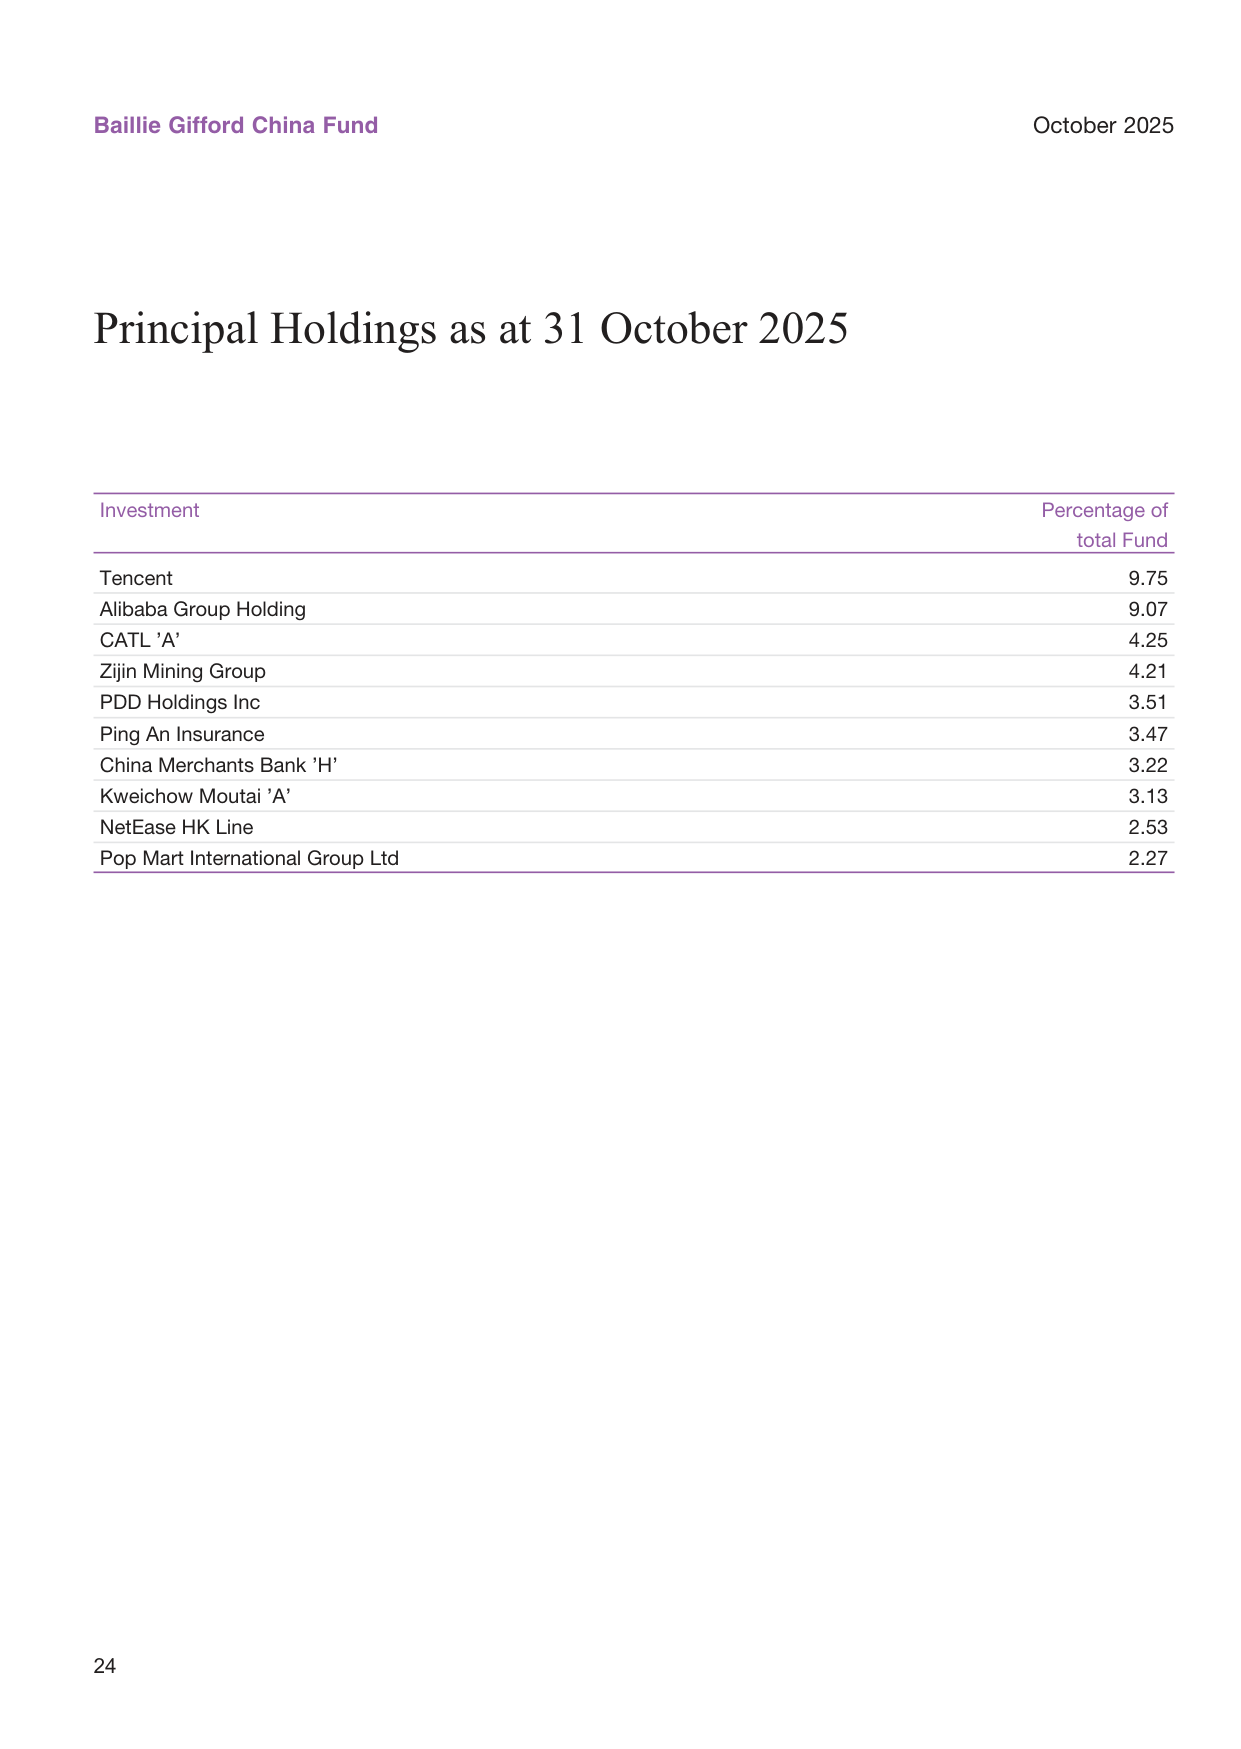
The Consumer Staples weight fell from 7.22% to 4.96%, the second-largest percentage-point decline. In detail:
- Kweichow Moutai remains the largest Consumer Staples holding (3.13%), but the sector's overall weight has fallen;
- Shanxi Fenjiu is only 0.49% and Proya 0.70% — both very small;
- Compared with the more direct consumption-upgrade names such as Pop Mart (2.27%), H World (1.22%), Atour (1.17%) and Luckin Coffee (1.16%), the fund is clearly rotating within consumer from "baijiu/traditional retail" toward "experiential consumption/service consumption".
Hotel, restaurant and hospitality-related holdings such as H World, Atour, DPC Dash and Haidilao together come to approximately 4.26% — names more directly tied to China's local consumption recovery than baijiu.
5.5 Top Ten Holdings: Double-Heavyweight Overweight, Concentration Around 44%
Earnings revision ratios (ERR) for US, European and Japanese equities; the European ERR recovered from -0.3 to 0.1
| Rank | Security | Sector classification | Market value (£'000) | % of net assets |
|---|---|---|---|---|
| 1 | Tencent | Communication Services | 25,920 | 9.75% |
| 2 | Alibaba Group | Consumer Discretionary | 24,110 | 9.07% |
| 3 | CATL 'A' | Industrials | 11,310 | 4.25% |
| 4 | PDD Holdings | Consumer Discretionary | 9,331 | 3.51% |
| 5 | Ping An Insurance | Financials | 9,235 | 3.47% |
| 6 | Zijin Mining 'H' | Materials | 8,575 | 3.23% |
| 7 | China Merchants Bank 'H' | Financials | 8,555 | 3.22% |
| 8 | Kweichow Moutai 'A' | Consumer Staples | 8,327 | 3.13% |
| 9 | Pop Mart International | Consumer Discretionary | 6,042 | 2.27% |
| 10 | Midea Group 'A' | Consumer Discretionary | 5,738 | 2.16% |
Global equity market fund flows; cumulative inflows in 2024 were approximately US$500 billion
The top ten holdings together account for approximately 44.1%, maintaining a high concentration. Tencent and Alibaba together represent 18.82% of net assets — an overweight expression of China's internet duopoly. Worth noting: the threshold for the top ten has fallen to 2.16%, significantly higher than in the past, indicating that while concentration has increased, the portfolio also accommodates positions across more niche tracks.
5.6 Three Market Routes: A-Shares, Hong Kong and ADRs in Parallel
The fund deploys Chinese assets through three market instruments, with different emphases across routes:
| Route | Representative holdings | Estimated combined weight |
|---|---|---|
| Hong Kong (H-shares/Stock Connect) | Tencent, Alibaba, Meituan, BYD, Ping An, Zijin, CMB, NetEase | Approximately 55% |
| A-shares (Stock Connect) | CATL, Midea, Kweichow Moutai, Zhongji Innolight, NAURA, Luxshare | Approximately 20% |
| US-listed ADRs | PDD, DiDi, Luckin Coffee, Atour | Approximately 6% |
Growth in global solar and wind installed capacity; new installations reached 500 GW in 2024
Within the A-share route, semiconductors (NAURA 1.29%, Advanced Micro-Fabrication 0.88%, SG Micro 0.90%, Zhongji Innolight 0.97%) and new energy (CATL, Sungrow, Inovance) are the main destinations. The fund makes good use of the Stock Connect mechanism while retaining the ADR channel for participation in Chinese stocks. Across the three routes combined, the fund's actual exposure to RMB assets is far higher than its sterling-denominated book value suggests.
5.7 The Divergence in Flows: Performance Up, Redemptions Persist
The semi-annual flow data is worth closer examination:
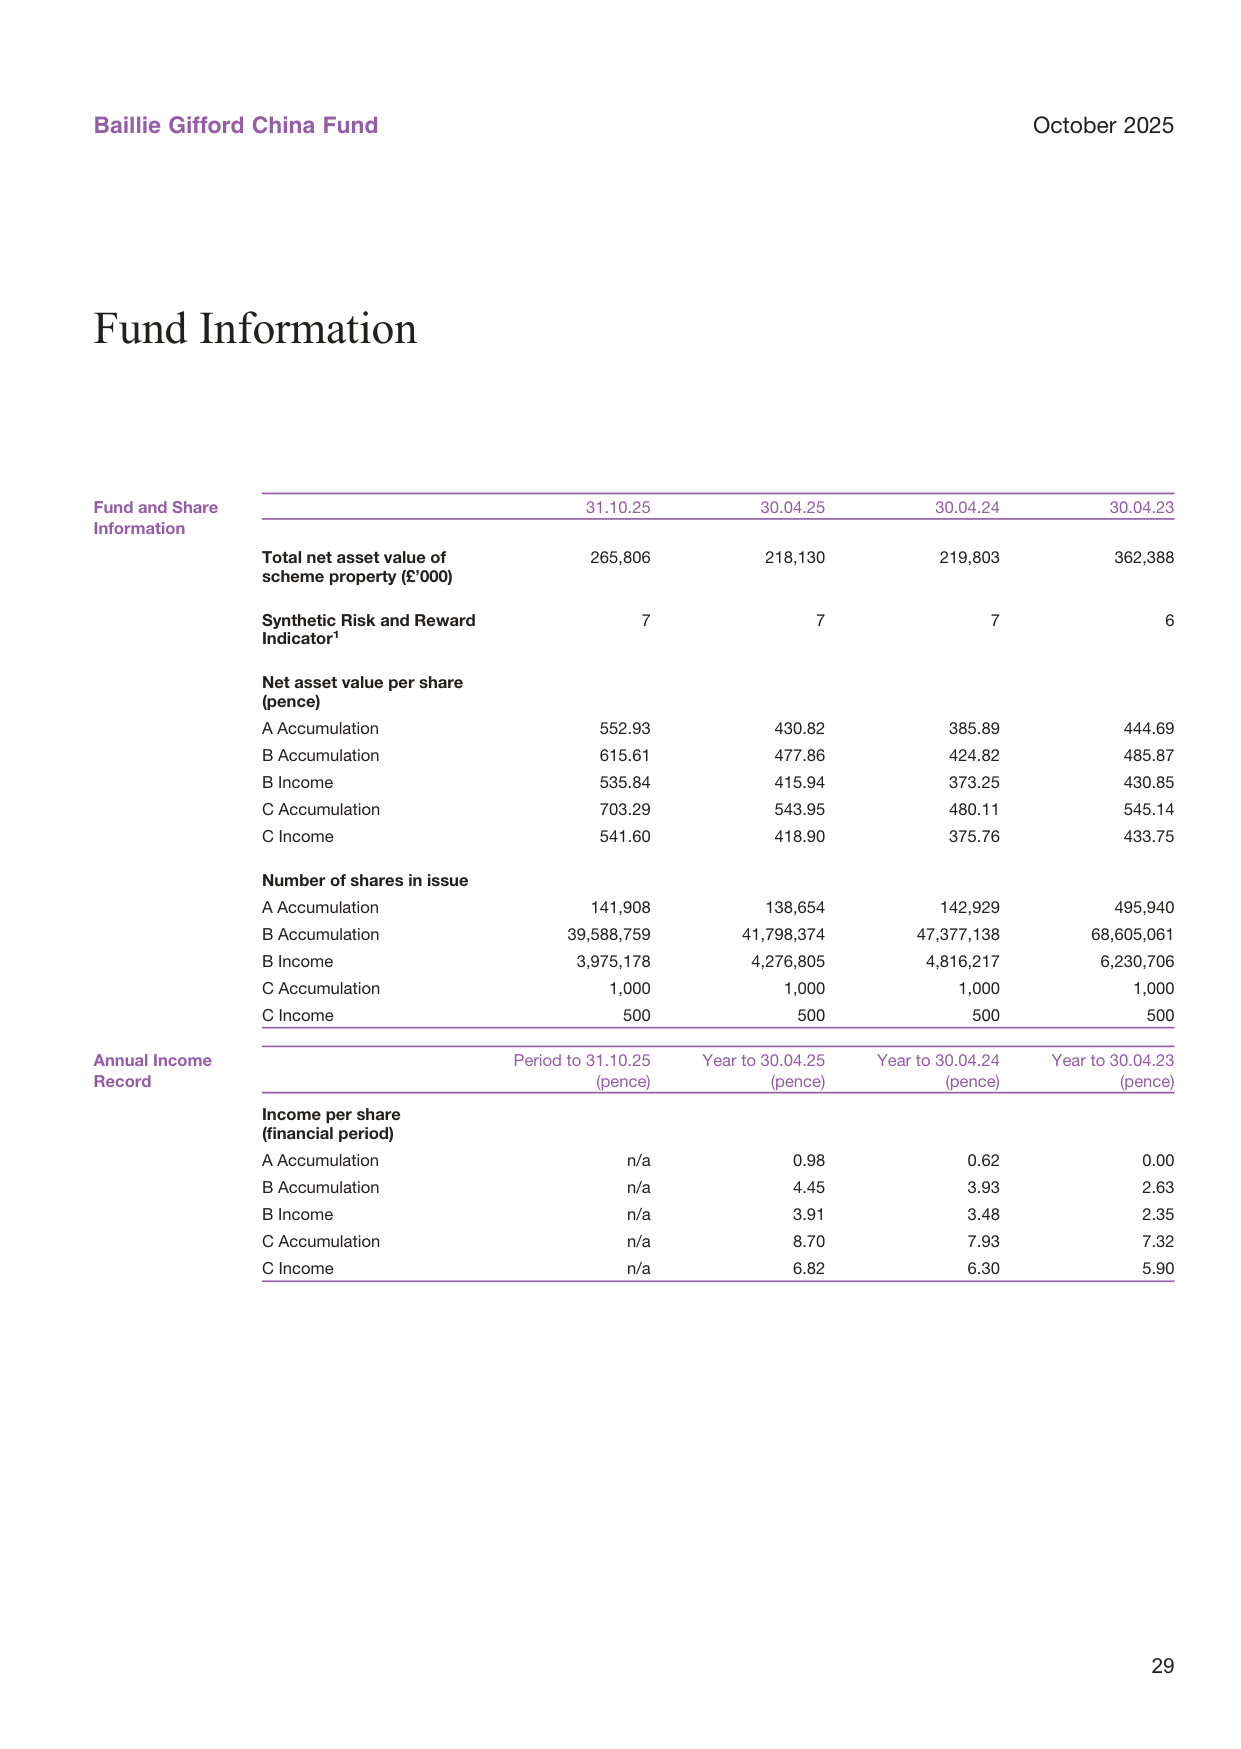
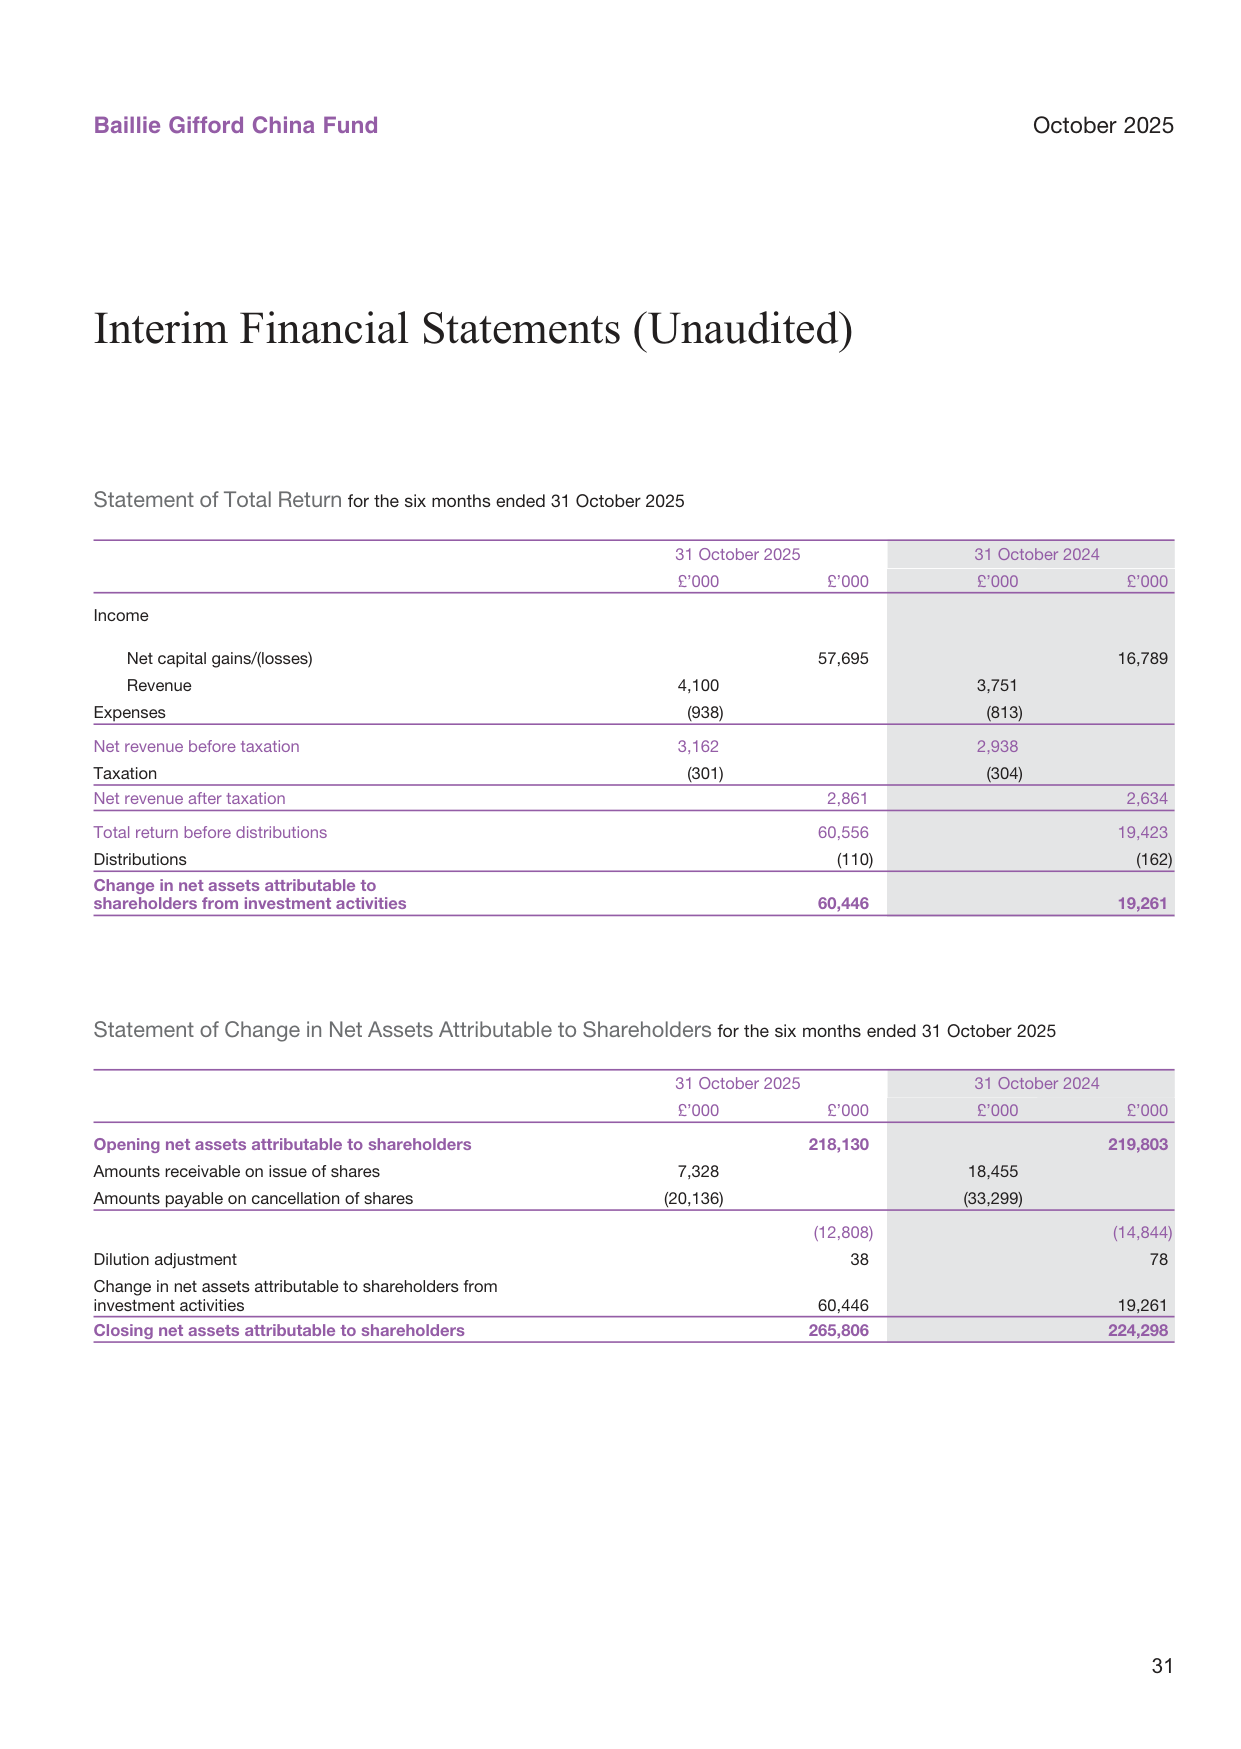
| Metric | 2025 six months (£'000) | 2024 six months (£'000) | Change |
|---|---|---|---|
| Subscriptions | 7,328 | 18,455 | -60.3% |
| Redemptions | -20,136 | -33,299 | -39.5% |
| Net subscriptions/redemptions | -12,808 | -14,844 | Narrowed 13.7% |
| Contribution from investment activity | +60,446 | +19,261 | +213.8% |
| Period-end net assets | 265,806 | 224,298 | +18.5% |
Annual growth in AI-related industry capital expenditure; reached US$250 billion in 2024 and is expected to rise to US$300 billion in 2025
There are two key pieces of information here:
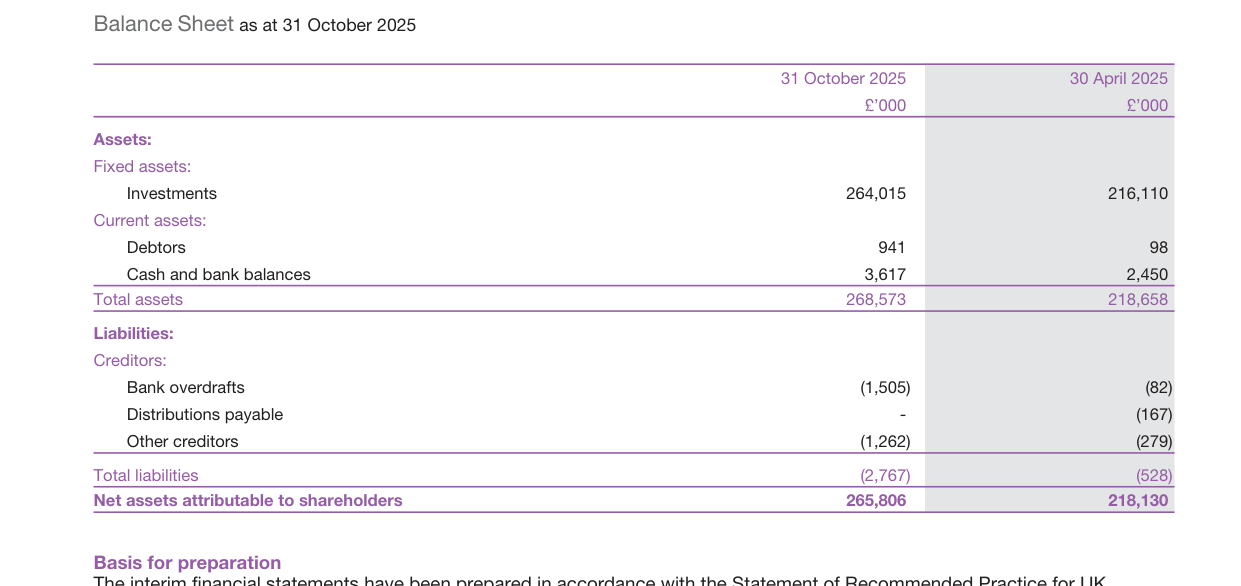
1. Net redemptions persisted for two consecutive semi-annual periods, but the pace slowed: net outflows in H2 2025 were £12.8 million, narrowing by approximately 13.7% year on year. Share data show the B share class fell by approximately 2.51 million shares, while the A share class increased by approximately 3,254 shares, indicating that institutional/wholesale redemptions coexisted with retail subscriptions.
2. The expansion of the fund's size is entirely performance-driven: investment activity contributed £60.4 million over the period, far exceeding net redemptions of £12.8 million, pushing net assets from £218 million to £266 million. This also means that if the market corrects, NAV drawdowns could still trigger a new round of redemption waves — the negative-feedback risk between size and NAV has not been fully eliminated.
This can be seen more clearly in combination with historical data:
Global semiconductor sales; increased from US$500 billion in 2023 to US$580 billion in 2024
| Date | Net assets (£mn) | B accumulation share class NAV (p) |
|---|---|---|
| April 2023 | 362.4 | 485.87 |
| April 2024 | 219.8 | 424.82 |
| April 2025 | 218.1 | 477.86 |
| October 2025 | 265.8 | 615.61 |
From April 2023 to April 2024, net assets shrank 39.3%, far exceeding the NAV decline (-12.6%), showing that redemptions were the main cause of the shrinkage; in 2024-2025 NAV recovered 12.5% but size stagnated, with redemptions still eating into gains; only by October 2025, with NAV up sharply by 28.8%, did size recover significantly. This is a typical "NAV-first, flows-lag" cycle.
5.8 Financial Structure: Capital Gains Dominant, Income Meagre
| Item | 2025 six months (£'000) | 2024 six months (£'000) | YoY |
|---|---|---|---|
| Net capital gains | 57,695 | 16,789 | +243.6% |
| Investment income | 4,100 | 3,751 | +9.3% |
| Expenses | -938 | -813 | +15.4% |
| Taxation | -301 | -304 | -1.0% |
| Net income | 2,861 | 2,634 | +8.6% |
| Total return | 60,556 | 19,423 | +211.8% |
Comparison of the US dollar index (DXY) and emerging market equity performance; emerging markets rise when the dollar weakens
Capital gains account for 95.3% of total return, with income contributing only 4.7%. Distributions over the period were only £110,000, with nearly all earnings reinvested. This is entirely consistent with the fund's "long-term growth" positioning, but it also means the fund is highly sensitive to valuation fluctuations.
Expenses grew 15.4%, slightly faster than income growth of 9.3%. Although the magnitude is modest, the fee-leverage effect deserves continued observation on the back of the fund's size expansion.
5.9 Share Structure and Fees: Three-Tier Customer Segmentation in Parallel
The FOMC dot plot shows the median federal funds rate projected at 3.9% by end-2025
| Share class | 31.10.25 shares | 31.10.25 NAV (p) | Half-year increase | Ongoing Charges |
|---|---|---|---|---|
| A Accumulation | 141,908 | 552.93 | +28.3% | 1.53% |
| B Accumulation | 39,588,759 | 615.61 | +28.8% | 0.78% |
| B Income | 3,975,178 | 535.84 | +28.8% | 0.78% |
| C Accumulation | 1,000 | 703.29 | +29.3% | 0.06% |
| C Income | 500 | 541.60 | +29.3% | 0.06% |
The C share class has a fee rate of only 0.06% and very few shares (1,500 in total across the A/C classes combined), clearly representing co-investment shares for the manager or specific seed investors, and indirectly confirming the alignment of interests between the fund manager and holders. The B share class is the main retail/wholesale share class; its NAV increase is slightly below the C class, mainly because of the compounding effect of fee differences.
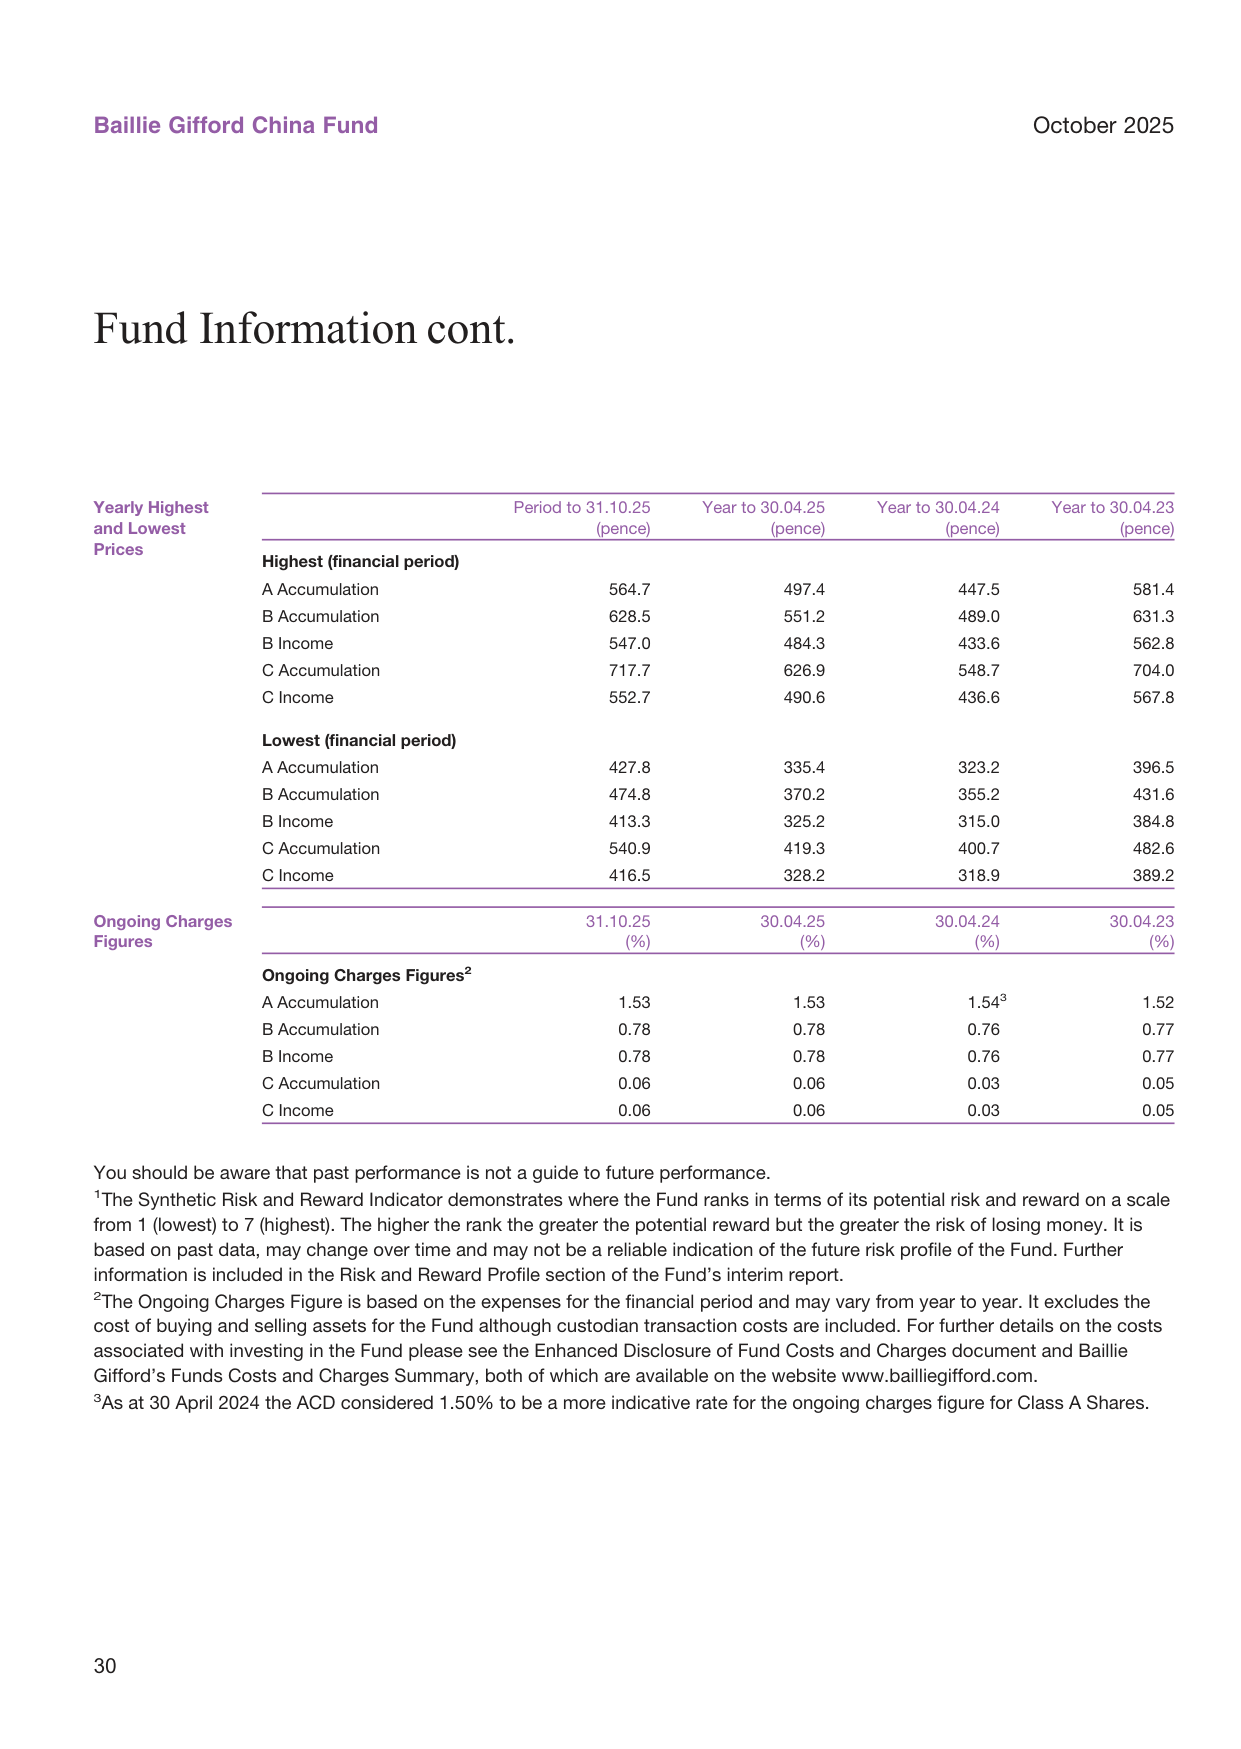
The SRRI risk level remains 7 (highest), combined with the fund's NAV amplitude over the past three years (the B class ranged from a 2023 high of 631p to a 2024 low of 370p, a swing of over 40%) — this is a typical "high-volatility, high-elasticity, long-cycle" allocation vehicle, suited as a satellite position rather than a core holding in a portfolio.
5.10 Summary: The Threefold Logic of Portfolio Rebalancing
Brent crude oil fell from US$100/barrel in 2022 to the current US$80/barrel; natural gas prices declined from US$6/MMBtu to US$2.5
1. Moving upstream: adding resource hedges such as gold/copper/lithium to give the portfolio an inflation-resistant and geopolitical-risk buffer;
2. Moving toward advanced manufacturing: increasing automation and new-energy equipment in the Industrials sector, betting on the continued improvement in the global competitiveness of Chinese manufacturing;
3. Refining consumption: cutting baijiu and traditional retail, rotating toward new consumption experiences (Pop Mart, Atour, Luckin Coffee), capturing the structural opportunities of the young-generation consumption mainstream.
On flows, the fund remains in a phase of "performance-driven repair, with capital not yet returning". If the H2 2025 rally in Chinese assets continues, the narrowing trend in net redemptions could turn into net inflows, at which point the positive feedback between fund size and performance would be reinforced; conversely, high concentration and the highest risk rating also mean that drawdowns will be equally violent.
VI. The "Impossible Trinity" of Benchmark, Objective and Reality
1. The Compounding Trap in the Target Return: An Underappreciated Technical Detail
There is a footnote in the report that investors easily overlook: "The target return outperformance is compounded daily therefore the Index return plus the outperformance will not equal the target return." This fine print contains a demanding structure — daily compounding means that the intraday volatility of the benchmark index is amplified into the calculation of the target return. Mathematically, for an annualised outperformance target of 1.5%, if the benchmark is highly volatile, the actual cumulative target will be higher than a simple linear "index + 1.5%" sum.
The US unemployment rate fluctuates near a low of 3.5%, with initial jobless claims holding at 210,000/week
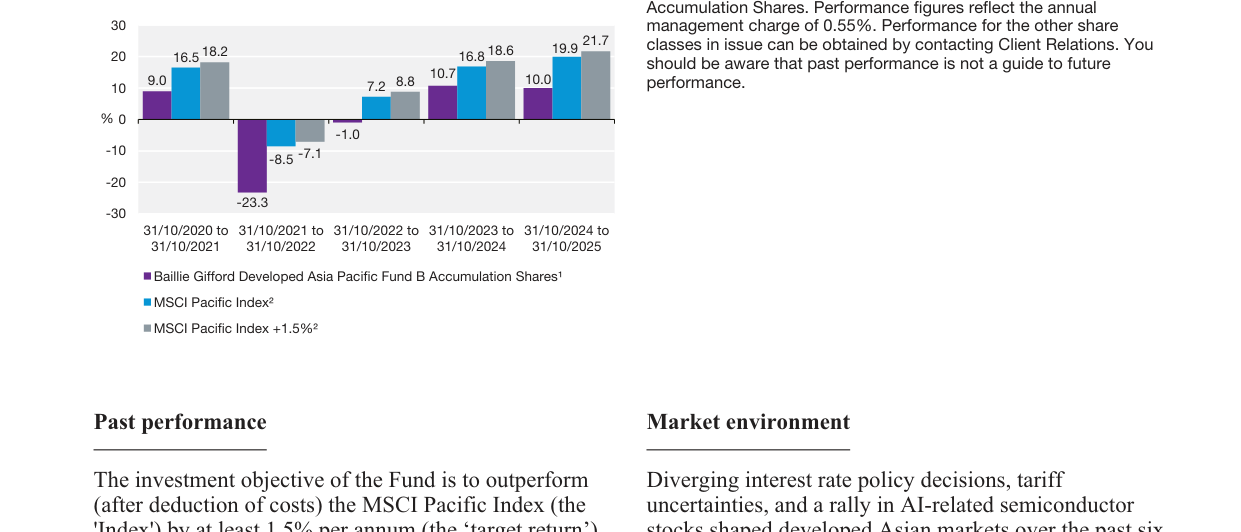
Validating with five-year actual data: the MSCI Pacific Index annualised 9.9%; simply adding 1.5% would give 11.4%. But the fund discloses a target return of 11.5% — that 0.1 percentage point difference is precisely the penalty that daily compounding imposes on benchmark volatility. Turning to the fund itself, its five-year annualised return is only 0.2%, so the gap to the target is not 9.7 percentage points but 11.3 percentage points. Behind this detail is a deeper problem: in a highly volatile Asian market, requiring outperformance on a "daily compounding" basis in fact sets active fund managers a higher implicit degree of difficulty, because the benchmark's own volatility is converted by the compounding mechanism into an additional negative-convexity penalty.
2. A Japanese Market Where Value Overwhelms Growth: A Mechanistic Analysis of Style Mismatch
Over the past six months the Japanese market witnessed a highly symbolic moment: TOPIX broke through its 1989 bubble peak. But the quality of this historic breakthrough needs to be examined through the lens of style and breadth.
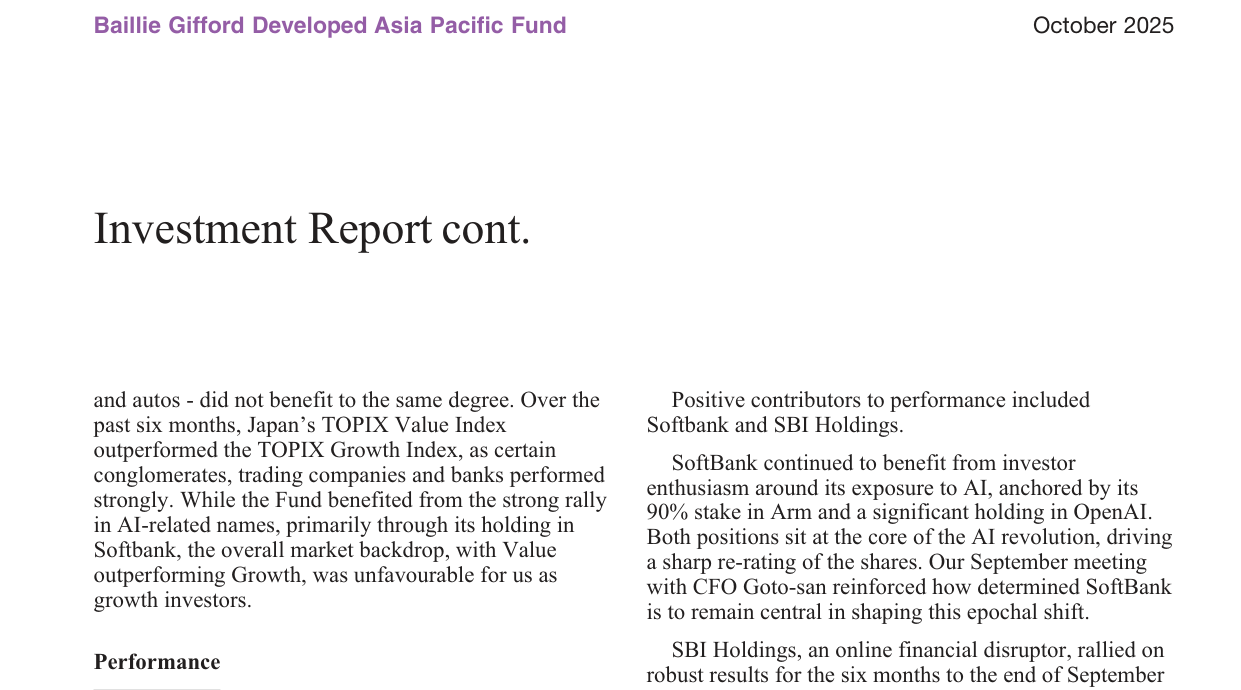
The report acknowledges that this rally was driven by two forces — AI-related semiconductor stocks and traditional value stocks. And TOPIX Value outperforming TOPIX Growth represents a double headwind for Baillie Gifford, which has always adhered to a growth style:
- First: gains in the semiconductor space were highly concentrated in a few individual AI beneficiaries (such as SoftBank), not in semiconductors as a whole; traditional chip companies (chips for computers, phones and autos) did not rise in tandem. This means that even the "technology" label is highly internally fragmented, making it impossible to capture beta through sector allocation.
- Second: Japan is undergoing a paradigm shift from "deflationary growth" to "inflationary value". In the deflationary era, scarce growth commanded an extreme premium; but with inflation returning and rates normalising, "value stocks" trading at valuation discounts have gained a tailwind from earnings upgrades. This is precisely the typical shape of Japan's structural turning point.
Global CPI year-on-year inflation; fell from a 2022 peak of 9.5% to 4.5% in 2024
For growth investors, this poses a paradox: Japan is moving from the "lost three decades" to a "normal three decades", and normalisation precisely means that the scarcity premium of growth stocks is being systematically compressed. By choosing to remain committed to the growth style at this inflection point, the fund has in effect chosen to be counter-cyclical.
3. The Double-Edged Mirror of AI Concentration: Quantitative Thoughts on SoftBank as a Single Risk
The report lists SoftBank as the largest contributor among holdings, with the rationale highly concentrated on the AI narrative: a 90% stake in Arm, and a significant holding in OpenAI. The fund manager's September meeting with the CFO reinforced belief in the company's strategic positioning.
But viewed differently, SoftBank's share-price behaviour has evolved from a "quality name in the portfolio" into a "leveraged proxy for the AI theme". Its market-capitalisation moves are increasingly detached from its own operating fundamentals, instead tracking Arm's earnings fluctuations, changes in OpenAI's funding valuations, and swings in market sentiment toward the AI capex cycle. Baillie Gifford's holding in SoftBank is in essence equivalent to holding a portfolio of options on AI infrastructure at a discount — this is both a source of excess return and an amplifier of potential drawdowns.
The report states that the "target return" is measured over a five-year horizon, and whether AI capex can sustain five years of high growth is precisely the core of market disagreement. If the AI narrative turns cold, SoftBank's valuation could re-rate downward faster than it rose. Using a high-beta AI plenipotentiary proxy to achieve a cycle-resistant five-year target embodies an inherent contradiction at the portfolio-construction level.
4. The Unified Logic of New Positions: Counter-Cyclical + Structural Inflection
Global debt-to-GDP ratio fell from a 2020 high of 256% to 238% in 2024
The three new positions added within six months look diversified across industries (software, chemical materials, defence), but are essentially variations of the same stock-selection template:
| New position | Industry | Common characteristics | Implied cyclical judgement |
|---|---|---|---|
| Money Forward | Accounting software SaaS | Sticky barriers through the accountant channel; low digital penetration among SMEs | Long up-cycle in Japanese IT investment |
| Shin-Etsu Chemical | Semiconductor wafers + vinyl chloride | Solid global oligopoly position in wafers; PVC business provides a cyclical hedge | Semiconductor cycle bottoming; AI wafer demand expanding |
| Kawasaki Heavy Industries | General machinery + defence | Structural beneficiary of sustained expansion in Japan's defence budget | New normal of perpetual growth in defence spending |
The signal these three purchases collectively convey is this: the fund does not believe the market will continue to be unilaterally dominated by value; rather, it is positioning ahead of the next phase in which earnings broaden from cyclicals toward structural growth names. Kawasaki Heavy Industries is particularly noteworthy — it is neither a pure growth stock nor a typical value stock; Japan's defence industry logic is one of "policy-driven multi-year expansion", complementing the consumer and technology growth stocks the fund holds. This shows the investment manager strategically broadening the boundaries of the definition of "growth" beyond style discipline.
5. A Philosophical Audit of Exit Behaviour: From "Loss of Conviction" to "Loss of Opportunity Cost"
Global central bank gold reserves increasing year by year; 1,000 tonnes added in 2024
The full set of five exits — Technopro, Treasury Wine Estates, LY Corp, James Hardie, Kobe Bussan — can be decomposed into two exit logics:
- Event-driven exit: Technopro was exited because of a privatisation offer — a passive exit that was not an autonomous decision.
- Conviction exit: the other four are all summarised as "loss of conviction", but the triggers differ. Treasury Wine Estates' logic was damaged under the twin shocks of Chinese tariffs and weak consumption; LY Corp suffered moat erosion in Japan's internet advertising landscape under the impact of AI search; James Hardie faces uncertainty in the US housing cycle; and Kobe Bussan formed a "survival of the fittest" dynamic within the same sector versus Cosmos Pharmaceutical.
Two Japanese discount retailers — Cosmos and Kobe Bussan — were both held, yet with completely different outcomes: Cosmos was firmly retained after weak short-term results, on the grounds that the "rollout story is intact"; Kobe Bussan was exited for loss of conviction. This comparison reveals the fund's fine-grained differentiation at the individual-stock level: for the same growth slowdown, if the long-term store-opening runway and competitive landscape remain clear, short-term data fluctuations over three to six months can be tolerated; if the store-expansion story itself has lost its imaginative scope, decisive stop-loss follows. These are not two contradictory standards, but judgements of different positions on the growth curve within the same long-term capital-cycle framework.
6. IDP Education: A Contrarian Bet at the Bottom of the Policy Cycle
IDP Education is the most meticulously handled holding case in this report. Its share-price collapse was not an operational failure, but a collective tightening of immigration policy across core markets — Australia, Canada and the UK simultaneously restricted international student visas, dealing a compounded blow to IDP's twin businesses of "student placement plus English-language testing".
The report lists three bullish arguments: market-share gains, a cost-reduction programme, and the option value of re-entering the China IELTS testing market. But more intriguing is management's statement that it "will take necessary actions to reduce its cost base" — implying the company is responding to the cyclical trough through cost cuts rather than merely passively waiting for a policy reversal. This combination of "proactive slimming plus waiting for the cycle" is precisely the most attractive form of contrarian-turnaround investing. Of course, the competitive landscape of China's English-testing market is no longer what it was when IDP exited years ago, and the deliverability of this "substantial opportunity" must be questioned.
The US household debt service ratio rose from 9.8% in 2022 to 10.4% in 2024
7. Beyond Custody Risk: A Sincere Disclosure of "Zero Hedging"
The risk warnings section candidly identifies tail risks such as custodian insolvency, global catastrophe, military conflict and policy change, and acknowledges in the Risk and Reward Profile that "a fund in any rank can lose you your investment". This blunt disclosure is mutually corroborated by the fund's structure as a long-only portfolio with a 90% equity position and no derivatives hedging.
What truly needs attention is not these macro risks themselves, but the correlation within the portfolio. The fund's frontier holdings are concentrated in Japan (SoftBank, SBI Holdings, Cosmos, Money Forward, Kawasaki), with a highly consistent growth style. In a state where "Japan's rate normalisation" and "value persistently suppressing growth" prevail, the internal diversification of the portfolio may be far lower than the surface geographic diversity suggests. The five-year annualised return of 0.2% is not merely a performance problem; it is a warning about the portfolio's resilience.
Summary: While acknowledging short-term setbacks, the report text this period releases a signal that deserves even greater scrutiny — the fund has not shifted to a defensive stance or cut positions because of five years of relative underperformance; instead, it is intensifying its counter-cyclical positioning. The new positions all point toward Japan's domestic structural expansion themes (software penetration, defense spending, AI silicon wafers), implying that the investment manager remains optimistic about the long-term outlook for the Japanese market. However, the concentration risk of the single SoftBank position, the unpredictability of value/growth style rotation, and the technical penalty of the daily compounding target together pose an unavoidable question: even if the five-year call ultimately proves correct, do investors have enough patience and capital to wait until that moment? This may be the deepest question this text leaves for its readers.
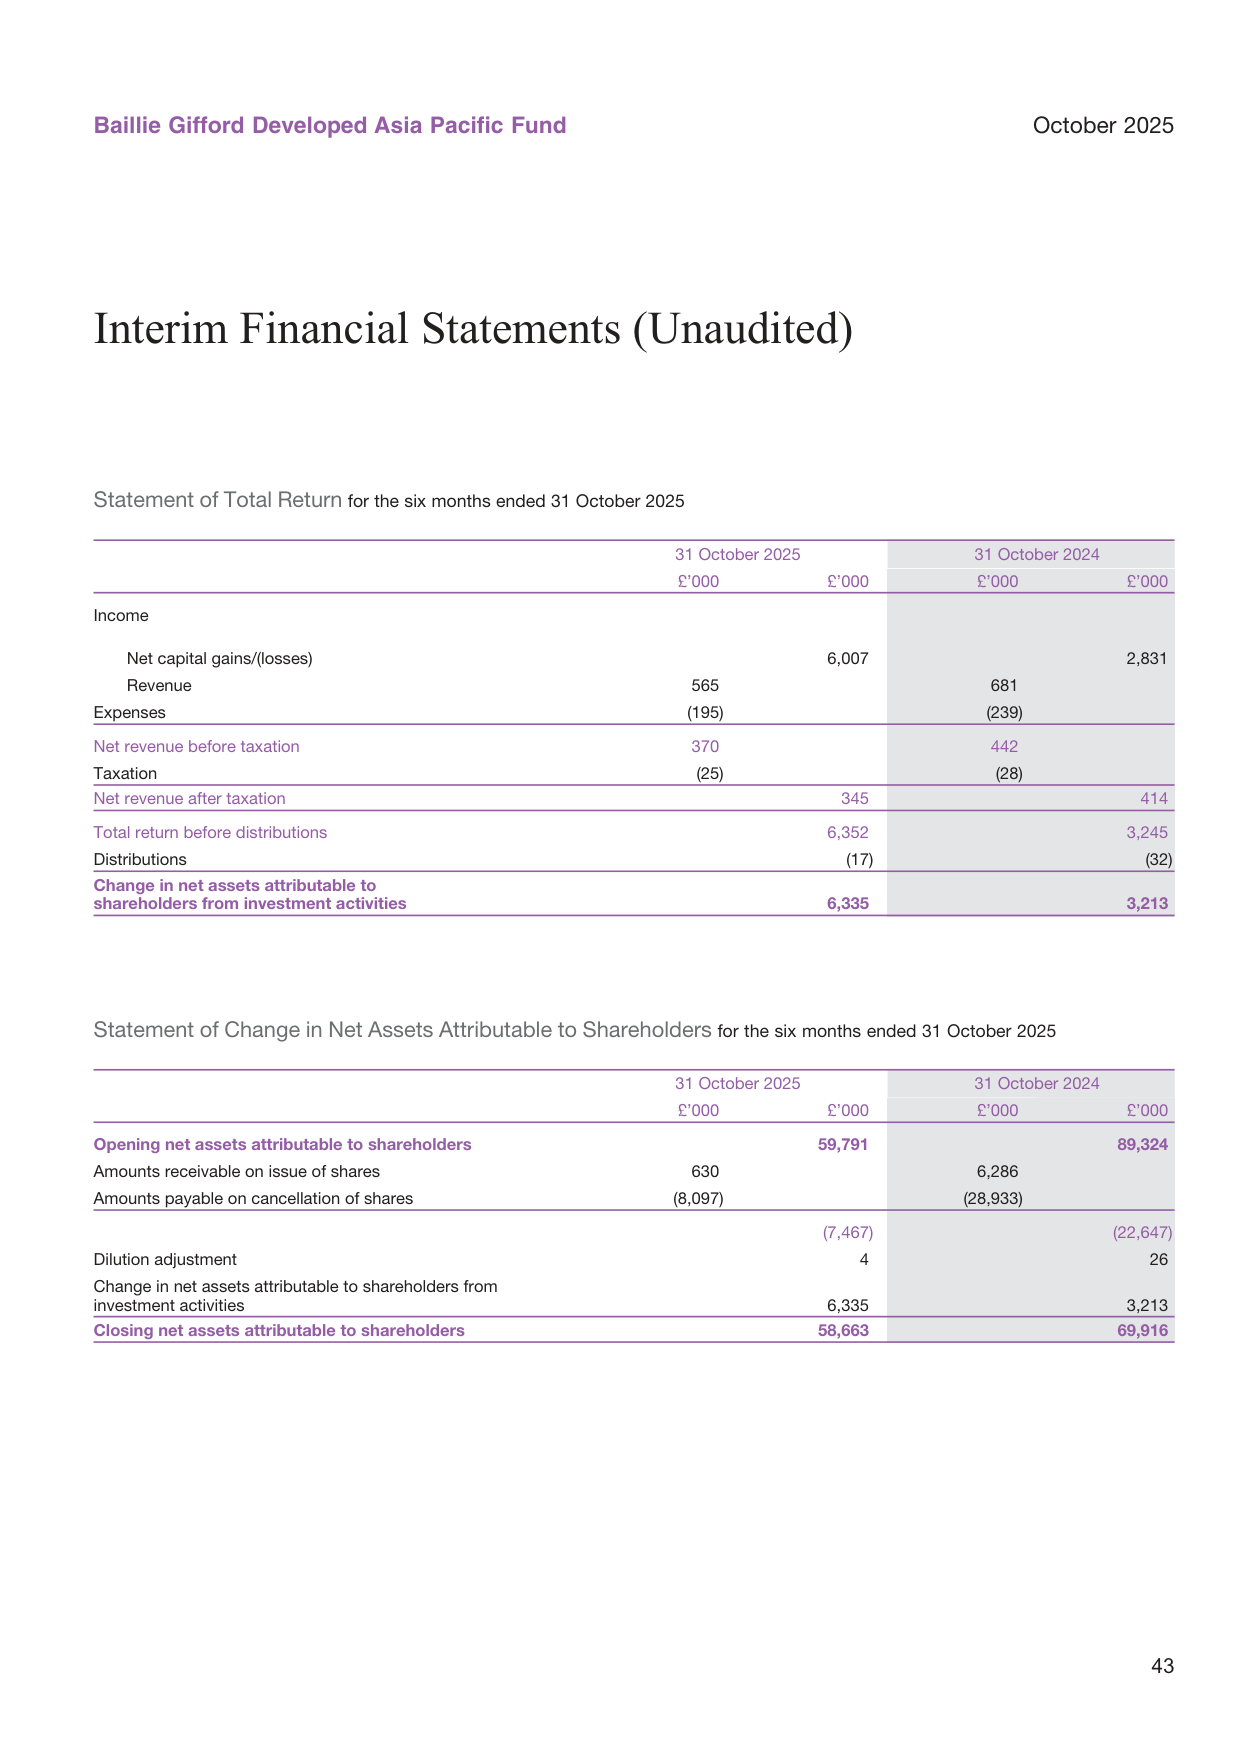
New Analysis This Issue: Deep Signals from Position Structure, Fund Flows, and Cost Efficiency
1. The "Double Divergence" of the Top Ten Holdings
US corporate profits as a share of GDP fell from 12.0% in 2022 to 11.5% in 2024
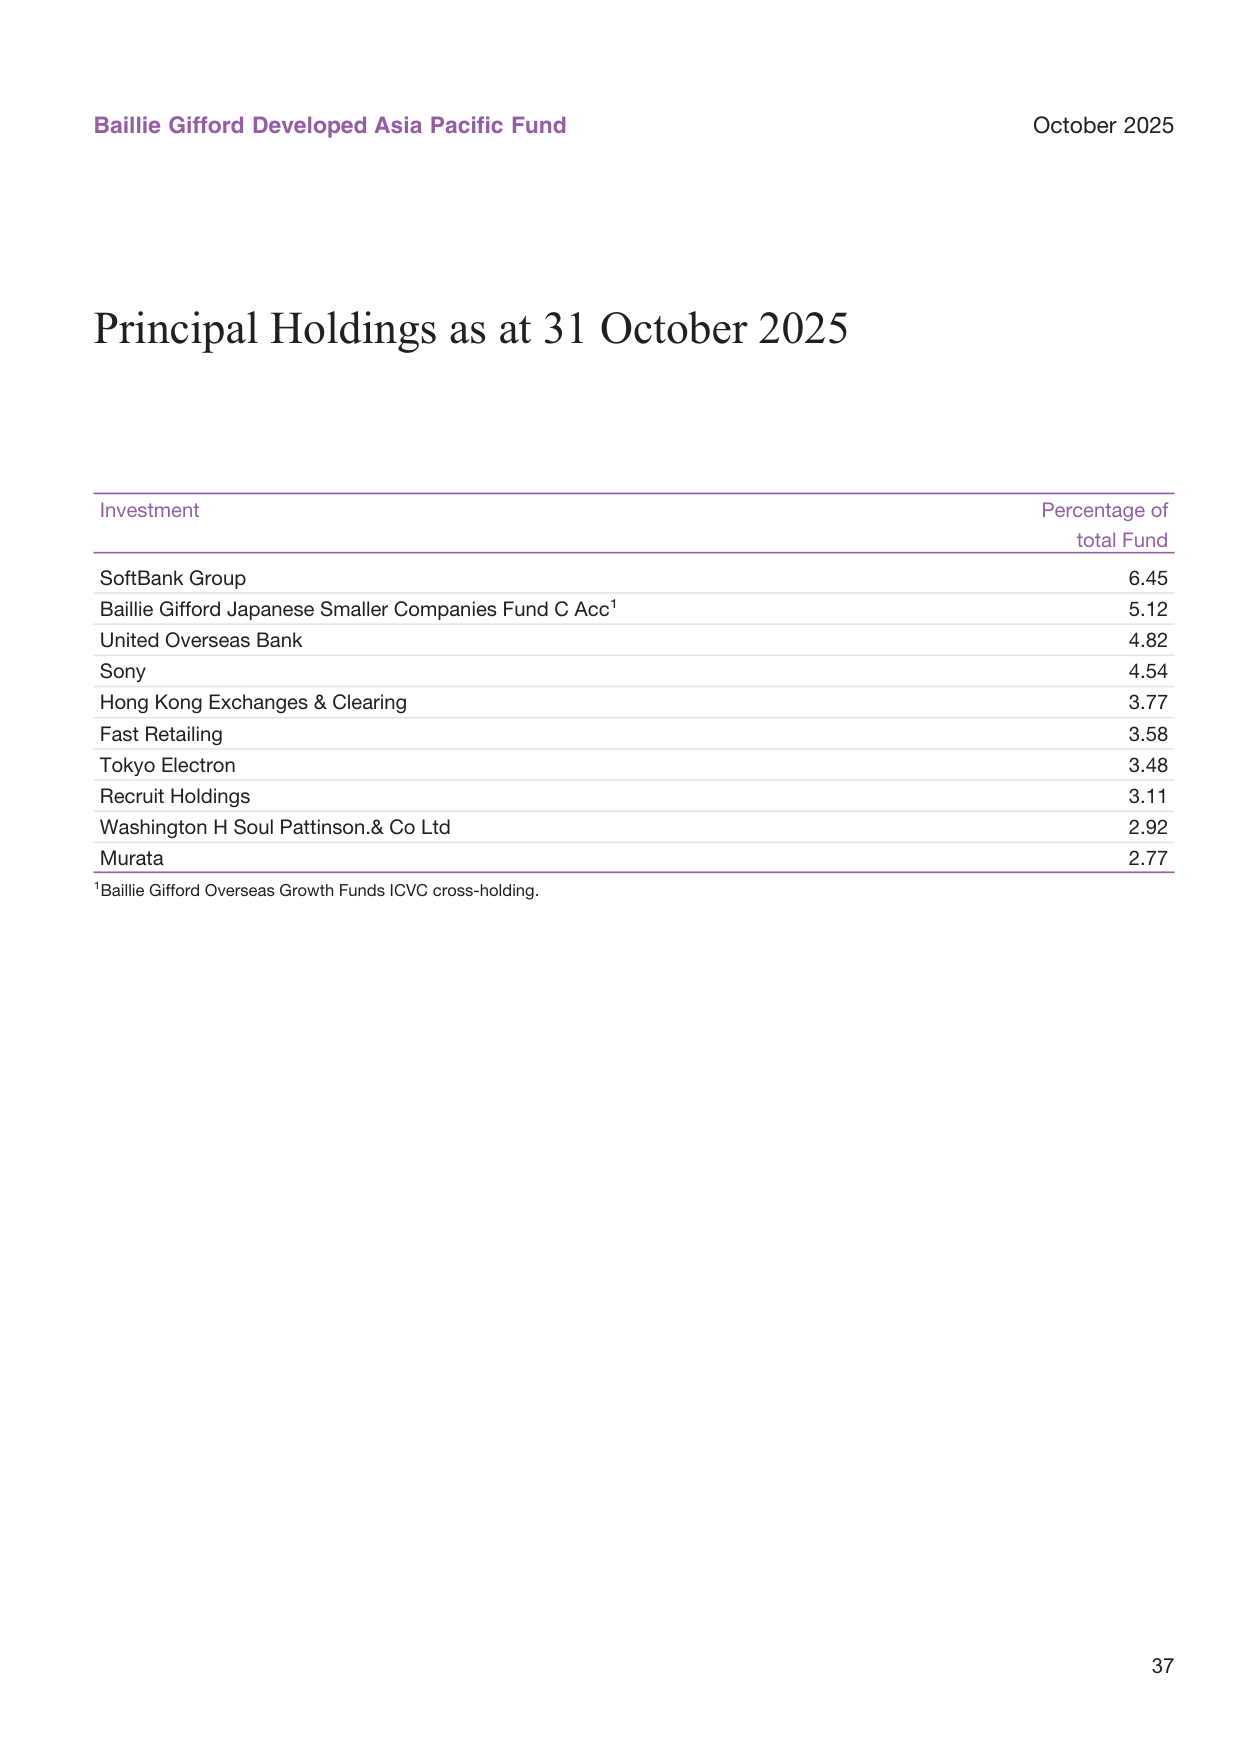
As of 31 October 2025, the top ten holdings account for approximately 40.6% of net assets — a moderate level of concentration. But the deeper signal lies in the "double divergence" of the holdings: they deviate both from the country weights of the Asia-Pacific index benchmark (Japan accounts for nearly 70%) and from the balanced meaning of "Developed Asia Pacific" implied by the fund's name:
| Rank | Holding | Weight (%) | Country | Sector |
|---|---|---|---|---|
| 1 | SoftBank Group | 6.45 | Japan | Investment holding/Technology |
| 2 | Baillie Gifford Japanese Smaller Cos Fund | 5.12 | Japan | Cross-holding/Small-cap fund |
| 3 | United Overseas Bank | 4.82 | Singapore | Banking |
| 4 | Sony | 4.54 | Japan | Consumer electronics/Entertainment |
| 5 | Hong Kong Exchanges & Clearing | 3.77 | Hong Kong | Exchange |
| 6 | Fast Retailing | 3.58 | Japan | Retail |
| 7 | Tokyo Electron | 3.48 | Japan | Semiconductor equipment |
| 8 | Recruit Holdings | 3.11 | Japan | HR platform |
| 9 | Washington H Soul Pattinson | 2.92 | Australia | Diversified holding |
| 10 | Murata | 2.77 | Japan | Electronic components |
Comparison of policy rates across major economies: Fed 5.5%, ECB 4.5%, Bank of Japan 0.5%
Key Signals:
- Japan occupies 8 of the top ten positions (including the cross-held fund), totaling approximately 35.2%, confirming that this fund is in practice a "Japan market-enhanced" product rather than a regionally balanced allocation fund in the traditional sense.
- SoftBank Group accounts for 6.45% yet was the largest sell target (£2.804 million sold), indicating that the position was trimmed from a higher level during the reporting period while still remaining the largest holding — reflecting the manager's contradictory approach of "long-term conviction but short-term risk reduction" toward SoftBank.
- Two "holding-type" companies (SoftBank and Washington H Soul Pattinson) appear simultaneously in the Top 10, together accounting for 9.37%, showing the manager's preference for discounted assets with cross-industry investment portfolios.
2. Active Deviation in Country Allocation and the Direction of Change
Allocation ratio of risky assets (e.g., equities) versus risk-free assets (e.g., bonds), with equities currently at 55%
| Country | 31.10.25 (%) | 30.04.25 (%) | Change (p.p.) |
|---|---|---|---|
| Japan | 69.29 | 67.68 | +1.61 |
| Australia | 11.15 | 13.31 | -2.16 |
| Hong Kong | 9.73 | 8.55 | +1.18 |
| Singapore | 8.21 | 7.95 | +0.26 |
| New Zealand | 0.99 | 1.61 | -0.62 |
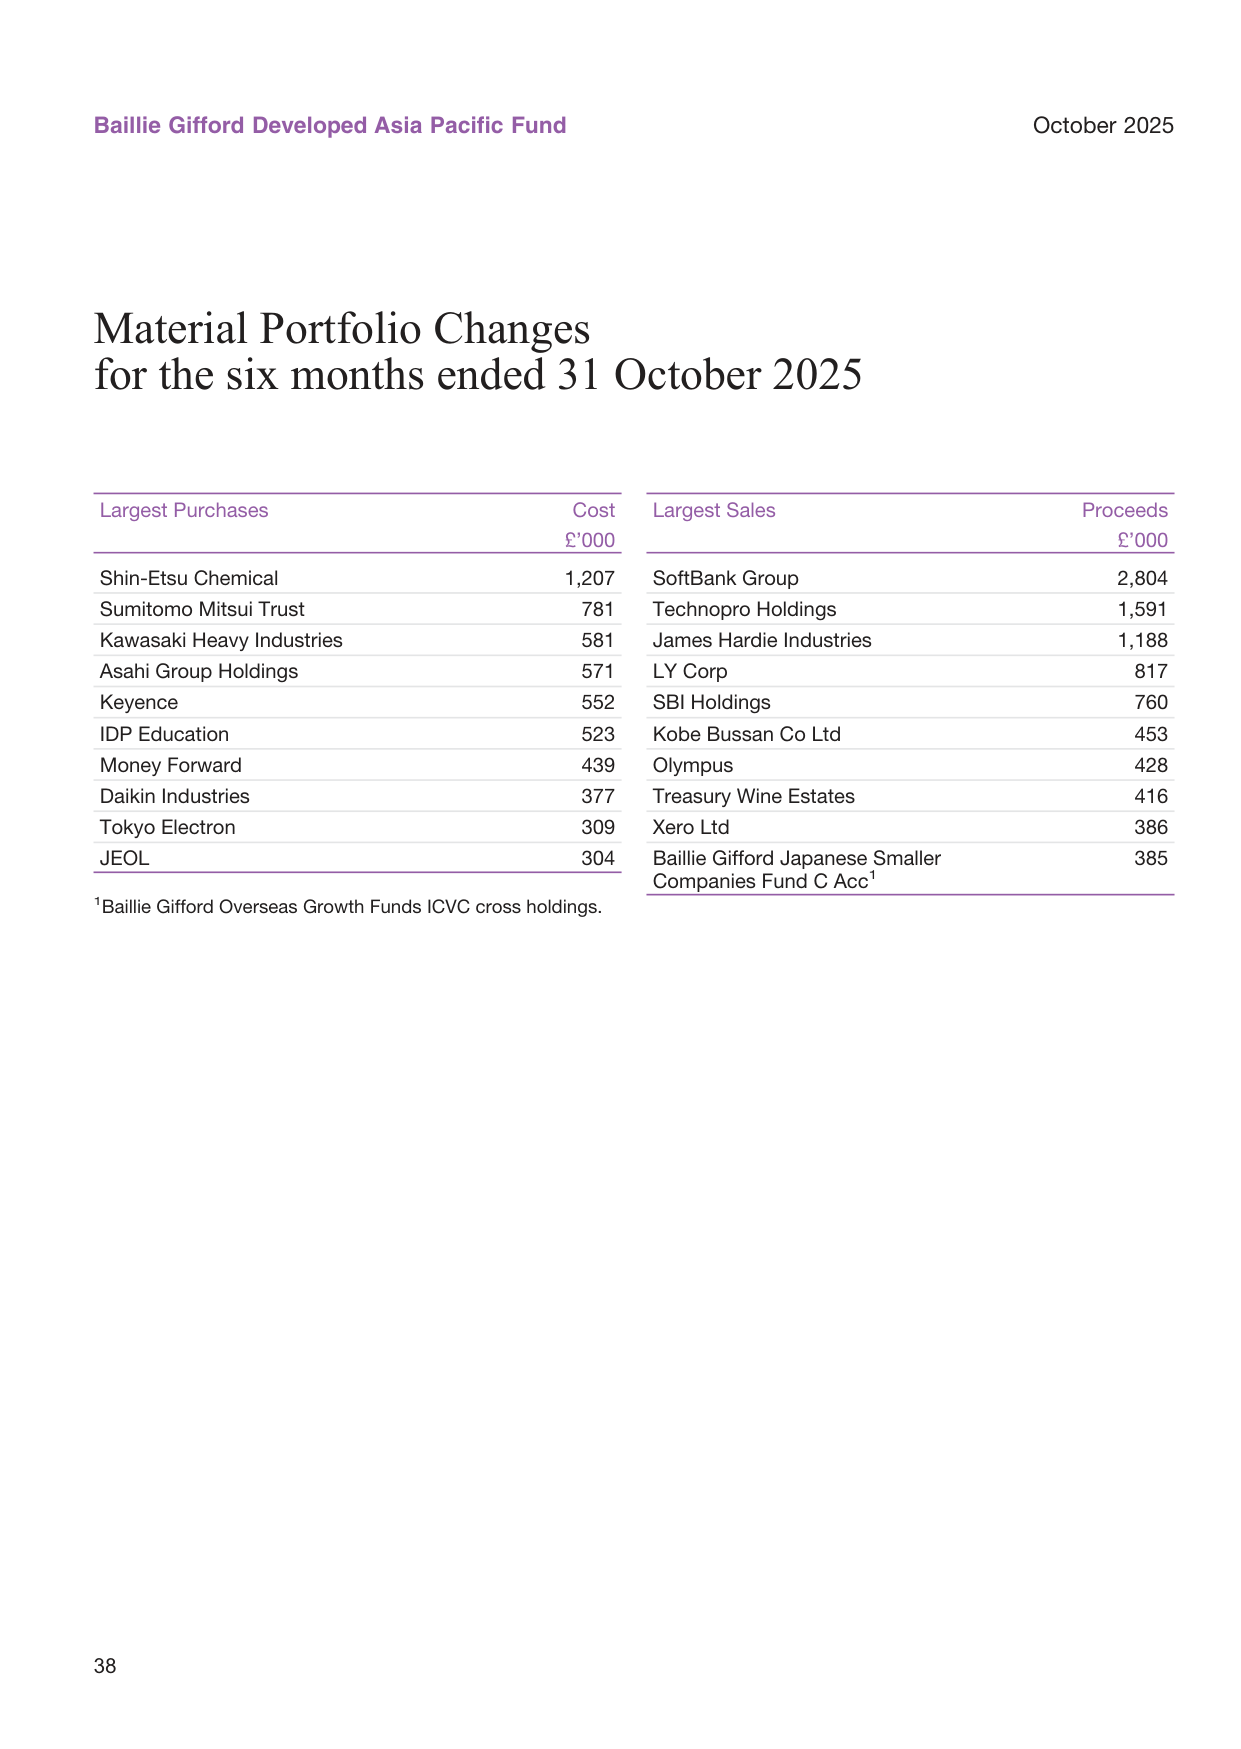
Increasing Japan while reducing Australia — this is the clearest regional rebalancing action in the reporting period. According to the buy/sell list, the Australian reduction was achieved mainly through the sale of James Hardie Industries (£1.188 million) and Treasury Wine Estates (£0.416 million), while the Japanese purchases were more diversified, covering Shin-Etsu Chemical (£1.207 million), Sumitomo Mitsui Trust (£0.781 million), Kawasaki Heavy Industries (£0.581 million), and Asahi Group (£0.571 million), among others. This move shows that the manager considers Japan's industrial upgrade beneficiaries (semiconductor equipment, precision manufacturing) and domestic demand recovery (consumer, insurance) to be more certain than Australia's property chain and discretionary consumption.
3. The Fund's "Bleeding" in Size and the Easing of Redemptions

Pairwise correlation matrix of various asset classes (equities, bonds, commodities, etc.); the equity-bond correlation is approximately 0.3
Fund assets have shown a continuous contraction over the past two and a half years:
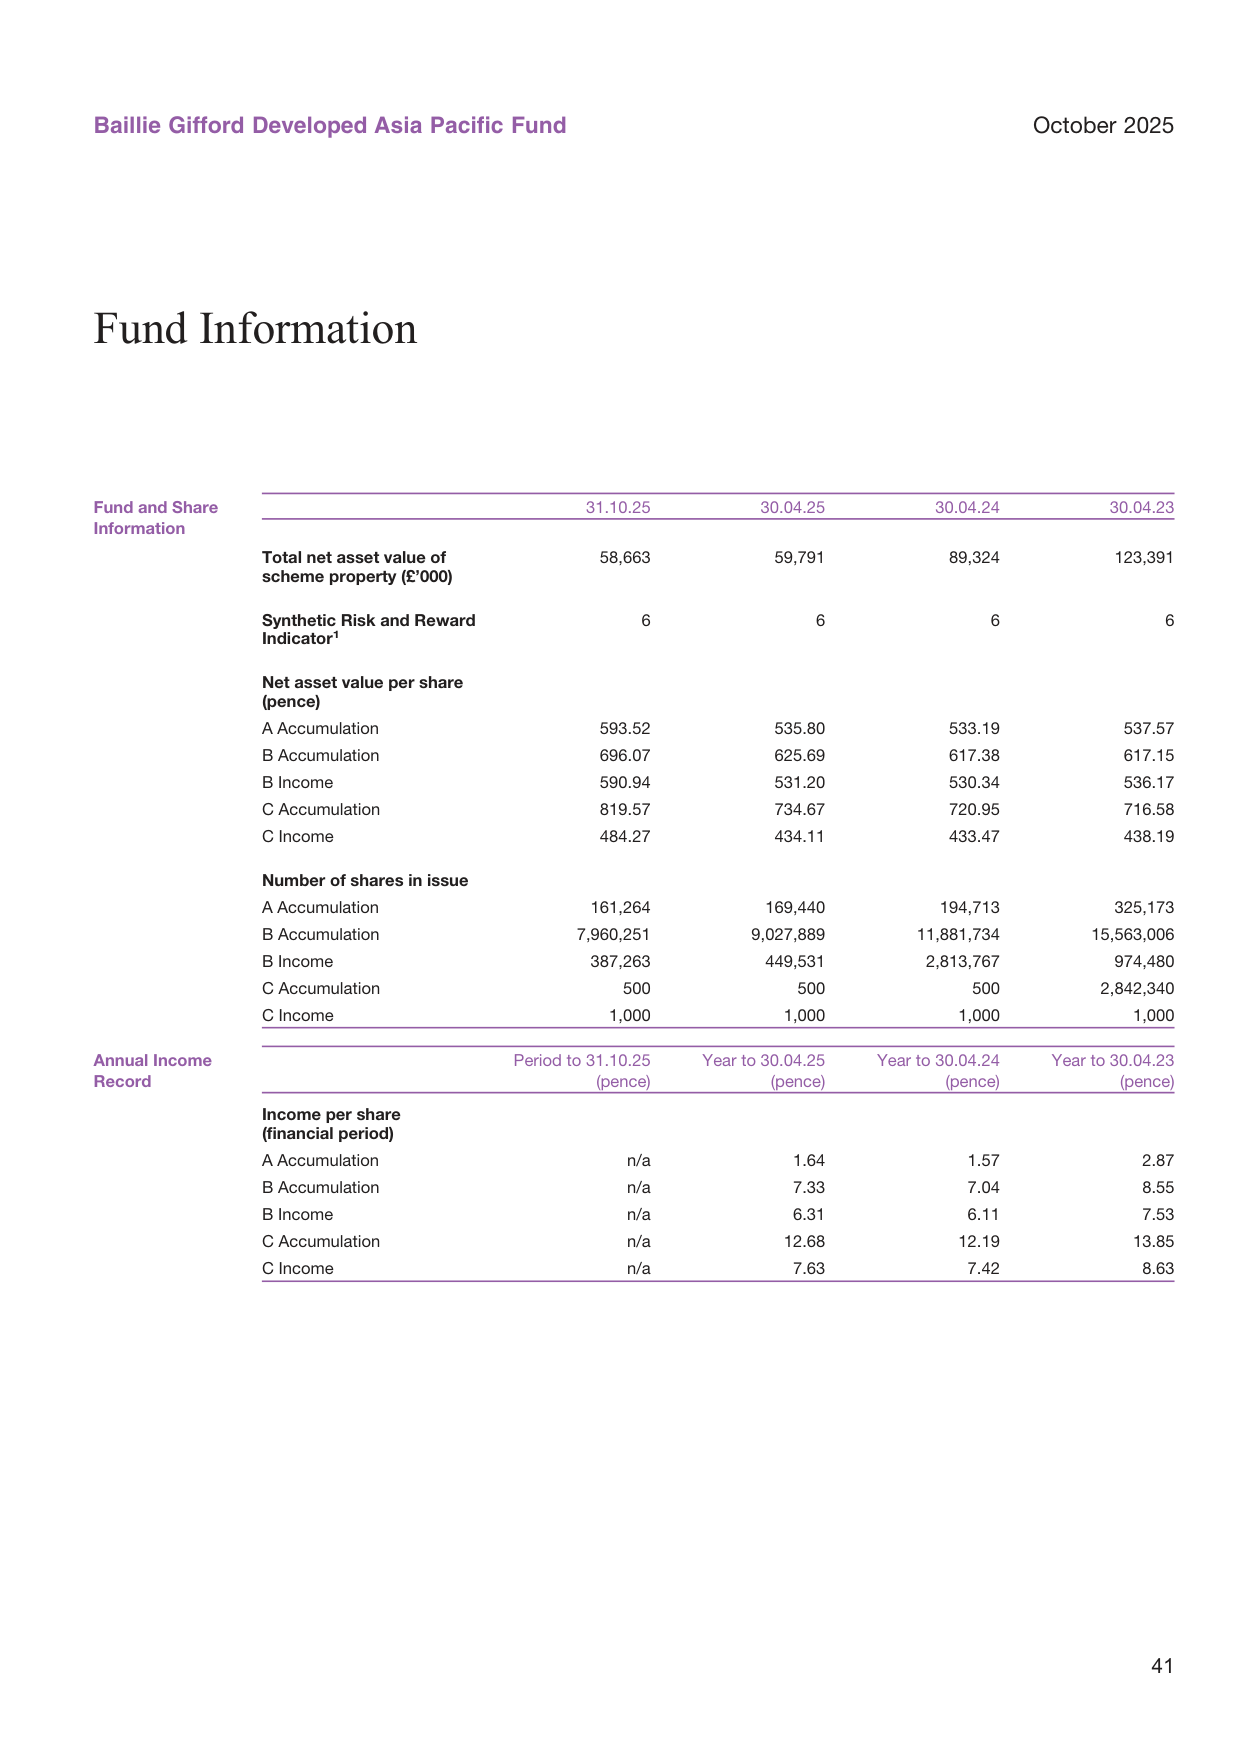
| Date | Total net assets (£'000) | YoY change |
|---|---|---|
| 30.04.2023 | 123,391 | — |
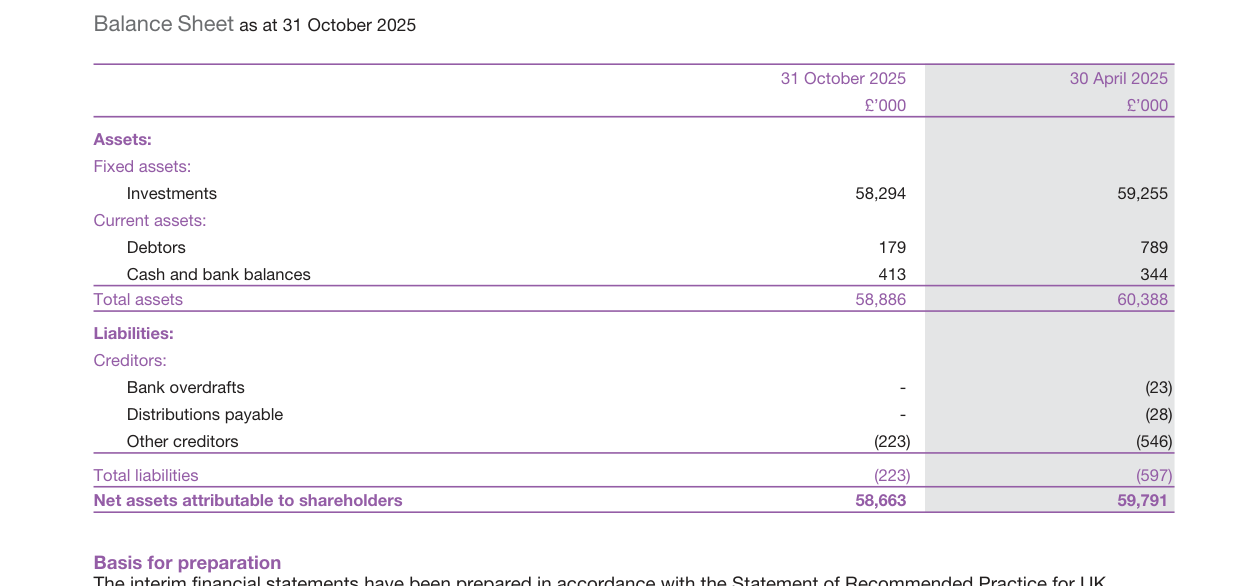
| 30.04.2024 | 89,324 | -27.6% |
| 30.04.2025 | 59,791 | -33.1% |
| 31.10.2025 | 58,663 | -1.9% (half-year) |
Although net assets fell only slightly by 1.9% during the reporting period, a closer breakdown shows:
- Investment activities generated a positive return of £6.352 million
- Net redemptions reached £7.467 million, entirely eroding investment gains
Annualized volatility of global equity markets across different time windows; the current 12-month volatility is approximately 15%
However, compared with the same period last year, redemption pressure has weakened considerably: net redemptions in the same period of 2024 were as high as £22.647 million, while this period they fell to £7.467 million, a decline of roughly 67%. Subscriptions also shrank sharply (£0.63 million this period vs. £6.286 million in the previous period), indicating that the fund is still losing assets, but the "bleeding point" is shrinking.
4. NAV Performance Confirms "Returns Relied Entirely on Capital Appreciation"
| Indicator | Value |
|---|---|
| Net capital gains for the period | £6,007,000 |
| Net income after tax for the period | £345,000 |
| Capital gains as share of total return | 94.6% |
| Income yield (after-tax income / net assets) | ~0.59% |
Valuation gap between US small-cap and large-cap stocks; small caps trade at approximately 70% of large caps' valuation
The A-class NAV rose from 535.80p at the start of the reporting period to 593.52p, a half-year gain of approximately 10.8%. Over the two-and-a-half-year horizon, the A-class NAV moved from 537.57p in April 2023 to 593.52p, a cumulative increase of only 10.4% (approximately 4.0% annualized). For an active fund whose core strategy is long-term growth equities, such a return is unremarkable in absolute terms — a reasonable inference is that the valuation expansion of global technology stocks and Japan's corporate governance reforms (the PBR improvement promoted by the Tokyo Stock Exchange) in the first half of 2025 were the primary drivers, rather than the manager's stock-specific alpha.
5. Fee Structure: The "Low-Cost Siphoning" of the C-Class Channel
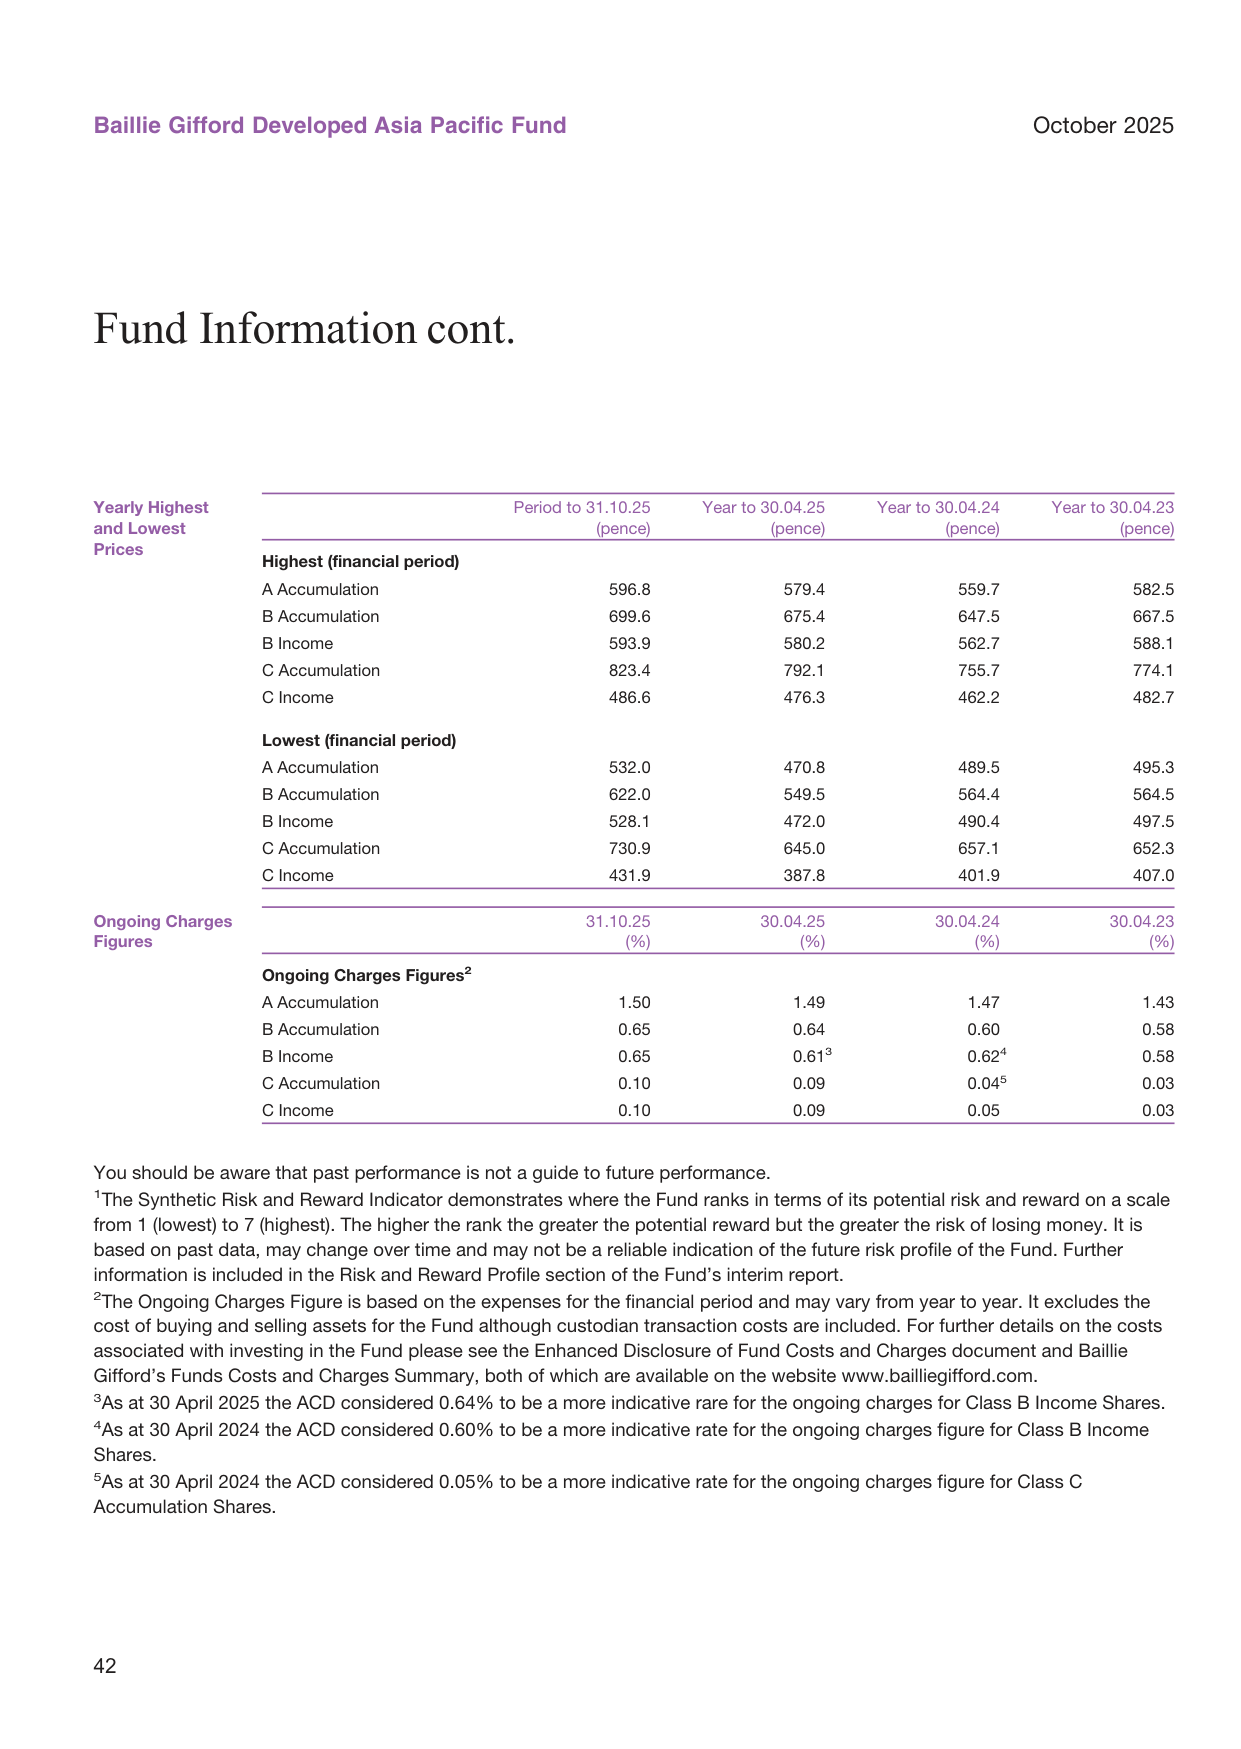
Ongoing Charges across all share classes have continued to rise from April 2023 to October 2025:
| Share class | 31.10.25 (%) | 30.04.25 (%) | 30.04.24 (%) | 30.04.23 (%) |
|---|---|---|---|---|
| A Accumulation | 1.50 | 1.49 | 1.47 | 1.43 |
| B Accumulation | 0.65 | 0.64 | 0.60 | 0.58 |
| B Income | 0.65 | 0.64 | 0.62 | 0.58 |
| C Accumulation | 0.10 | 0.09 | 0.05 | 0.03 |
| C Income | 0.10 | 0.09 | 0.05 | 0.03 |
European sector earnings growth forecasts, with technology sector earnings expected to grow 18%
The most critical finding is that the C-class fee rate is only about 1/15 of the A-class, yet the number of shares issued is minimal (C Accumulation: only 500 shares; C Income: only 1,000 shares). This indicates that the C class is not a retail-oriented share class but rather a vehicle reserved for institutions or specific channels. Given that the C-class NAV (819.57p) is significantly higher than the A-class (593.52p), its low-cost compounding advantage is extremely pronounced.
Meanwhile, the number of B-class/Income-class shares also saw significant reductions during the period: B Income fell from 449,531 to 387,263 shares (13.9% of holders exiting), and B Accumulation fell from 9,027,889 to 7,960,251 shares (11.8%). Redemptions were concentrated in the low-cost B/C share classes, while the A class remained relatively stable — possibly reflecting a systematic withdrawal by sophisticated institutional investors, while retail A-class holders, influenced by the "disposition effect," continue to stay put.
6. Governance Concerns of Cross-Holdings
The Baillie Gifford Japanese Smaller Companies Fund C Acc is both one of this fund's top five holdings (5.12%) and a sub-fund managed by Baillie Gifford itself. This fund-of-fund arrangement carries three hidden risks:
1. Double fees: Investors already bear one layer of Ongoing Charges within this fund, while the underlying Japanese Smaller Companies Fund also incurs fees; if not waived, these erode actual returns;
2. Style stacking risk: The underlying fund is itself a Japanese small-cap strategy, highly aligned with this fund's 69% direct Japanese exposure, amplifying concentration risk during bear phases of the Japanese market;
3. Liquidity mismatch: As an open-ended fund, this fund holds another open-ended fund at more than 5% of NAV, raising the possibility of a "redemption-sale" chain being transmitted in extreme redemption scenarios.
Net buying of Japanese equities and exchange rate trends; foreign investors made net purchases of approximately ¥5 trillion in Japanese stocks in 2024
7. Style Continuation of the Emerging Markets Fund
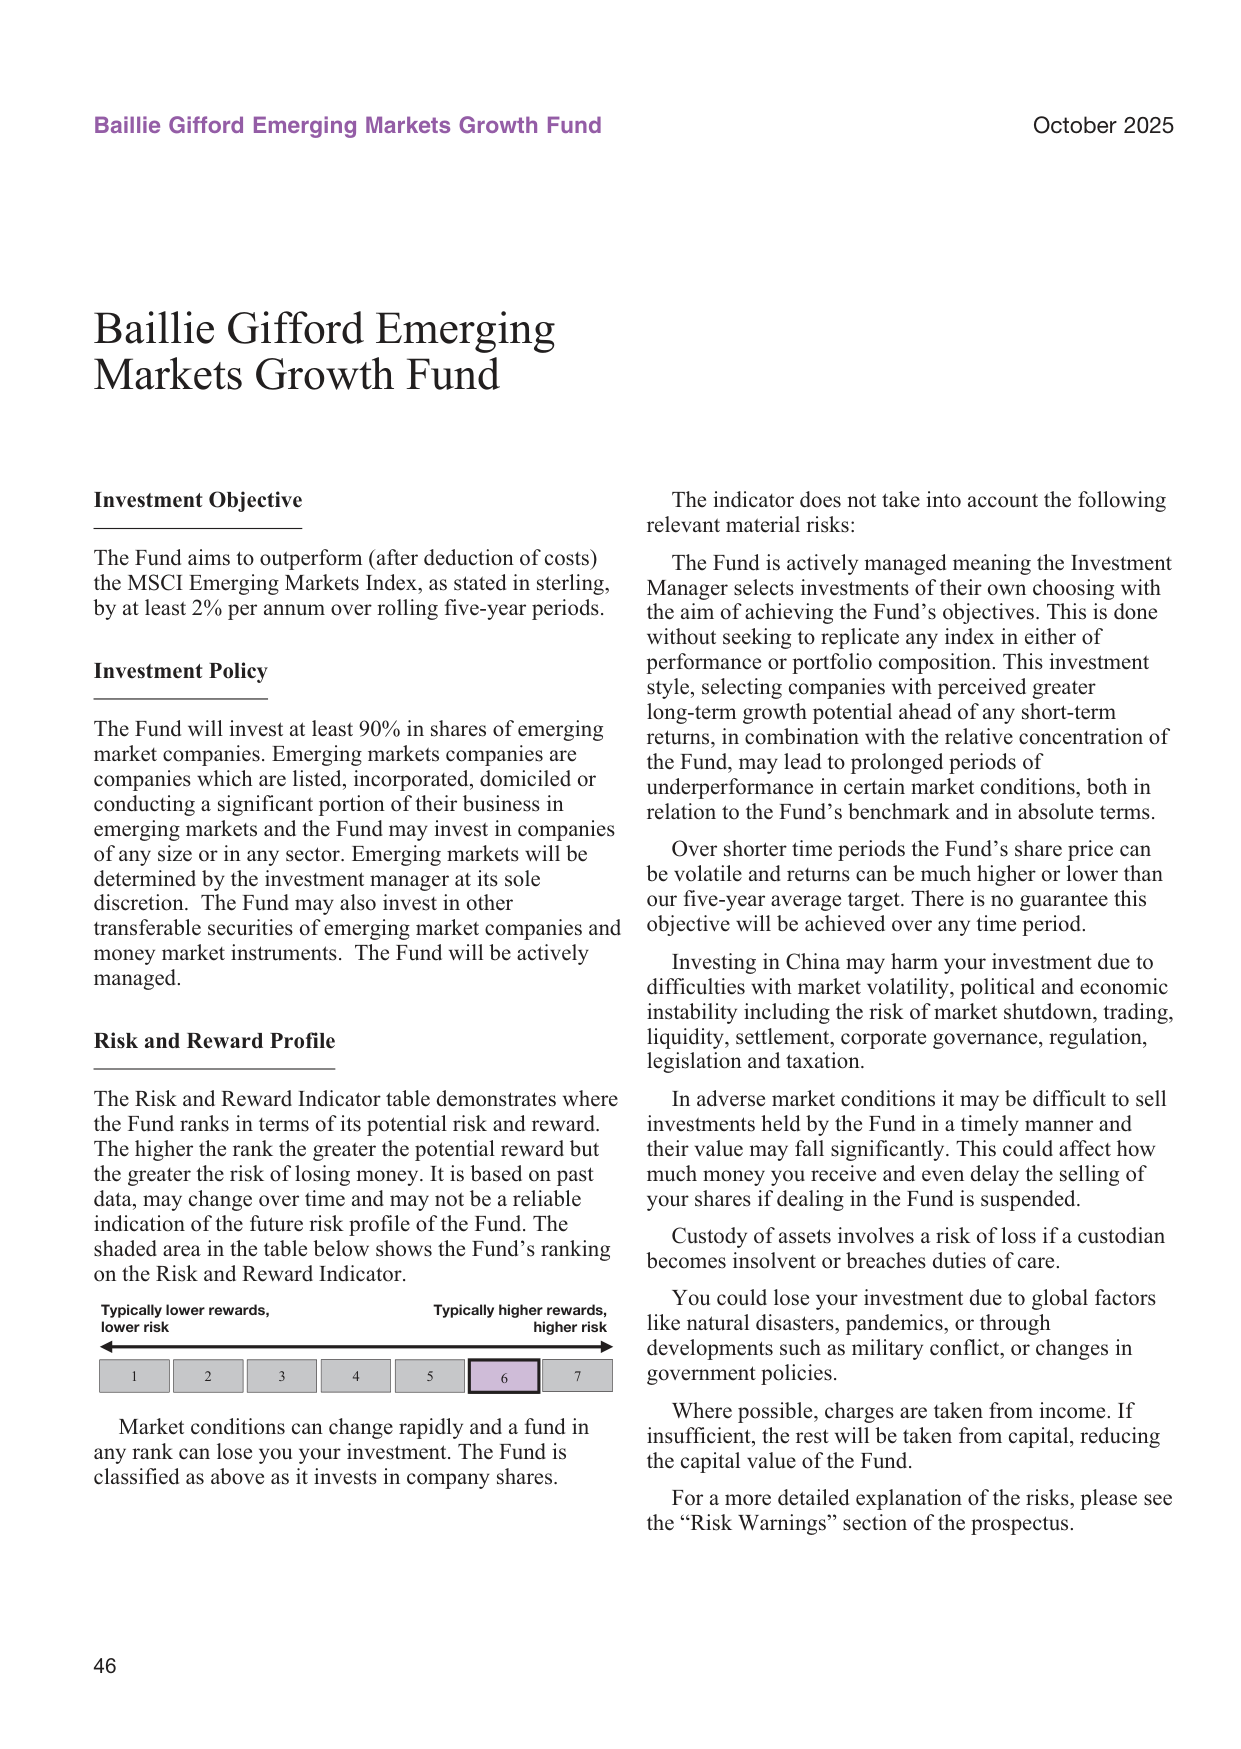
The other fund in the report, the Baillie Gifford Emerging Markets Growth Fund, has the objective of outperforming the MSCI Emerging Markets Index by at least 2 percentage points over a rolling five-year period. This is a fairly aggressive target — a long-term annualized excess return of 2% requires extremely strong stock-picking ability. In line with the Developed Asia Pacific Fund, this fund also states that it is "relatively concentrated" and "places greater emphasis on long-term growth potential than on short-term returns," showing that Baillie Gifford's unified investment philosophy is replicated across regions and products. Notably, this objective implies that its portfolio will also deviate significantly from the benchmark and may experience volatile periods of "prolonged underperformance" — which is highly consistent with the current return profile of the Developed Asia Pacific Fund.
8. Overall Assessment
This report reveals the typical active-fund predicament of "improving performance but under structural pressure": the portfolio has benefited from the rise in Japanese equities, with NAV achieving double-digit growth, yet the fund's size continues to shrink, costs are gradually rising, and cross-holdings create a governance discount. For Baillie Gifford, the core challenge of the Developed Asia Pacific Fund is not investment capability but how to convert NAV growth into fund inflows, and how to explain to investors the rationale for nearly 70% Japanese exposure in a regional Asia-Pacific fund.
The "Anchoring Bias" in Risk-Return Positioning
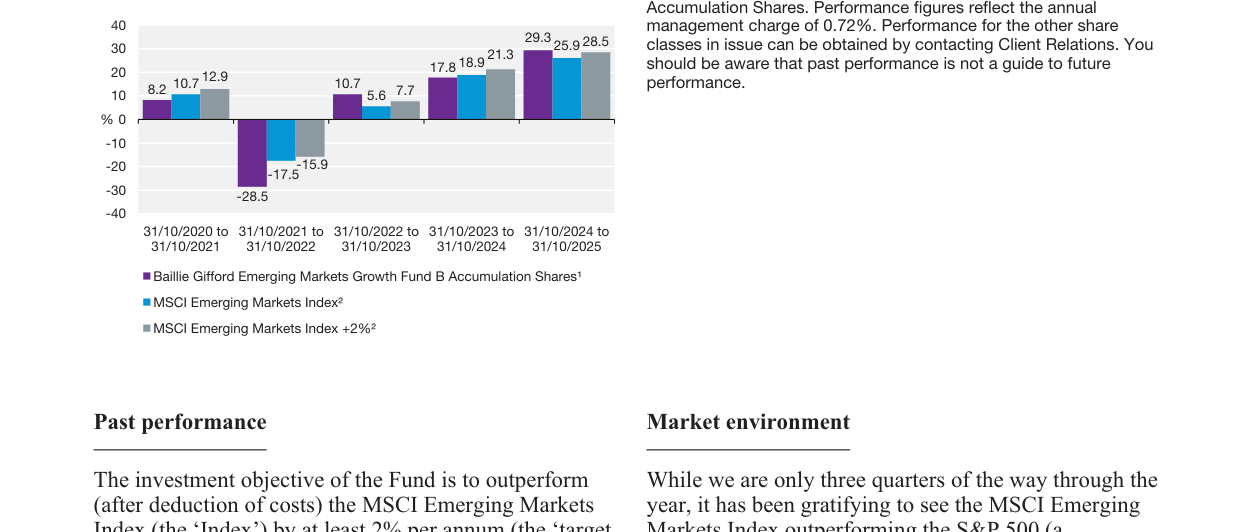
In its risk disclosure, the fund emphasizes that the "Risk and Reward Indicator is based on historical data and may change over time." This statement is not wrong in itself, but when investors face a NAV trajectory that has swung as wildly as `+29.3% / -28.5% / +10.7% / +17.8% / +25.9%` over five years, relying on a single 1–7 category label to frame risk expectations provides severely insufficient information. The fund invests in company equities and is classified in a high category (the 6 or 7 band), but the actual anchoring significance of this classification is limited — because growth stocks have one prominent volatility characteristic: drawdowns are much faster than recoveries. The -28.5% in the 2021–2022 period was not driven by a single event, but by the interplay of three factors: high inflation, rising interest rates, and geopolitical conflict. In similar environments, even if the fund's risk rating remains unchanged, actual NAV volatility will exceed historical averages. This reminds investors that a risk rating is suitable as a coarse screen at the portfolio level, not as the basis for a hold/sell decision on an individual fund.
Short-Term Strength, Long-Term Underperformance: The True Five-Year Gap
Emerging market major currencies vs. the US dollar; the renminbi is fluctuating around 7.2
The fund report explicitly states that "five years is a more reasonable assessment period," but the current five-year figures are precisely the most awkward:
| Period | Fund return (B class) | Index return (MSCI EM) | Target return (index + 2%) | Relative result |
|---|---|---|---|---|
| 2020/10–2021/10 | +29.3% | +21.3% | +23.5% (approx.) | Significantly outperformed |
| 2021/10–2022/10 | -28.5% | -17.5% | -15.7% (approx.) | Significantly underperformed |
| 2022/10–2023/10 | +10.7% | +8.2% | +10.4% (approx.) | Close to target |
| 2023/10–2024/10 | +17.8% | +12.9% | +15.1% (approx.) | Outperformed |
| 2024/10–2025/10 | +25.9% | +28.5% | +31.1% (approx.) | Underperformed |
| Five-year annualized | +5.5% | +7.6% | +9.8% | Annualized underperformance of approximately 2.1 percentage points |
| Latest six months (through 2025/10) | +36.2% | +30.1% | +31.4% | Significantly outperformed |
China's monthly economic activity indicators (industrial value added, retail sales, investment); industrial growth at 5.0%
One noteworthy phenomenon: in the most recent full year (2024/10–2025/10), the fund's full-year return of 25.9% trailed the index by 2.6 percentage points, yet it achieved a 36.2% return in just six months. This means the fund's excess returns are highly concentrated — most likely in the second and third quarters of 2025, driven by the AI supply chain and selected emerging market heavyweight stocks. This "pulsed" pattern of excess returns determines that the fund's biggest risk is not missing a rally, but persistently lagging during phases without catalysts. The gap between the five-year annualized figures of 5.5% and 7.6% amounts to nearly 10 percentage points cumulatively — this cannot be explained away as "short-term noise"; it is a mathematical result jointly determined by the depth of the 2021–2022 drawdown and the slope of the subsequent rebound.
Position Concentration: Structural Ties to AI Capital Expenditure
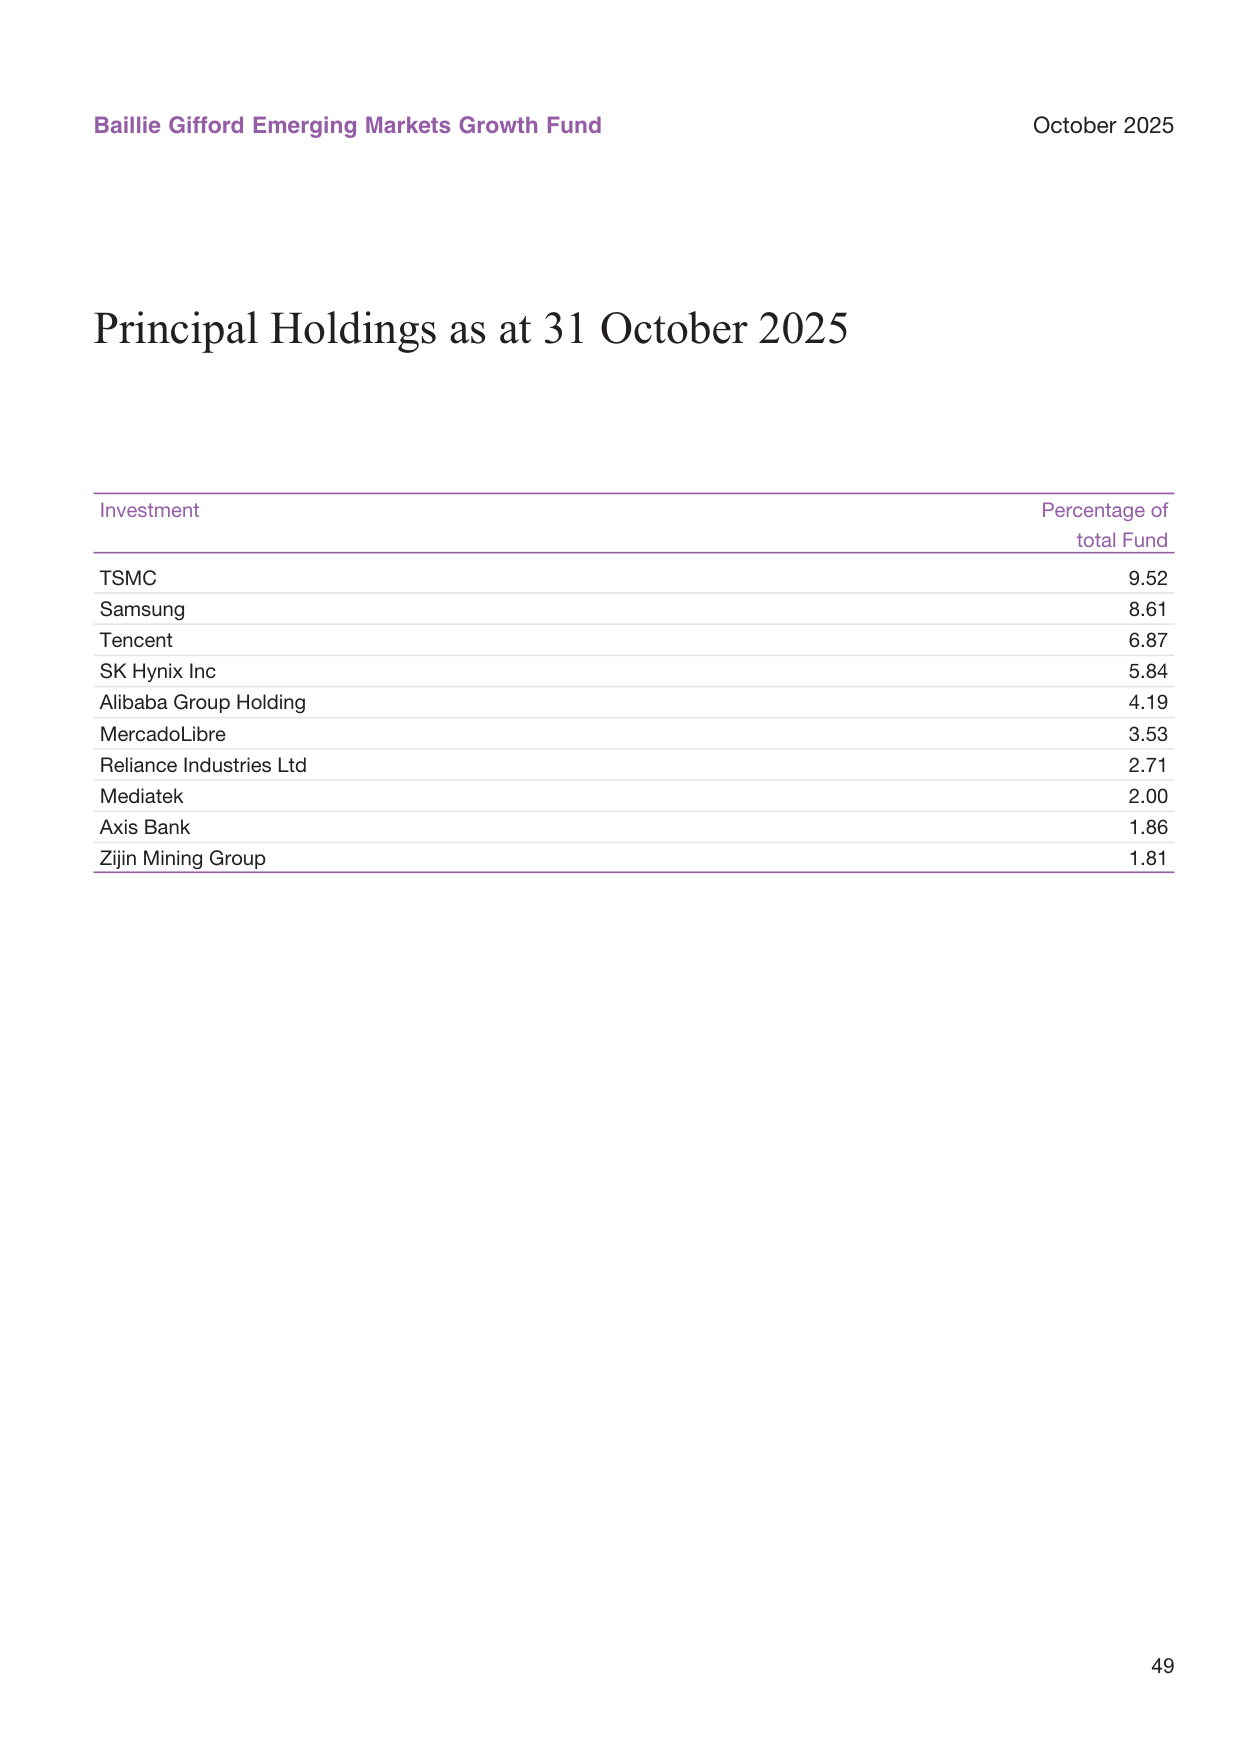
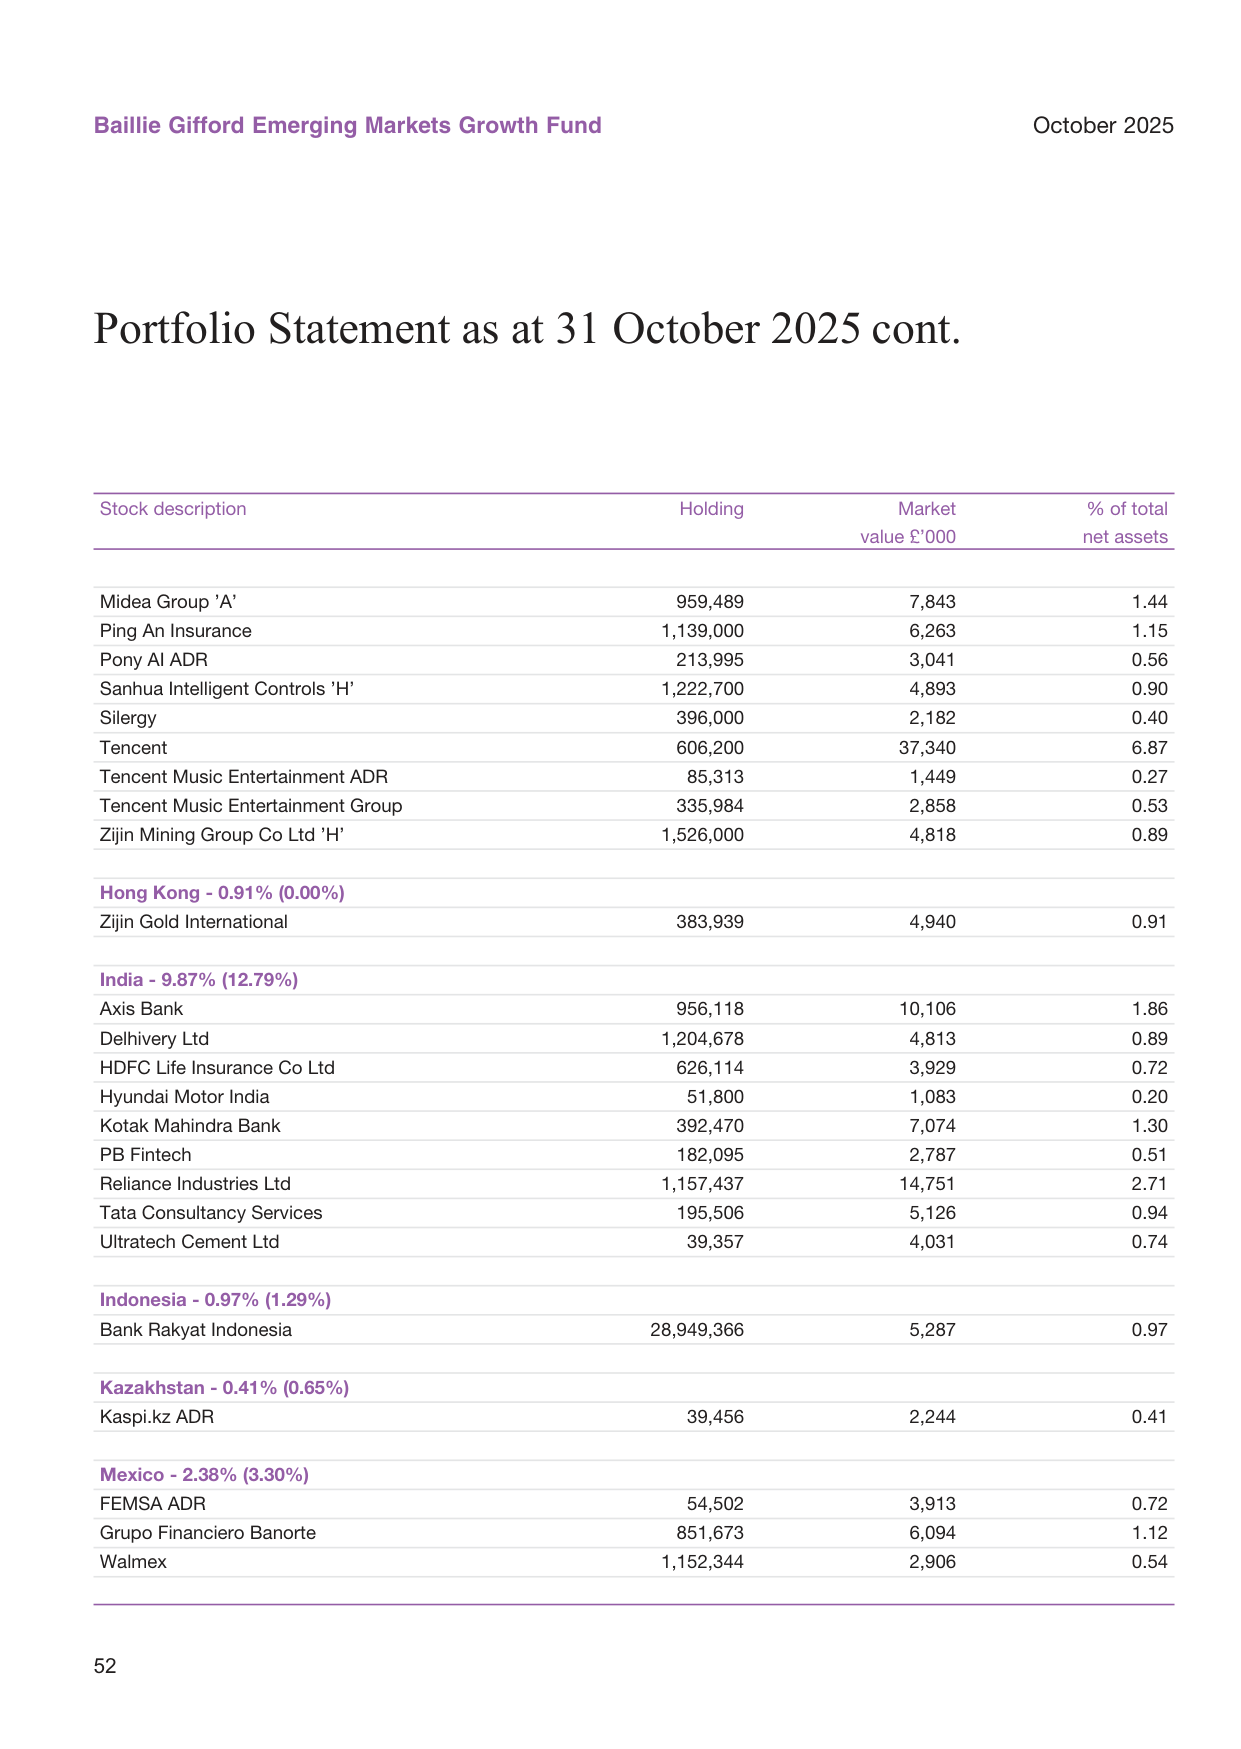
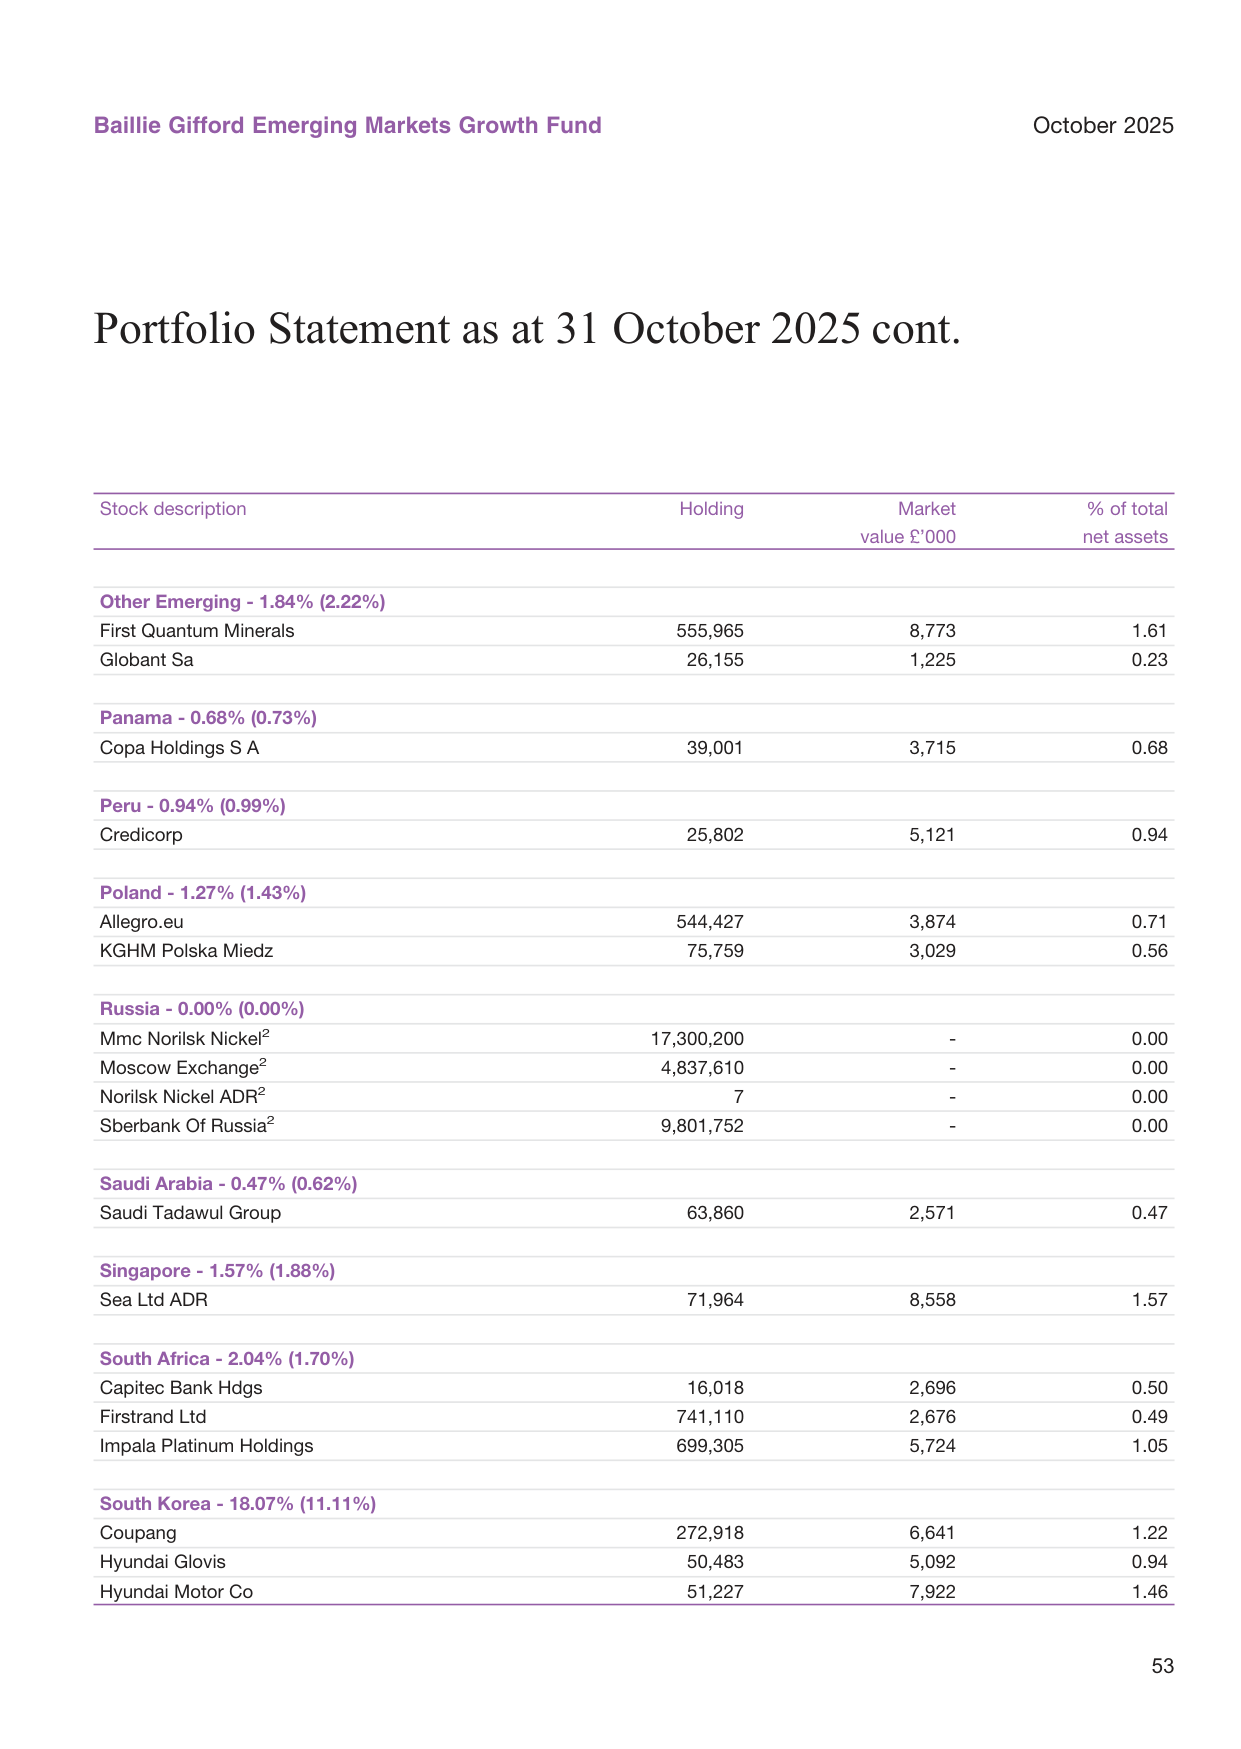
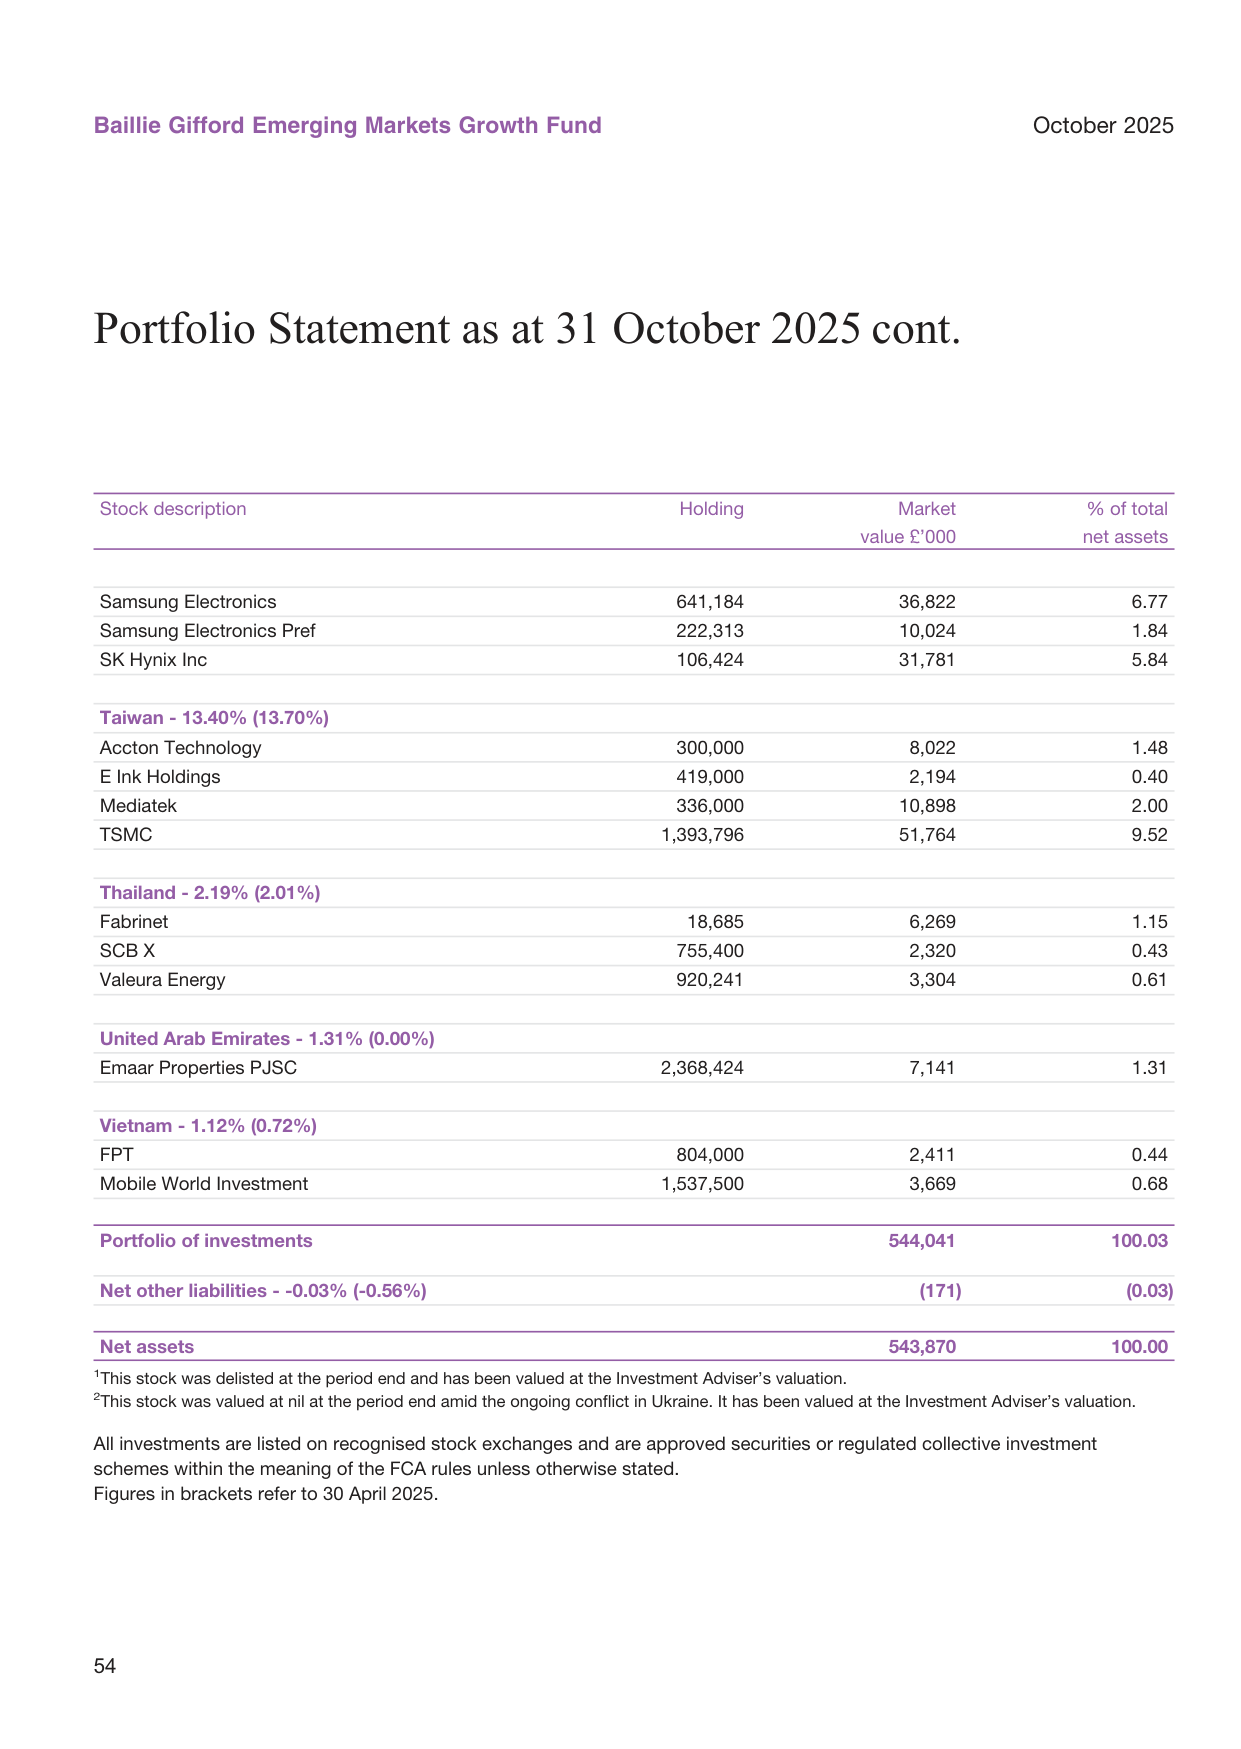
Looking at the latest top ten holdings, the top ten together account for approximately 46.9%. Of this, `TSMC` (9.52%) and `Samsung` (8.61%) together account for 18.13%, and adding `SK Hynix` (5.84%), pure semiconductor exposure approaches one-quarter of the portfolio. This does not even include `MediaTek` (2.00%). If we also count `Tencent` and `Alibaba`'s spending in AI cloud services, it is fair to say that this fund's NAV trajectory is already highly tied to the global AI capex cycle.
The twofold nature of this concentration is: on the one hand, capital expenditure by `hyperscalers` (Amazon, Microsoft, Alphabet, Meta, Apple) is still expanding, and the Asian semiconductor supply chain is a beneficiary with a relatively high degree of certainty; on the other hand, the cyclical swings in AI capex are often more violent than market expectations — once the tech giants scale back data center investment plans, the earnings expectations and valuations of these holdings may contract simultaneously, and the fund's position structure makes it difficult to pivot to a defensive stance in time.
The Contrarian Nature of Trading Moves and A/H Price Spread Arbitrage
Comparison of India and China GDP growth forecasts; India at 6.5% in 2024, China at 4.8%
Several trades disclosed in the report are worth noting:
- The switch from CATL's H-shares to A-shares: The fund used the price spread of the same company listed in Hong Kong and mainland China to make the switch. This is not merely optimization at the stock-selection level; it also reflects a grasp of market microstructure.
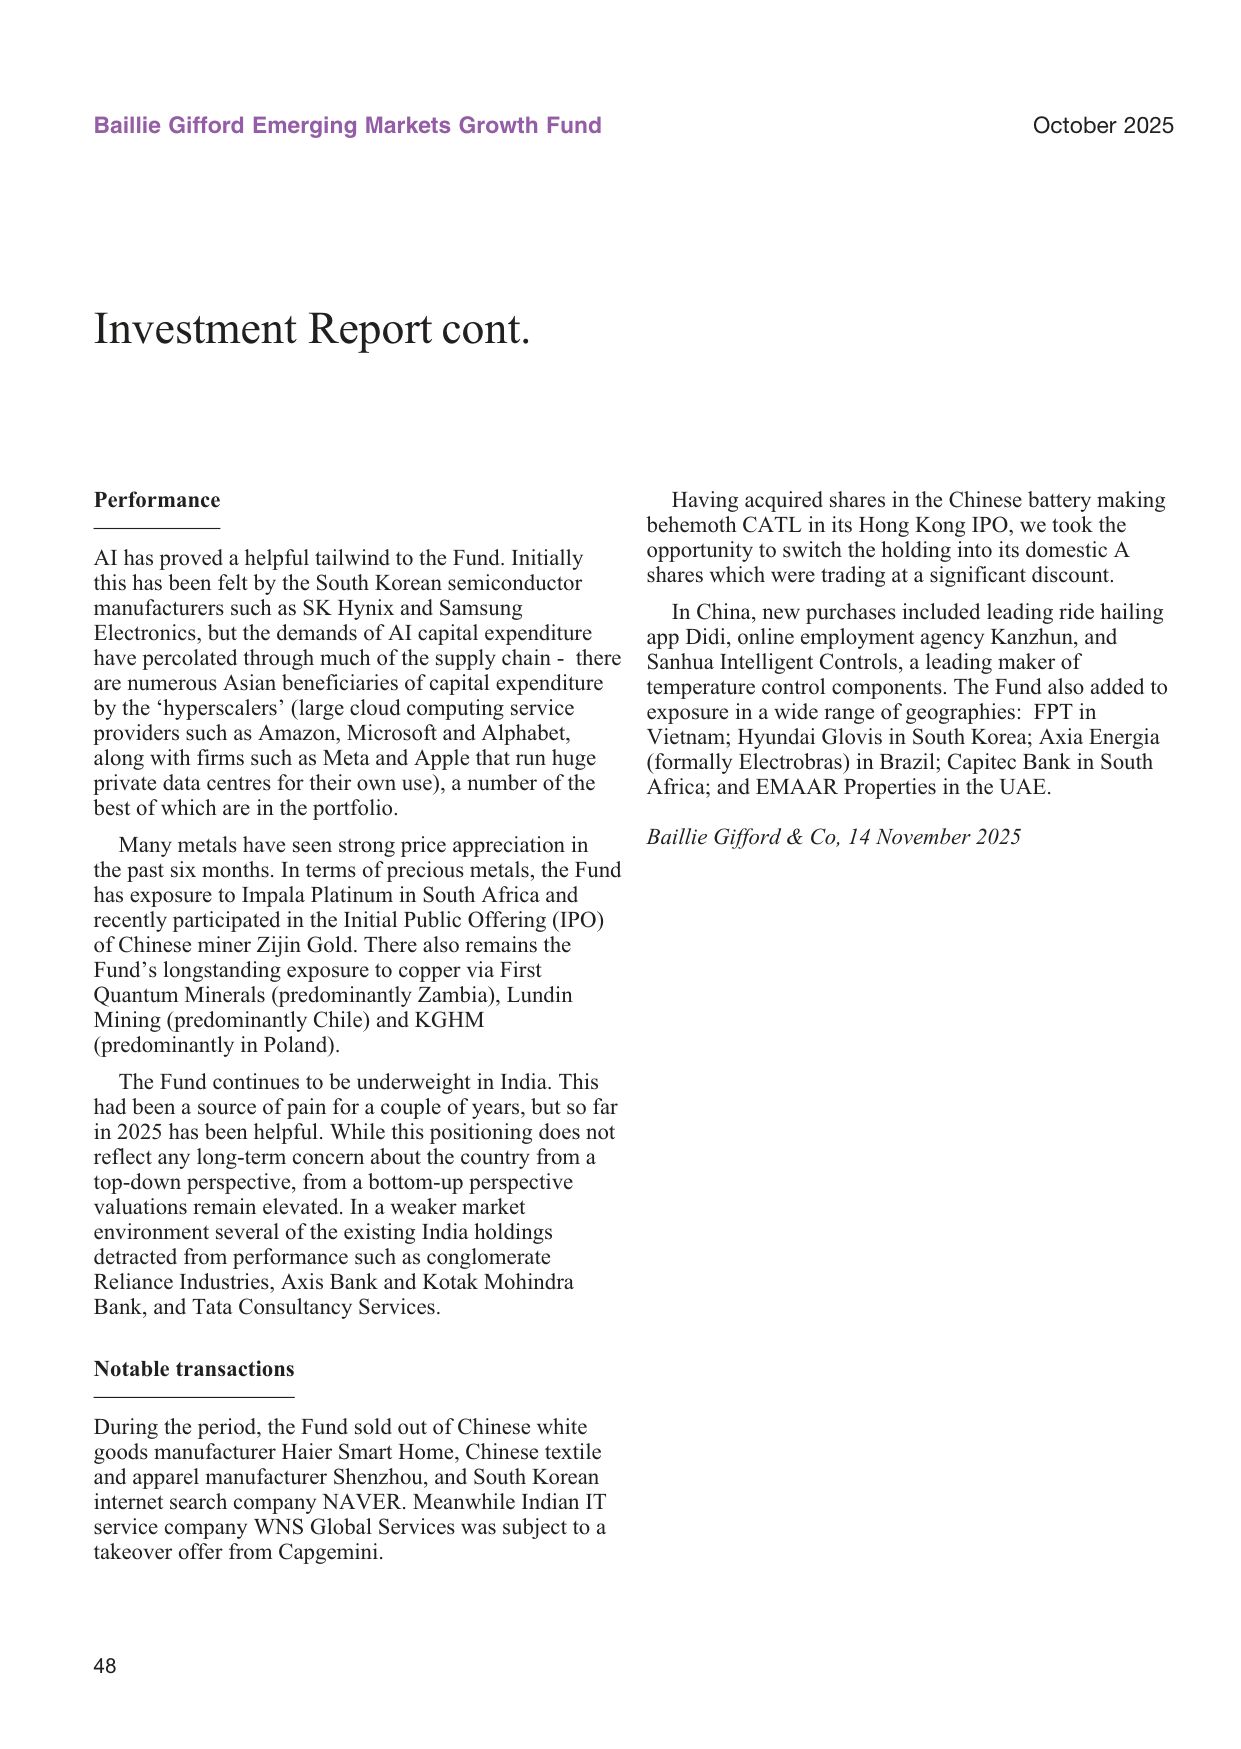
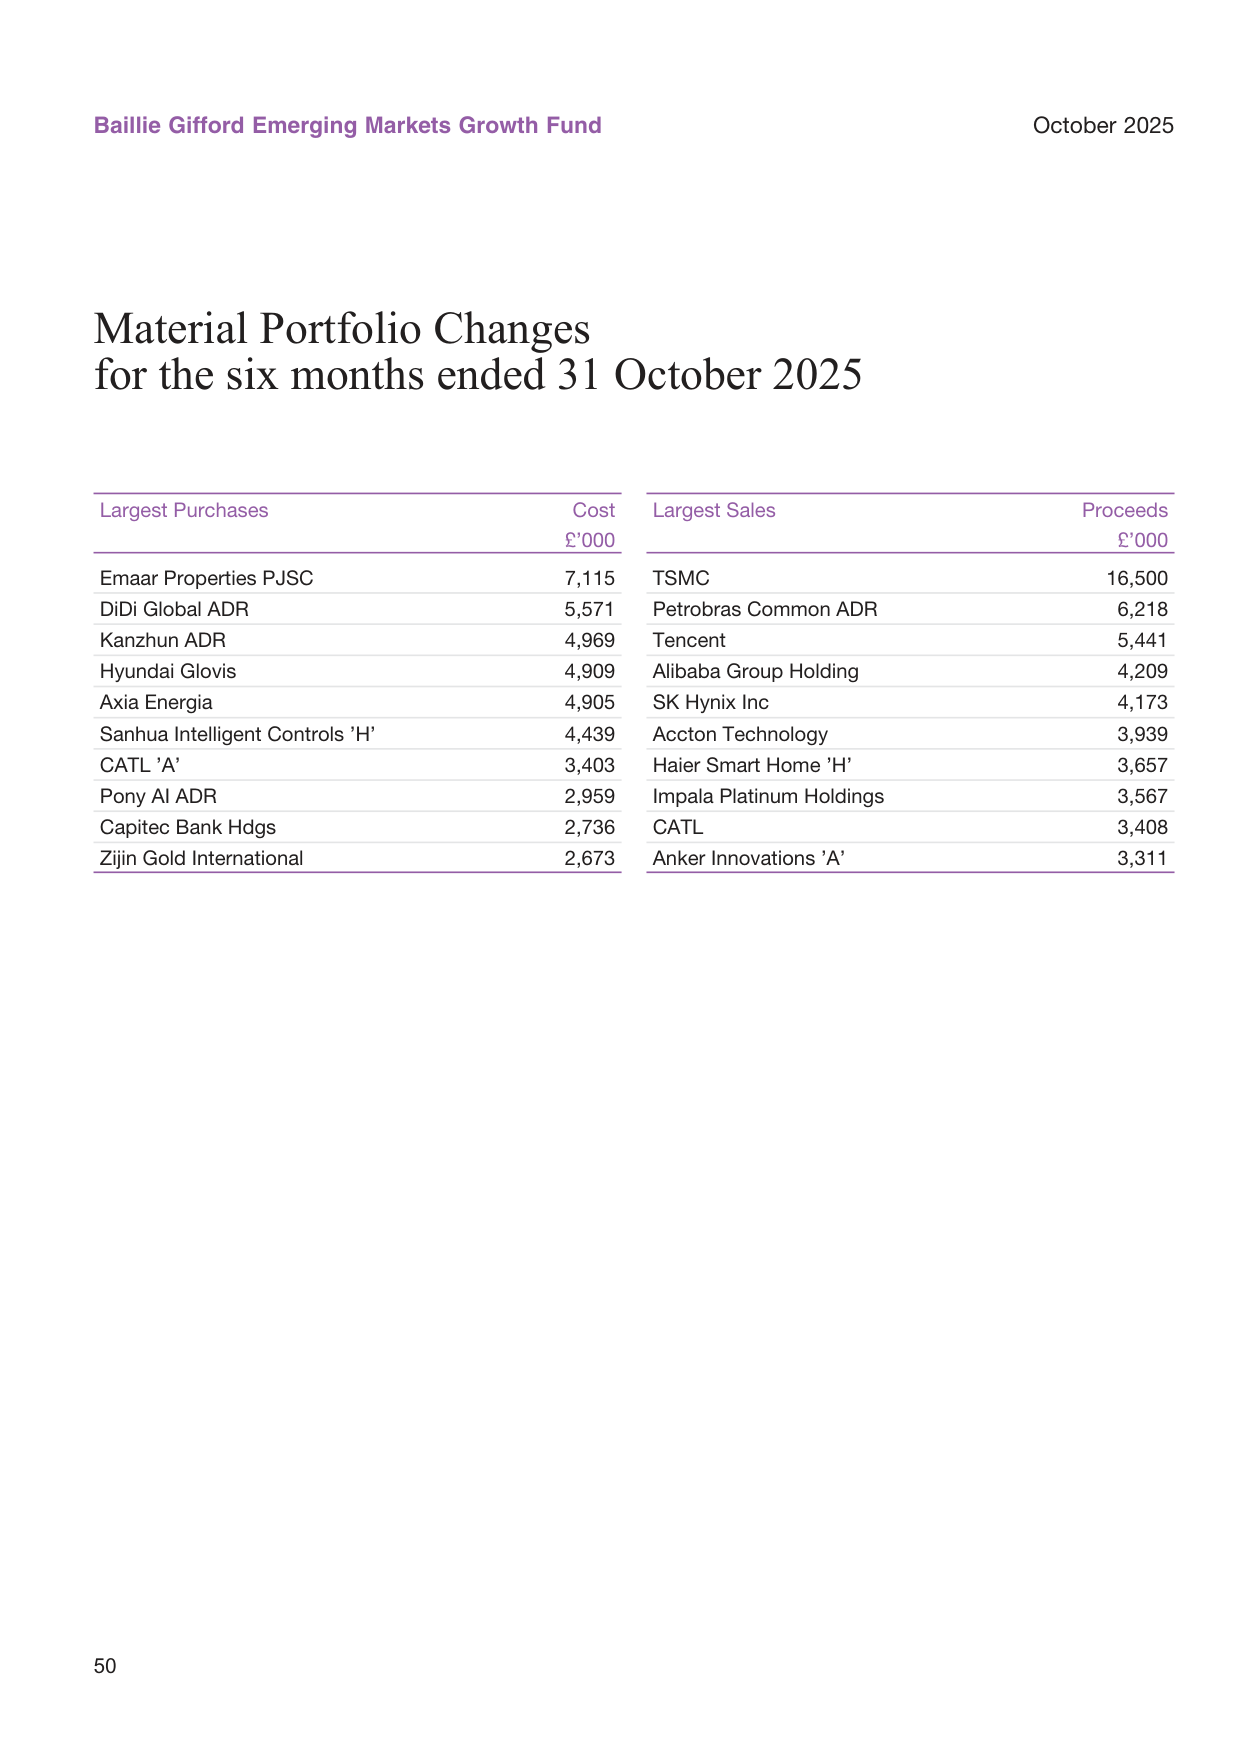
- Selling `Haier Smart Home`, `Shenzhou`, and `NAVER` while buying `Didi`, `Kanzhun`, and `Sanhua` — the common thread in this set of changes is a shift from "mature cash-flow-generating companies" toward "companies in the middle of their growth curve or in a rebound phase after heavy regulatory pressure." After `Didi` experienced the regulatory storm over Chinese concept stocks and its share price fell sharply, building a position at this point carries an obvious contrarian character.
- Significant participation in IPOs: `Emaar Properties` (largest buy), `Zijin Gold`, `Pony AI`, and `CATL H-shares` — total participation in these four IPOs exceeded £15 million, indicating that beyond rebalancing existing positions, the fund is also seeking low-cost entry opportunities through new issues.
These trading moves show a fairly strong directional consistency: reducing positions where the valuation-repair logic has largely played out, and adding positions where "expectations are low and a fundamental inflection point is just emerging." However, it should be noted that such a strategy tends to underperform in bull markets — because the market prefers trend continuation over mean reversion.
Shrinking China Exposure: The Tension Between Risk Disclosures and Allocation
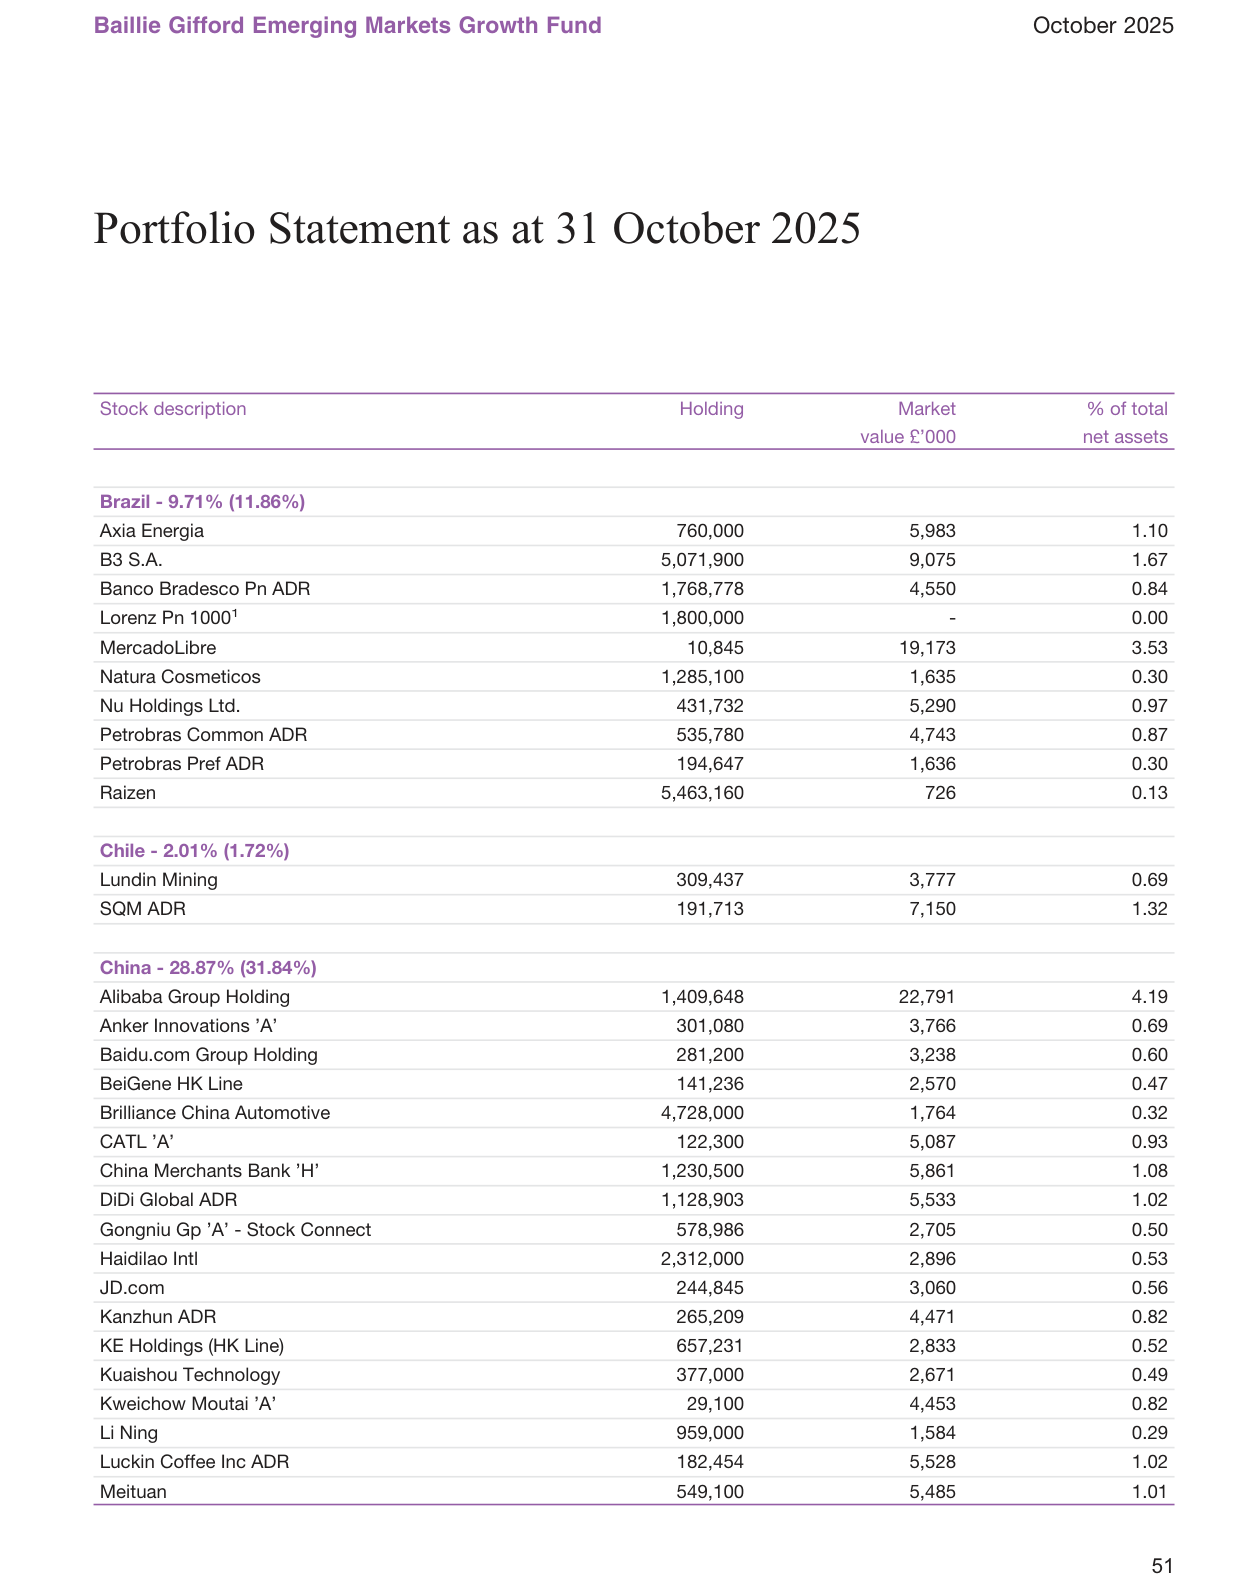
The portfolio table shows that China's allocation fell from 31.84% to 28.87%, a decline of about 3 percentage points. Even so, China remains the fund's largest single-country exposure, far above second-ranked Brazil (9.71%). This contradiction is worth examining:
Brazil and Mexico current account balances as a share of GDP; Brazil improved from -1.2% to 0.5%
- From a trading perspective, the fund continues to buy Chinese names (`Didi`, `Kanzhun`, `Sanhua`, `CATL A-shares`, `Zijin Gold`), indicating that long-term conviction in Chinese individual stocks has not wavered;
- At the same time, however, the fund devotes an entire paragraph in its risk disclosures to the unique uncertainties of the Chinese market — from "risk of market suspension" to "corporate governance, regulation, legislation, and taxation" — an additional risk disclosure that does not appear for any other country.
This combination of "verbal warnings, optimistic actions" looks more like the investment manager being obliged to make a comprehensive disclosure of China risks at the compliance level, while actual investment decisions remain based on bottom-up company selection. In terms of performance attribution, the 2025 rebound in Chinese holdings (particularly `Alibaba`, `Tencent`, and `CATL`) contributed substantially to the fund's 36.2% return over the most recent six months, showing that this exposure delivered the right exposure at the right time.
India Underweight: A Contrarian Case Worth Remembering
The fund admits that "the India underweight caused pain in 2021–2022," but in 2025 this same underweight became a tailwind instead. The report further explains the reason: it is not that India's long-term fundamentals are in doubt, but that individual stock valuations look "too expensive."
This case exposes the hardest practical problem in active management: an allocation decision based on valuation may take two to three years to be validated; and until it is validated, the manager must endure persistent relative-return pressure. The pullbacks of `Reliance Industries`, `Axis Bank`, `Kotak Mahindra Bank`, and `TCS` in weak markets in turn prove the old adage that "excessive valuations squeeze future return space." But the problem is: if the Indian market continues to trade at high valuations while the fund remains persistently underweight, the cost will keep accumulating. This is a dynamic game without a standard answer.
The Overlooked Capital Erosion: The Compounding Loss from Fees Deducted from Capital
Global IPO issuance by region; the US accounted for 40% and Asia 35% in 2024
In the fee structure section, the report states that it will "seek to deduct fees from income, with any shortfall deducted from capital, thereby reducing the fund's capital value." This fund's holdings are predominantly growth companies with generally low dividend yields — `TSMC` has a dividend yield of roughly 1.5%, `Samsung` below 1%, and `Tencent` around 0.5% — so there is a high probability that fees cannot be fully covered by income and must be deducted from capital. This means the NAV growth investors see already embeds the portion of capital eroded by fees.
From a long-term compounding perspective, the difference between deducting fees from capital versus from income affects not only the NAV level but also the base for future growth. When investors choose a share class that carries a fee (such as the B class with a 0.72% annual fee), they should be aware of the implicit drag this mechanism imposes on long-term returns — an impact that is especially pronounced when the fund is in a low-dividend, high-reinvestment phase.
Based on the complete position details and fund information as of 31 October 2025, the following key points supplement and deepen the understanding of the "Introduction" section of the fund's interim report.
1. Position Concentration: Significant Top-Heavy Weights, Dominated by a Twin Technology Engine
The top five holdings together account for approximately 31.7% of net assets, showing a clear feature of "high concentration in individual names":
US corporate bond yields since 2000; the current 10-year investment-grade yield is approximately 5.2%
| Rank | Holding | Weight (%) |
|---|---|---|
| 1 | TSMC | 9.52 |
| 2 | Tencent | 6.87 |
| 3 | Samsung Electronics | 6.77 |
| 4 | SK Hynix | 5.84 |
| 5 | Reliance Industries | 2.71 |
| Top five total | 31.71 |
TSMC, Samsung Electronics, and SK Hynix alone total 22.13%; combined with semiconductor names such as Mediatek (2.00%) and Silergy (0.40%), the broader semiconductor supply chain accounts for approximately 25% of the fund's net assets. The "AI + memory + foundry" allocation logic is strikingly evident in the holdings, and it also explains the sharp rise in NAV during the period.
2. Regional Allocation: Adding Korea and the UAE, Trimming India and Mexico
Global ESG fund flows; net inflows of approximately $80 billion in 2024
A comparison with 30 April 2025 shows significant shifts in the fund's regional weights:
| Country/Region | 2025.10.31 (%) | 2025.04.30 (%) | Change (pct pts) |
|---|---|---|---|
| South Korea | 18.07 | 11.11 | +6.96 |
| United Arab Emirates | 1.31 | 0.00 | +1.31 |
| Hong Kong | 0.91 | 0.00 | +0.91 |
| Vietnam | 1.12 | 0.72 | +0.40 |
| South Africa | 2.04 | 1.70 | +0.34 |
| Taiwan | 13.40 | 13.70 | -0.30 |
| Peru | 0.94 | 0.99 | -0.05 |
| Russia | 0.00 | 0.00 | 0.00 |
| Thailand | 2.19 | 2.01 | +0.18 |
| Saudi Arabia | 0.47 | 0.62 | -0.15 |
| Singapore | 1.57 | 1.88 | -0.31 |
| Other Emerging | 1.84 | 2.22 | -0.38 |
| Poland | 1.27 | 1.43 | -0.16 |
| Panama | 0.68 | 0.73 | -0.05 |
| Kazakhstan | 0.41 | 0.65 | -0.24 |
| Indonesia | 0.97 | 1.29 | -0.32 |
| Mexico | 2.38 | 3.30 | -0.92 |
| India | 9.87 | 12.79 | -2.92 |
| China (incl. A/H/ADR, estimated) | ~22.6 | Not directly disclosed | Refer to full report |
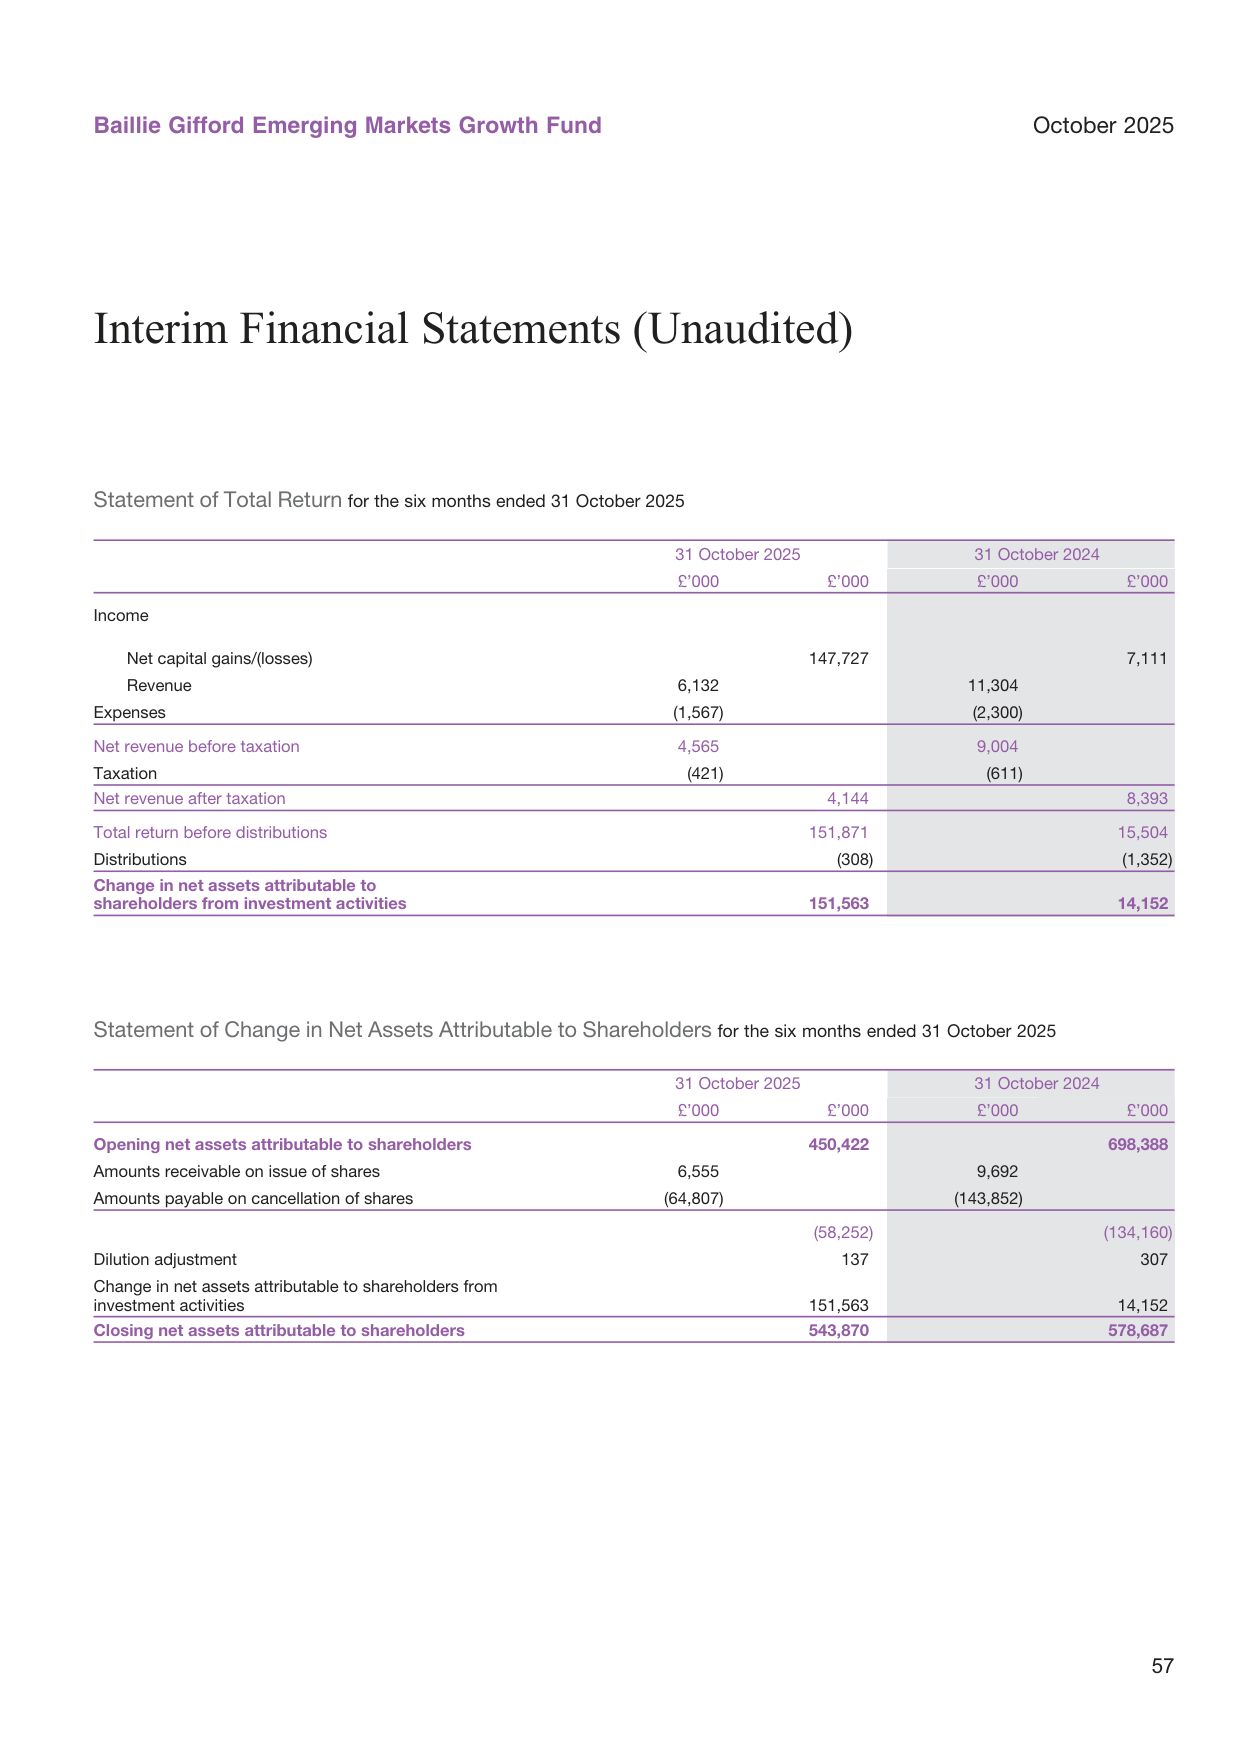
Renewable energy vs. fossil fuel capital expenditure; renewable energy investment reached $1.7 trillion in 2024, surpassing fossil fuels for the first time
The most striking change is Korea's weight rising from 11.11% to 18.07%, mainly driven by significant increases in, or valuation gains of, Samsung Electronics and SK Hynix; meanwhile, India was clearly reduced (12.79% → 9.87%), with Reliance still the fifth-largest holding but its relative weight declining. The UAE and Hong Kong are both newly established regions, showing that the fund is actively expanding into incremental markets in its regional allocation.
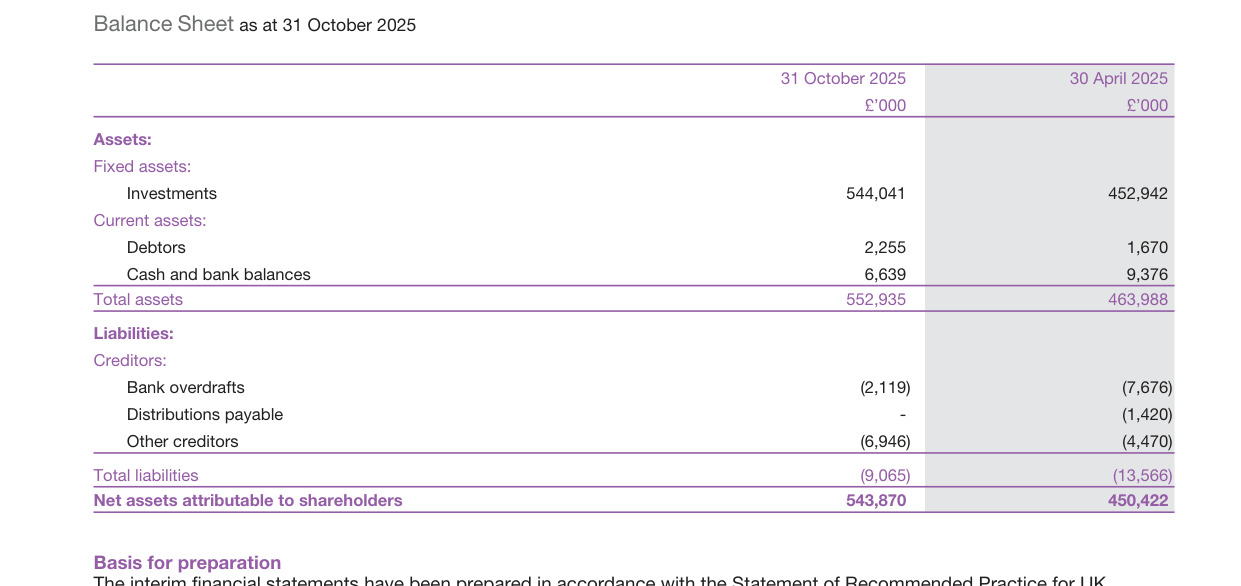
Trade volumes of developed vs. emerging markets; emerging markets' share rose from 30% in 2000 to 45% in 2024
3. Performance and Fund Flows: Asset Appreciation Drives Size, But Net Redemptions Persist
Total return during the period was exceptionally strong, but investor behavior stands in stark contrast to performance:
| Metric | 2025.10.31 (£'000) | 2024.10.31 (£'000) |
|---|---|---|
| Net capital gains | 147,727 | 7,111 |
| Total return before distributions | 151,871 | 15,504 |
| Change in net assets from investment activities | 151,563 | 14,152 |
| Net amounts payable on cancellation of shares | (58,252) | (134,160) |
| Closing net assets | 543,870 | 578,687 |

US fiscal deficit as a share of GDP fell from 15% in 2020 to 6% in 2024, while public debt as a share of GDP rose to 100%
Although investment returns contributed £152 million in half a year, net redemptions during the same period reached £58.25 million (compared with £134 million of redemptions in the same period of 2024). Net assets rose from £450 million to £544 million, driven entirely by investment appreciation rather than new inflows. NAVs across share classes rose by more than 35% on average from 30.4.25→31.10.25 (for example, B Accumulation rose from 937.27p to 1,275.85p, a gain of 36.1%), reflecting profit-taking sentiment toward the fund's high-beta holdings.
4. Fee Structure and Share-Class Divergence: C Class Enjoys the Lowest Cost, But Assets Are Concentrated in B Class
| Share class | Ongoing Charges (%) | Number of shares (31.10.25) | NAV/share (pence) |
|---|---|---|---|
| A Accumulation | 1.55 | 320,727 | 1,071.12 |
| B Accumulation | 0.80 | 24,983,903 | 1,275.85 |
| B Income | 0.80 | 10,561,122 | 930.68 |
| C Accumulation | 0.08 | 8,099,762 | 1,523.22 |
| C Income | 0.08 | 1,000 | 945.51 |
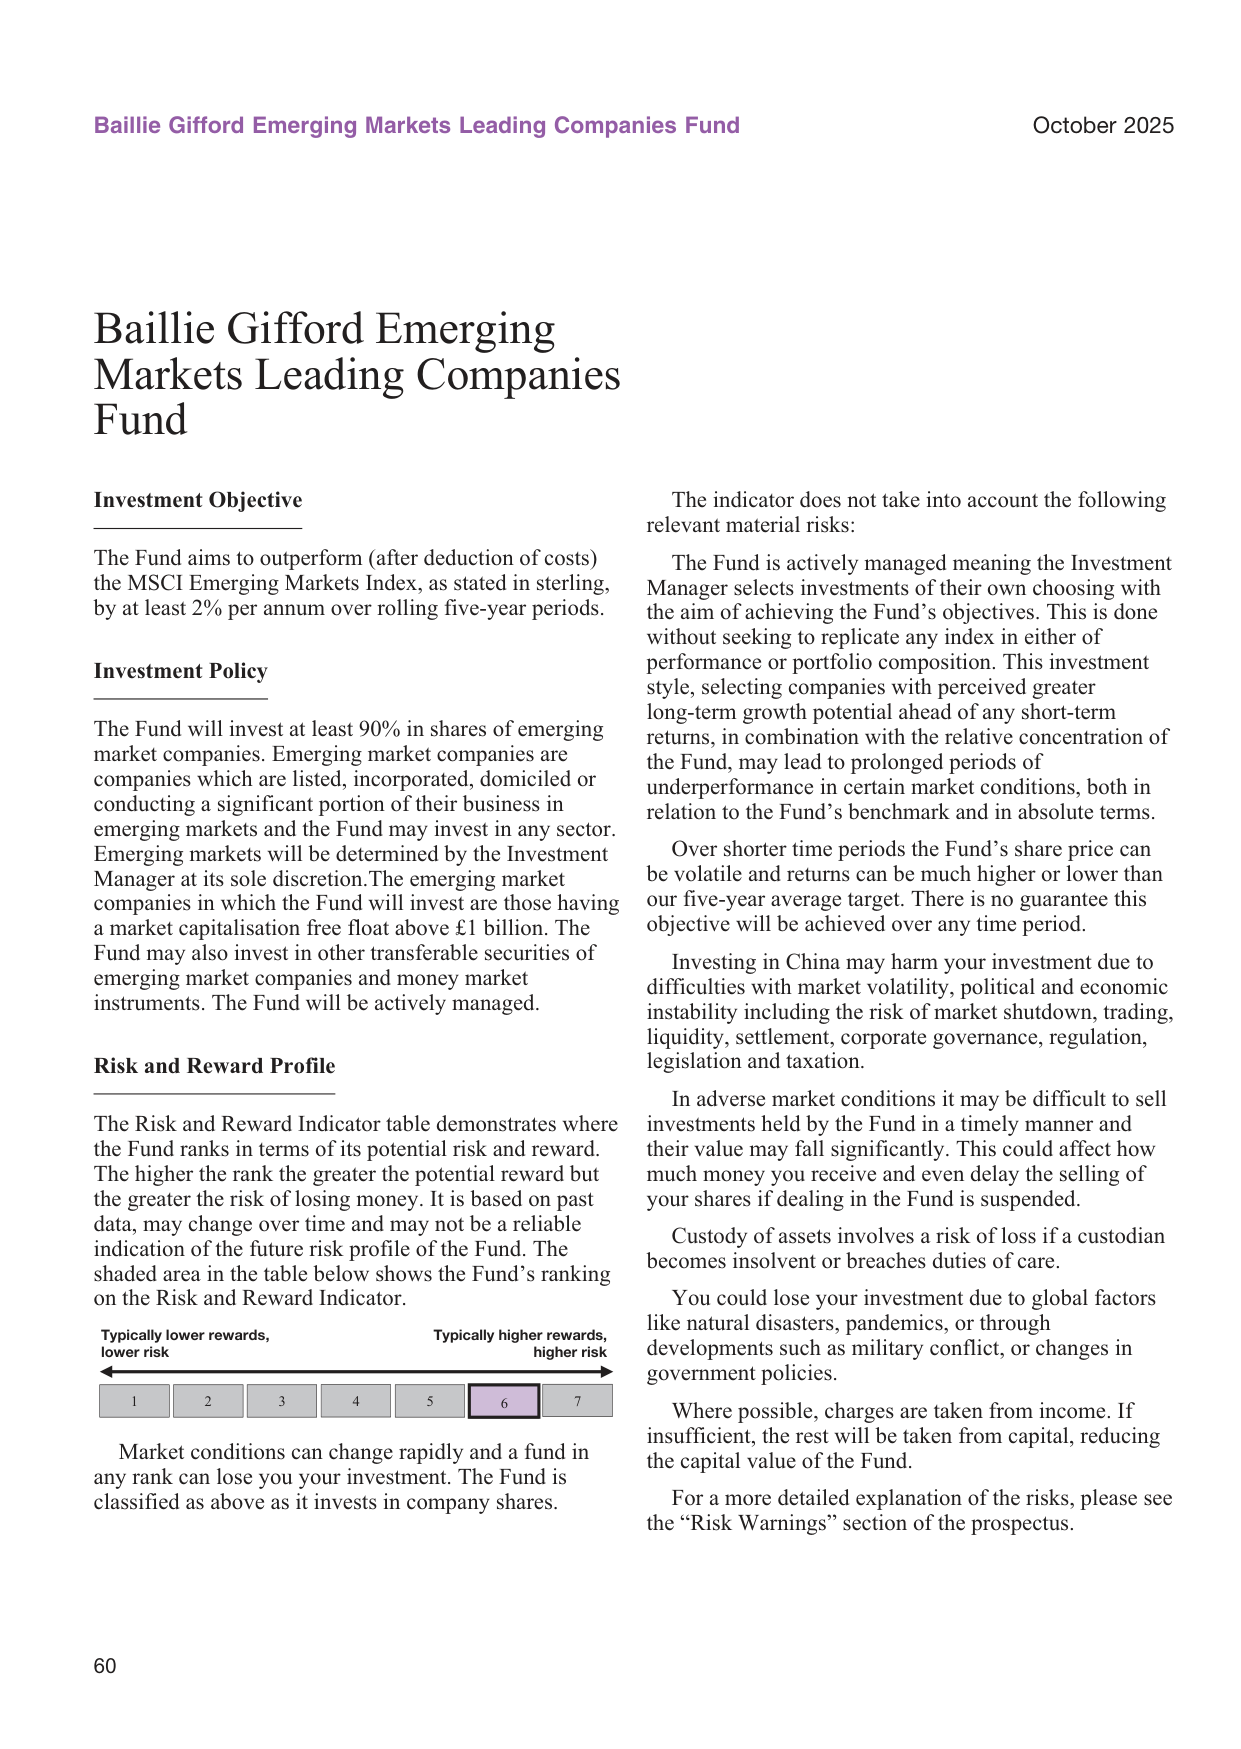
Savings rates by region; East Asia has the highest rate (about 35%) and North America the lowest (about 10%)
The institutional C-class share fee is only 0.08%, yet most of the fund's assets are still held in the B class (with a fee of 0.80%); the A class has only 320,000 shares left and continues to shrink. This indicates that at the distribution level the fund remains dominated by advisor-led sales, while the higher-fee A class is being gradually marginalized.
5. Valuation Risks and Special Items: Russian Positions Written to Zero, Delisted Names Valued by the Investment Adviser
The report clearly states that all Russian holdings (Norilsk, Moscow Exchange, Sberbank, etc.) were valued at zero at the period end, continuing to be affected by the Ukraine conflict; in addition, one delisted stock was valued on an investment-adviser basis. This reminds investors that emerging market funds may face extreme situations of liquidity loss and valuation failure, particularly in geopolitically sensitive regions.
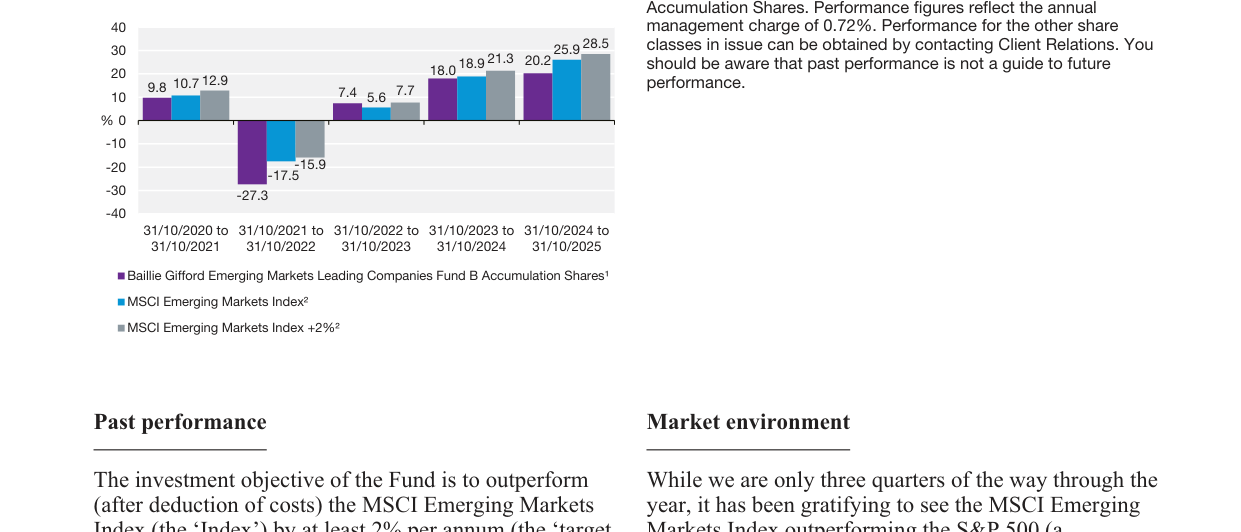
Global central bank digital currency (CBDC) development; 20 countries have launched CBDC pilots
6. The Directionality of New Positions: AI, Gold, and Gulf Economic Diversification
The names newly established during the period have clear themes:
- Pony AI ADR (0.56%): autonomous driving, continuing the AI theme;
- Zijin Gold International (0.91%): gold asset, corresponding to the safe-haven or commodities cycle;
- Emaar Properties (1.31%): the UAE's leading real estate developer, directly expressing a stance on the Gulf's emerging-market opening and tourism economy;
- Kanzhun ADR (0.82%) and Meituan (1.01%) represent selective additions within China's platform economy.
These new positions can be seen as a further extension of the fund's three main threads: "technology growth + resource security + emerging consumption."
In summary, the fund's holdings and financial data as of October 31, 2025 confirm the "growth-style comeback" and "semiconductor-driven" logic anticipated in the Introduction. However, high concentration, persistent net redemptions, and geopolitical zero-valuation factors also constitute key risk points to monitor going forward.
Market Environment and Performance Attribution: Short-Term Catch-Up Coexists with Long-Term Underperformance
Based on the latest six-month data, the fund delivered a 28.1% return (Class B accumulation shares), lagging the MSCI Emerging Markets Index's 30.1% by 2 percentage points and missing its 31.4% target return. Extending the horizon to five years, the fund's annualized return is just 4.0%, trailing the index's 7.6% by 3.6 percentage points and the 9.8% target by 5.8 percentage points. This data combination reveals a key fact: the recent rebound has not yet reversed the long-term underperformance pattern, but it at least demonstrates the strategy's resilience when risk appetite recovers. The report specifically notes that high inflation, rate hikes, and geopolitical shocks in 2021-2022 were the primary drags, while the current environment is turning favorable for growth stocks.
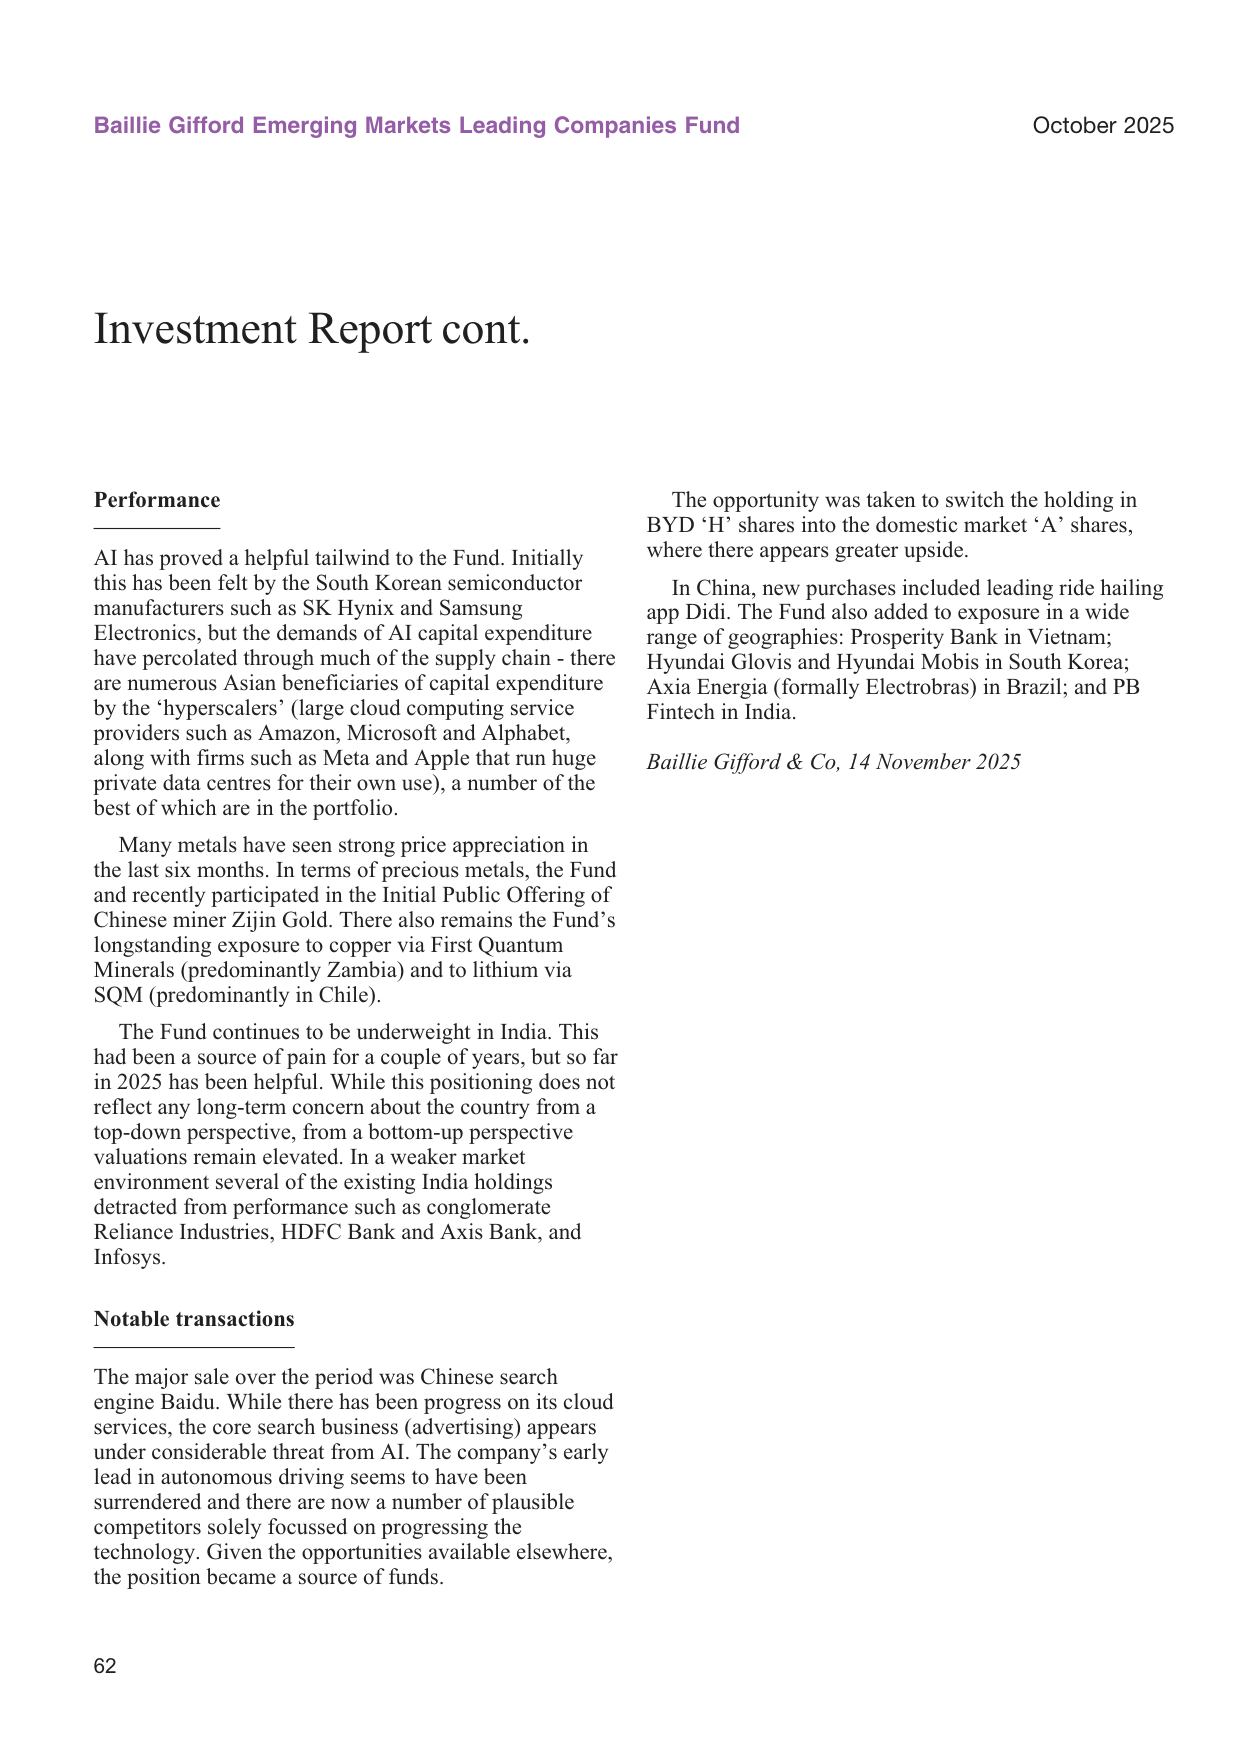
Global composite PMI index trend, currently at 51.5, within expansion territory
Notably, the report proactively mentions that the MSCI Emerging Markets Index outperformed the S&P 500 in 2025 (through October) — the first time since 2020. This is no accident: emerging market countries have generally adopted conservative fiscal policies, orthodox monetary policies, and enhanced political stability, which has allowed them to exhibit "safe haven" characteristics amid tariff uncertainty and globalization headwinds. This narrative challenges the traditional stereotype of "developed markets low-risk, emerging markets high-risk" and provides a macro tailwind for the high-growth companies held by the fund.
Investment Operations: Changing Horses Amid the AI Wave, Pulling the Ladder Before Single-Stock Risks
The operational logic during the period is clear: increase exposure to the AI beneficiary chain while avoiding companies whose business models are disrupted by technology. The most typical case is the full exit from Baidu — despite progress in its cloud services, its core search advertising business has been significantly impacted by AI, and its first-mover advantage in autonomous driving has been eroded by later entrants. Conversely, the fund newly initiated a position in DiDi, reflecting a preference for Chinese platform economy companies with cash flow and scenario advantages.
Another intriguing switch is the conversion of BYD "H" shares to "A" shares. The report states that A-shares have greater upside potential. This cross-market arbitrage-style adjustment is common under the Shanghai-Hong Kong Stock Connect/Shenzhen-Hong Kong Stock Connect framework, but attention should be paid to whether the premium of A-shares relative to H-shares already embeds excessively high expectations. In addition, the fund participated in the IPO of Zijin Gold, a subsidiary of Zijin Mining, and combined with its long-term holdings of First Quantum Minerals (copper) and SQM (lithium), this shows its positioning around the commodity inflation thesis.
The following is a comparison of major trades during the period (in £'000):
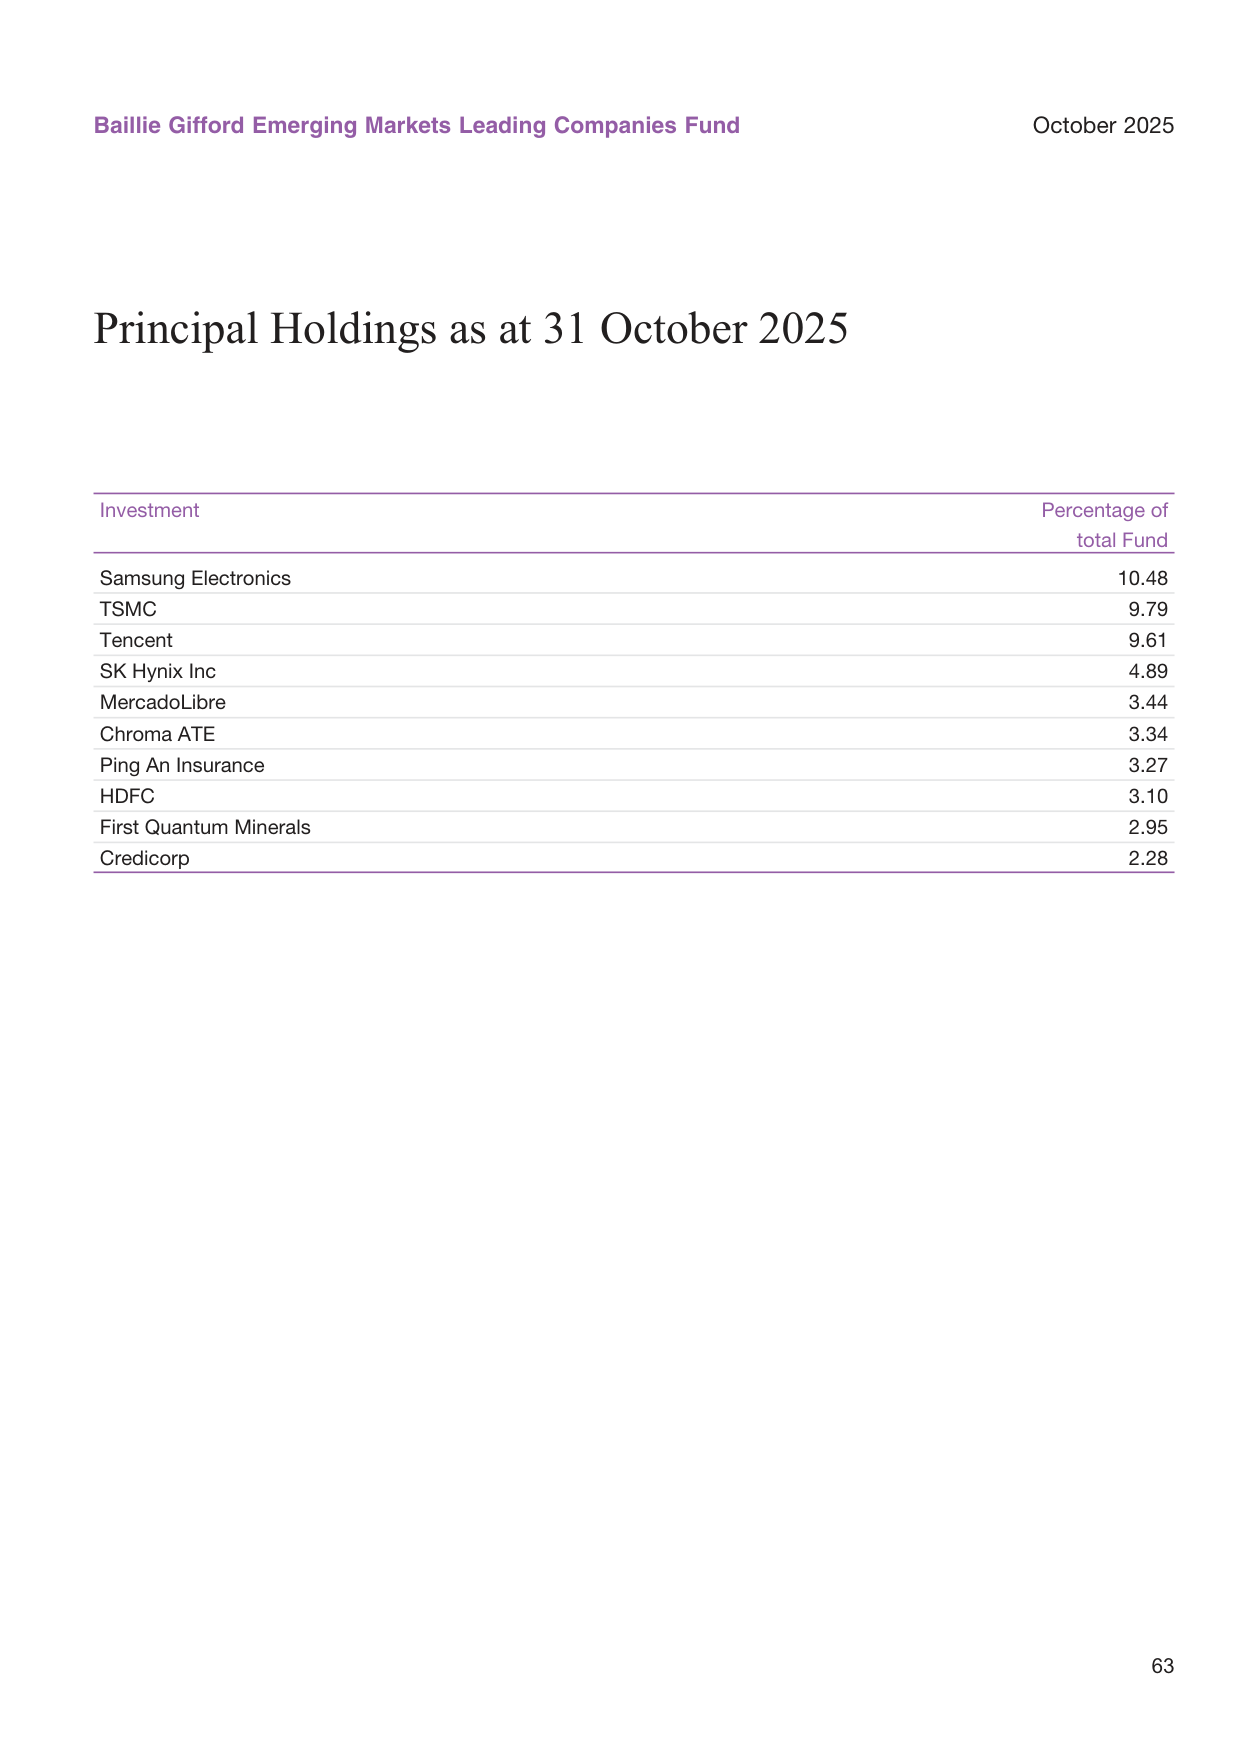
Global housing price index trend, up 2% year-on-year in 2024
| Direction | Ticker | Amount | Direction | Ticker | Amount |
|---|---|---|---|---|---|
| Buy | Tencent | 37,988 | Sell | Naspers | 41,039 |
| Buy | SK Hynix Inc | 13,482 | Sell | TSMC | 16,766 |
| Buy | Naspers | 12,816 | Sell | BYD ‘H’ | 11,963 |
| Buy | BYD ‘A’ | 12,468 | Sell | Petrobras ADR | 9,696 |
| Buy | DiDi Global ADR | 11,038 | Sell | Reliance Industries | 8,423 |
| Buy | B3 S.A. | 9,996 | Sell | Baidu.com | 6,766 |
| Buy | Chroma ATE | 8,269 | Sell | Tencent | 6,540 |
| Buy | Axia Energia | 7,033 | Sell | SK Hynix | 6,239 |
| Buy | Mediatek | 6,935 | Sell | Haier Smart Home | 5,509 |
| Buy | Vietnam Prosperity Bank | 6,917 | Sell | Grupo Financiero Banorte | 3,960 |
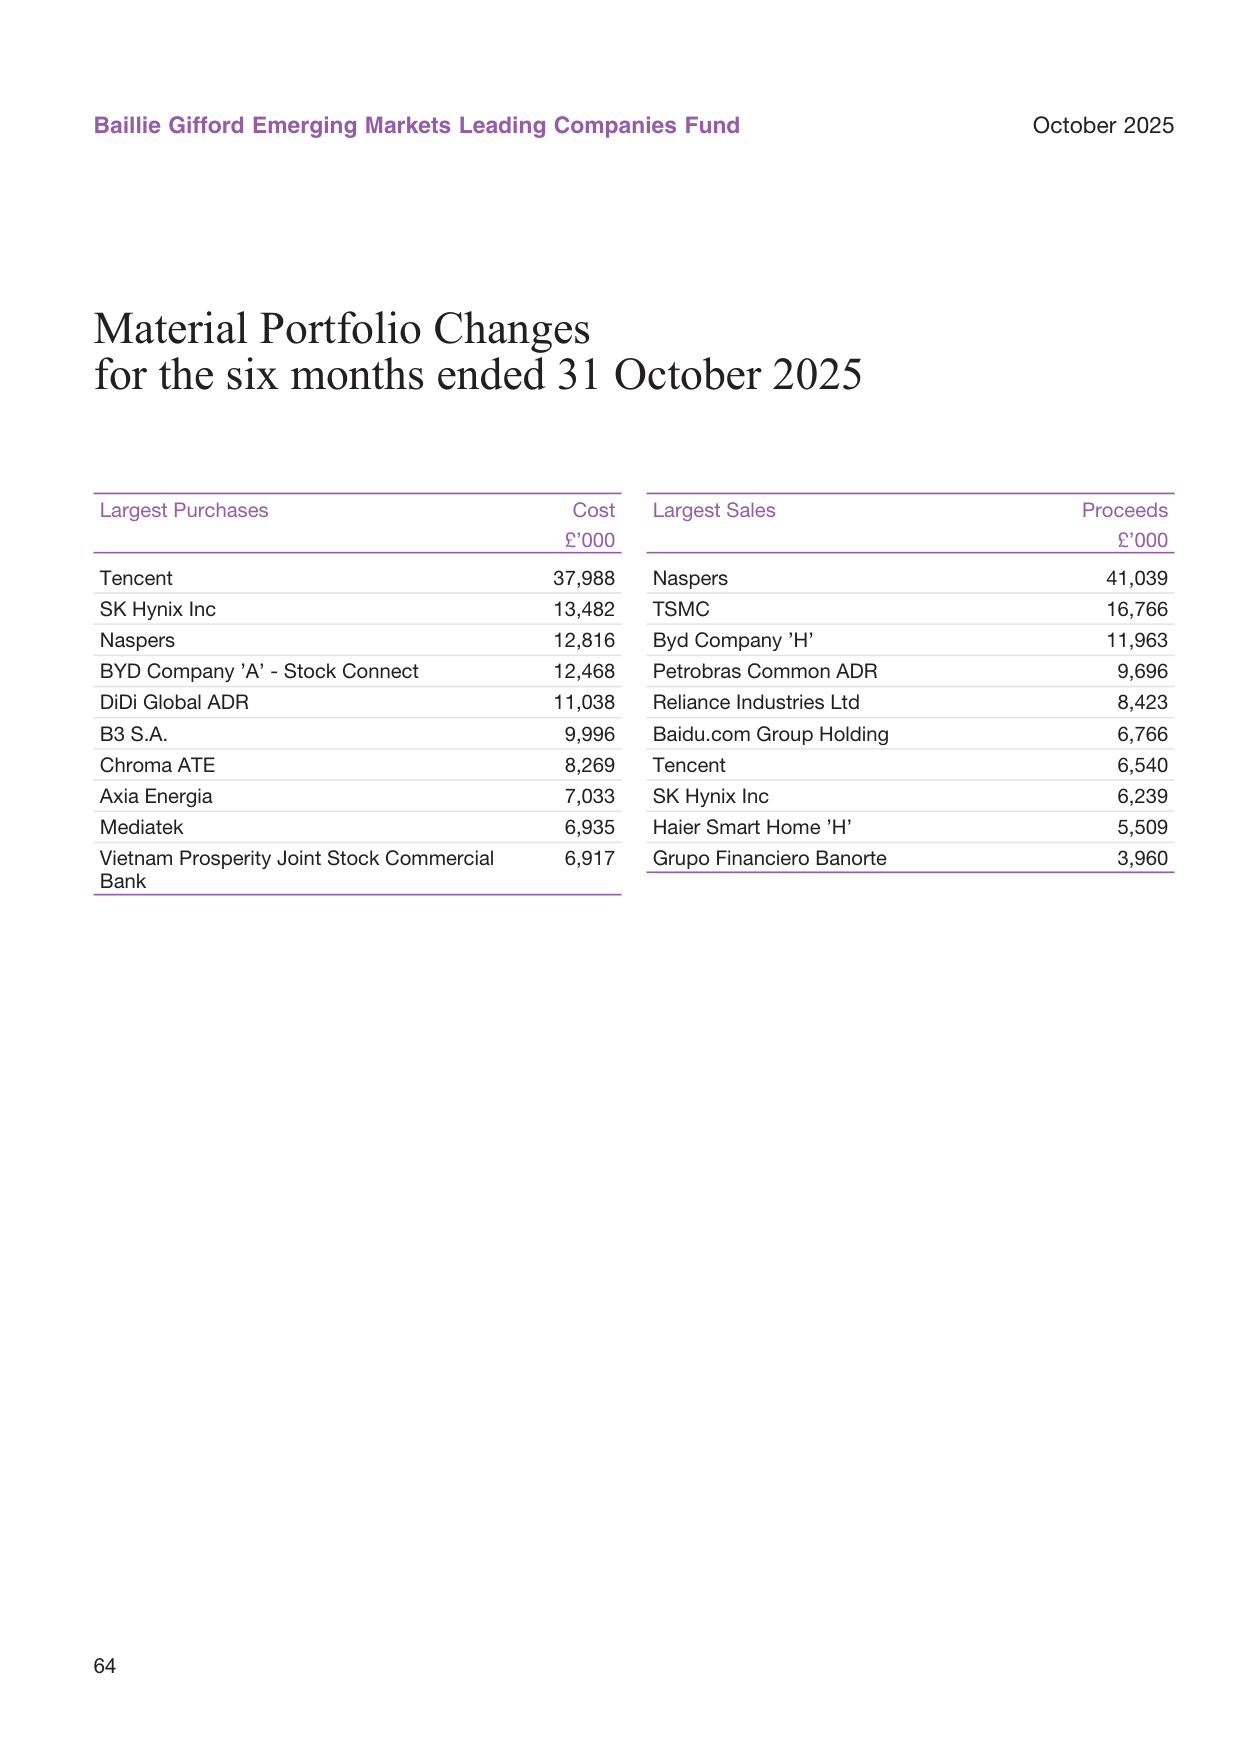
US vs China manufacturing labor costs comparison, with China's costs at 25% of the US
The appearance of both buys and sells in Tencent and SK Hynix indicates that these are not one-way increases or decreases but rather position rebalancing. The large sale of Naspers (Tencent's major shareholder) may be linked to the adjustment of the Tencent position. The sale of Reliance is consistent with the fund's overall underweight India strategy, while the new additions of a Vietnamese bank and Brazilian power assets reflect diversified geographic allocation.
Portfolio Concentration and Country Risk
The top five holdings together account for nearly 38% of the portfolio, with Samsung Electronics (10.48%), TSMC (9.79%), and Tencent (9.61%) forming an "iron triangle." This high concentration is an inevitable result of the active management style, but it also means that single-company events (such as Samsung operational volatility or an escalation of US-China technology sanctions) could significantly drag down the NAV. The report's caution that "relative concentration" may lead to long-term underperformance is consistent with this data.
By country, Brazil's disclosed holdings alone account for 9.71% of net assets, down from 11.21% in the prior period, but still a significant exposure. Notably, the portfolio does not explicitly list China's weight, but based on the top ten holdings (Tencent, BYD A, DiDi, Zijin, etc.), China-related exposure is likely to exceed 25%. Combined with the China-specific risk warnings, investors should be alert to policy and market access risks.
Implications for Investors: Judge Over Five Years, But Watch for Persistent Style Drift
The report repeatedly emphasizes a five-year evaluation horizon, but a five-year annualized return of 4.0% is indeed not impressive. In comparison, the index's annualized return of 7.6% far exceeded most active emerging market funds over the same period; this is not purely market beta — the fund suffered deeper losses in the 2021-2022 downturn. During this rebound, the fund only achieved 28.1%, still lagging the index by 2 percentage points, indicating that even when the market warms up, high-valuation growth stocks do not necessarily lead. Investors need to consider: although the underweight in India is currently a positive contributor, if India regains momentum after valuation digestion, this decision could once again become a drag.
The report's disclosure of risks such as "investing in China may impair investment" is not boilerplate. The fund holds heavy positions in China's internet, new energy, and semiconductor sectors, and geopolitical factors could directly impact the tradability and valuation of these industries. Within emerging markets, the fund is attempting to diversify risk by increasing exposure to South Korea, Brazil, Vietnam, and other markets, but the rise of the AI theme may bind the portfolio more tightly to the global technology capital expenditure cycle, which is both an opportunity and a hidden danger.
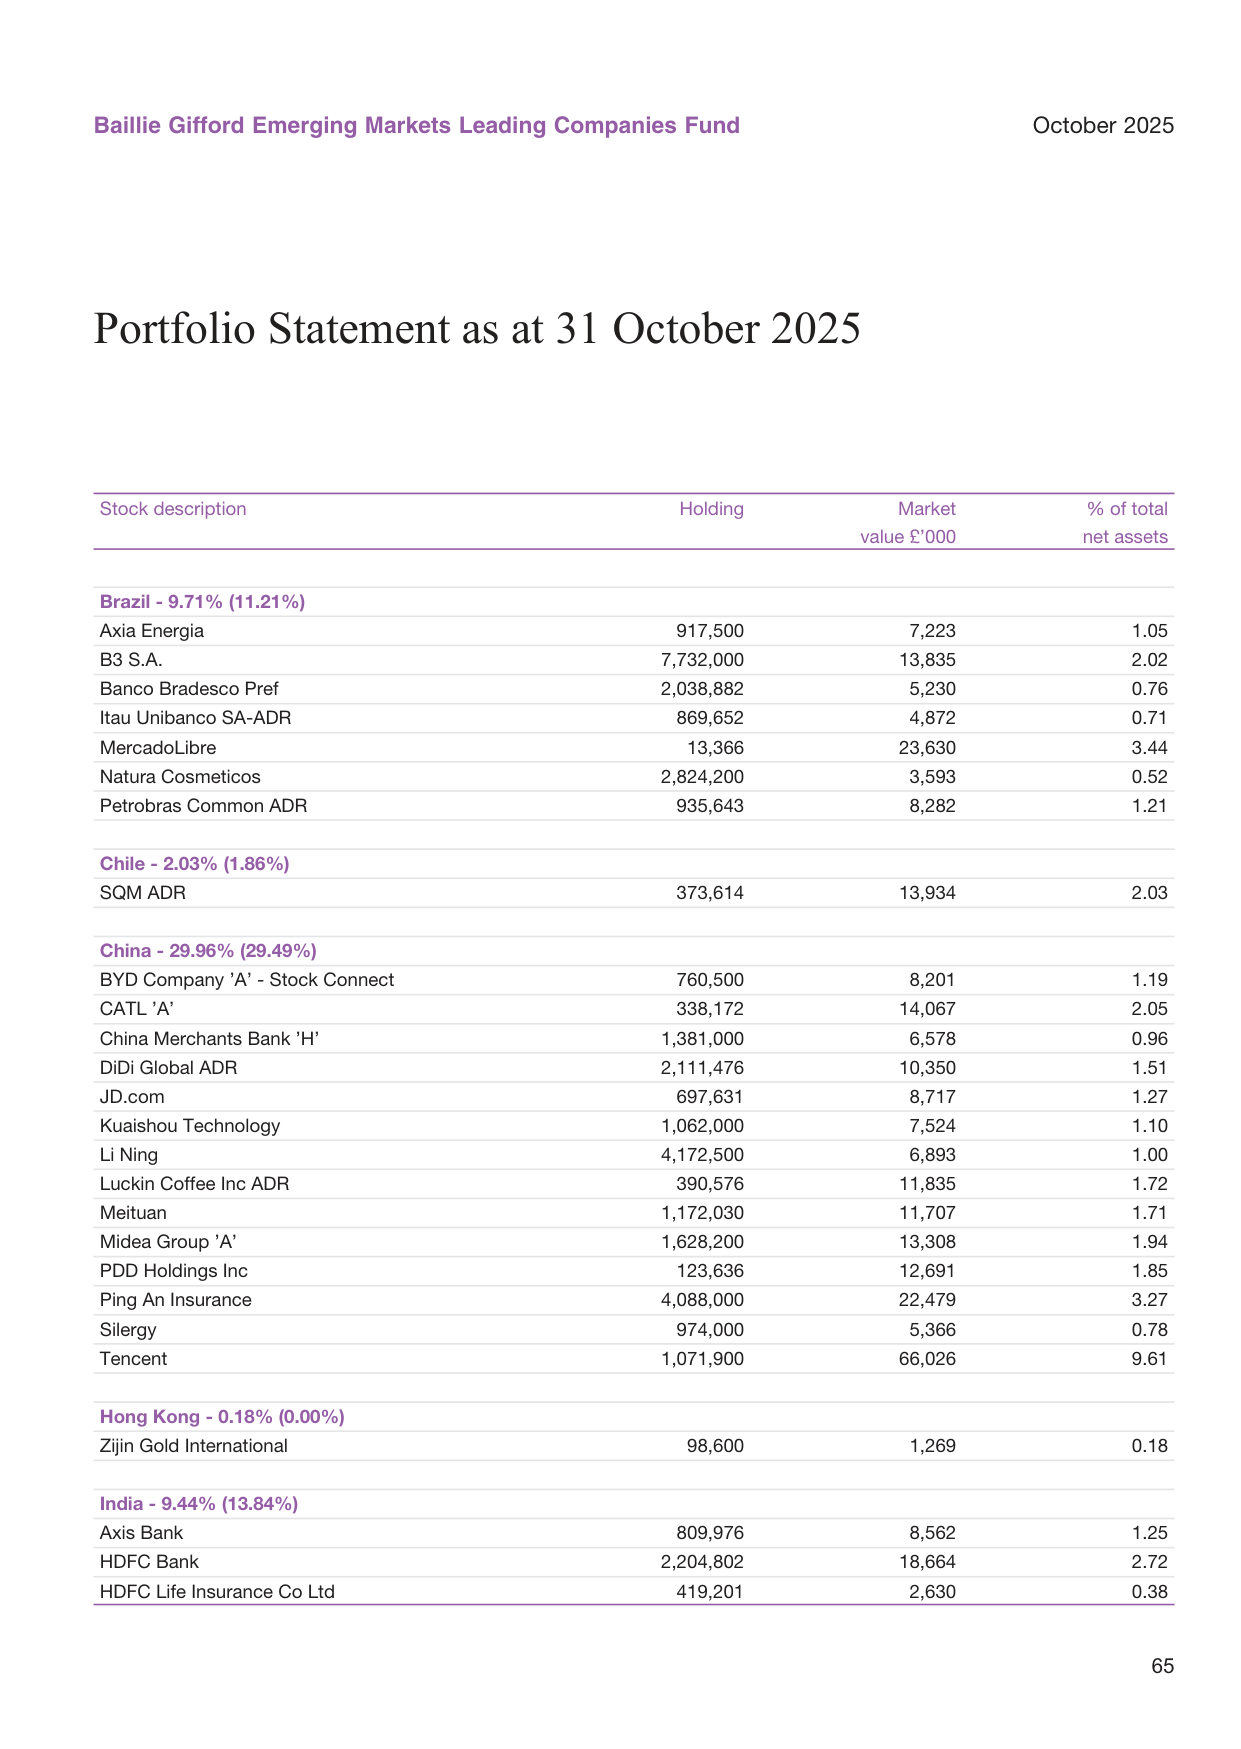
Global smartphone penetration rising year by year, reaching 75% in 2024
Based on the content of Part 11 provided, this section focuses primarily on the complete holdings details and financial data of the Baillie Gifford Emerging Markets Leading Companies Fund, as well as the opening information for the Baillie Gifford European Fund. The following is an in-depth analysis of the newly added content:
Emerging Market Fund Holdings Structure: Micro-Level Verification of Concentration and Strategic Shift
1. Top Ten Holdings: Core Weightings Further Concentrated
As of October 31, 2025, the fund's top ten holdings accounted for 44.39% of total assets, a further increase in concentration relative to end-April levels.
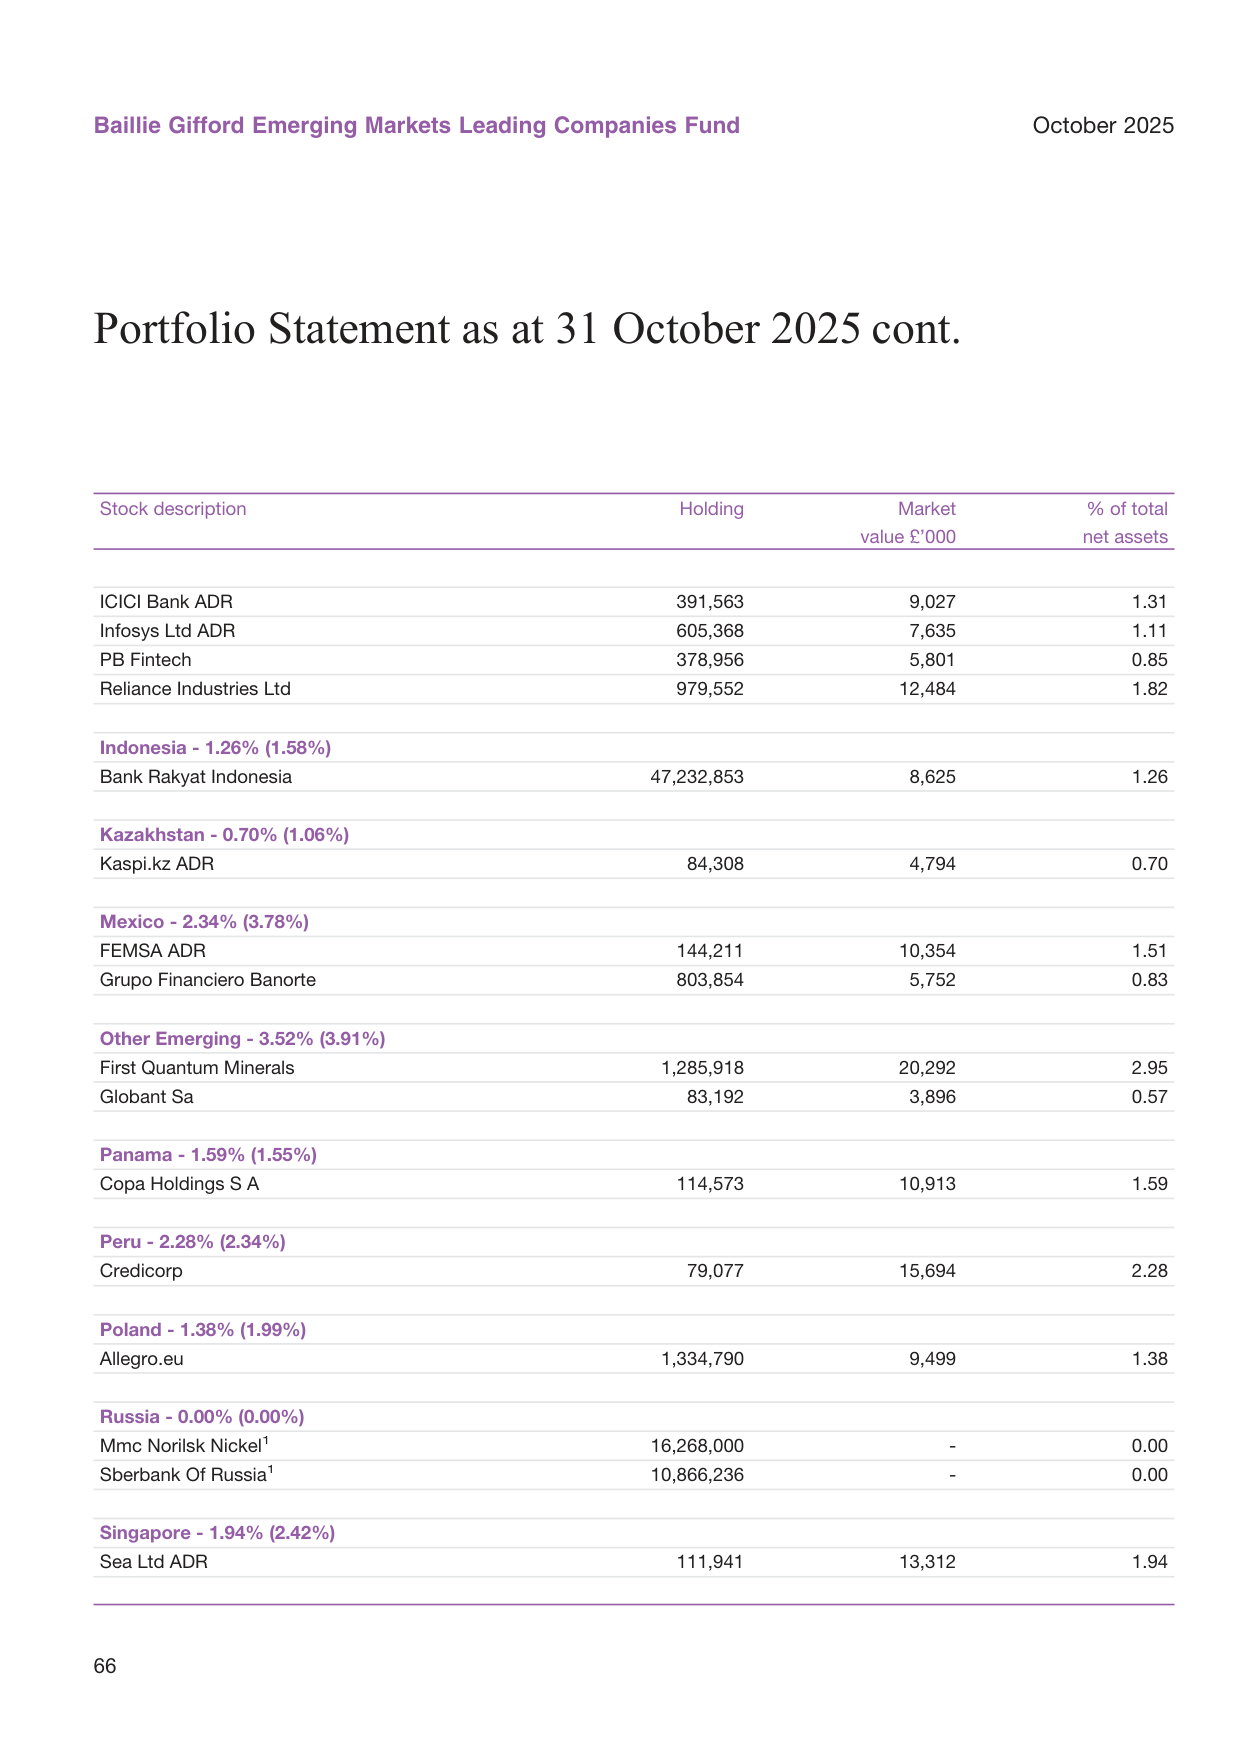
Electric vehicle sales as a share of total vehicle sales: 22% in 2024, projected to reach 40% by 2030
| Holding | % of Net Assets |
|---|---|
| Tencent | 9.61 |
| TSMC | 9.79 |
| Samsung Electronics | 10.48 |
| SK Hynix | 4.89 |
| Meituan | 1.71 |
| PDD Holdings | 1.85 |
| ICICI Bank | 1.31 |
| HDFC Bank | 2.72 |
| MercadoLibre | 3.44 |
| Credicorp | 2.28 |
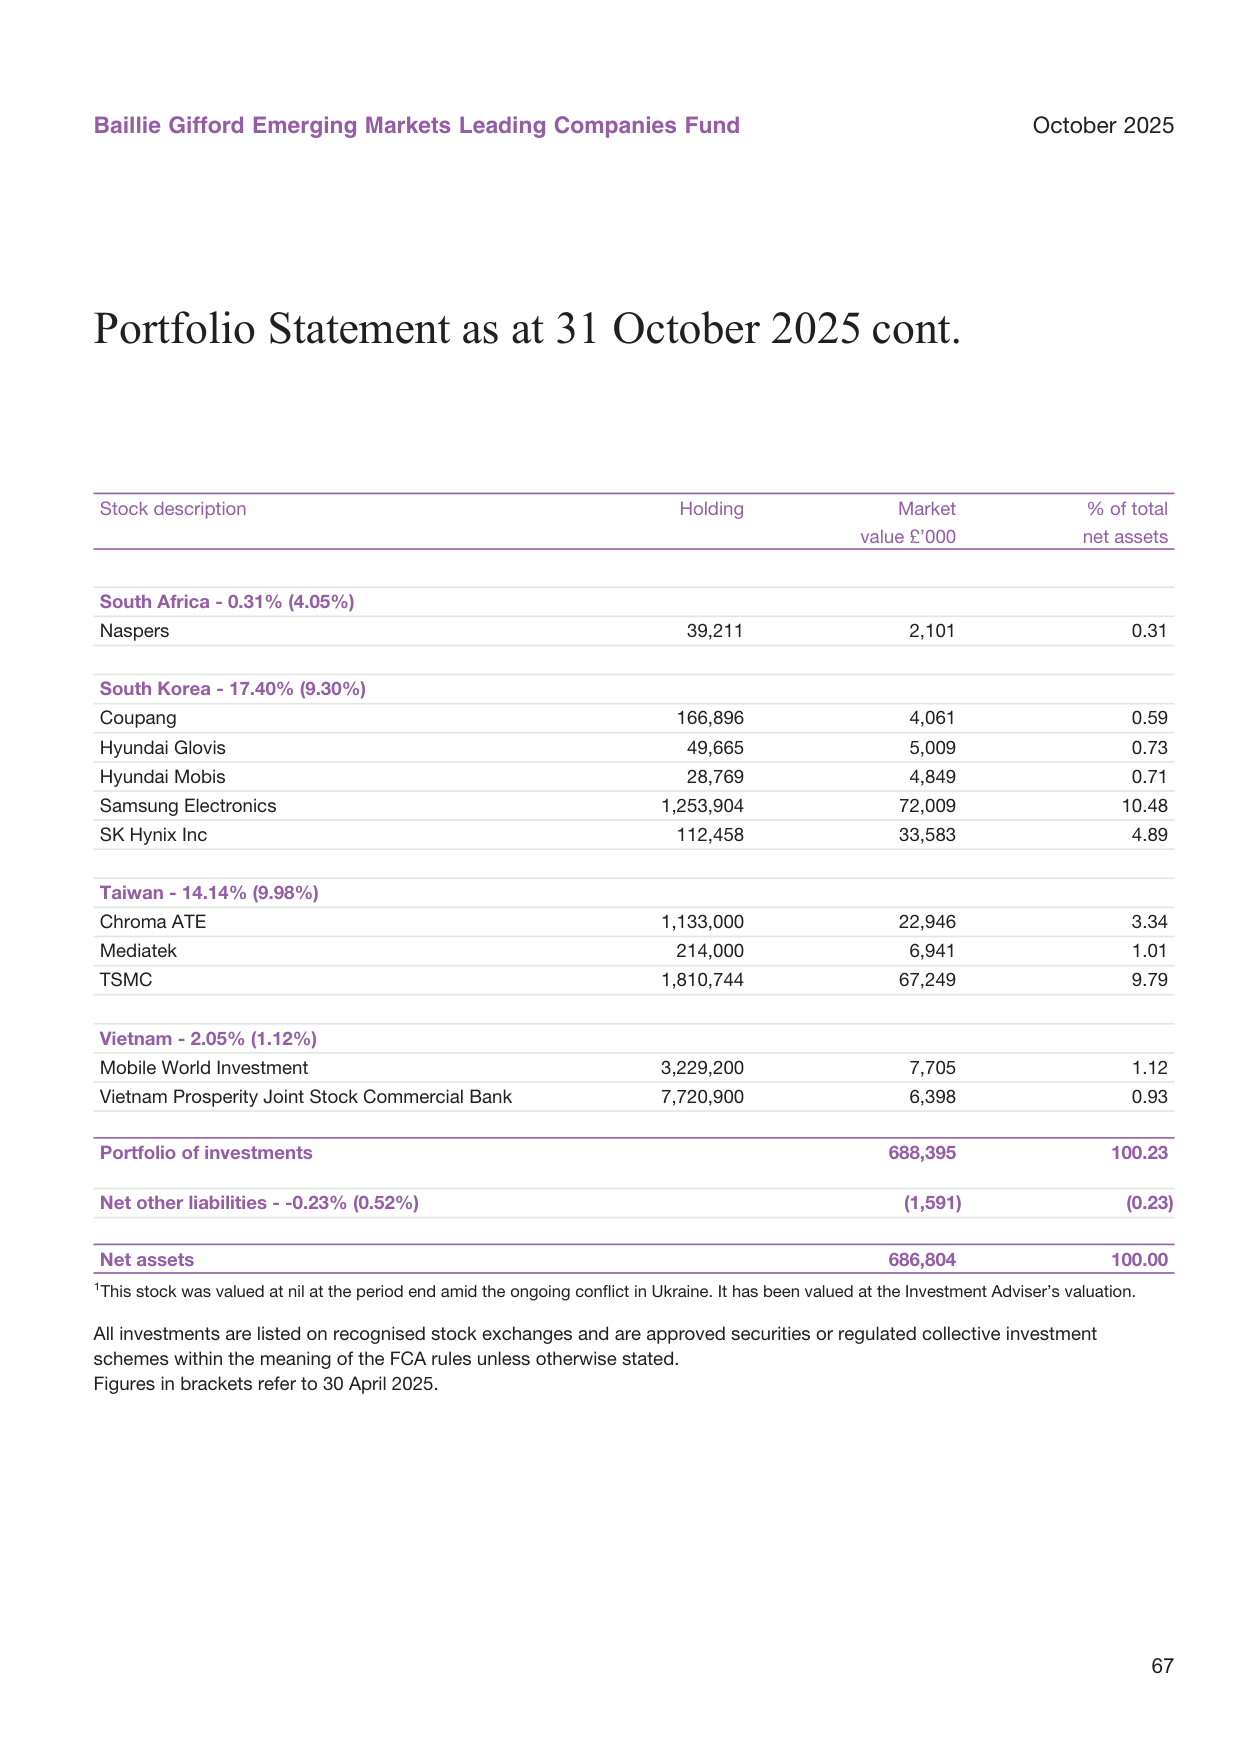
Global military expenditure trend: reached $2.4 trillion in 2024, representing 2.4% of global GDP
Key Findings:
- The top three holdings together represent 29.88% of total assets, approaching one-third of the portfolio. This reflects Baillie Gifford's quintessential "high-conviction, concentrated holdings" style — building substantial positions in a select group of leading companies with long-term structural growth potential.
- The semiconductor supply chain carries notable weight: TSMC + Samsung Electronics + SK Hynix together account for 25.16%, making it the fund's largest industry exposure. This aligns closely with the global surge in AI computing power demand and the memory chip sector's entry into an upcycle.
- Chinese internet platforms remain a core allocation: Tencent + Meituan + PDD + JD.com + Kuaishou together account for approximately 15.54%. Although the weighting has moderated relative to the start of the year, absolute positions remain substantial, indicating that the fund has not systematically exited Chinese assets but has instead pursued a structural rebalancing strategy.
2. Country/Region Allocation Changes: A Notable Rebalancing Signal
The following compares the fund's country/region allocations as of October 31, 2025, and April 30, 2025:
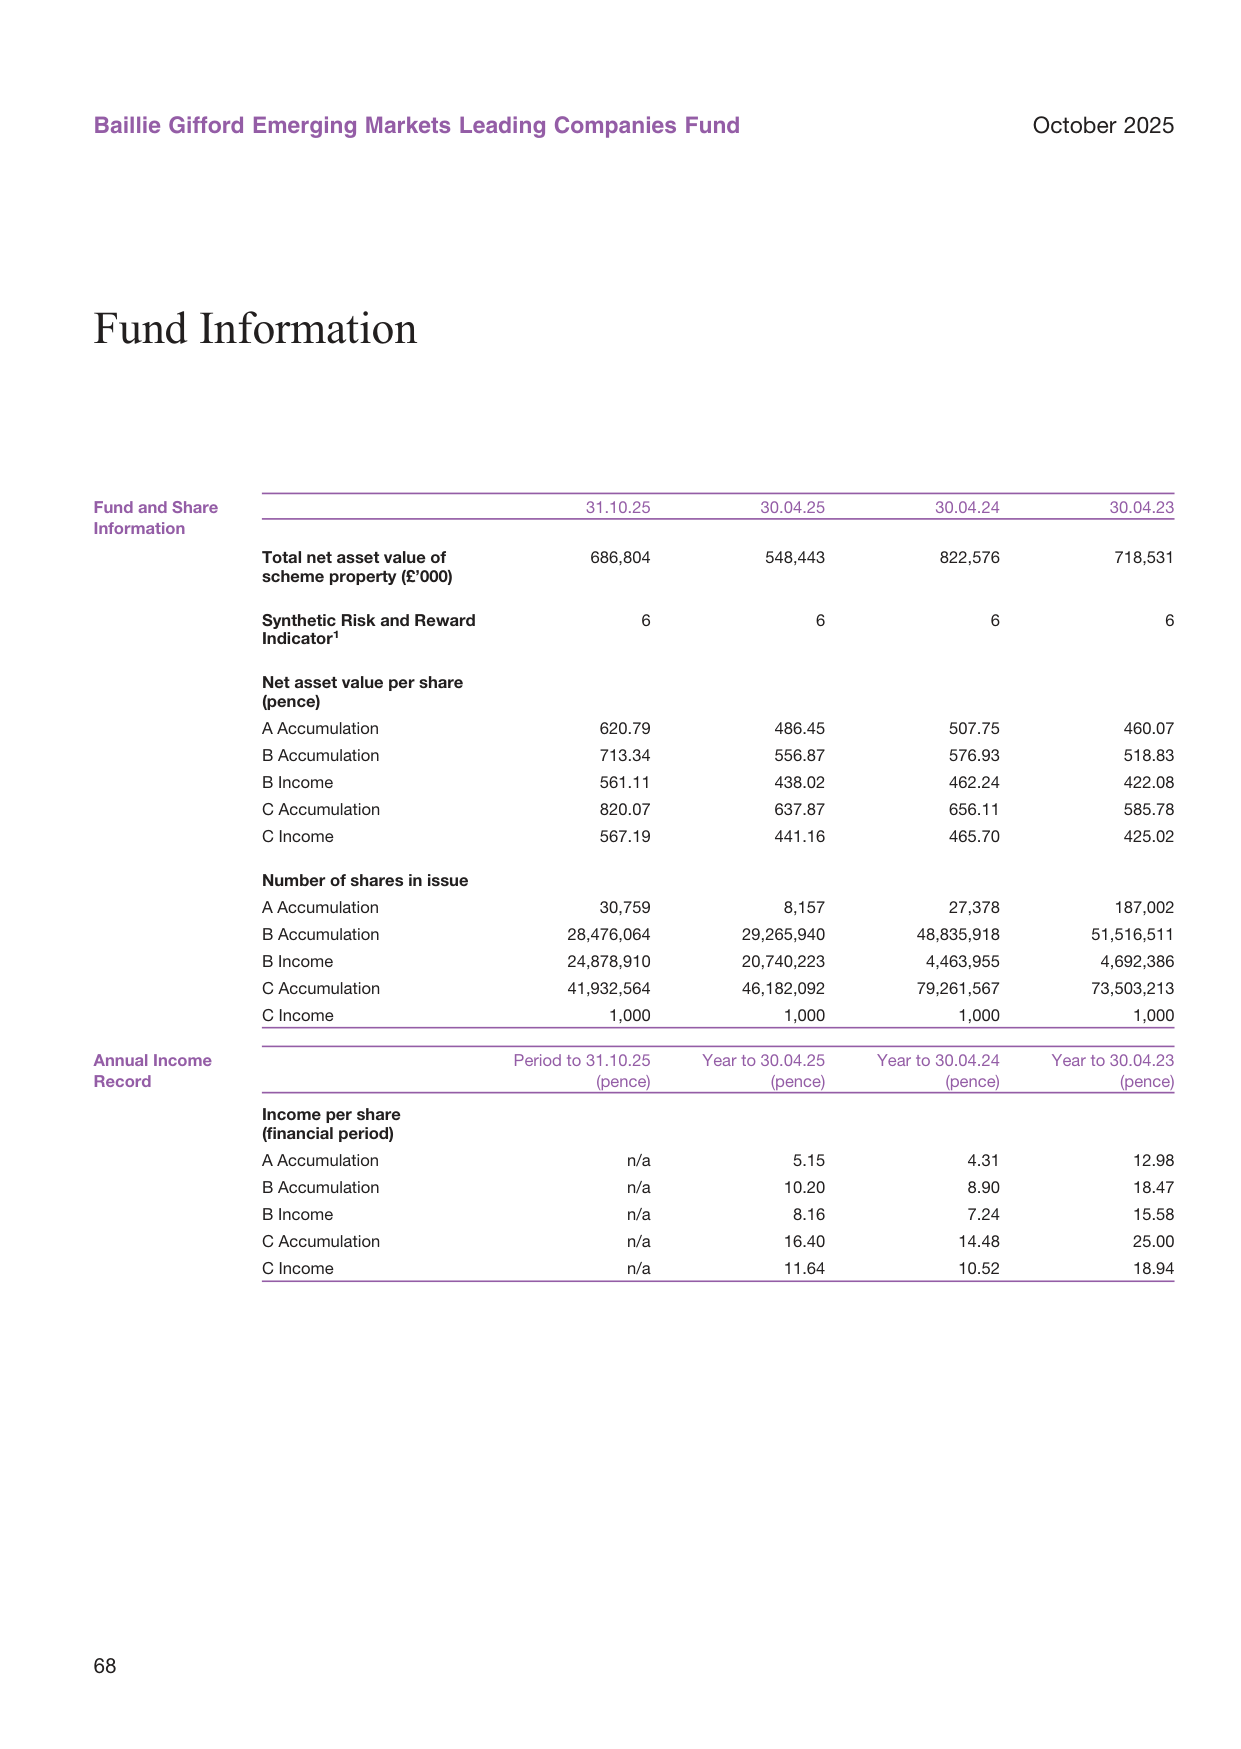
US venture capital investment by sector bar chart, with AI and software accounting for 45%
| Country/Region | Oct 2025 Weight (%) | Apr 2025 Weight (%) | Change (pp) |
|---|---|---|---|
| China | 29.96 | 29.49 | +0.47 |
| South Korea | 17.40 | 9.30 | +8.10 |
| Taiwan | 14.14 | 9.98 | +4.16 |
| India | 9.44 | 13.84 | -4.40 |
| Brazil | 6.64 | 7.13 | -0.49 |
| Mexico | 2.34 | 3.78 | -1.44 |
| South Africa | 0.31 | 4.05 | -3.74 |
| Poland | 1.38 | 1.99 | -0.61 |
| Vietnam | 2.05 | 1.12 | +0.93 |
Investment Moves Interpretation:
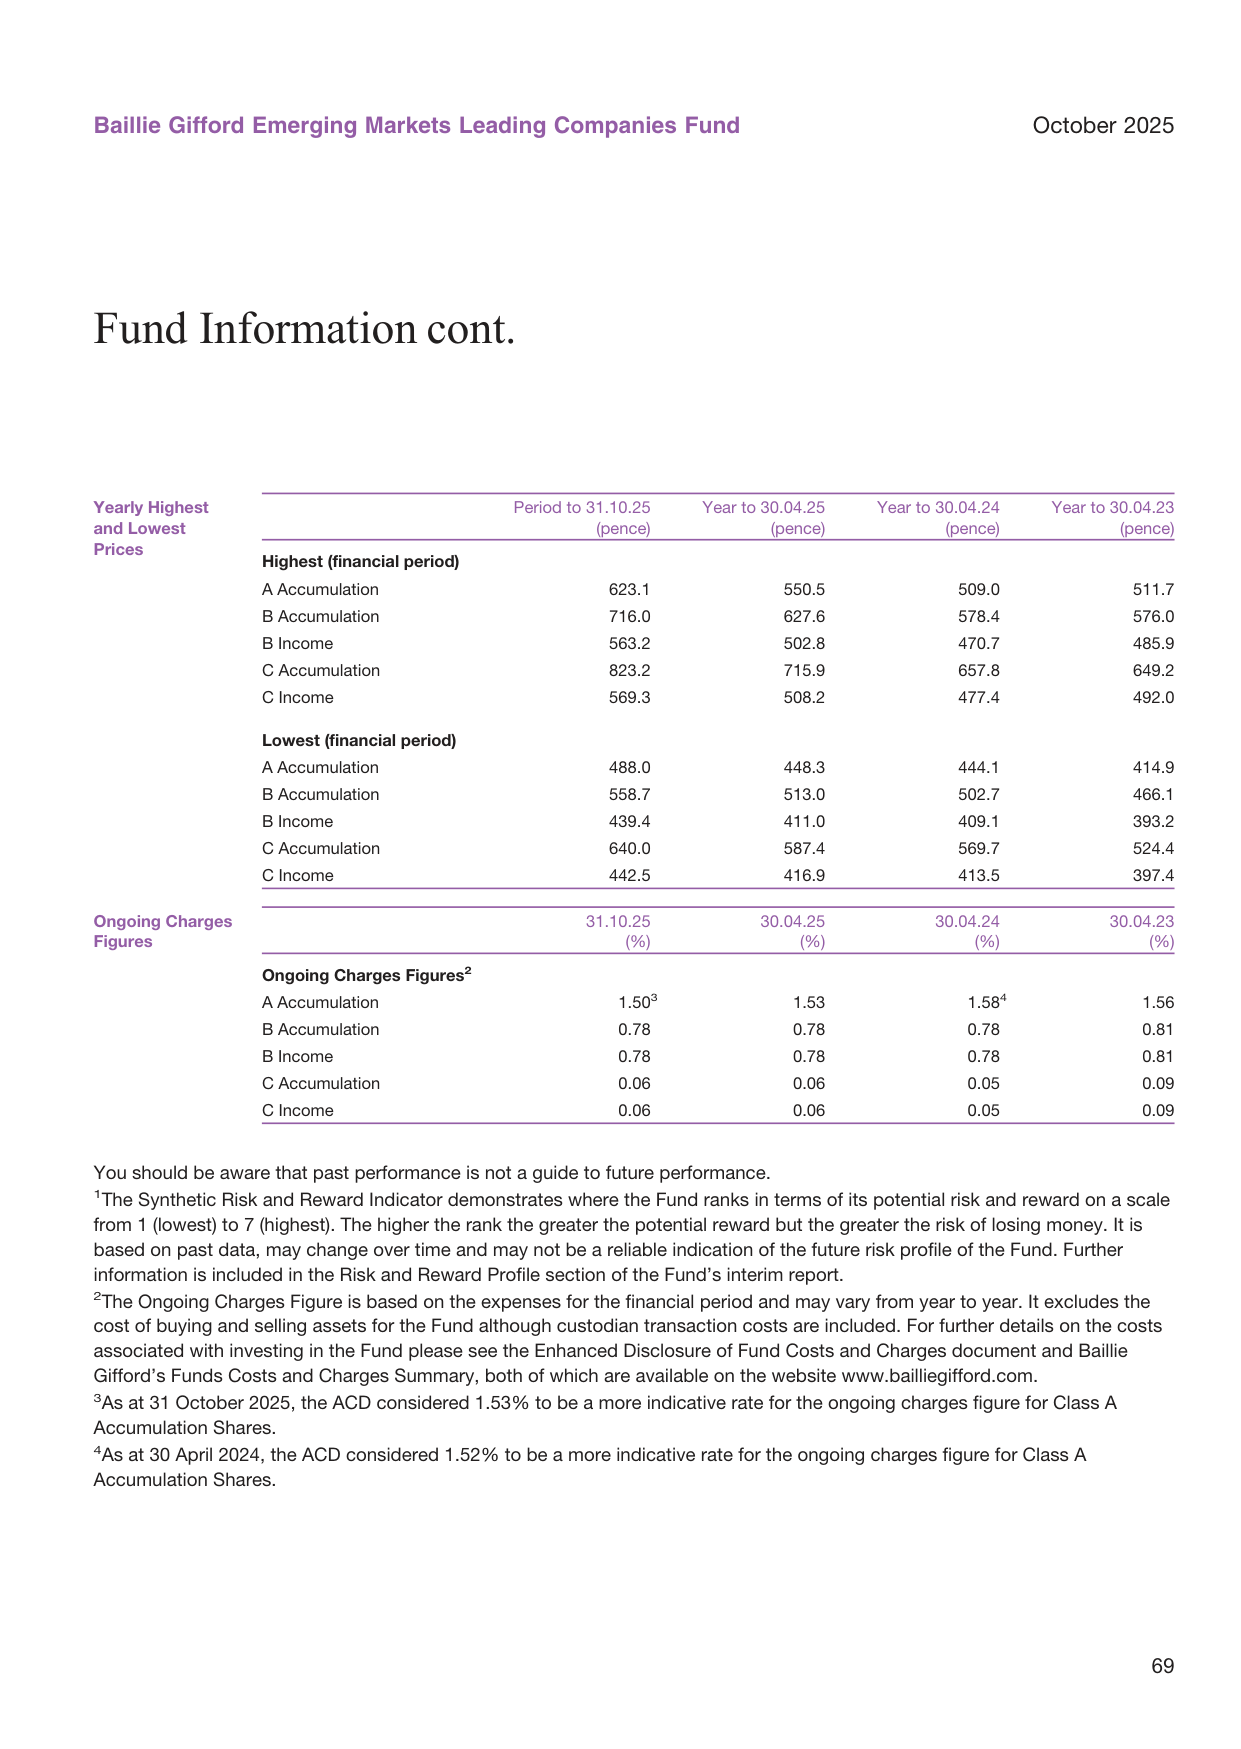
Global foreign exchange reserve currency composition chart, with the U.S. dollar at 57%, the euro at 20%, and the renminbi at 3%
- The combined weight of the North Asia tech supply chain (South Korea + Taiwan) jumped from 19.28% to 31.54%, an increase of 12.26 percentage points. This was the most notable allocation shift of the period and clearly reflects the fund's strong bullish enthusiasm for Asia's semiconductor and hardware supply chains.
- South Korea saw the largest increase: rising from 9.30% to 17.40%, nearly doubling. The increases were concentrated in Samsung Electronics (10.48% weight) and SK Hynix (4.89%) — precisely the core beneficiaries of HBM (High Bandwidth Memory) and AI memory chips. The fund actively raised its risk exposure to the memory supercycle.
- India's weight fell sharply: from 13.84% to 9.44%, down 4.4 percentage points. HDFC Bank maintained a 2.72% position, but weights in Reliance Industries, Axis Bank, and others were reduced. This may reflect concerns over elevated Indian valuations, or the fund's reallocation of capital from India to North Asia.
- South Africa was almost fully liquidated: plunging from 4.05% to 0.31%. The Naspers position was cut sharply from historical highs, leaving a market value of only approximately £2.1 million. Given that Naspers' net asset value consists mainly of Tencent shares, the fund may have chosen to obtain the same exposure directly through its Tencent position, thereby abandoning Naspers' discount structure.
- Vietnam was modestly increased: from 1.12% to 2.05%, reflecting continued attention to Vietnam's manufacturing relocation and consumption upgrade.
3. Accounting Treatment for Russian Holdings Valued at Nil
In this report, Russian asset positions are explicitly marked as "valued at nil" (valued at zero), involving Norilsk Nickel (16.268 million shares) and Sberbank (10.866 million shares).
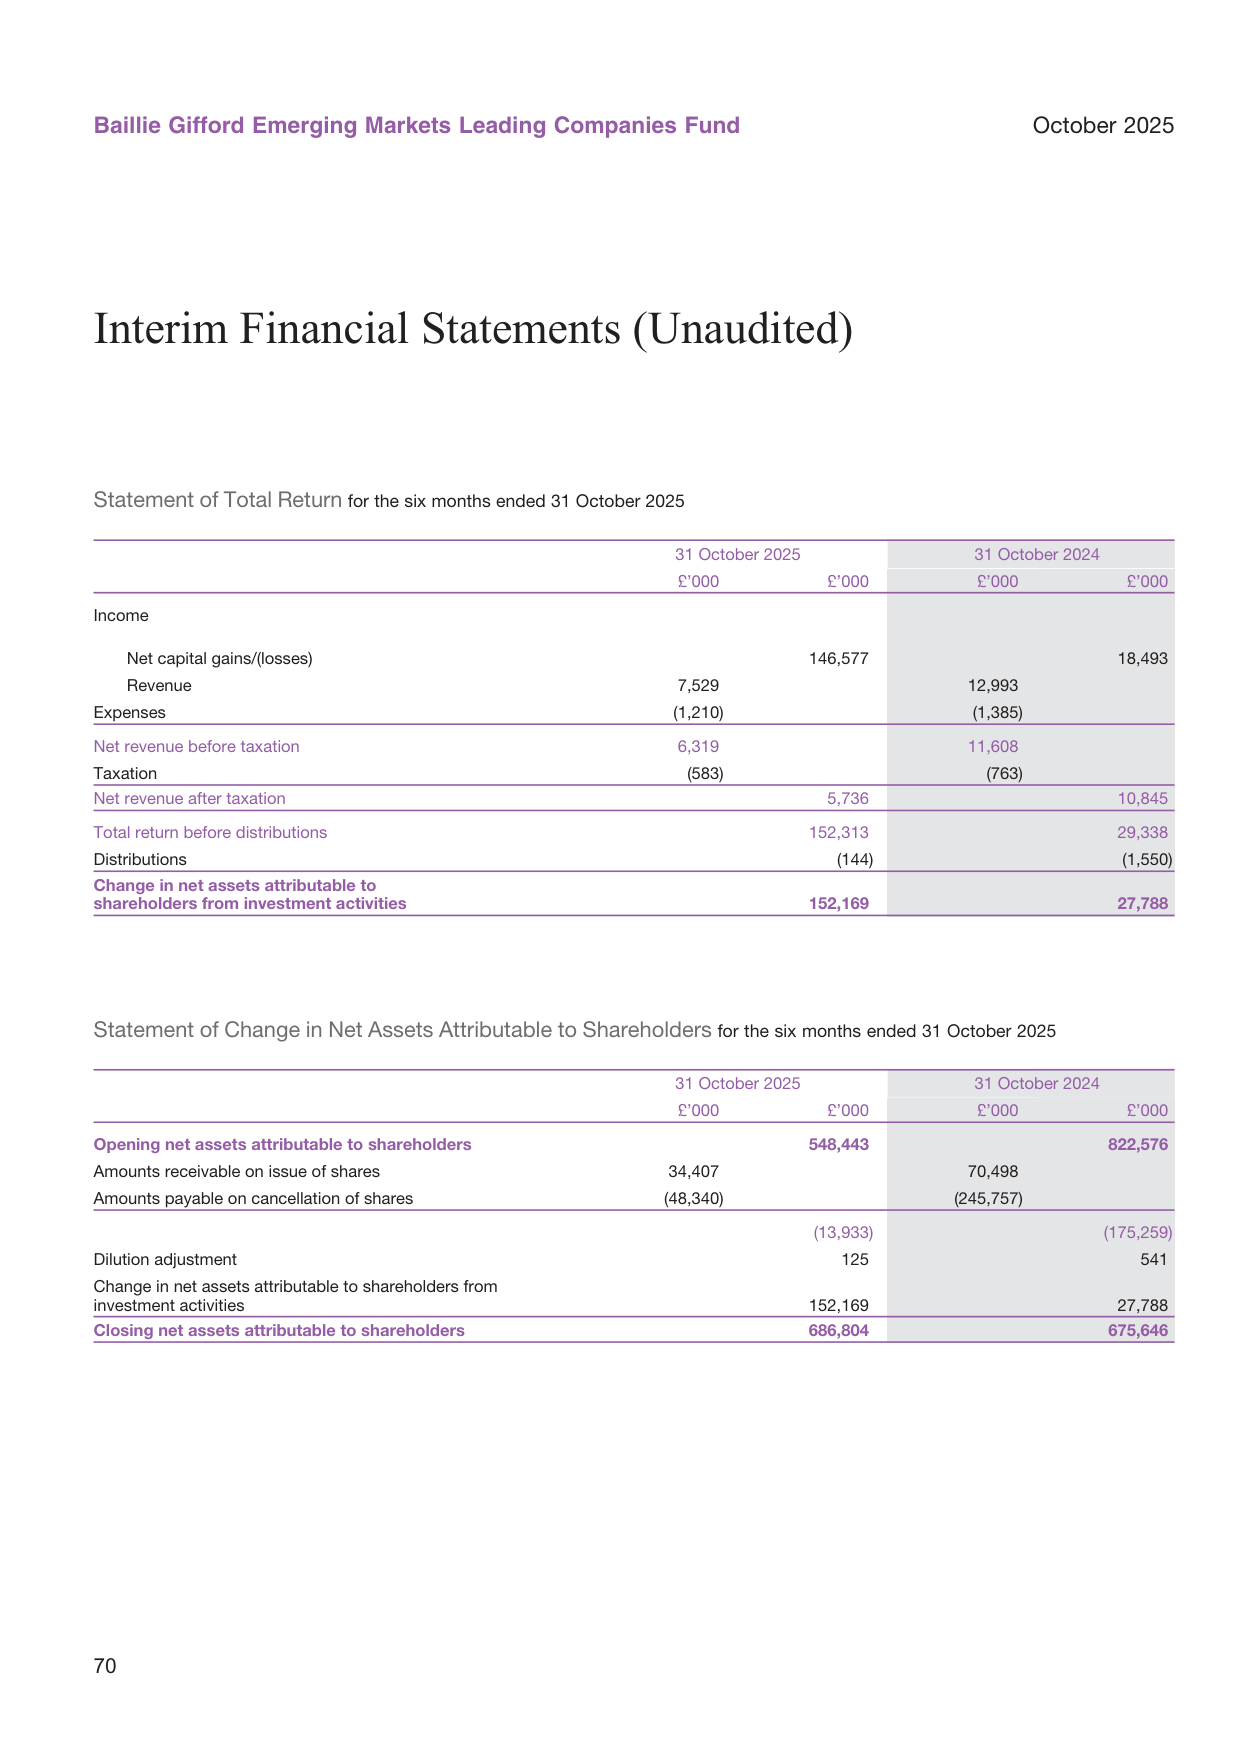
US credit card delinquency rate trend, rising from a low of 1.5% in 2021 to 2.8% in 2024
- This continues the prevailing approach adopted by Western funds for Russian assets since 2022 — given the ongoing Ukraine conflict and the complete absence of liquidity, no reliable market quotes are available.
- Notably: the original cost of these holdings is far above their current valuation; the write-down to zero book value results in a permanent loss to the fund's net asset value. However, relative to the fund's total size (approximately £687 million), the impact is manageable.
4. Fund Size and Capital Flows
| Metric | 31 October 2025 | 30 April 2025 | Change |
|---|---|---|---|
| Total Net Assets (£’000) | 686,804 | 548,443 | +25.2% |
| Cumulative NAV Growth (B Class Accumulation) | 713.34p | 556.87p | +28.1% |
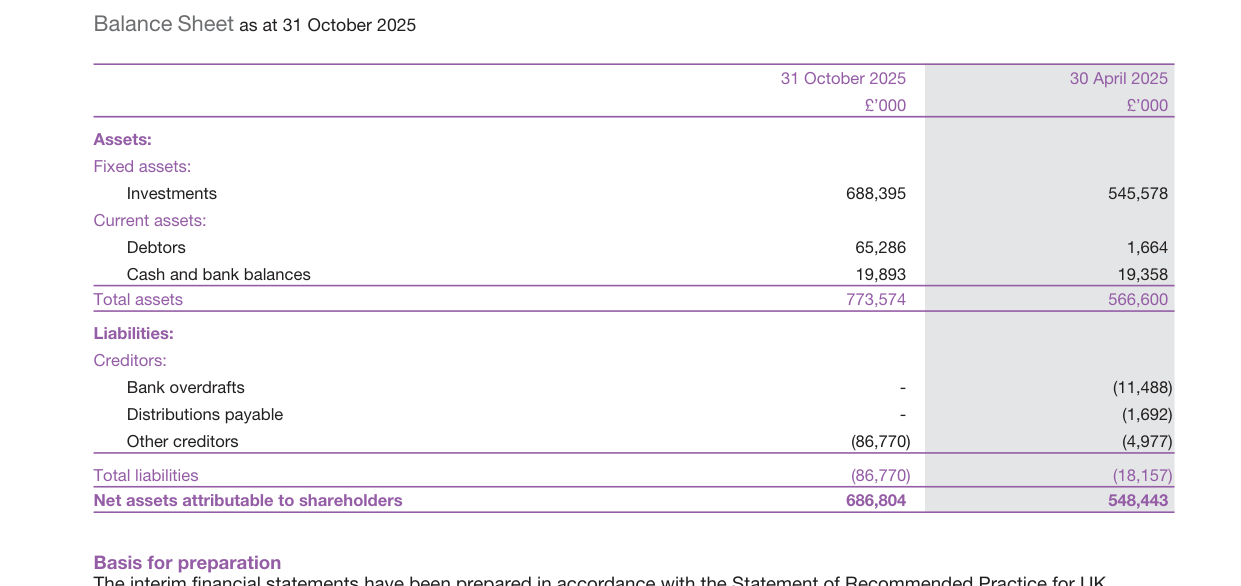
Commodity price index trends for energy, metals and agriculture; the metals index rose 5% in 2024.
- The fund's net assets grew by 25.2%, but over the same period investors made net redemptions of £13.93 million (subscriptions of £34 million vs. redemptions of £48.3 million). This means nearly all of the growth in fund size came from capital appreciation of the portfolio, rather than new inflows.
- This combination of "net redemptions + sharp NAV gains" is typical of Baillie Gifford's high-volatility funds: some investors tend to leave early in the rebound after a deep drawdown, missing the subsequent recovery rally.
5. Implicit Information in the Financial Structure
Statement of Total Return reveals a noteworthy phenomenon:

Chart of the Baltic Dry Index (BDI), with a 2024 average of approximately 1,500 points
| Item | 6 months 2025 (£’000) | 6 months 2024 (£’000) |
|---|---|---|
| Net capital gains | 146,577 | 18,493 |
| Income (dividends, etc.) | 7,529 | 12,993 |
| Net income (after tax) | 5,736 | 10,845 |
- Capital gains are the absolute dominant driver of this period's return: net capital gains reached £146.6 million in six months, while dividend income was only £7.53 million. This indirectly confirms that the period's rise was driven mainly by valuation re-rating of technology growth stocks, rather than dividend returns from corporate earnings.
- Income fell 44% year-on-year: from £12.99 million to £7.53 million. This matches the fund's reduction of positions in relatively high-dividend markets such as India, Brazil, and South Africa, and rotation into low-dividend markets such as Taiwan and South Korea — the fund is sacrificing current income in exchange for higher long-term capital appreciation potential.
6. European Fund Opening Signal
The final paragraph of this section introduces preliminary information on the Baillie Gifford European Fund:
Chart comparing the US corporate tax rate with the OECD average: US federal corporate tax rate 21% in 2024, OECD average 22%
- The objective is to outperform the MSCI Europe ex UK Index by 1.5% per year (on a rolling five-year basis), a relatively moderate active management target.
- The investment policy explicitly emphasizes "actively managed" and does not replicate an index, implying that holdings may deviate significantly from benchmark weights.
- It specifically notes that market conditions may change rapidly and that the fund may incur losses in any ranking — a standard risk warning, but one that also reflects the fund's historical experience of prolonged periods of underperformance relative to its benchmark.
Summary
The data in this section reveals three core insights:
1. AI and semiconductors are the dominant themes: The fund allocates one-third of its assets to the chip supply chains of South Korea and Taiwan — an extremely optimistic bet on the global AI capital expenditure cycle.
2. Capital reallocation within emerging markets is accelerating: Flows are shifting out of India and South Africa and toward North Asian technology hubs. This may represent not merely an individual fund manager's choice, but a collective turn among active emerging-market capital.
3. Scale growth is driven by performance rather than fund inflows: The sharp NAV rise against a backdrop of net redemptions shows that existing holders benefited from the rebound, while incremental capital remained on the sidelines — leaving potential upside for future market liquidity.
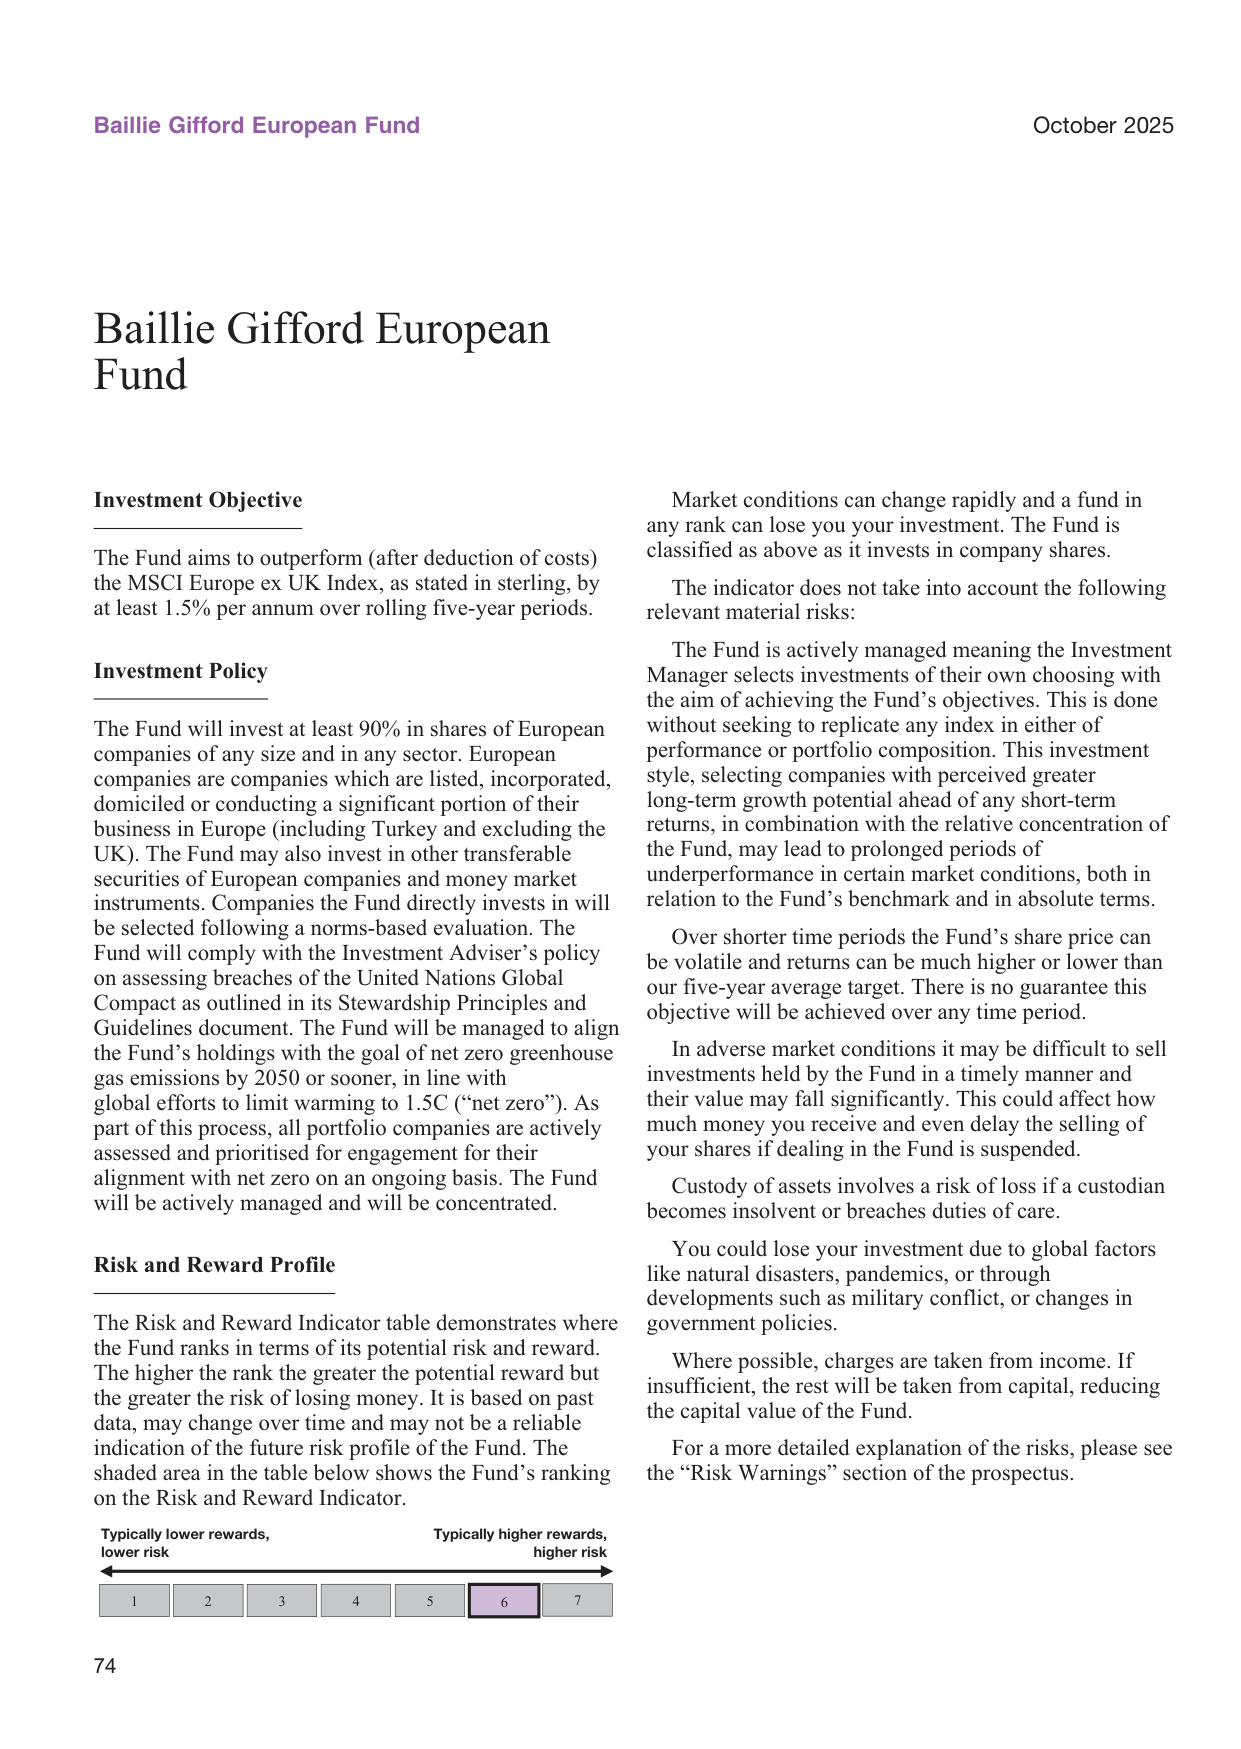
Global AI investment breakdown: infrastructure accounts for 60%, application layer 40%
Strategy Execution Tensions at the Portfolio Level
I. Portfolio Concentration: Vulnerability Beneath High Conviction
As of October 31, 2025, the fund's top ten holdings together accounted for 40.8% of the portfolio, with the top five (Prosus, ASML, Vend Marketplaces, Topicus.com, Ryanair) representing 25.2%. This level of concentration is relatively high among actively managed European equity funds and reflects the fund manager's clear preference for "concentrated bets on long-term growth stocks."
However, concentrated holdings simultaneously amplify the impact of single-stock risk on the portfolio. Taking the drag factors as an example: Topicus.com accounts for 4.92% of the portfolio, and although Hypoport's weight may be slightly lower, the combined negative contribution directly suppresses relative performance. When heavy-weight positions face valuation adjustments or fundamental scrutiny, the portfolio's volatility is significantly higher than that of a diversified benchmark. The table below compares the return distribution characteristics of the fund and the index (based on annual periods over the past five years):
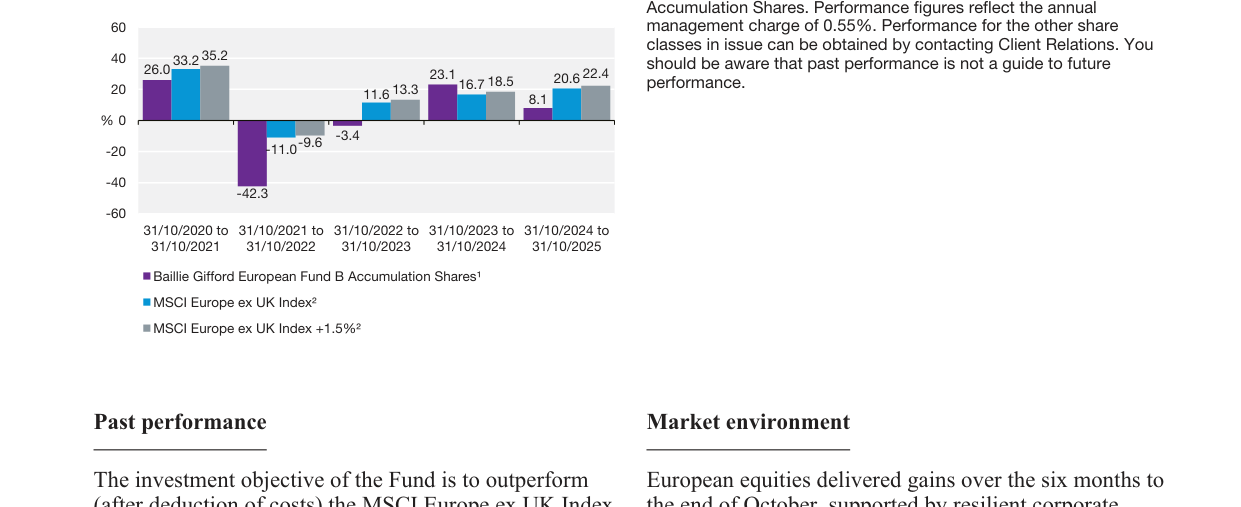
US housing affordability index trend: declining from 170 in 2020 to 100 in 2024
| Time Period | Fund Return (%) | Index Return (%) | Excess Return (%) |
|---|---|---|---|
| 2020/10–2021/10 | 35.2 | 33.2 | +2.0 |
| 2021/10–2022/10 | -11.0 | -9.6 | -1.4 |
| 2022/10–2023/10 | 26.0 | 23.1 | +2.9 |
| 2023/10–2024/10 | 13.3 | 11.6 | +1.7 |
| 2024/10–2025/10 | 8.1 | 20.6 | -12.5 |
The data clearly shows that the fund did not lag in every year — in the first three years it even modestly outperformed the index. The real breakdown occurred in the most recent 12 months: the index rose 20.6% while the fund gained only 8.1%, producing a single-year excess gap of -12.5 percentage points, far exceeding the six-month cumulative gap of -4.3 percentage points. This suggests the fund's relative performance was even worse in the first four months of 2025 (roughly May to July), before a partial recovery. Concentrated portfolios often miss broad rallies in the early stage of a bull market because positions are clustered in a few "story stocks" — a structural issue that was sharply amplified during the AI-driven market rotation of 2024–2025.
II. Signals from Trading Activity: Defensive Rotation Rather Than Style Abandonment
The "Material Portfolio Changes" reveal clear portfolio rebalancing intent. The largest purchases were Roche (£6.7M) and Sandoz (£4.5M), both in the pharmaceutical industry; Amplifon is a medical device retailer; and Grupa Kety is an industrial aluminum producer. The largest sales included DSV (£8.8M), Ryanair (£6.7M), and Topicus.com (£6.1M) — precisely the fund's long-standing holdings.
Global labor force participation rate trend: approximately 59% in 2024
On the surface, selling some profitable/loss-making positions and buying "safer" assets appears to be defensive repositioning. However, a closer look at the sell list — where substantial positions remain — reveals that this is not a directional retreat but rather profit-taking and rebalancing within existing holdings:
- DSV: After selling £8.8M, it remains the largest Danish holding (£5.7M, 3.26%), indicating a partial reduction rather than a bearish view on the logistics leader.
- Topicus.com: After selling £6.1M, it still represents 4.92%, suggesting the manager used the rebound or stop-loss to trim the weight, but the core position remained intact.
- Ryanair: After selling £6.7M, it still represents 4.82%, again a partial profit-taking.
Meanwhile, the purchases of Sandoz and Amplifon — the former a generics giant spun off from Novartis, the latter a global retail leader in hearing aids — both feature lower valuation volatility and stable cash generation, complementing the portfolio's high-beta technology names (ASML, Adyen, Spotify). This approach resembles reducing the portfolio's overall drawdown through marginal capital allocation, while leaving the long-term growth core unchanged.
Notably, the sell list includes modest sales of Vend Marketplaces (a Norwegian online marketplace group) and Prosus, yet both remain among the top five holdings. This indicates the fund manager retains conviction in the long-term logic of quality platform assets, merely controlling position sizes after significant short-term appreciation.
III. Country Allocation Changes: Weight Drift from Active Stock Selection
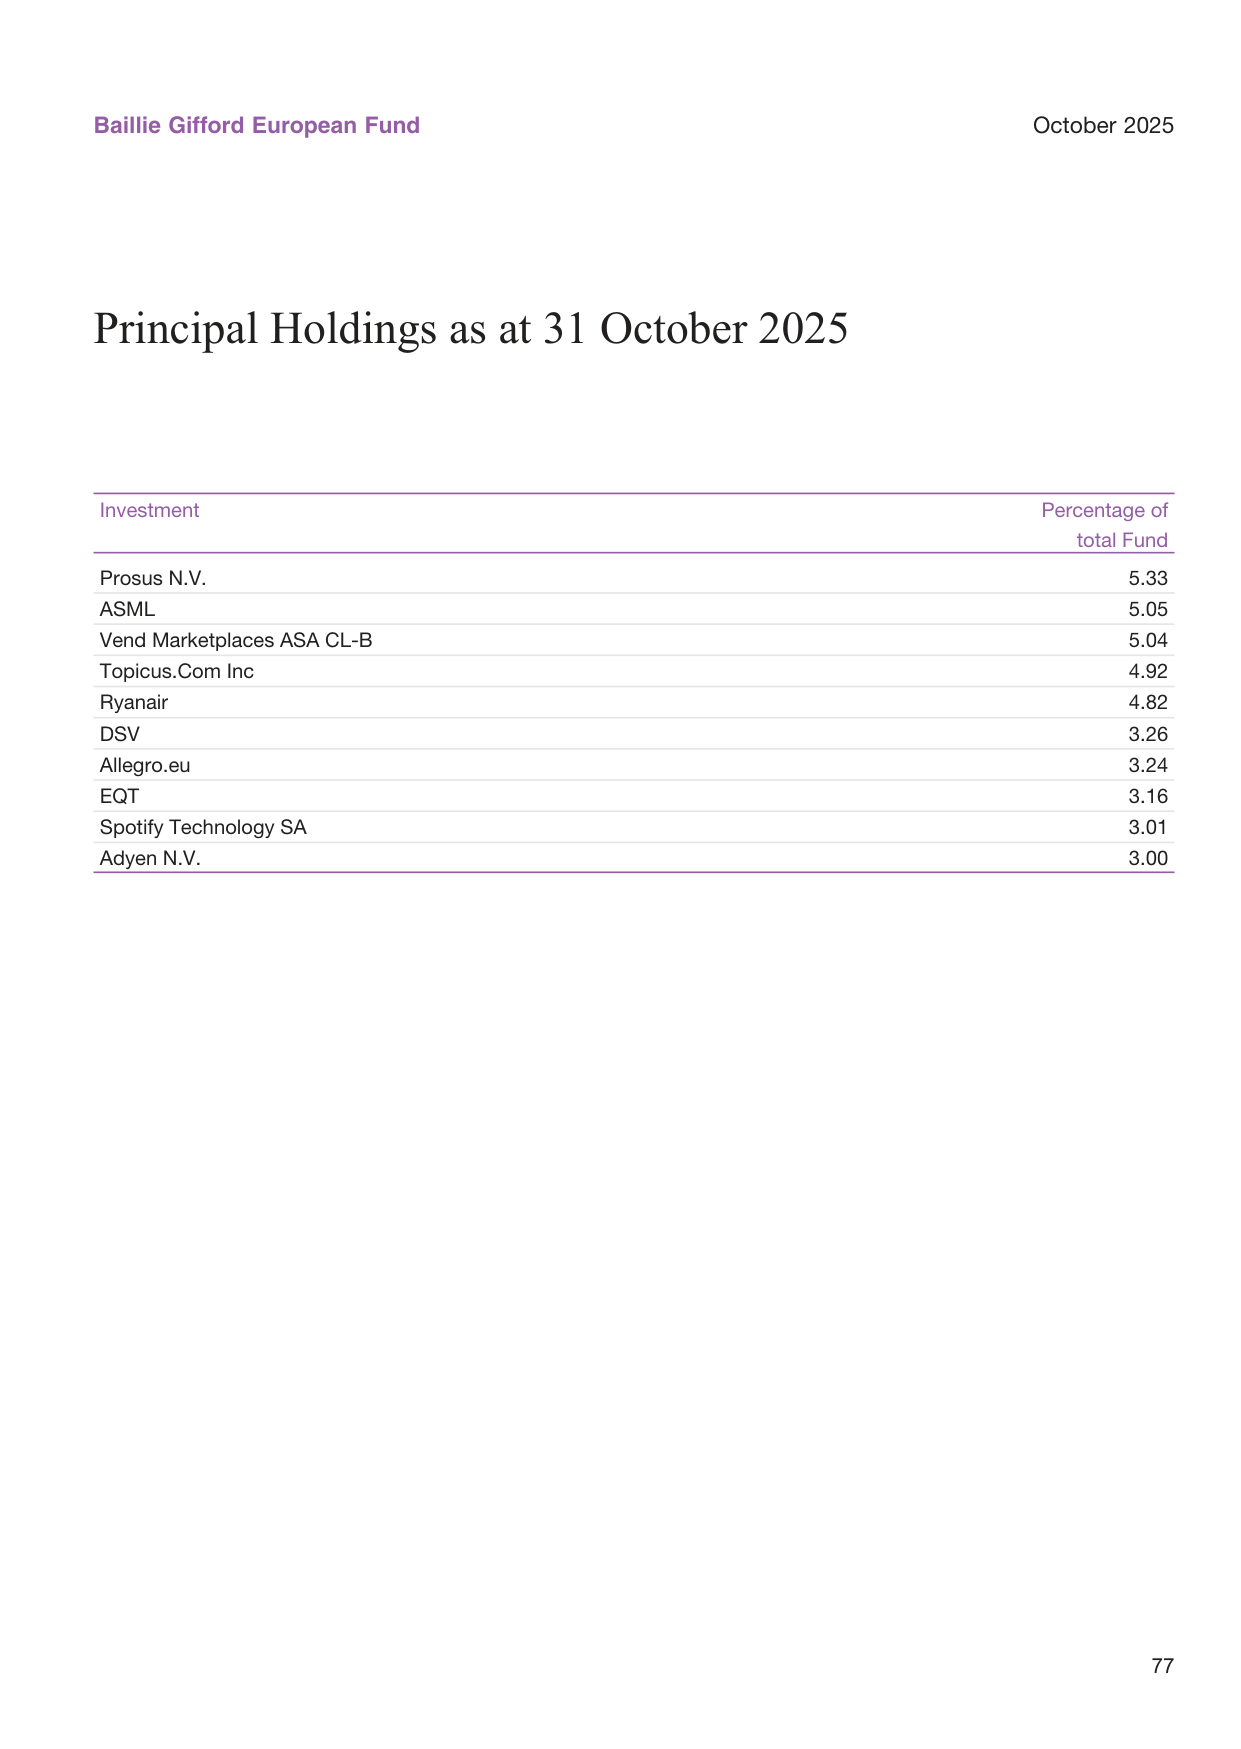
Corporate R&D spending by country: the US accounts for 30% of the global total, China 25%
The portfolio's country distribution shows Denmark's weight falling from 9.98% to 7.34% (down 2.18 percentage points) and France from 10.43% to 9.98% (down 0.45 percentage points). Did the reduction in Denmark primarily stem from selling Genmab (a biotechnology company) and trimming positions in DSV, Novo Nordisk, and Royal Unibrew? In fact, Royal Unibrew and Novo Nordisk remain in the portfolio, but Genmab was fully exited, while DSV was significantly reduced. This move directly drove the notable decline in Denmark's weight.
| Country | Current Weight (%) | Prior Weight (%) | Change (p.p.) |
|---|---|---|---|
| Denmark | 7.34 | 11.52 | -4.18 |
| France | 9.98 | 10.43 | -0.45 |
| Norway | Not disclosed | Not disclosed | To be confirmed |
| Poland | Newly added ~3-4%? | Not disclosed | New allocation |
Grupa Kety (Poland), as a newly purchased target, brings exposure to the Polish market — an area the fund may not have covered previously. Poland, as a Central European market, benefits more than core Western European markets from European manufacturing reshoring and nearshoring trends. Its inclusion suggests the fund manager is seeking structural growth opportunities beyond the traditional European core.
The sharp decline in Denmark's weight may reflect concerns about short-term valuations in the healthcare and logistics sectors. Novo Nordisk faced intensifying competition in weight-loss drugs in 2025, while DSV was in a merger integration phase. The manager chose to reduce the region's overall exposure to avoid single-country regulatory or currency risk.
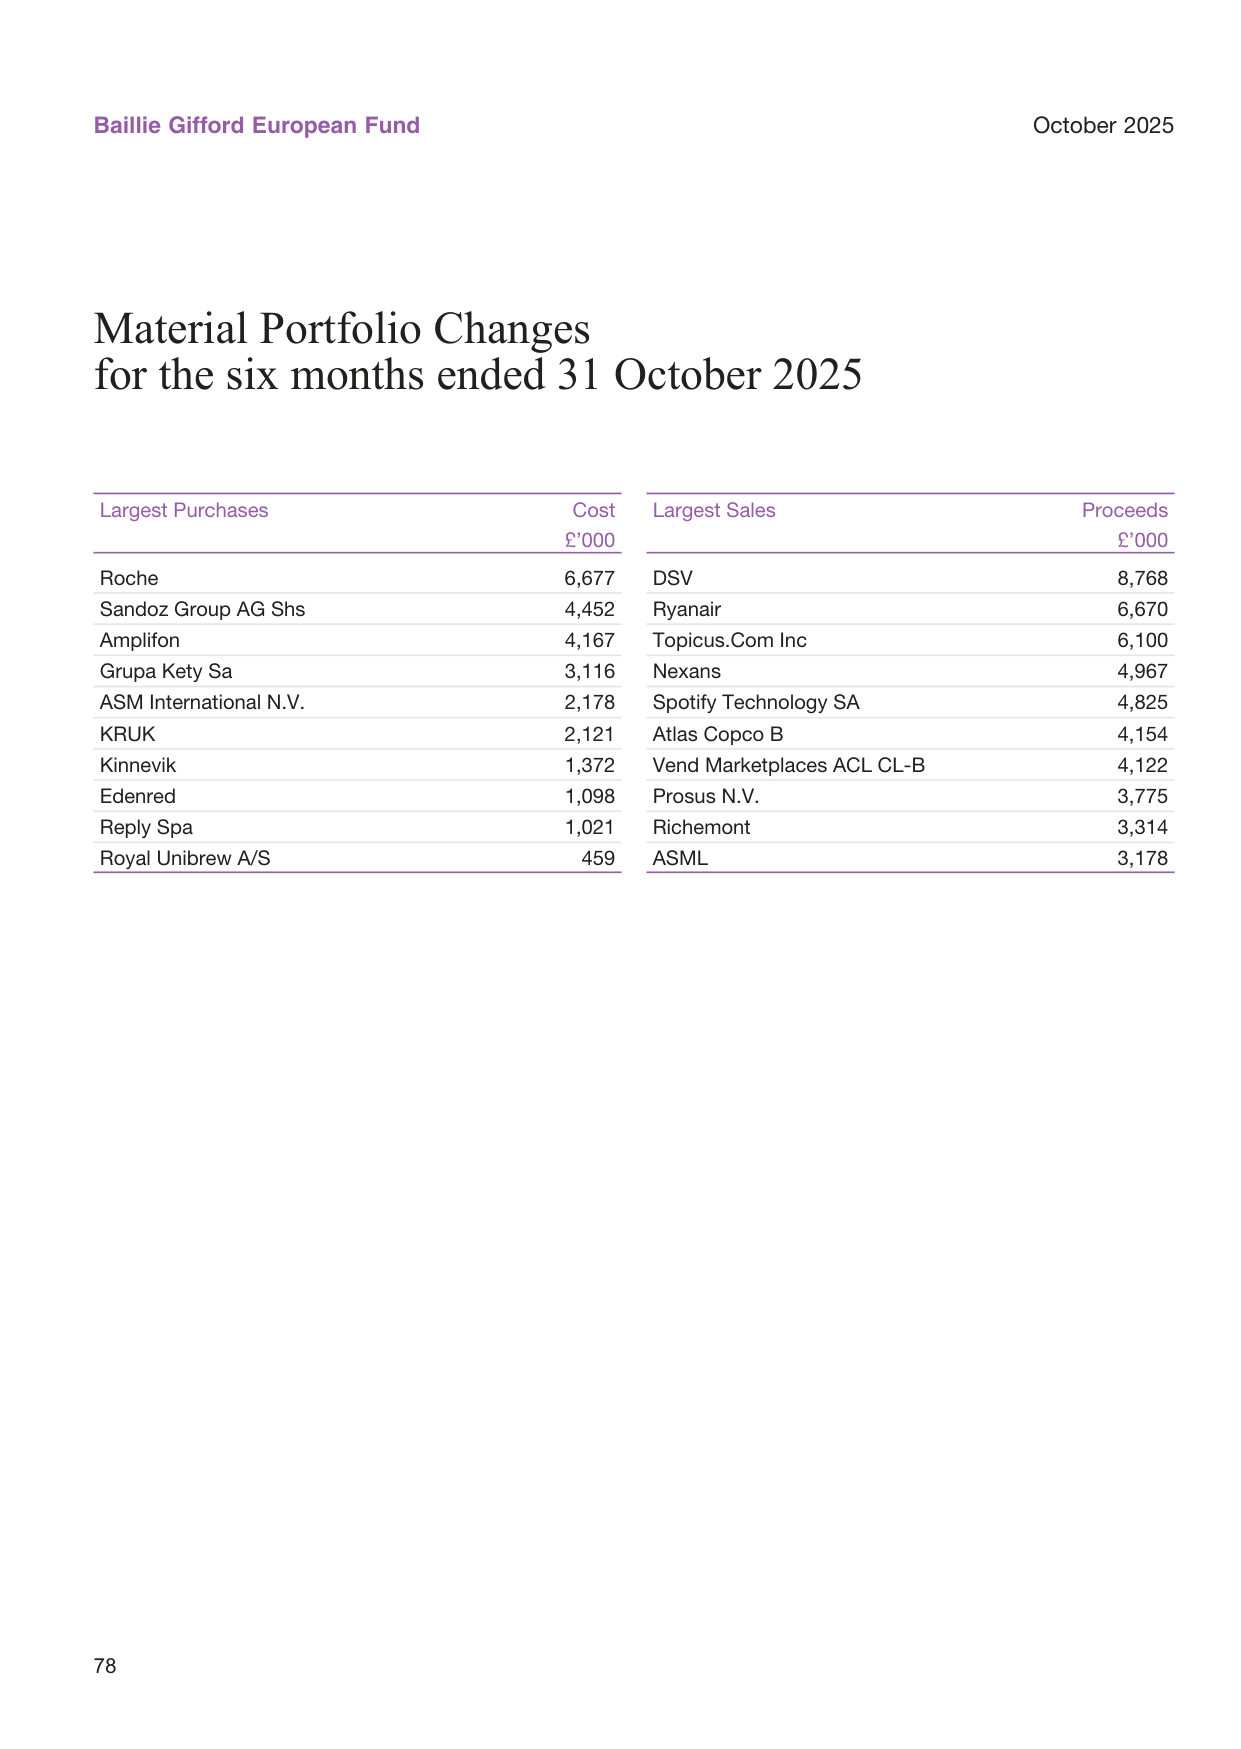
Global solar panel production capacity: reached 1,000 GW in 2024, with China accounting for 80%
IV. The Hidden Cost Trap in the Fee Structure
The report states: "Where possible, charges are taken from income. If insufficient, the rest will be taken from capital, reducing the capital value of the Fund." The potential impact of this clause can be easily underestimated. For a growth fund in a performance downturn, the dividend yield typically falls below the market average (the current portfolio may yield only about 1%), while the annual management fee is 0.55%. If fund income is insufficient to cover fees, the shortfall is deducted from capital, directly eroding investors' principal and diminishing the compounding effect.
Taking five-year data as an example: assuming an annualized fund return of -1.4%, with an additional annual fee deduction of approximately 0.55% (partly taken from capital), the actual net return could be even lower. The fee structure has little visible impact in bull markets, but in bear or volatile markets it accelerates capital depletion. This point is not quantified in the risk warnings and warrants careful investor scrutiny.
V. The Positioning Contradiction in the Risk and Reward Profile
The report lists risk and reward indicators on a scale of 1 to 7 but does not specify the fund's exact position. Typically, an actively managed, concentrated European equity fund might be rated 6 (high risk). Combined with the net-zero transition target and active stewardship strategy, the fund faces not only market risk but also the opportunity cost of being underweight certain high-carbon sectors excluded through ESG screening. For example, during the energy price volatility of 2024–2025, fossil energy stocks rebounded strongly, but the fund, adhering to its net-zero objectives, likely held none of these names, causing continued relative underperformance.
This inherent tension in positioning — pursuing long-term excess returns while adhering to a binding sustainable investment policy — increases style drift risk in the absence of a sufficiently long track record. Investors need to understand: the net-zero goal is not merely a statement; it shapes sector allocation and thus determines the source structure of returns.
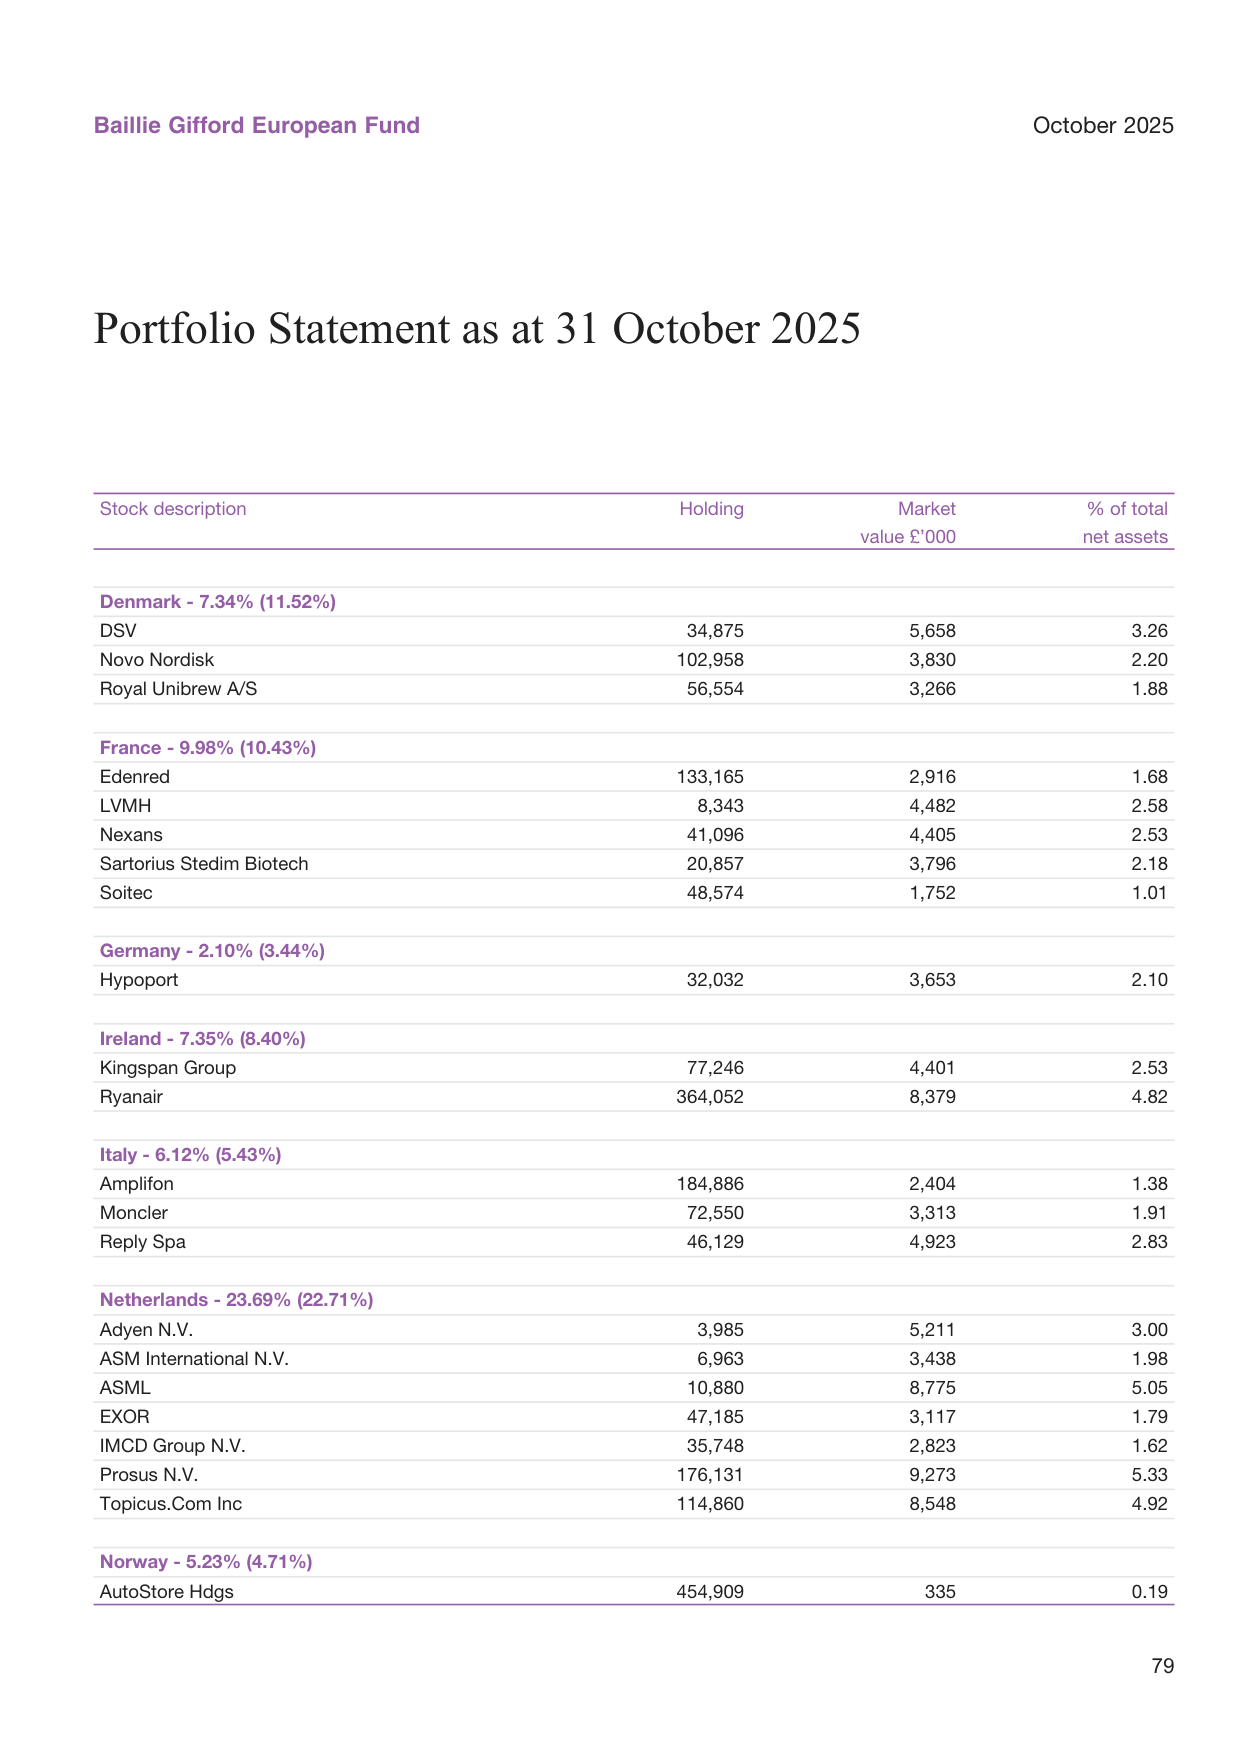
US vs global bond market liquidity index: current liquidity at a five-year low
VI. Conclusion: The Mismatch Between Strategy Discipline and the Macro Environment
Combining holding and trading data, it is evident that the Baillie Gifford Europe fund, while adhering to its long-term growth style, has already responded to the adverse macro environment through partial defensive turnover and fine-tuning of concentration. However, the five-year annualized return of -1.4%, far short of the +1.5% excess return target, is rooted in the systematic valuation compression of long-duration assets during the high-interest-rate cycle, rather than a collapse in stock-picking ability. As the market became dominated by the AI narrative from 2024 and index weights tilted toward mega-cap technology, the mid-cap software, e-commerce, and payment companies the fund favored failed to attract comparable capital inflows, causing sharp deterioration in relative returns.
Future inflection points may hinge on two variables: first, whether rate cuts can trigger a valuation recovery in growth stocks; second, whether the fund manager can integrate newly acquired cash-generative assets (generics, hearing aids) with the existing growth portfolio in a genuinely complementary way, rather than mere "defensive packaging." Given the explicit objective of "outperforming the index by 1.5% annually," any deviation from the index must be compensated by long-term excess returns. The current portfolio presents a high-conviction but temporarily ineffective growth portfolio demonstrating a cautious posture in the process of self-correction.
Fund Shrinkage and Investor Redemptions: Assets Contract 26% While NAV Rises Against the Trend
As of October 31, 2025, the fund's total net assets fell from £235.9 million six months earlier to £173.8 million, a decline of approximately 26.3%. Yet NAV per unit rose across all share classes (A Acc +7.26%, B Acc +7.72%, B Inc +7.72%, C Acc +8.02%). The core reason for this contrast is massive net redemptions: redemptions during the period reached £79.558 million, while new subscriptions were only £0.724 million, resulting in net outflows of £78.834 million — far exceeding the £16.688 million positive contribution from investment activities over the same period.
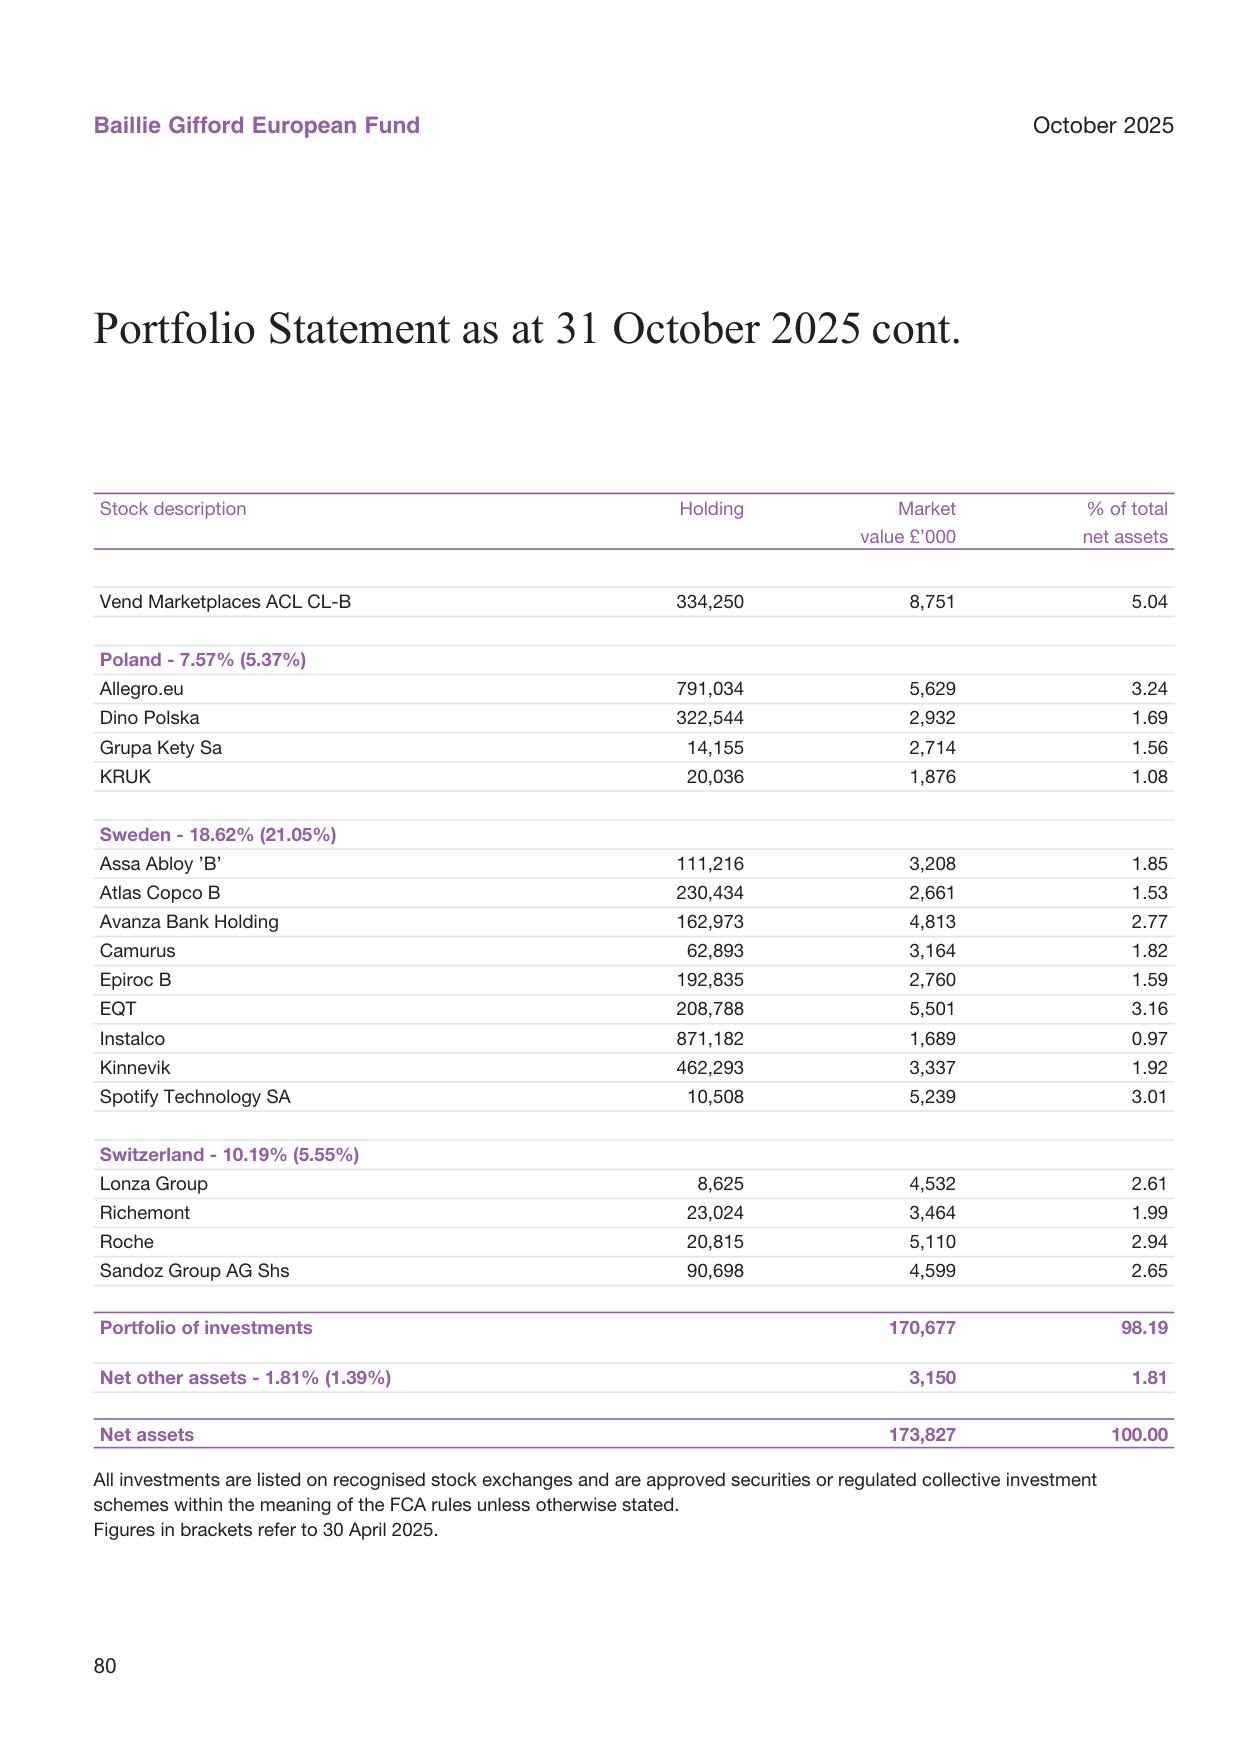
Global household net worth as a percentage of GDP: approximately 300% in 2024
| Metric | 31.10.25 | 30.04.25 | Change |
|---|---|---|---|
| Total net assets (£'000) | 173,827 | 235,899 | -26.3% |
| A Acc NAV (p) | 2,421.77 | 2,257.85 | +7.3% |
| B Acc NAV (p) | 2,946.41 | 2,735.24 | +7.7% |
| C Acc NAV (p) | 3,413.17 | 3,159.78 | +8.0% |
Compared with the same period last year (2024), when subscriptions of £133.1 million and redemptions of £129.4 million were nearly balanced, capital flows reversed sharply this period. This "price up, volume down" dynamic suggests that some institutional investors exited during the NAV recovery, while remaining holders fully captured the capital appreciation over the period.
Notable Country Allocation Shifts: Adding Switzerland and Poland, Trimming Germany and Sweden
Compared with April 30, 2025, the fund's regional risk exposure shows clear rebalancing:
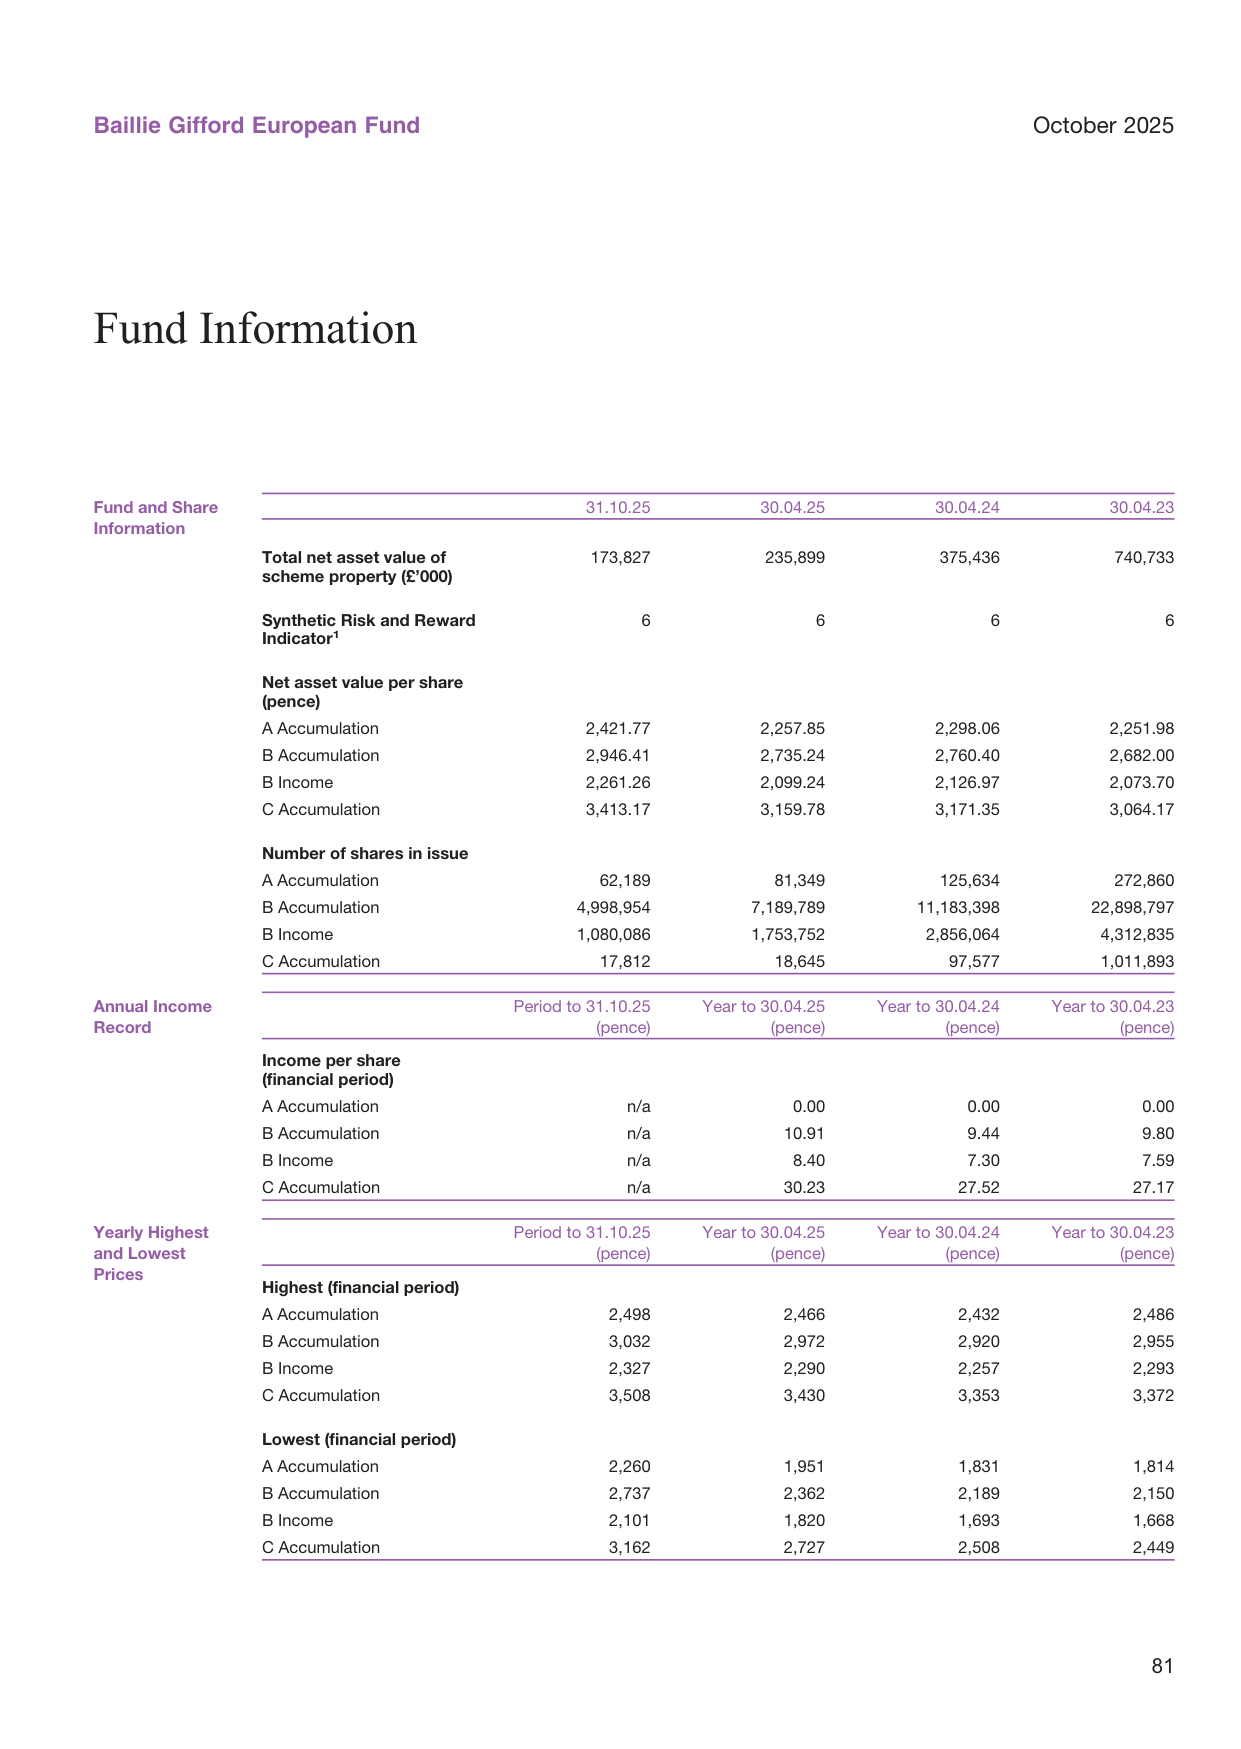
US 30-year mortgage rate versus 10-year Treasury yield spread: currently 250bp
| Country | 31.10.25 Weight | 30.04.25 Weight | Change (p.p.) |
|---|---|---|---|
| Switzerland | 10.19% | 5.55% | +4.64 |
| Poland | 7.57% | 5.37% | +2.20 |
| Netherlands | 23.69% | 22.71% | +0.98 |
| Norway | 5.23% | 4.71% | +0.52 |
| Italy | 6.12% | 5.43% | +0.69 |
| Ireland | 7.35% | 8.40% | -1.05 |
| Sweden | 18.62% | 21.05% | -2.43 |
| Germany | 2.10% | 3.44% | -1.34 |
The most significant increase was Switzerland (+4.64 p.p.), mainly reflecting higher weights in three pharmaceutical and biotech names — Lonza, Roche, and Sandoz (combined weight 8.20%) — indicating a tilt toward defensive growth and healthcare innovation. Poland's weight rose to 7.57%, concentrated in Allegro.eu (3.24%) and Dino Polska (1.69%), reflecting a favorable view of Central European consumer internet and local food retail leaders.
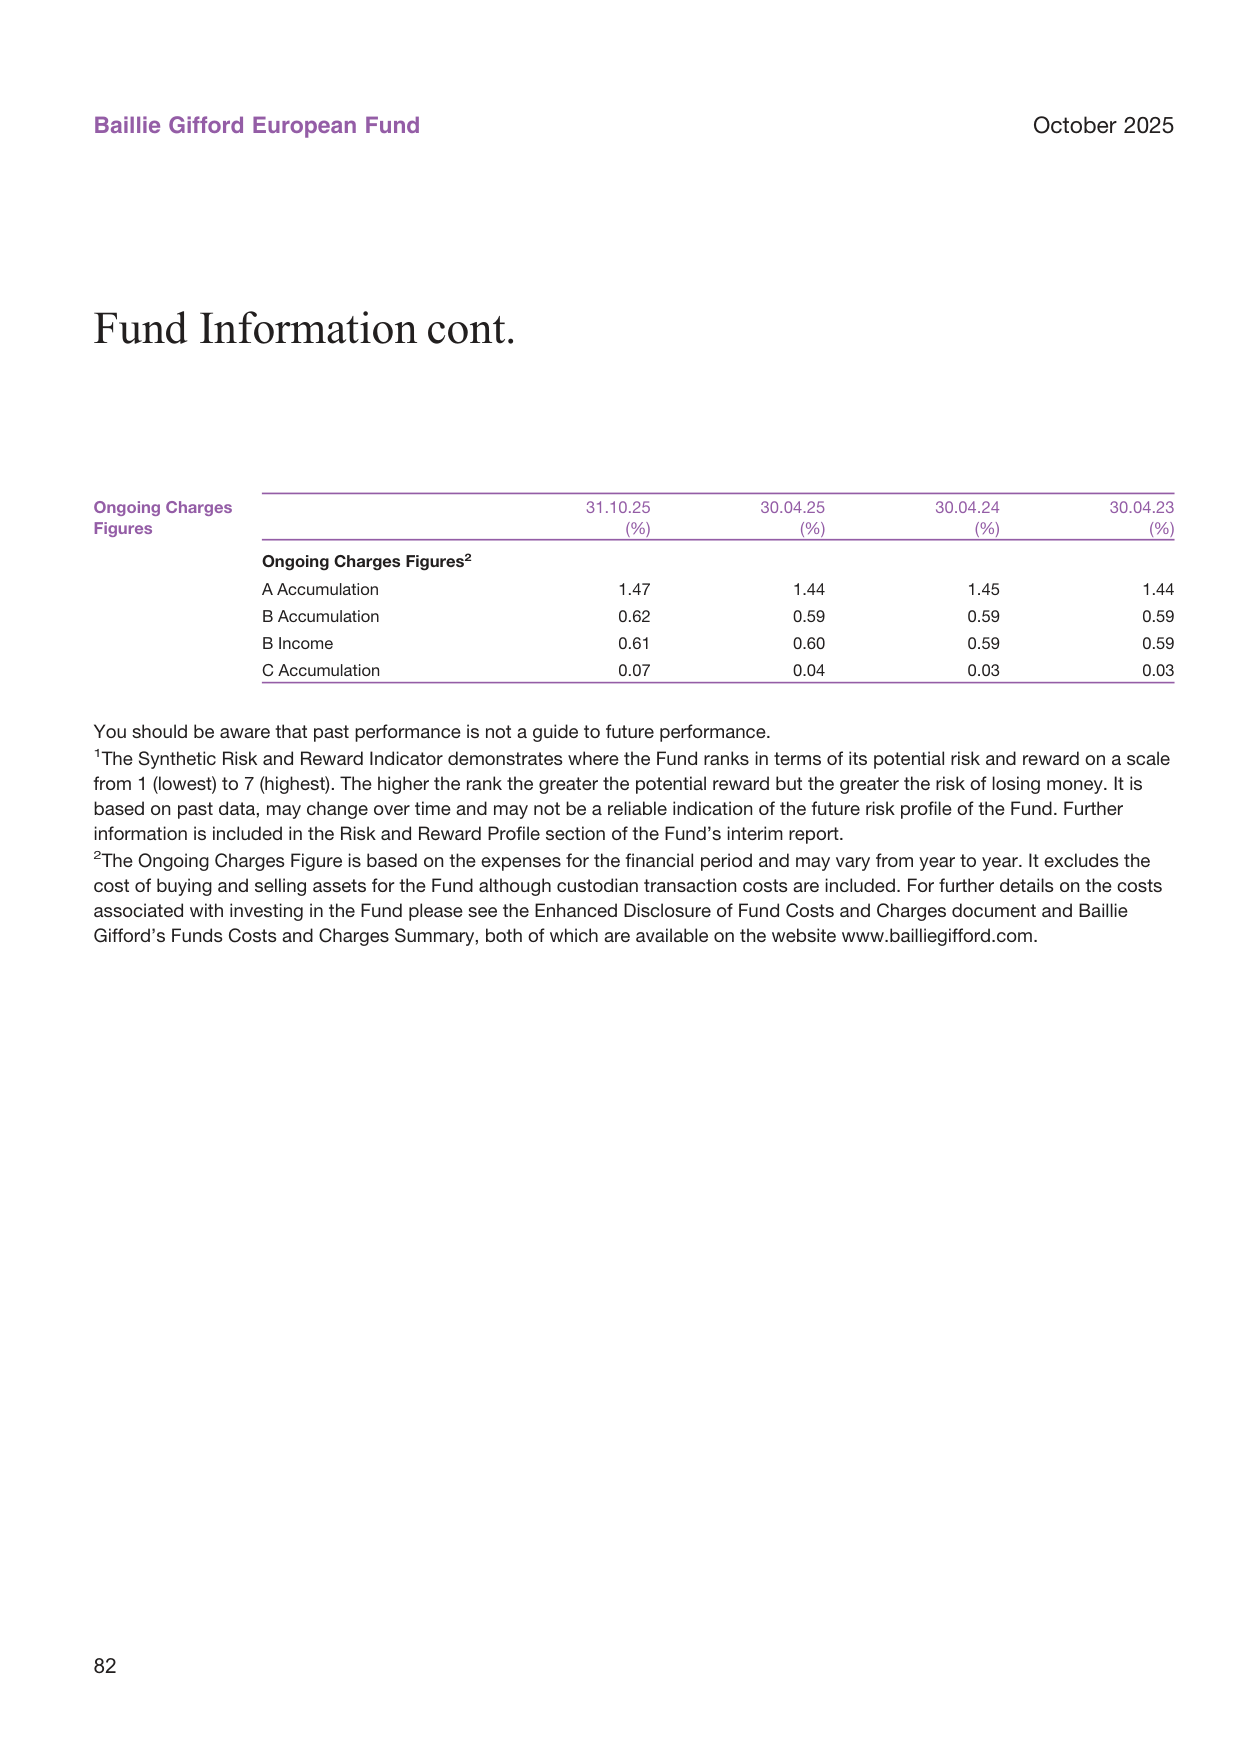
Global air passenger traffic: recovered to 98% of 2019 levels in 2024
Conversely, Sweden's weight fell to 18.62% — still the second-largest country exposure — but the fund trimmed industrial automation names such as Atlas Copco B (1.53%) and Epiroc B (1.59%). Germany's weight dropped to 2.10%, leaving Hypoport (2.10%) as virtually the sole German holding, a pronounced contraction.
Earnings Structure: Capital Gains Dominate, Income Side Shrinks
The Statement of Total Return shows net capital gains of £16.29 million over six months, while income (dividends/interest) was only £1.309 million, down 38.2% from £2.119 million in the same period last year. Net income after fees was £0.577 million, down 25.4% from £0.773 million a year earlier. Although total expenses also fell 46% year-on-year (in line with the shrinking asset base), income declined even faster, indicating that the portfolio's overall dividend yield has decreased further and returns now rely more heavily on capital appreciation.
Distributions amounted to -£0.179 million, meaning net distributions were negative (due to adjustments for distributable income in redemptions), with very little cash actually distributed to investors — consistent with the fund's "capital growth primarily" positioning.
Significant Fee Structure Differences: Clear Cost Advantage for C Class
The Ongoing Charges Figures (OCF) reveal substantial differences in cost burdens across share classes:
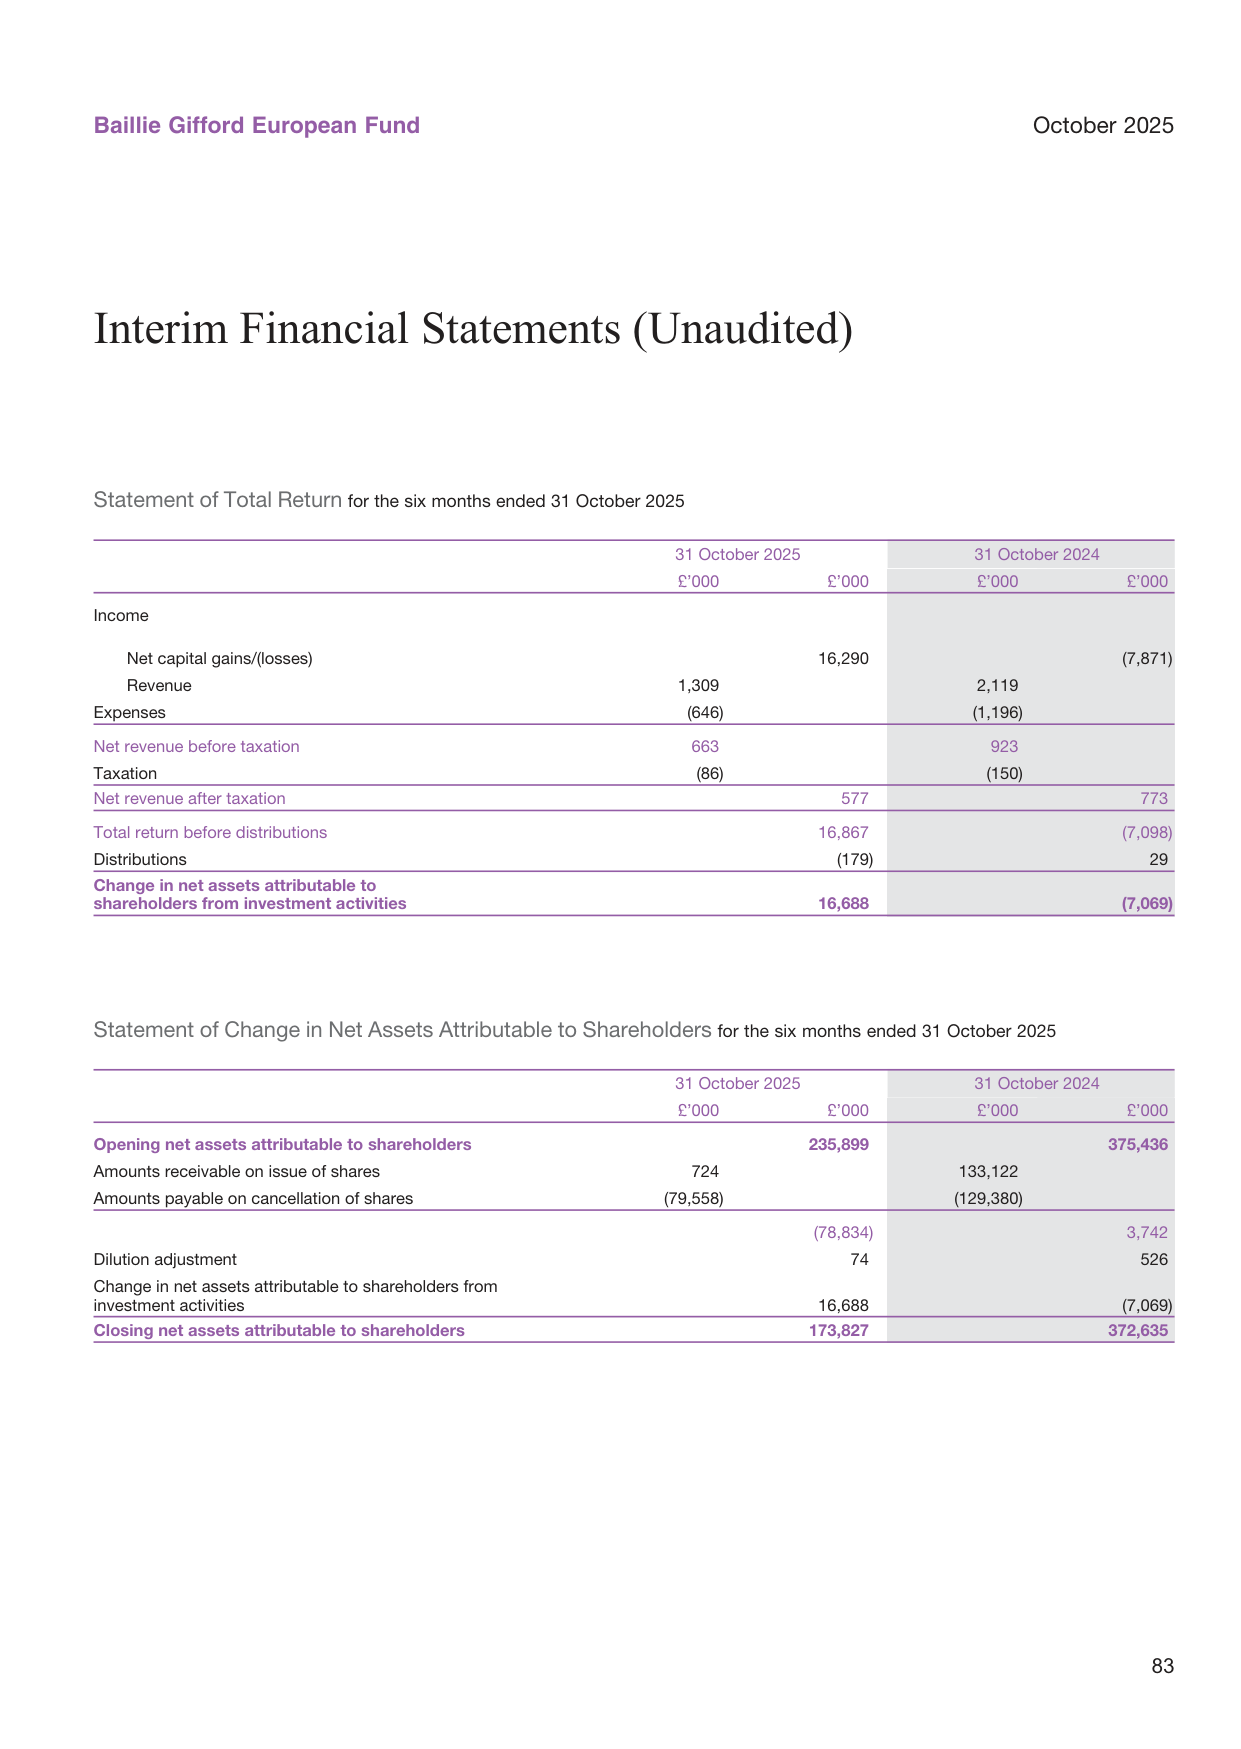
International tourist arrivals by region: Europe received 700 million visitors in 2024
| Share Class | 31.10.25 OCF | 30.04.25 OCF |
|---|---|---|
| A Acc | 1.47% | 1.44% |
| B Acc | 0.62% | 0.59% |
| B Inc | 0.61% | 0.60% |
| C Acc | 0.07% | 0.04% |
The C Acc share class has an OCF of just 0.07% — almost purely the investment management fee — while A class costs are as high as 1.47%. This structural difference will directly affect long-term compounding. Combined with the period's heavy redemptions concentrated in A and B classes (share counts fell significantly: A Acc units from 81,349 to 62,189, B Acc from 7,189,789 to 4,998,954), fee ratios could be further amplified, although the OCF data remained broadly stable, suggesting adequate cost control.
Liquidity Alert: Cash Buffer Below 2%
The balance sheet shows cash and bank deposits of £2.832 million, plus receivables of £4.815 million, for total current assets of £7.647 million; payables and other creditors total £4.497 million. Net current assets are approximately £3.15 million, representing 1.81%, consistent with the "Net other assets 1.81%" disclosed in the interim report. The cash buffer is relatively low: if the market drops sharply or further redemptions occur, the fund would need to sell positions to meet liquidity needs, potentially causing additional impact on NAV.
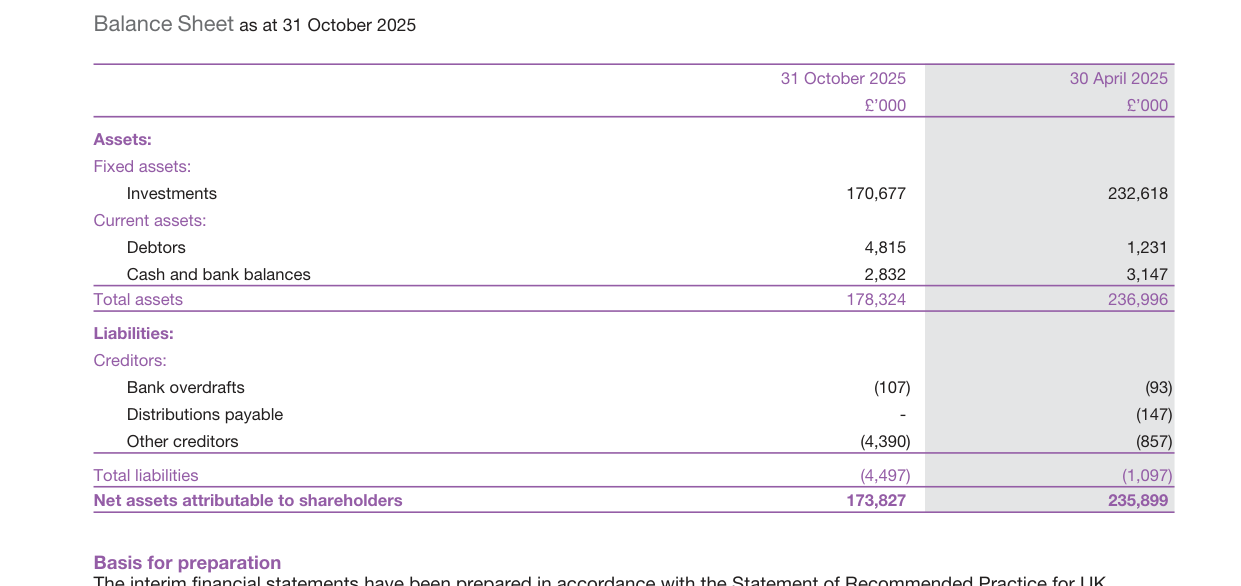
Global stock market capitalization as a percentage of GDP: reached 110% in 2024
Summary
This report reveals the financial position of a typical high-quality growth fund in a "NAV recovery with share outflows" scenario. At the investment level, regional rebalancing was achieved by adding Swiss healthcare and Polish consumer technology while reducing Swedish industrials and German fintech; however, total fund assets remain constrained by investor compensation-driven redemptions — net outflows over the past six months equaled 33% of beginning net assets. Despite steady NAV performance, the fund's continuing contraction in its asset base remains an important constraint on future operational and investment flexibility.
Performance Contrast: A Structural Reading of Short-Term Strength and Long-Term Underperformance
| Period | Fund B Class Return | Index Return | Index +2% Target Return |
|---|---|---|---|
| Six months (2025.5–2025.10) | 35.8% | 21.6% | 22.5% |
| Five-year annualized (to 2025.10) | -10.0% | 10.7% | 12.7% |
US personal savings rate: declining from 16% in 2020 to 4.5% in 2024
The six-month excess return of 14.2 percentage points equals roughly 1.6 times the index +2% target; but the five-year annualized underperformance of 20.7 percentage points versus the index, and 22.7 percentage points versus the target, reveals a key fact: this fund does not win through a steady central advantage but is a typical high-beta style-exposure fund. During the post-pandemic liquidity tightening of 2020–2022, its heavily weighted unprofitable growth stocks bore the brunt; from the second half of 2024 onward, when AI, defense technology, and biotech regained favor, the same holding structure provided enormous elasticity. The report emphasizes that "five years is a more sensible evaluation horizon," yet it is precisely the five-year annualized data that exposes the destructive power of style rotation on long-term compounding — a microcosm of actively managed funds in extreme markets: lagging the index in bull markets (due to concentrated holdings), falling harder in bear markets (due to high volatility), and only catching up when style returns. Investors should be cautious: whether this "punitive repair" can persist depends on whether the AI and defense spending cycle proves more resilient than the growth-stock bubble of five years ago.
The Essence of Active Management: Not Index Replication, but "Thematic Concentration + High Conviction"
The report opens by stating that the "Investment Manager selects investments of their own choosing" — not empty rhetoric. Looking at the top ten holdings, the fund does not allocate by region or sector according to index weights; instead, it places 18.9% of assets in just two companies: Alnylam Pharmaceuticals and AeroVironment. Meanwhile, all new purchases center on five major themes:
- Defense & Security (AeroVironment, Kratos Defense, EHang)
- AI Compute & Automation (ASPEED, Horizon Robotics, Impinj)
- Biotechnology (Guardant Health, continued Alnylam position)
- Clean Energy Infrastructure (Silex Systems, IREN, AMSC)
- Vocational Education (Universal Technical Institute)
Notably, the sell list includes both former growth stars like CyberArk and Ambarella, as well as traditional industrial technology companies such as Genus and Renishaw. This shows the investment manager actively compressing the portfolio's "narrative radius" — moving away from names whose growth logic depends on a single market or that have lost scarcity value — and concentrating all capital on policy-driven directions (defense budgets, grid upgrades) and hard-tech breakthroughs (AI chips, laser uranium enrichment). This "extreme concentration + explicit themes" approach received positive market feedback within six months, but it also plants seeds of risk: should geopolitical tensions ease or AI capex slow, the portfolio's drawdown could be larger than the index's.
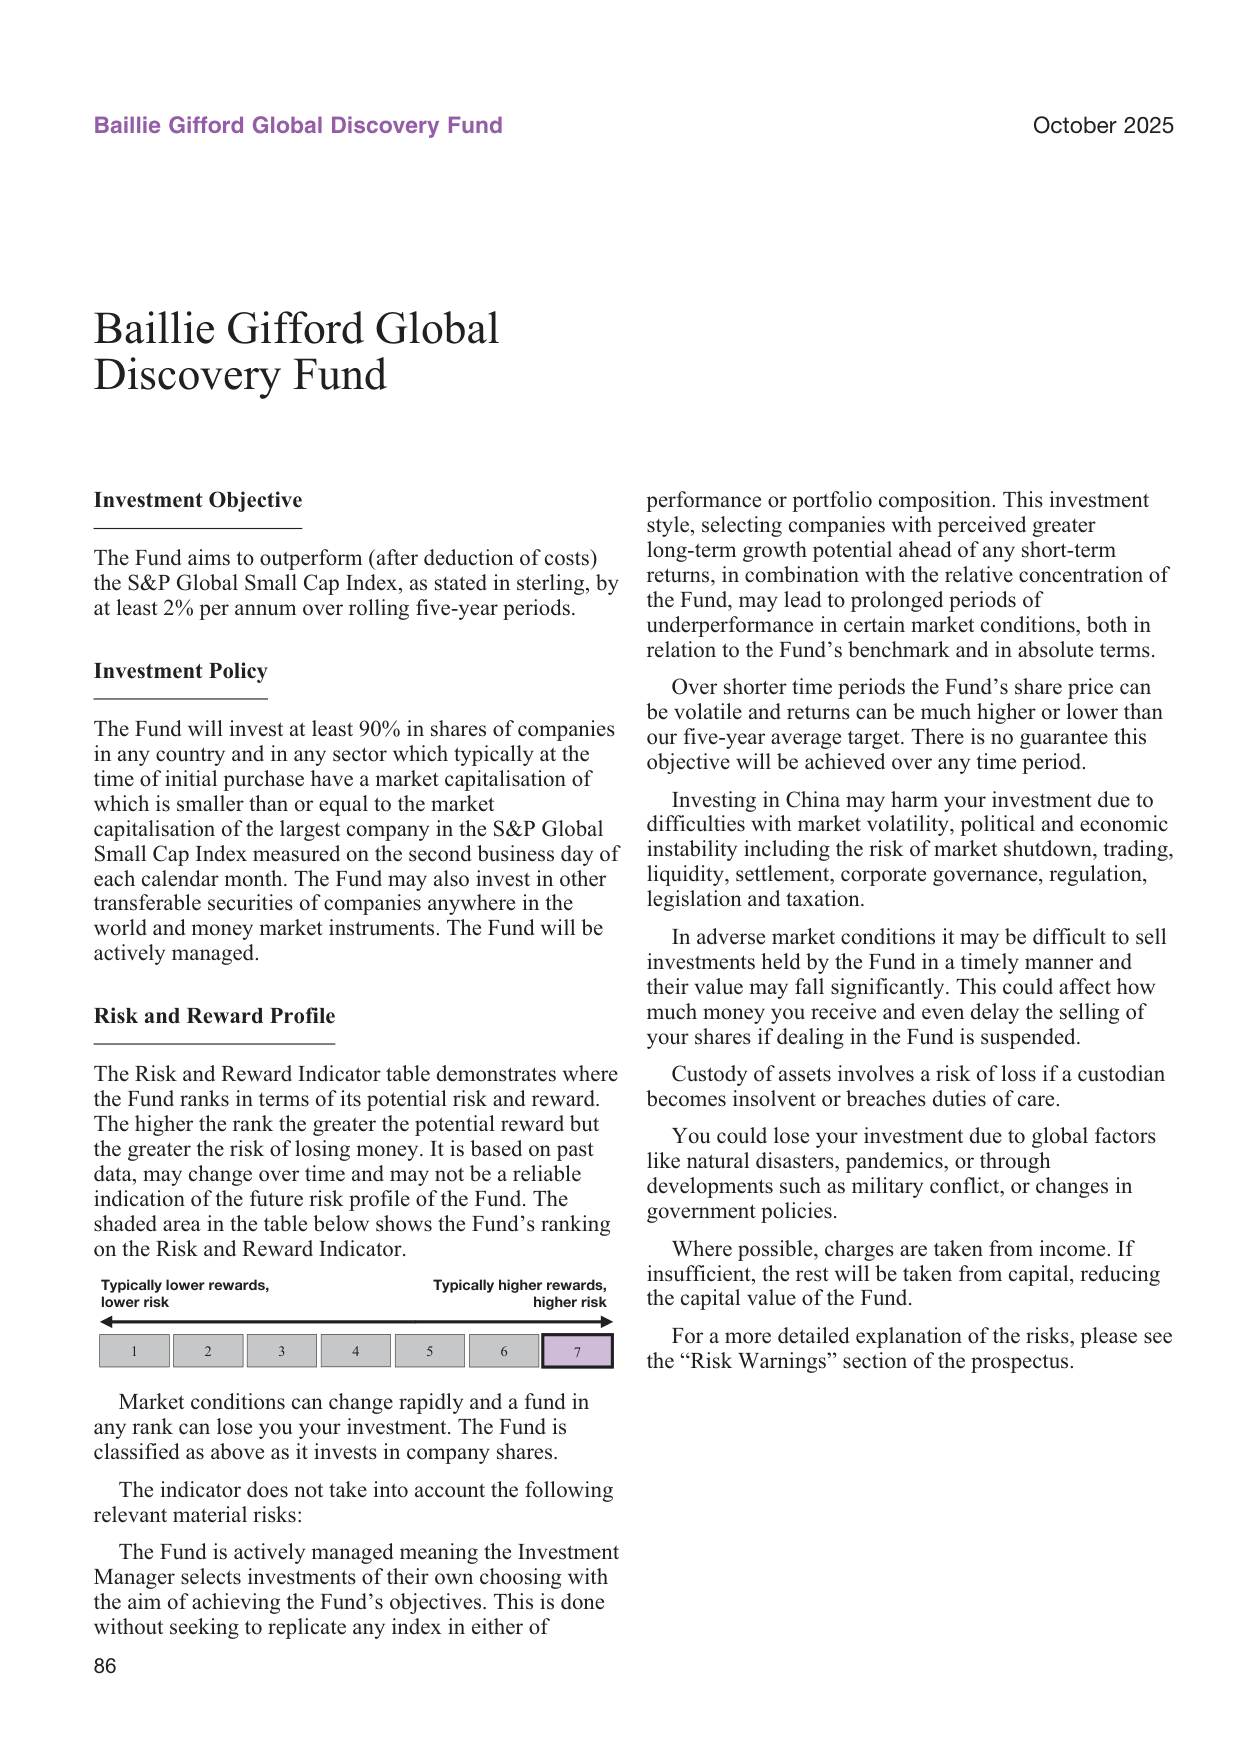
Global CO2 emissions by sector: energy accounts for 73%, transport 13%
Deep Attribution: Not Just "What Rose and Fell," but Validation of Business Model Inflection Points
Contributors:
- AeroVironment: The BlueHalo acquisition expanded the business from drones to electronic warfare and space-based sensing, with backlog exceeding $500 million and revenue growth above 20%. But the report does not mention the debt burden or integration risks associated with the acquisition, emphasizing only the "strategic domain." This is a typical Baillie Gifford narrative — willing to pay a premium for long-term optionality.
- Alnylam: Setting peak sales expectations at $9 billion is a key pillar of the current market cap. The critical point is the leap from "rare disease" to "broad-spectrum chronic disease" (cardiomyopathy, neurological disorders), which expands the addressable market from under $1 billion to tens of billions. However, markets tend to price this in early, and the current share price already embeds fairly optimistic assumptions.
- AMSC: Dual drivers from grid modernization and ship electrification, record order book, and improving profitability. This resonates with global reindustrialization and energy security themes, offering more fundamental support than the pure AI narrative.
Drags:
- Sweetgreen: The report explicitly acknowledges that the "investment logic has weakened" and decisively sold. This shows the fund does not stubbornly cling to a thesis but responds quickly to deterioration in small-scale fundamentals.
- Ocado: The postponement of the Kroger partnership to 2026 directly undermined the core narrative of "global solution scaling." Yet the report deliberately emphasizes that "mature warehouse picking speeds exceed 400 items/hour" and a new Australian client — implying that near-term weak results do not alter the long-term technological moat, only the timeline.
- RxSight: The issue is merely supply-chain bottlenecks; demand remains unchanged, so the position is retained. The differentiated handling of the three demonstrates investment discipline: sell when the thesis is broken, hold when timing is delayed, and add when disruptions are temporary.
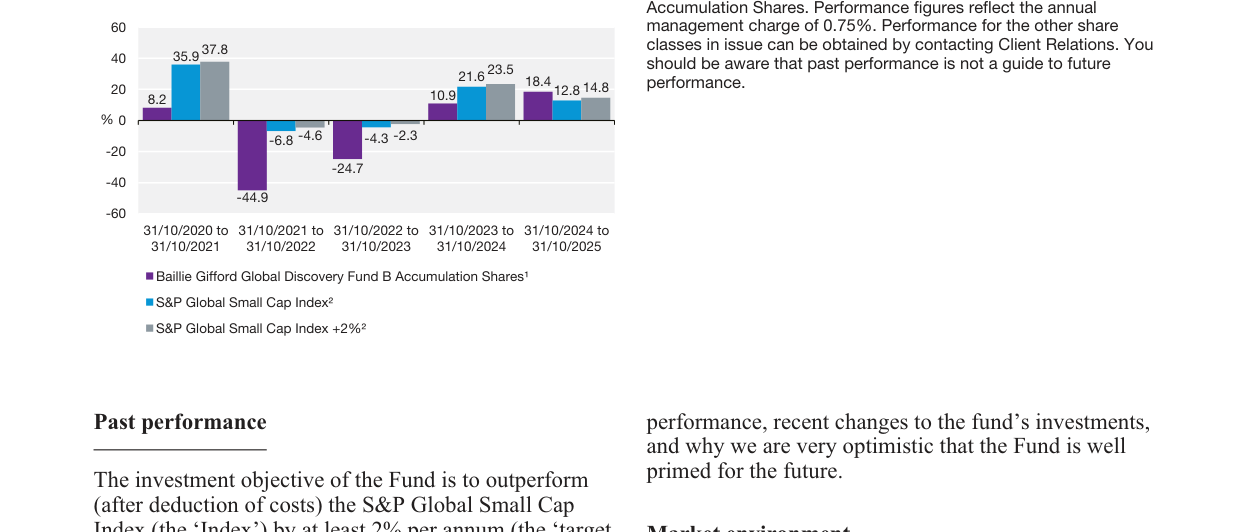
US yield curve inversion periods: the 2022–2024 inversion was the longest (24 months)
Hidden Signals in Rebalancing: From "Software SaaS" to "Physical Technology"
Most names on the sell list — CyberArk (cybersecurity), Sprout Social (social media management), Blackline (financial software), Quanterix (bioanalytical instruments), Codexis (biocatalysis) — are high-valuation crowded trades from the 2020–2021 growth-stock bubble era. On the buy list, apart from Impinj and ASPEED (semiconductors/RFID), the majority are tied to real-economy hard assets (EHang's passenger drones, IREN's renewable-powered data centers, Silex's laser uranium enrichment). This shift mirrors the change in the global macro narrative:
- The past decade was "code defines the world," with SaaS and software eating everything;
- The next decade may be "energy + hardware + national security" defining the world, where physical infrastructure and autonomous systems become scarce resources.
The fund is clearly betting on this rotation. But the risk is that these hard-tech companies have heavier capex cycles and greater dependence on interest rates and policy; if financing conditions tighten, earnings volatility will be greater.
The Implied Contradiction Between Concentration and Turnover
| Top Ten Holdings Combined | New Buys (within six months) | Sells (within six months) |
|---|---|---|
| 35.57% | 10 | 12 |
Global M&A activity by sector: technology and healthcare have the highest deal values (25% each)
With more than 20 buys and sells combined within six months, turnover is not low for a fund that professes "long-term holding, patient capital." But this precisely reveals the truth of active management: research-driven "long-termism" coexists with operational "timing and error correction." Baillie Gifford allows investment managers to stop out immediately when fundamental logic breaks, while using new purchases to fill portfolio gaps. This "high conviction + rapid response" model enabled the fund to capture the AI and defense trends in 2025, but it also means the portfolio's "identity changes" each year far exceed those of an index fund.
The Self-Referential Limits of the Market Outlook
The report argues that "small-cap valuations remain below long-term averages, financing conditions are stable, supporting selective fundamental investing." But this judgment overlooks three data points:
1. The five-year annualized return is negative while the index is positive, suggesting the portfolio's overall earnings quality may be below market averages;
2. Several newly purchased companies (IREN, EHang, Guardant Health) remain loss-making or barely profitable, with valuations supported by future cash flows and highly sensitive to interest rate changes;
3. Global geopolitical risks persist, and defense companies' high order books could be affected by government fiscal tightening.
The "optimism" is more a statement of positioning than a comprehensive risk warning.
Comparison of European bank stress test results; average CET1 ratio of 12.5%
Summary and Assessment: The fund's rebound in the second half of 2025 was a precise counterattack within a market of extreme style exposure. However, active management did not achieve "cycle-beating" performance; instead, it captured the two strongest themes of the moment (defense + AI) through intensive repositioning and theme rotation. Whether this model can outperform the index over the next five years depends on whether these concentrated holdings can truly deliver on their earnings forecasts — and historical data show that when interest rates remain elevated, the earnings delivery rate of small-cap growth stocks is far below expectations. Investors who look only at six-month performance while ignoring the five-year dimension may still be hurt by another round of style headwinds.
The full holdings and financial data disclosed in this follow-up report allow a further examination of the fund's allocation details and capital flows as of end-October 2025, with comparisons drawn against six months earlier (30 April 2025). The following analysis draws on these newly available figures and adds several perspectives not previously covered.
I. Regional Allocation Shifts Decisively Toward US Equities; Emerging Markets and UK Positions Trimmed
Looking at the regional breakdown of fund holdings, over the past six months the US weight rose sharply from 59.05% to 64.74%, while the UK fell from 12.02% to 7.89%, China from 6.55% to 4.61%, Japan from 5.17% to 3.08%, and Israel from 5.77% to 4.03%. This adjustment direction is broadly consistent with the global technology stock performance pattern in the second half of 2025 — US equities were strong in AI, biotechnology and defense, while growth stocks in markets such as the UK and Japan were relatively subdued.
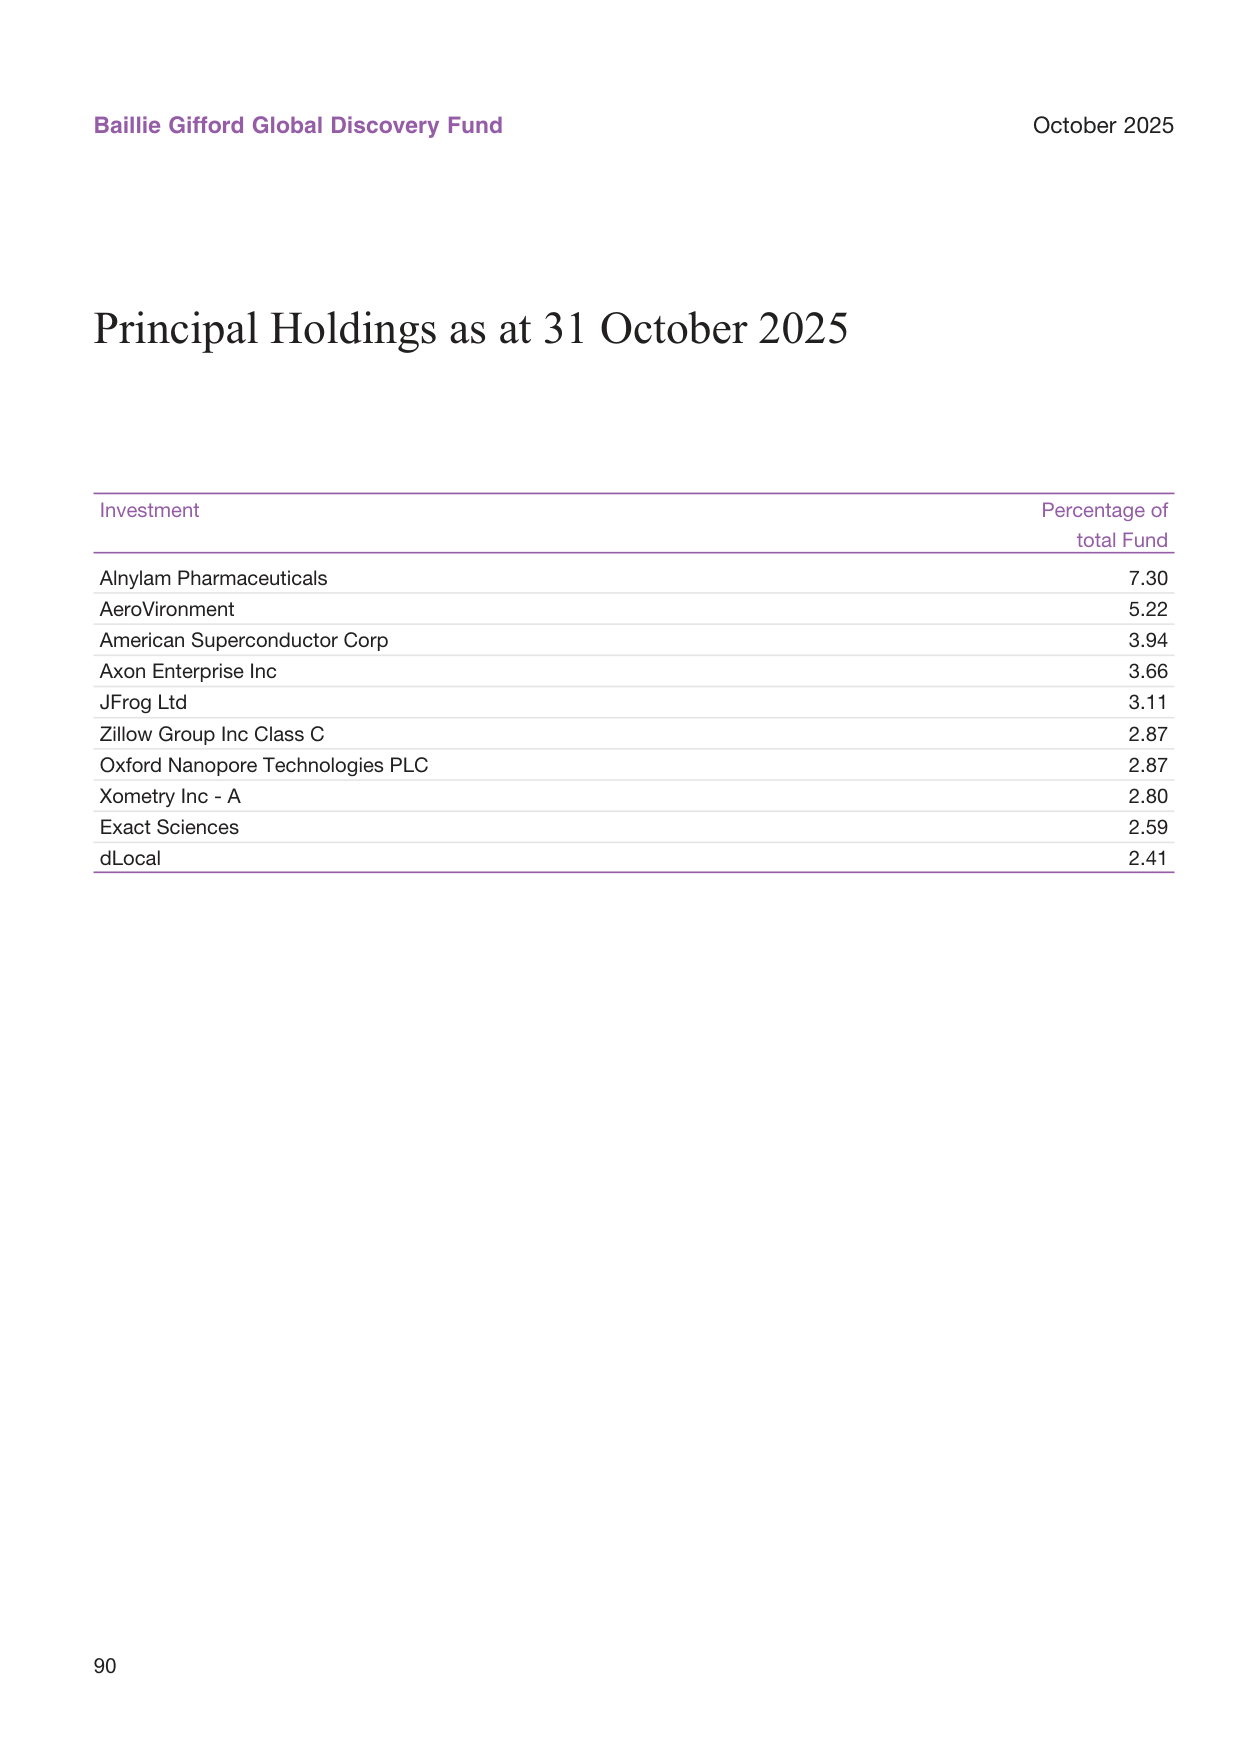
US job openings versus unemployed workers; currently 1.5 job openings per unemployed person
| Region | 31.10.25 Weight | 30.04.25 Weight | Change |
|---|---|---|---|
| US | 64.74% | 59.05% | +5.69pp |
| UK | 7.89% | 12.02% | -4.13pp |
| China | 4.61% | 6.55% | -1.94pp |
| Israel | 4.03% | 5.77% | -1.74pp |
| Japan | 3.08% | 5.17% | -2.09pp |
| Brazil | 4.02% | 3.03% | +0.99pp |
| Taiwan | 3.20% | 1.63% | +1.57pp |
| Australia | 4.06% | 1.22% | +2.84pp |
Australia recorded the largest increase (+2.84pp), mainly driven by three new names: IREN (a bitcoin miner transitioning into AI data centers), Catapult Group and Silex Systems. Taiwan also saw additions of ASPEED Technology and E Ink Holdings, suggesting the fund strengthened its allocation to the semiconductor supply chain and the electronic paper track.
II. Top-Ten Holdings Concentration Increases; Single-Stock Weights Rise
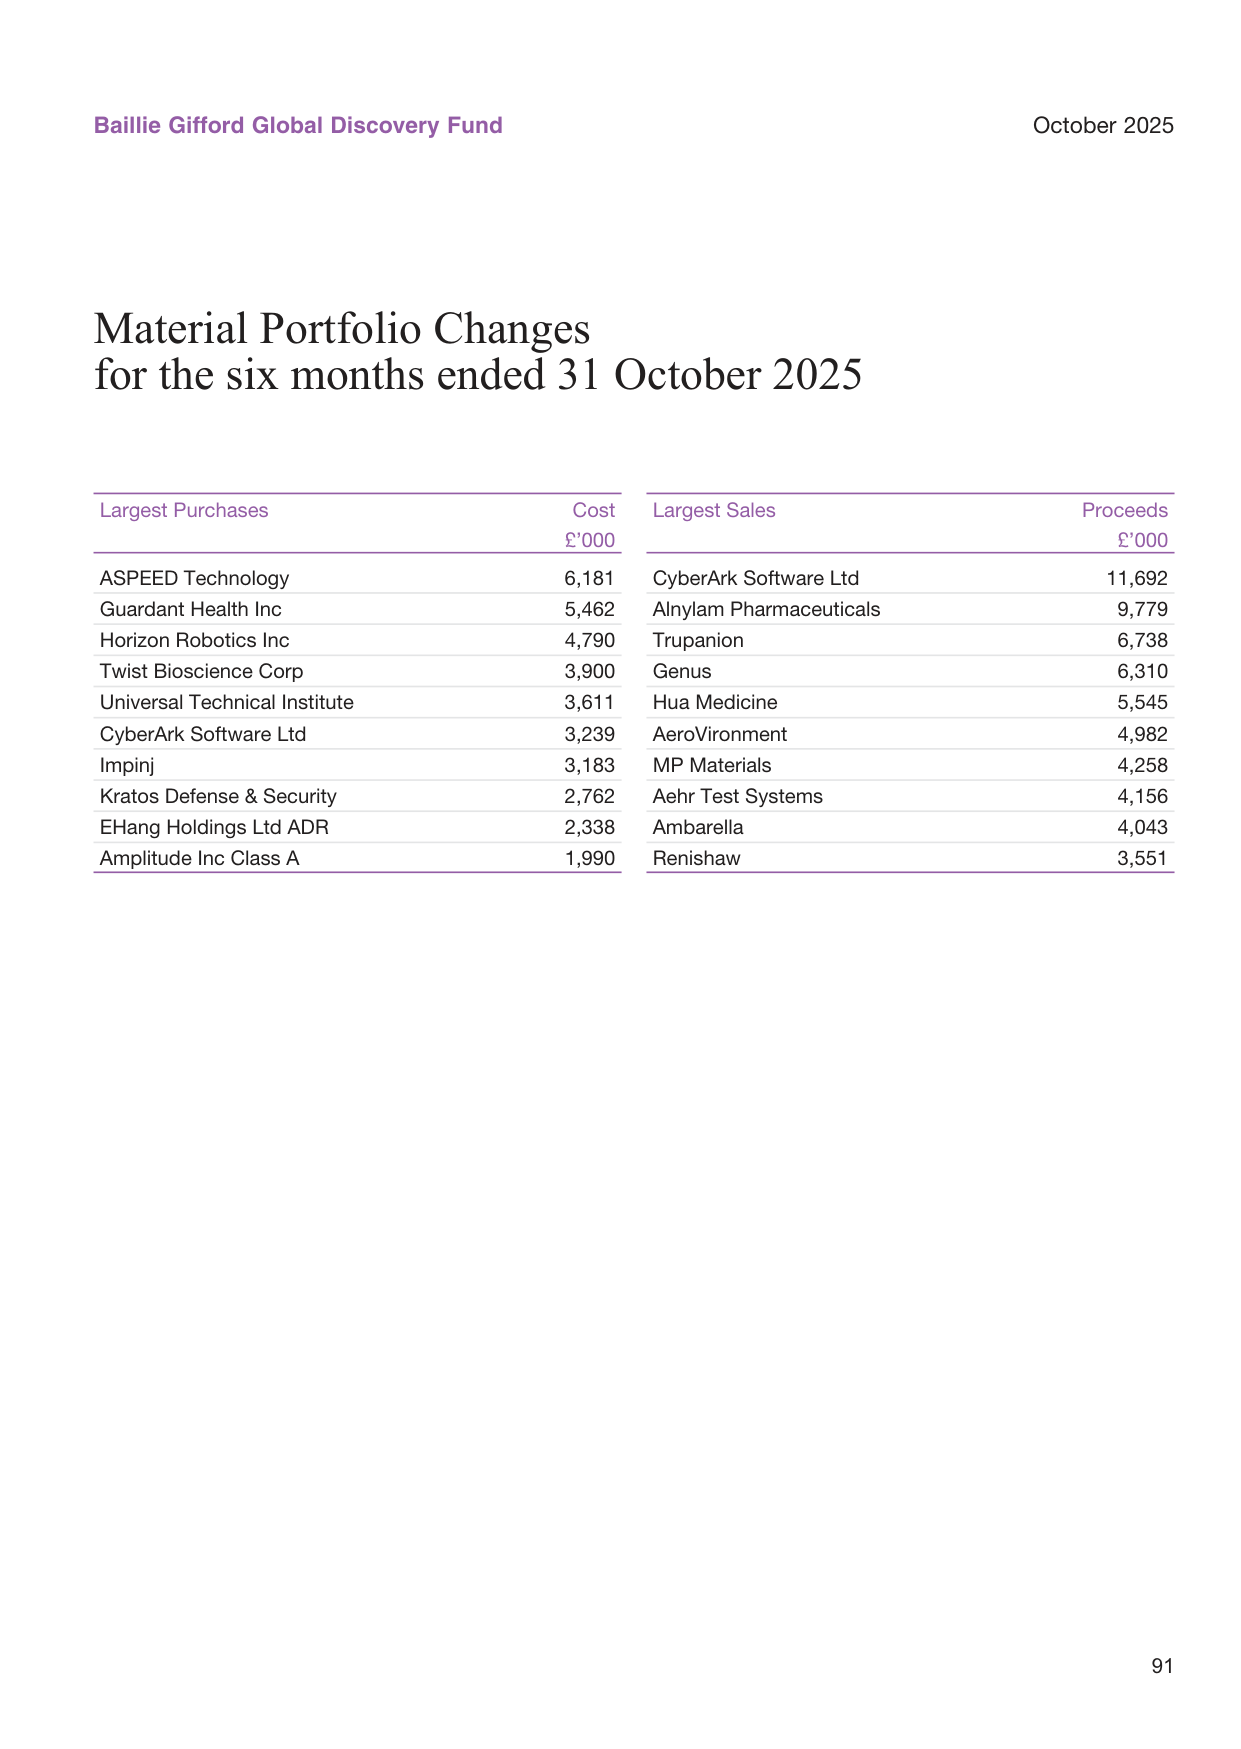
Capital inflows to emerging markets by type (FDI, portfolio investment, bank lending); total inflows of US$1.5 trillion in 2024
Ranked by market value weight, the top ten holdings together account for more than 37% of the fund's net assets, more concentrated than six months earlier. Alnylam Pharmaceuticals is the largest holding at 7.30%, followed by AeroVironment at 5.22%. These two stocks represent two of the hottest tracks — biotechnology (RNAi therapeutics) and defense drones, respectively.
| Rank | Stock | Weight | Sector |
|---|---|---|---|
| 1 | Alnylam Pharmaceuticals | 7.30% | Biotechnology (RNAi) |
| 2 | AeroVironment | 5.22% | Defense/Drones |
| 3 | American Superconductor | 3.94% | Energy/Superconductors |
| 4 | Axon Enterprise | 3.66% | Law enforcement technology |
| 5 | JFrog Ltd | 3.11% | Software development/DevOps |
| 6 | Zillow Group Class C | 2.87% | Real estate technology |
| 7 | Oxford Nanopore Technologies | 2.87% | Gene sequencing |
| 8 | Xometry Inc - A | 2.80% | Digital manufacturing |
| 9 | Exact Sciences | 2.59% | Liquid biopsy |
| 10 | IPG Photonics | 2.32% | Lasers |
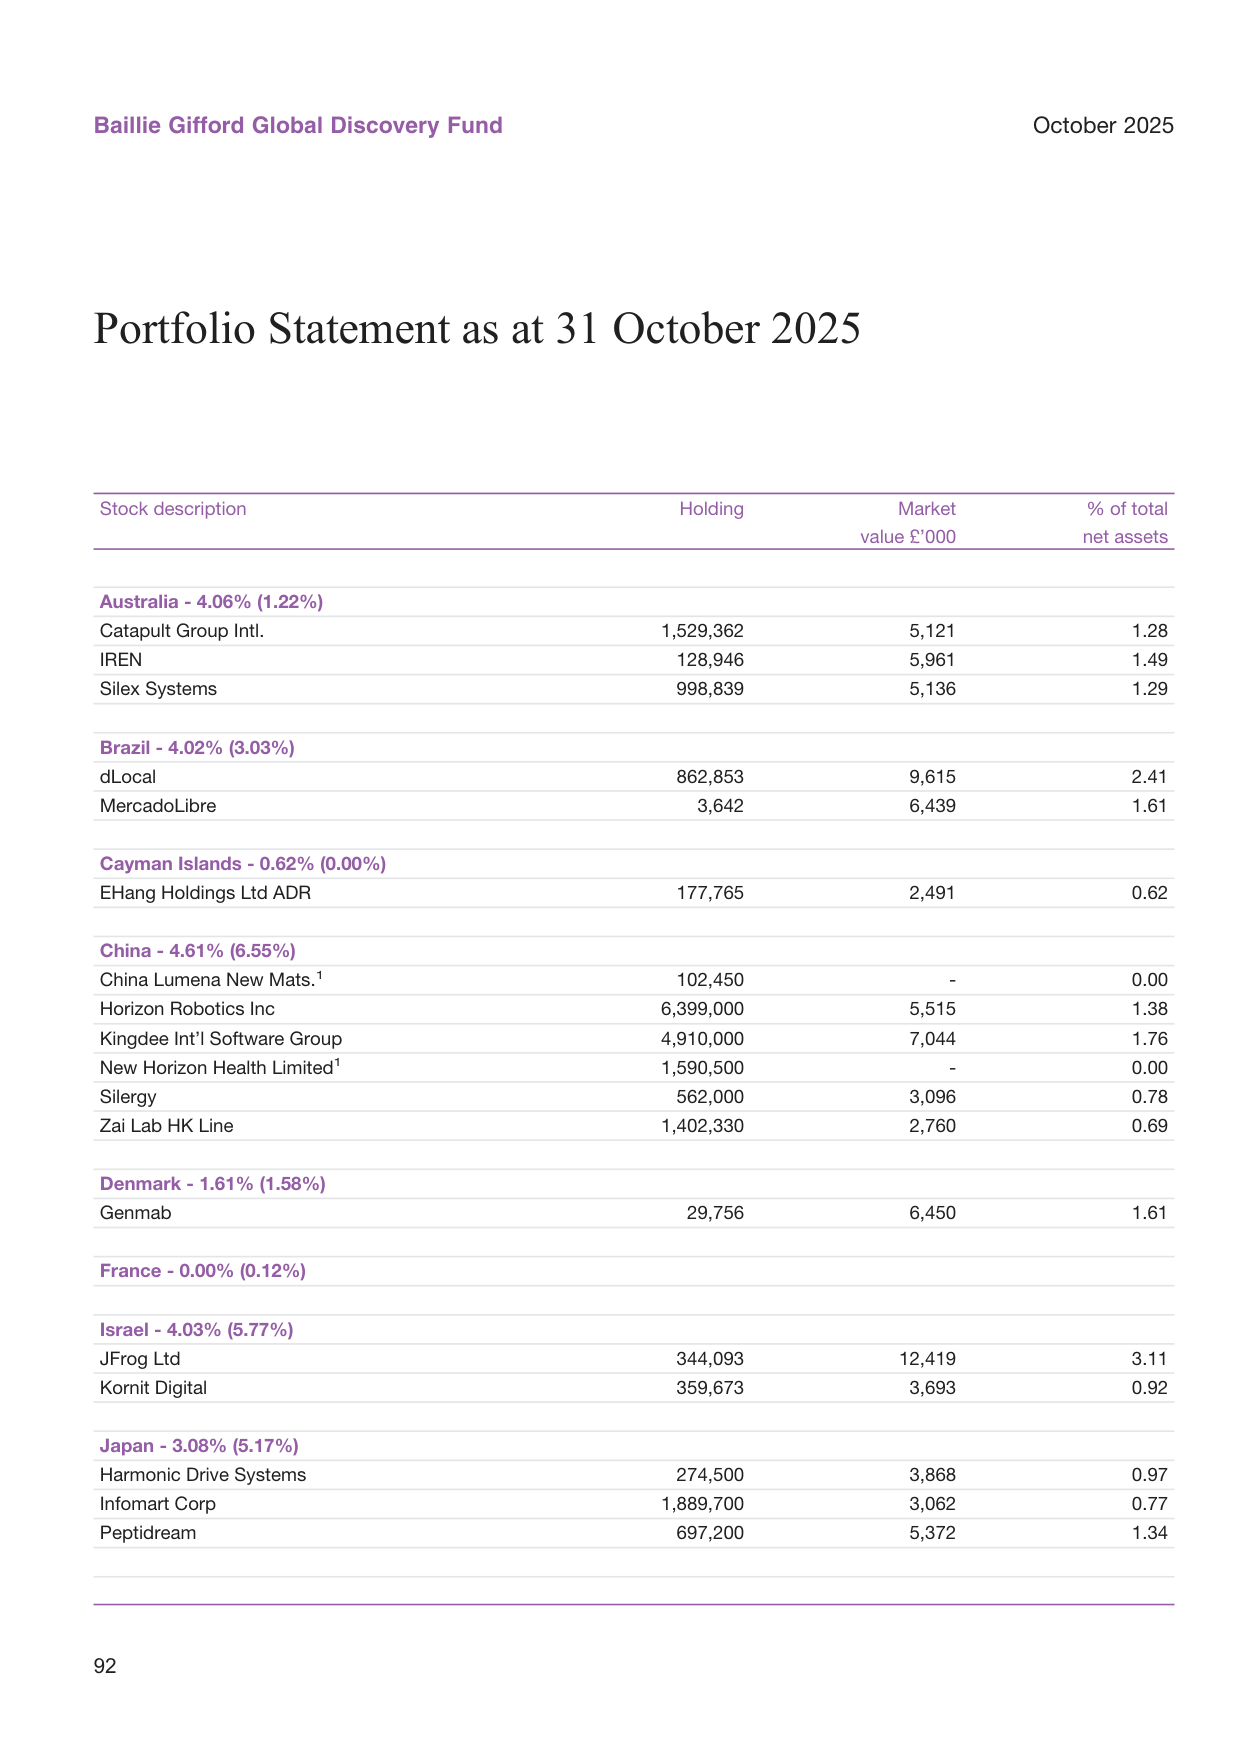
Global infrastructure investment gap; annual shortfall of approximately US$1.5 trillion
Among these, American Superconductor's holding weight was not directly shown at the end of the prior period, but is now included at 3.94%, most likely a new position or a significant increase. The stock benefited from grid upgrades and superconducting magnetic energy storage concepts, with a notable rally in the second half of 2025. Similarly, Rocket Lab (1.43%) and SkyWater Technology (2.02%) also represent the themes of space and advanced semiconductor packaging.
III. Three Stocks Written to Zero Reveal the Risk Boundary of Growth Stocks
In the holdings list, three stocks are marked as "delisted at the period end and valued at Investment Adviser's valuation" with market values of £0: China Lumena New Materials, New Horizon Health (mainland China background) and 4D Pharma (UK). These companies belong to materials, medical diagnostics and microbiome pharmaceuticals, respectively, and their value went to zero due to delisting or bankruptcy. Although their combined weight is relatively small, it shows that the risk of "falling to zero" is real within a high-growth portfolio. Compared with the half-year report, these stocks may already have been impaired previously, but the complete write-down this time also partly explains the sharp decline in the fund's UK allocation (4D Pharma written to zero).
Notably, during the same period the fund added EHang Holdings to its Cayman Islands positions, albeit at only 0.62%, reflecting a tentative position in the urban air mobility (UAM) track. One exit and one entry demonstrate the fund manager's continued openness to new themes even after failed cases.
IV. Heavy Net Redemptions but Strong Performance; Assets Rebound Against the Trend
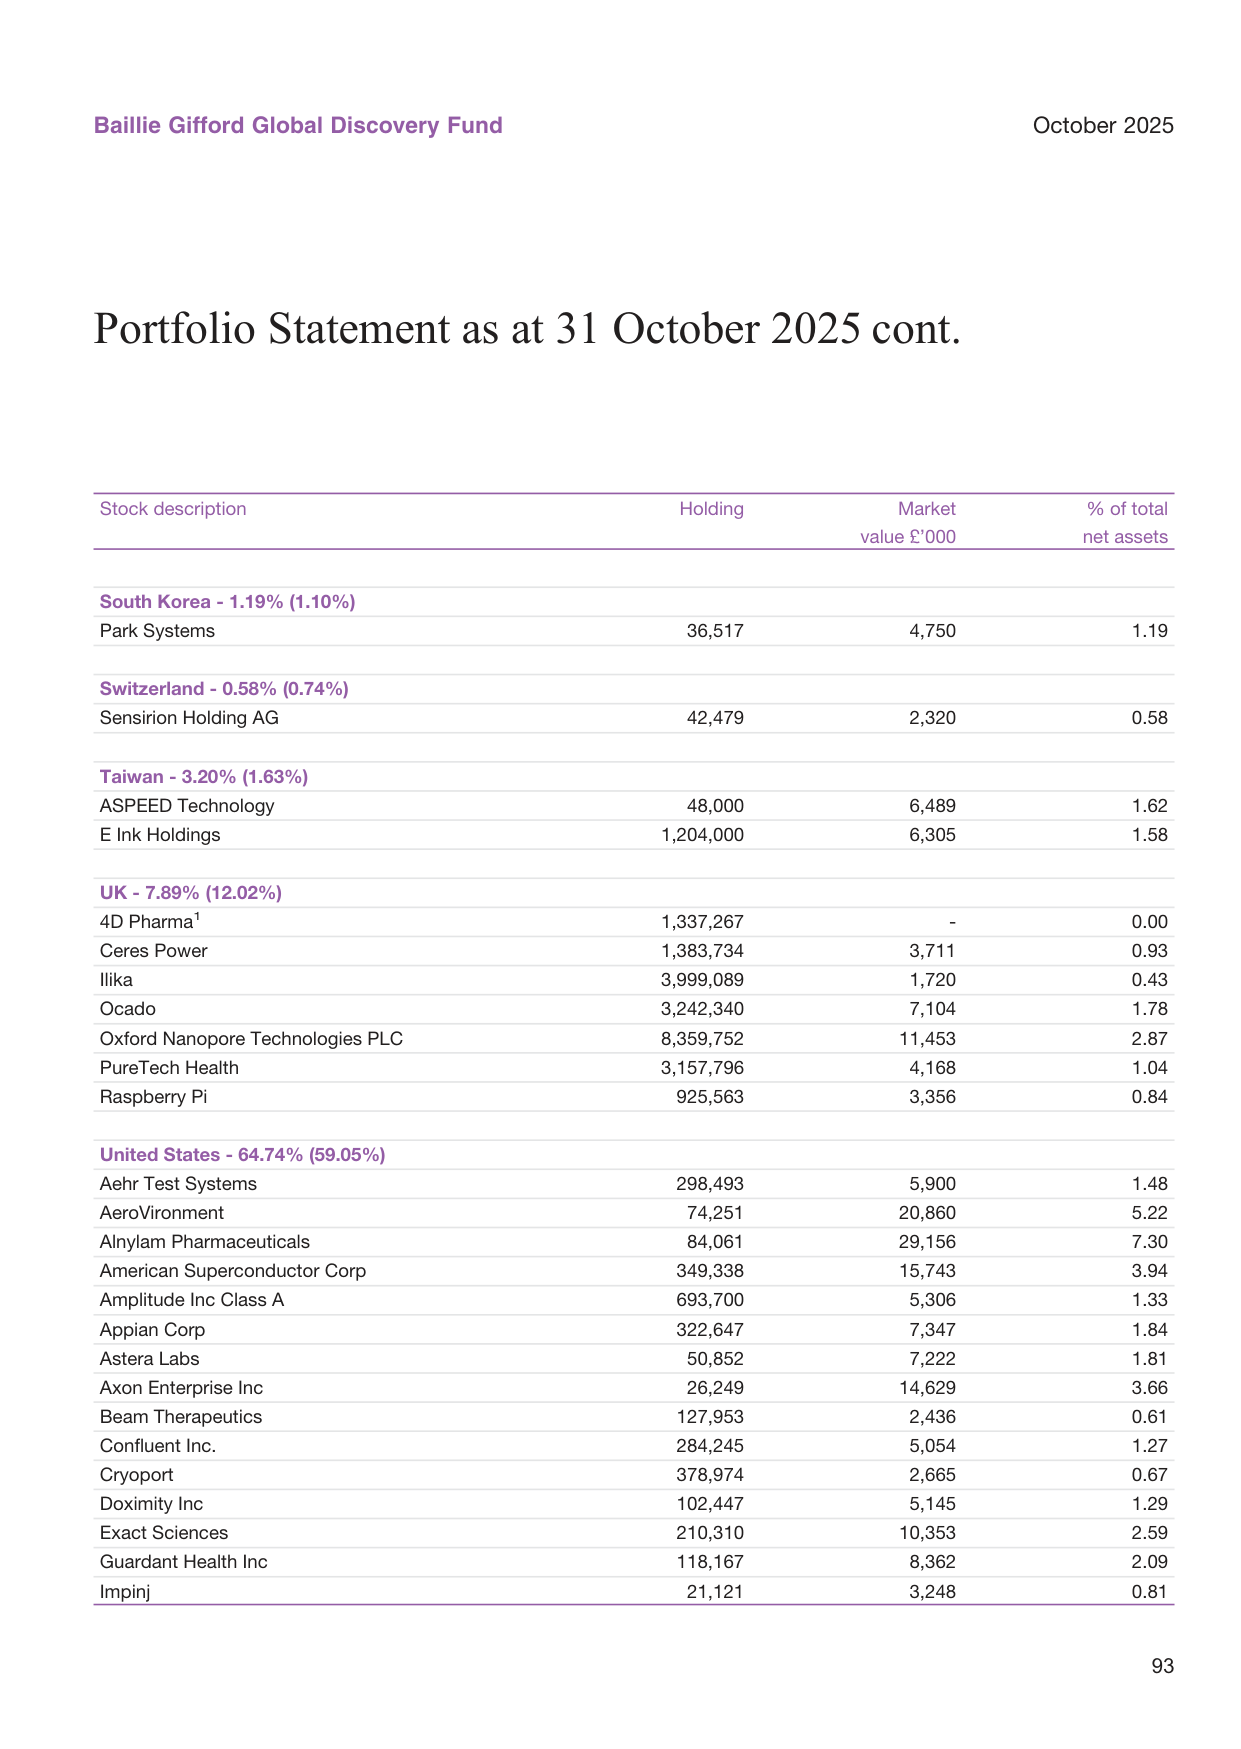
US dollar index versus commodity prices; the two show a negative correlation
Total net assets rose from £331,880 thousand at end-April 2025 to £399,554 thousand at end-October 2025, an increase of approximately 20.4%. Breaking this down, investment activities contributed +£117,915 thousand (mainly net capital gains of £118,864 thousand), while investor net redemptions were -£50,364 thousand, with issuance inflows of £4,024 thousand. In other words, performance growth fully covered the capital outflows, and the fund still achieved positive growth.
| Item | 31.10.25 (£'000) | 31.10.24 (£'000) |
|---|---|---|
| Opening net assets | 331,880 | 517,074 |
| Net subscriptions/redemptions | -50,364 | -101,205 |
| Increase from investment activities | +117,915 | +23,372 |
| Closing net assets | 399,554 | 439,496 |
Compared with the same period last year (end-October 2024), net redemptions were then as high as £101,205 thousand, while investment activities contributed only £23,372 thousand, causing net assets to shrink significantly from £517,074 to £439,496. This year, although redemptions fell to £50,364, investment returns surged to £117,915 thousand, indicating that market conditions were highly favorable to this strategy.
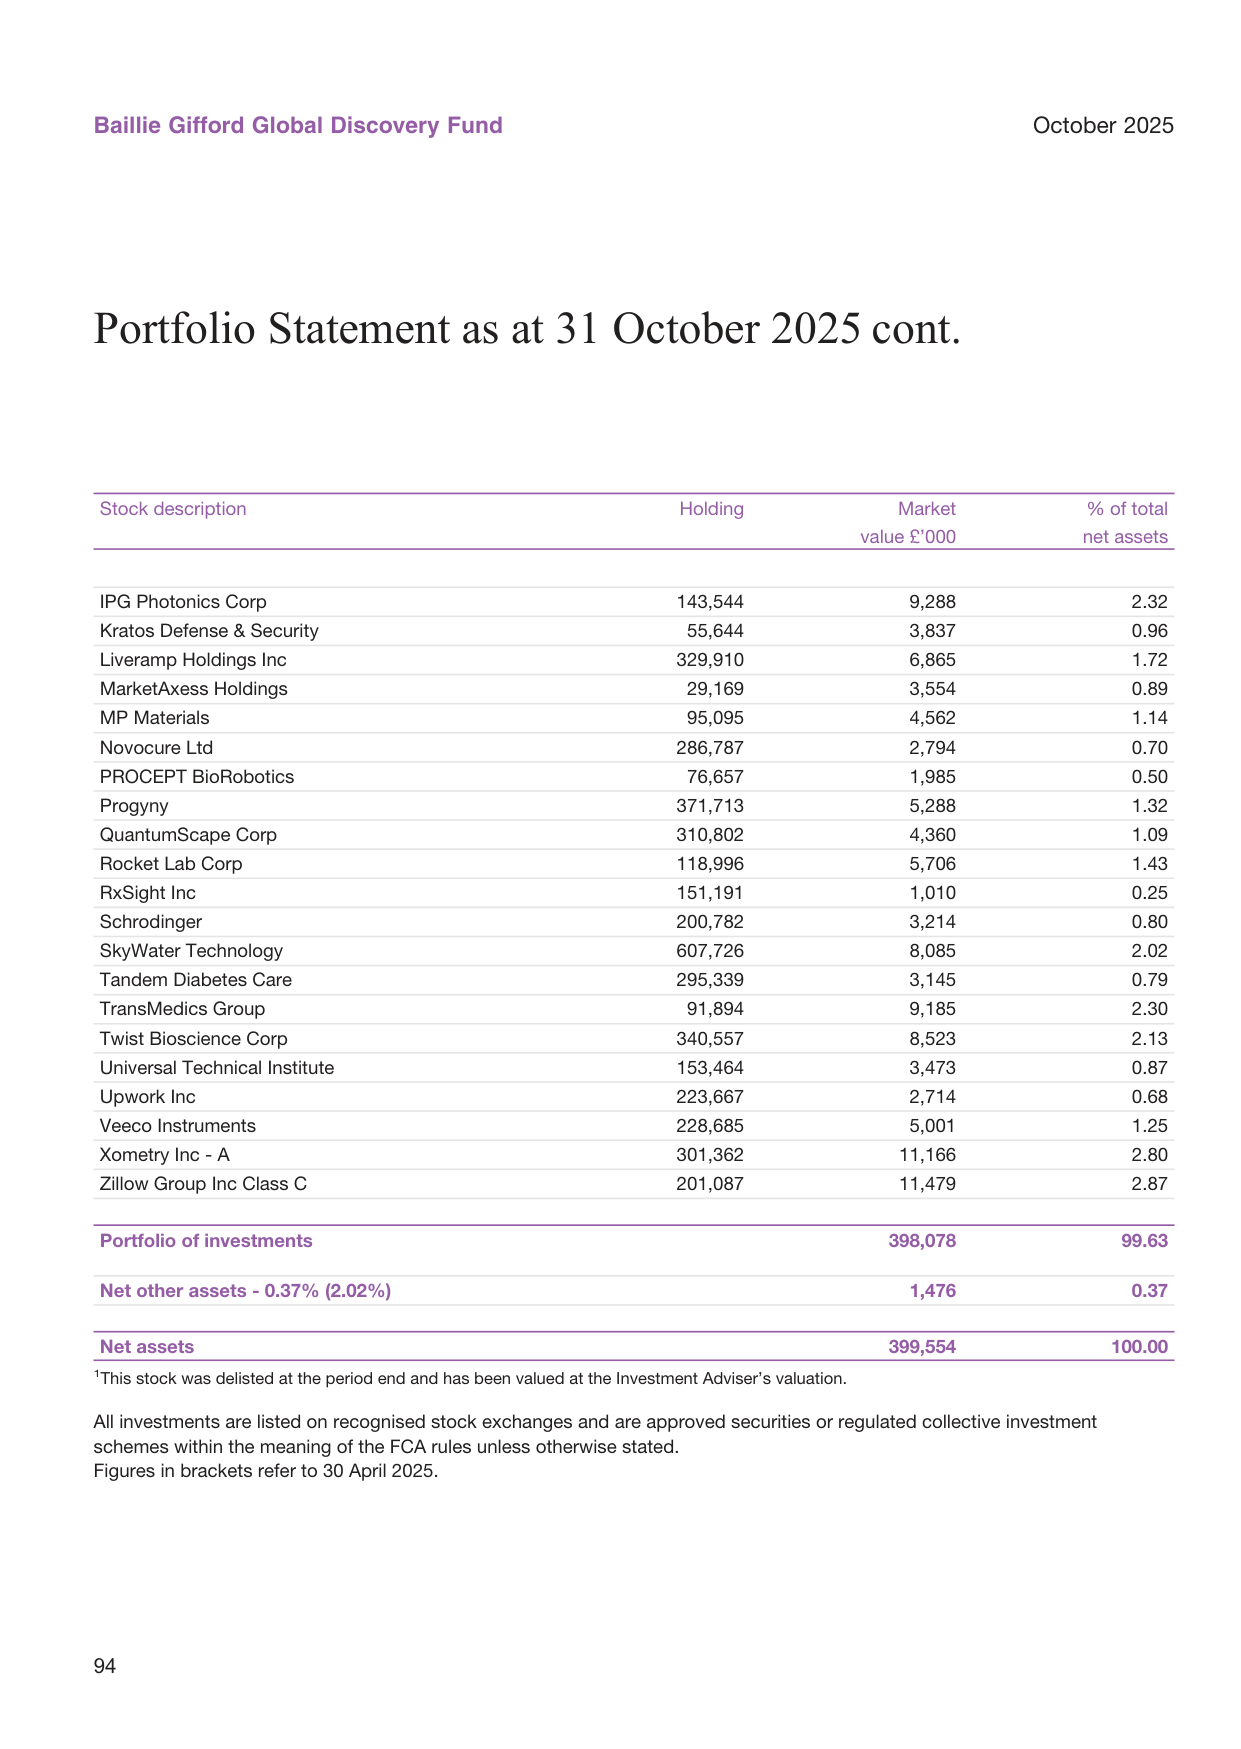
Real interest rates by region; Japan at -0.5%, US at 1.5%
The net asset value per share confirms this: the B Accumulation share rose from 883.15p to 1,443.96p, a gain of approximately 63.5% over six months (given that this share class is the primary one, this reflects the rapid growth in the portfolio's NAV). The high-low price range also moved up substantially, and volatility remains elevated.
V. Ongoing Charges Continue to Improve; Cost Control Effective
The Ongoing Charges Figures show Class A falling from 1.56% to 1.54%, Class B from 0.81% to 0.79%, and Class C remaining at the low level of 0.04-0.06%. The fee decline may be related to changes in fund size and the tiered structure of management fees, or it may stem from BAILLIE GIFFORD proactively lowering fee rates. For long-term investors, Class C shares (lowest fees) remain the most cost-efficient choice, though the fee gap for Class B shares is also narrowing.
VI. Extension to the Baillie Gifford Japanese Fund: Benchmark Anchored to TOPIX, Consistent Style
Following the Global Discovery Fund, the follow-up report begins to present the investment objective of the Baillie Gifford Japanese Fund. This fund explicitly requires "outperform TOPIX by at least 1.5% per annum over rolling five-year periods," in contrast to Global Discovery's pursuit of "long-term absolute returns with relative concentration." The Japanese Fund's emphasis on excess returns relative to a benchmark implies that its portfolio construction may focus more on risk alignment with TOPIX rather than entirely free stock selection.
In addition, the Japanese Fund's investment policy also warns of "prolonged periods of underperformance in certain market conditions," continuing Baillie Gifford's customary "long-termism plus volatility tolerance" narrative. Judging from Global Discovery's actual holdings, high concentration and high volatility have indeed generated significant short-term gains, but the write-down cases also remind investors that the potential drawdowns of such strategies can be extremely severe, and the five-year rolling objective may not smooth away the risks of extreme years. Comparing the Japanese Fund's investment objective with Global Discovery's holdings performance shows that the same asset manager guides investor expectations through differentiated objectives under different market conditions, yet the underlying methodology remains "long-term holding of growth stocks with tolerance for volatility."
Part 16/24: The Absence of Alpha in Semi-Annual Performance and the Strategic Shift in Active Management
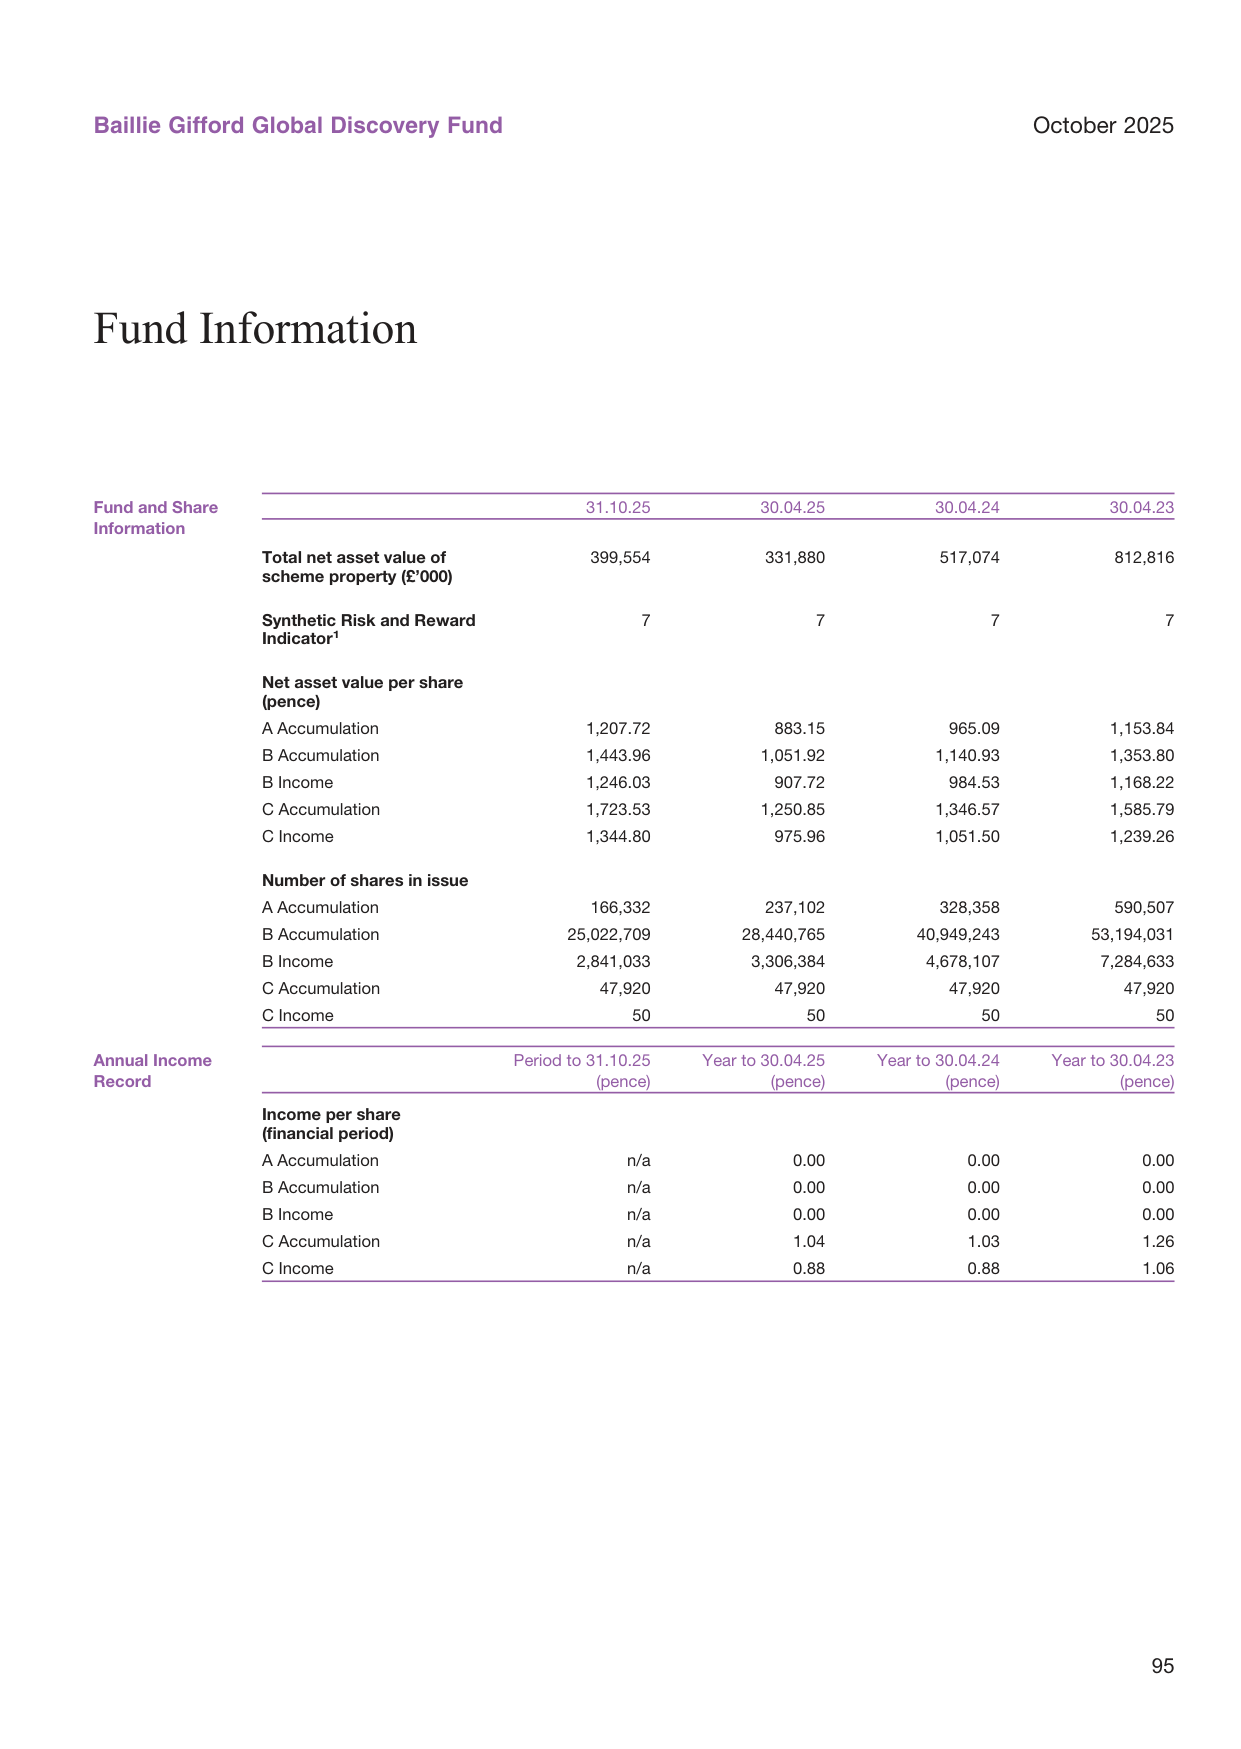
US consumer confidence index; value of 101 in 2024
I. The "Dual Interpretation" of Performance Data: Beta Gains Coexist with Missing Alpha
The return data for the past six months exhibit structural characteristics worthy of deeper interpretation: the Class B accumulation share returned 18.9%, only 0.1 percentage point behind the index return of 19.0%. On the surface the gap appears to have narrowed considerably. But over five years, the fund's annualized return of 4.1% versus the index's 9.7% represents a gap of 5.6 percentage points per year — a significant shortfall that cannot be ignored. More critically, the target return over the same period was 11.4% annualized (the index + 1.5% compound target), meaning the fund has not yet achieved its promised value-added objective over the long term.
| Return dimension | Fund (Class B accumulation) | TOPIX index | TOPIX + 1.5% target | Gap (fund vs index) |
|---|---|---|---|---|
| Six months | 18.9% | 19.0% | 19.9% | -0.1pp |
| Five-year annualized | 4.1% | 9.7% | 11.4% | -5.6pp/year |
The report attributes this shortfall to the economic drivers of "global trade recovery and a weak currency," and argues that these headwinds are easing. But it must be noted objectively that a nearly six-percentage-point annualized gap over five years cannot simply be chalked up to external conditions — the TOPIX index is dominated by value sectors such as financials and industrials, while this fund's overweight in internet and growth names creates a systematic beta difference in style relative to TOPIX. This structural divergence means that even with good beta capture from Japanese equities during the 2025 first-half bull market, alpha generation remained unsatisfactory — the report's self-described "marginally underperforming" does not, in a statistical sense, constitute evidence of substantive improvement; it is merely a process of narrowing the gap.
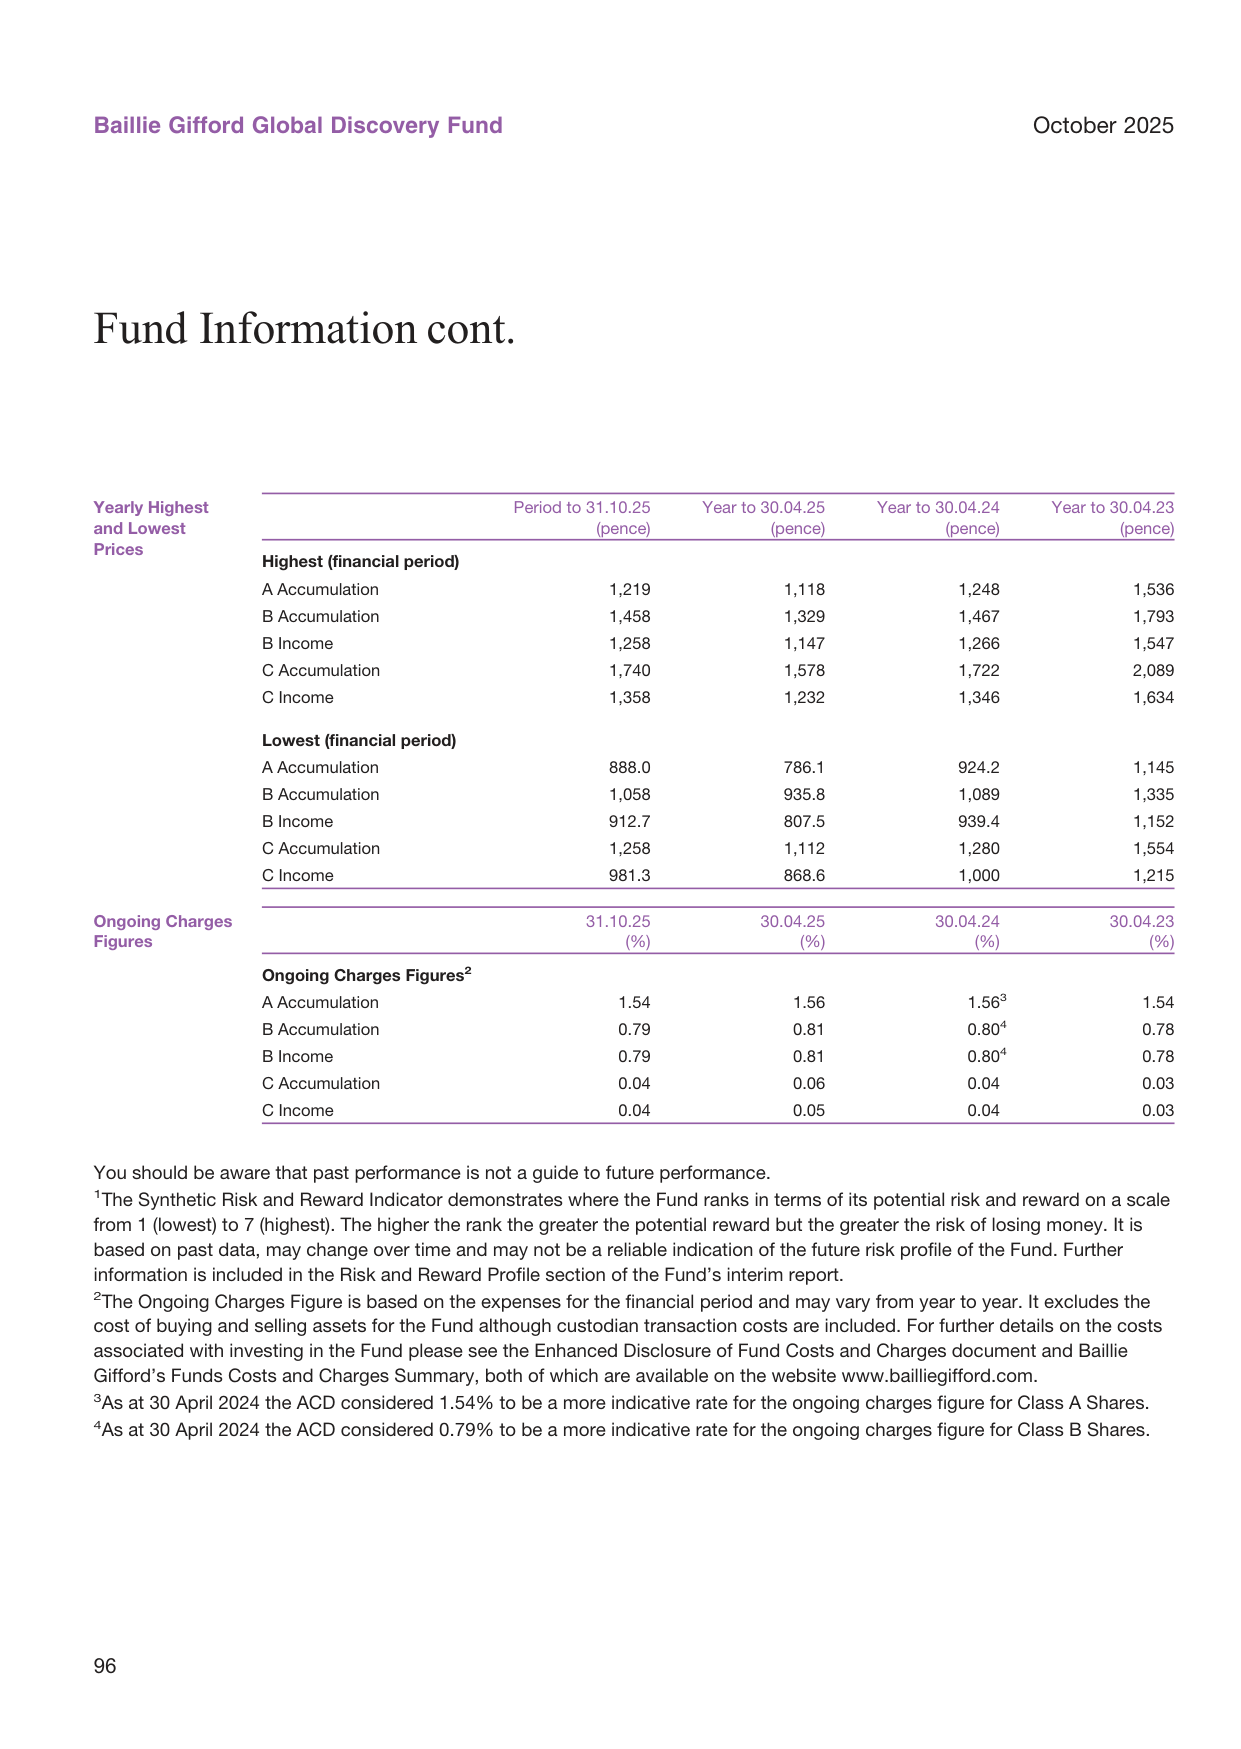
Corporate bond issuance by credit rating; investment grade accounts for 80%
II. The Annual Report's "Principal Holdings" Reveal the Downside Amplification Effect of Portfolio Concentration Risk
The top two holdings, SoftBank Group (8.87%) and SBI Holdings (5.64%), together account for approximately 14.5%, and the top ten holdings total about 43%. This concentration contributes significantly in a one-sided rising market, but under the "adverse market conditions" scenario described in the risk warning at the start of the report — where it may be difficult to sell investments in a timely manner — the liquidity risk of concentrated holdings and the synchronicity of NAV declines would amplify redemption pressure.
SoftBank's particular characteristics deserve special attention: it was reduced by £89.13 million yet remains the largest holding. This suggests the fund has not lost confidence in the AI technology group, but rather took partial profits after the stock doubled. However, SoftBank's valuation incorporates sharply elevated expectations for Arm and OpenAI, and such sentiment-driven pricing has high drawdown vulnerability — should the AI narrative undergo a periodic correction, a drawdown of more than 20% would not be unusual. The same logic applies to SBI Holdings, which depends on the Shinsei Bank IPO event as a catalyst; the durability of event-driven gains is questionable.
The portfolio's heavy weighting in these "story" and "event" names, combined with concentration characteristics, suggests that the actual risk exposure may be higher than the "medium" level implied by Level 4 (out of 7) on the Risk and Reward Indicator. Moreover, the indicator explicitly notes that "historical data may not reliably reflect future risk" — and the past five years happen to be a period when the portfolio's style was out of favor. If the style environment shifts in favor of growth in the future, the indicator's ranking, calculated from historical volatility, may understate the portfolio's downside risk.
III. Trading Signals: A Dual-Track Shift from "Growth First" to "Valuation Repair + Growth"
The contrast between additions and eliminations provides a key evidence chain for interpreting the investment manager's latest logic:
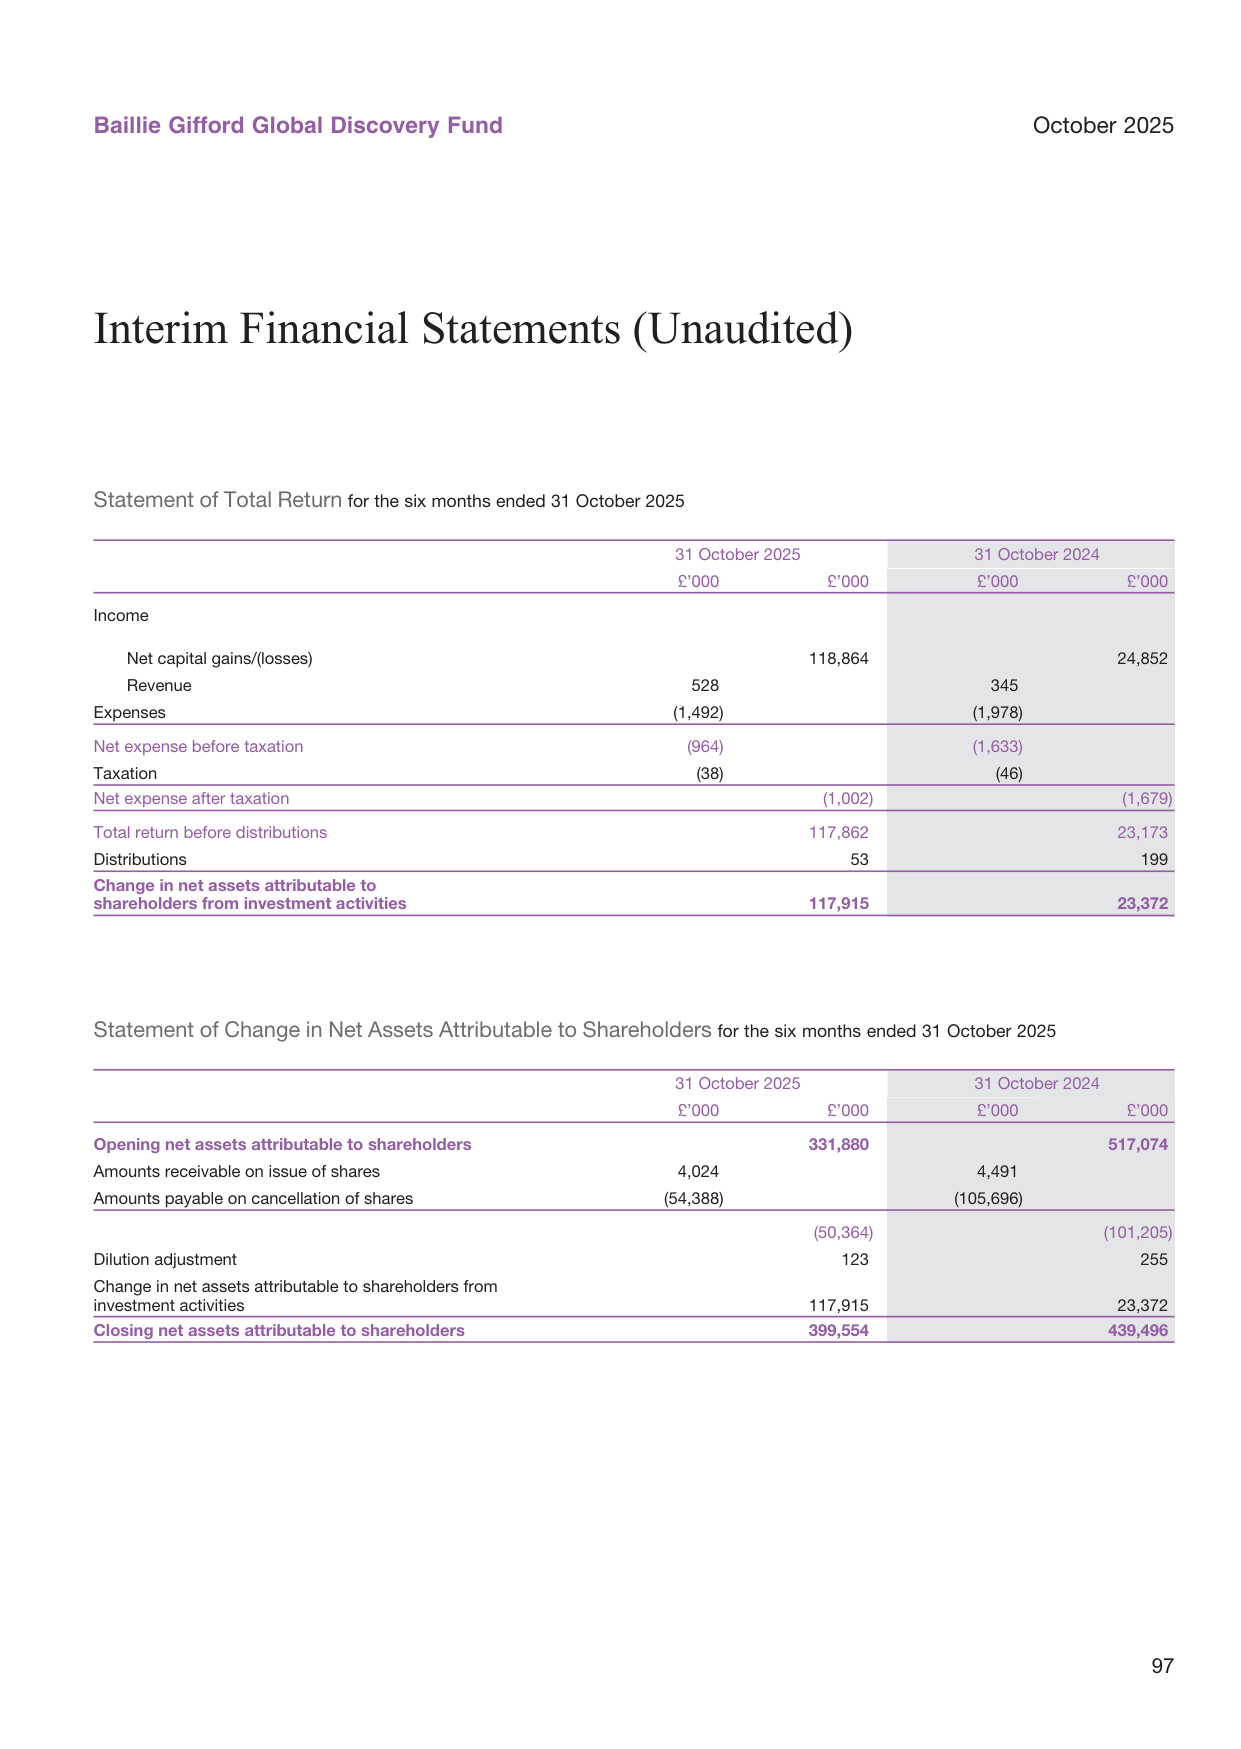
GDP growth forecasts by region; global growth of 2.8% in 2024, Asia growth of 4.5%
| Trade type | Name | Entry/exit logic | Signal implication |
|---|---|---|---|
| New | Sega Sammy | Underexploited revenue monetization from classic game IP (Sonic, etc.); pachinko legacy business suppressing valuation provides a margin of safety | Shift from pure growth to "IP asset monetization" |
| New | Money Forward | SaaS for SME back-office operations; rising cloud penetration | Focus on digital finance and tax infrastructure |
| New | Tokyo Electron | Semiconductor equipment leader; indirect beneficiary of AI demand; positioned in advanced process technology | Replaces Rohm's IDM position; shifts to equipment capex cycle |
| New | Sony Financial Holdings | Independent financial platform spun off from Sony; ample capital | Event-driven "spin-off value" strategy |
| Eliminated | Digital Garage / Mixi / Mercari | Sustainability of growth in question | Cautious at the margin on internet traffic monetization models |
| Eliminated | Rohm | Same as above | Doubts about the persistence of the consumer electronics/power semiconductor cycle |
This set of trades reveals a clear repositioning intent: shifting the previous high concentration on the single "internet + innovation" narrative toward diversified dispersion. The common characteristic of the eliminated names is that they relied on beta-type growth from user growth or consumer electronics cycles, rather than generating shareholder returns through cash flow, dividends or IP compounding. Meanwhile, among the new positions, the replacement of Tokyo Electron for Rohm deserves special attention — both are in the semiconductor supply chain, but Tokyo Electron sits upstream in equipment capex and benefits from the certainty of global AI infrastructure buildout, while Rohm depends more on downstream automotive and industrial demand. This shift suggests the investment manager believes "shovel sellers" have stronger earnings visibility than "gold diggers" in this AI cycle.
IV. Political Economy Associations: Exposure to a "Policy-Dependent Bull Market" Under the Takaichi Administration
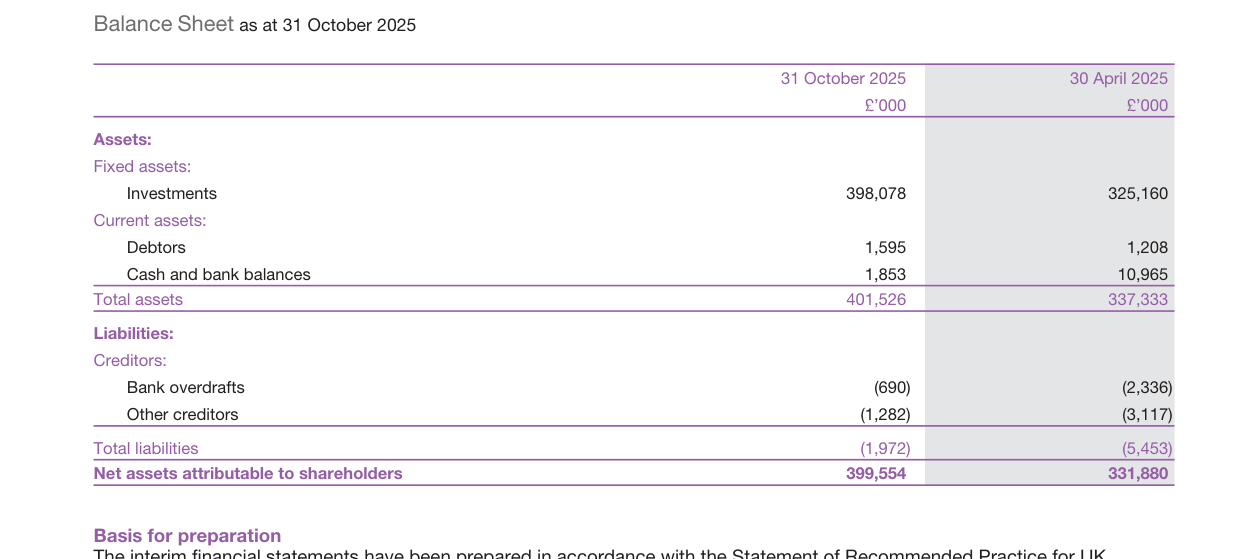
Weekly US initial jobless claims; ranging between 200,000 and 250,000 over the past year
The report lists the "rice crisis" and the change of government driven by real income pressure, the appointment of the first female prime minister, Sanae Takaichi, and the resulting expectations of fiscal stimulus as drivers of new market highs. This causal chain hides a vulnerability that is easy to overlook: part of the current market momentum relies on policy expectations rather than purely organic corporate growth.
Takaichi's rise could indeed bring structural fiscal easing; her advocacy of aggressive fiscal and accommodative monetary policy during the LDP presidential election has already established market expectations. But before that, the lag in policy transmission to the real economy and the actual scale of fiscal stimulus may fall short of expectations — with easing expectations already priced in, once the budget package size disappoints, the risk of a fading political dividend should not be underestimated. In addition, Takaichi's previous statements on monetary policy carried hawkish overtones, and the Bank of Japan actually advanced interest rate normalization in the second half of 2025 (the report acknowledges "rising interest rates" as a negative factor). If fiscal stimulus drives a wage-price spiral, the path of accelerated central bank rate hikes could in turn suppress equity valuations. This tension between "fiscal expectations and monetary reality" is one of the biggest downside risks to the Japanese beta component of this fund's positions.
To be fair, the report's discussion of governance reform and structural market transformation is directly supported by data: authorized buybacks had exceeded ¥10.5 trillion as of June, a record for the period. This indicates that corporate capital allocation logic is shifting from balance-sheet hoarding toward shareholder returns. In this sense, the medium-to-long-term structural uptrend in the Japanese market has some fundamental support. But "structural reform" narratives often take years to translate into earnings growth, and the investment manager, bound by the constraint of the five-quintile short-term target return, must still contend with relative performance pressure every quarter.
V. Additional Implications of Adding to Unicharm: A "Hidden Bet" on China's Consumption Recovery
Unicharm appears in the Largest Purchases (12.26 million pounds) while also being a performance detractor. The report's stated logic for adding is "below its historical valuation range, with structural growth in Asian adult incontinence and feminine care." Objectively, however, Unicharm's growth bottleneck in recent years is directly related to declining birth rates and weak consumption in China. Adding at the current juncture implicitly reflects the investment manager's optimistic judgment on a cyclical recovery in China's consumer market — a directional divergence from the market's prevailing caution over China's economic slowdown.
This is an interesting contrarian view, but the supporting evidence is not yet sufficient. Whether China's structural consumption weakness can reverse within the next two to three years still depends on multiple variables, including employment, the property market and household income expectations. If this judgment proves wrong, Unicharm — at roughly 2%-3% of the portfolio — would become an additional drag relative to the index. That said, from a valuation perspective, Unicharm's price-to-earnings ratio has fallen to the low end of its historical range, and its adult incontinence products have long-term demand resilience in Asia-Pacific markets where population aging continues to deepen. The expected return on this add is positive, but it requires sufficient holding patience to await signs of stabilization in the China business.
Global commodity price index; up 4% in 2024 versus the same period in 2023
VI. Summary Perspective: A Second Transformation from "Internet Narrative" to "Japan Restructuring"
The combined signals from portfolio changes in this reporting period indicate that the Baillie Gifford Japanese Fund is undergoing a notable strategic evolution: shifting from simply pursuing the internet innovation premium toward a greater focus on value-release opportunities under "Japanese corporate restructuring" — whether it is Sega Sammy's IP monetization, Sony Financial Holdings' spin-off independence, SBI Holdings' banking ecosystem consolidation, or even SoftBank's strategic investment in OpenAI, the common thread is that Japanese companies are shaking off balance-sheet inertia and creating real shareholder returns through improved capital allocation efficiency.
If successful, this shift could improve the fund's alpha over the next three to five years — because the market-cap-weighted characteristics of the TOPIX index mean the index itself lags in capturing this structural change. The fund's objective is to outperform the index by at least 1.5% per annum over rolling five-year periods, and as of October 2025, there remains a gap of approximately 10 percentage points (cumulative over five years) to close. Given that more than 15% of the fund is currently concentrated in AI and fintech themes, and the beta rally of the past six months has already contributed significantly to the mainstream holdings, future tracking should focus on whether the portfolio's alpha can truly be released if the market enters a phase of momentum decay.
I. Industry Allocation Changes: Manufacturing Weight Further Strengthened
As of 31 October 2025, the fund's industry distribution showed notable adjustments relative to the half-year report (30 April 2025). Manufacturing rose from 46.63% to 48.51%, continuing to dominate the portfolio; finance and insurance rose from 14.04% to 14.98%; and information technology went from zero to 0.58%. Meanwhile, services (13.20% → 11.74%), commerce (4.10% → 3.49%) and real estate (3.04% → 2.61%) all contracted.
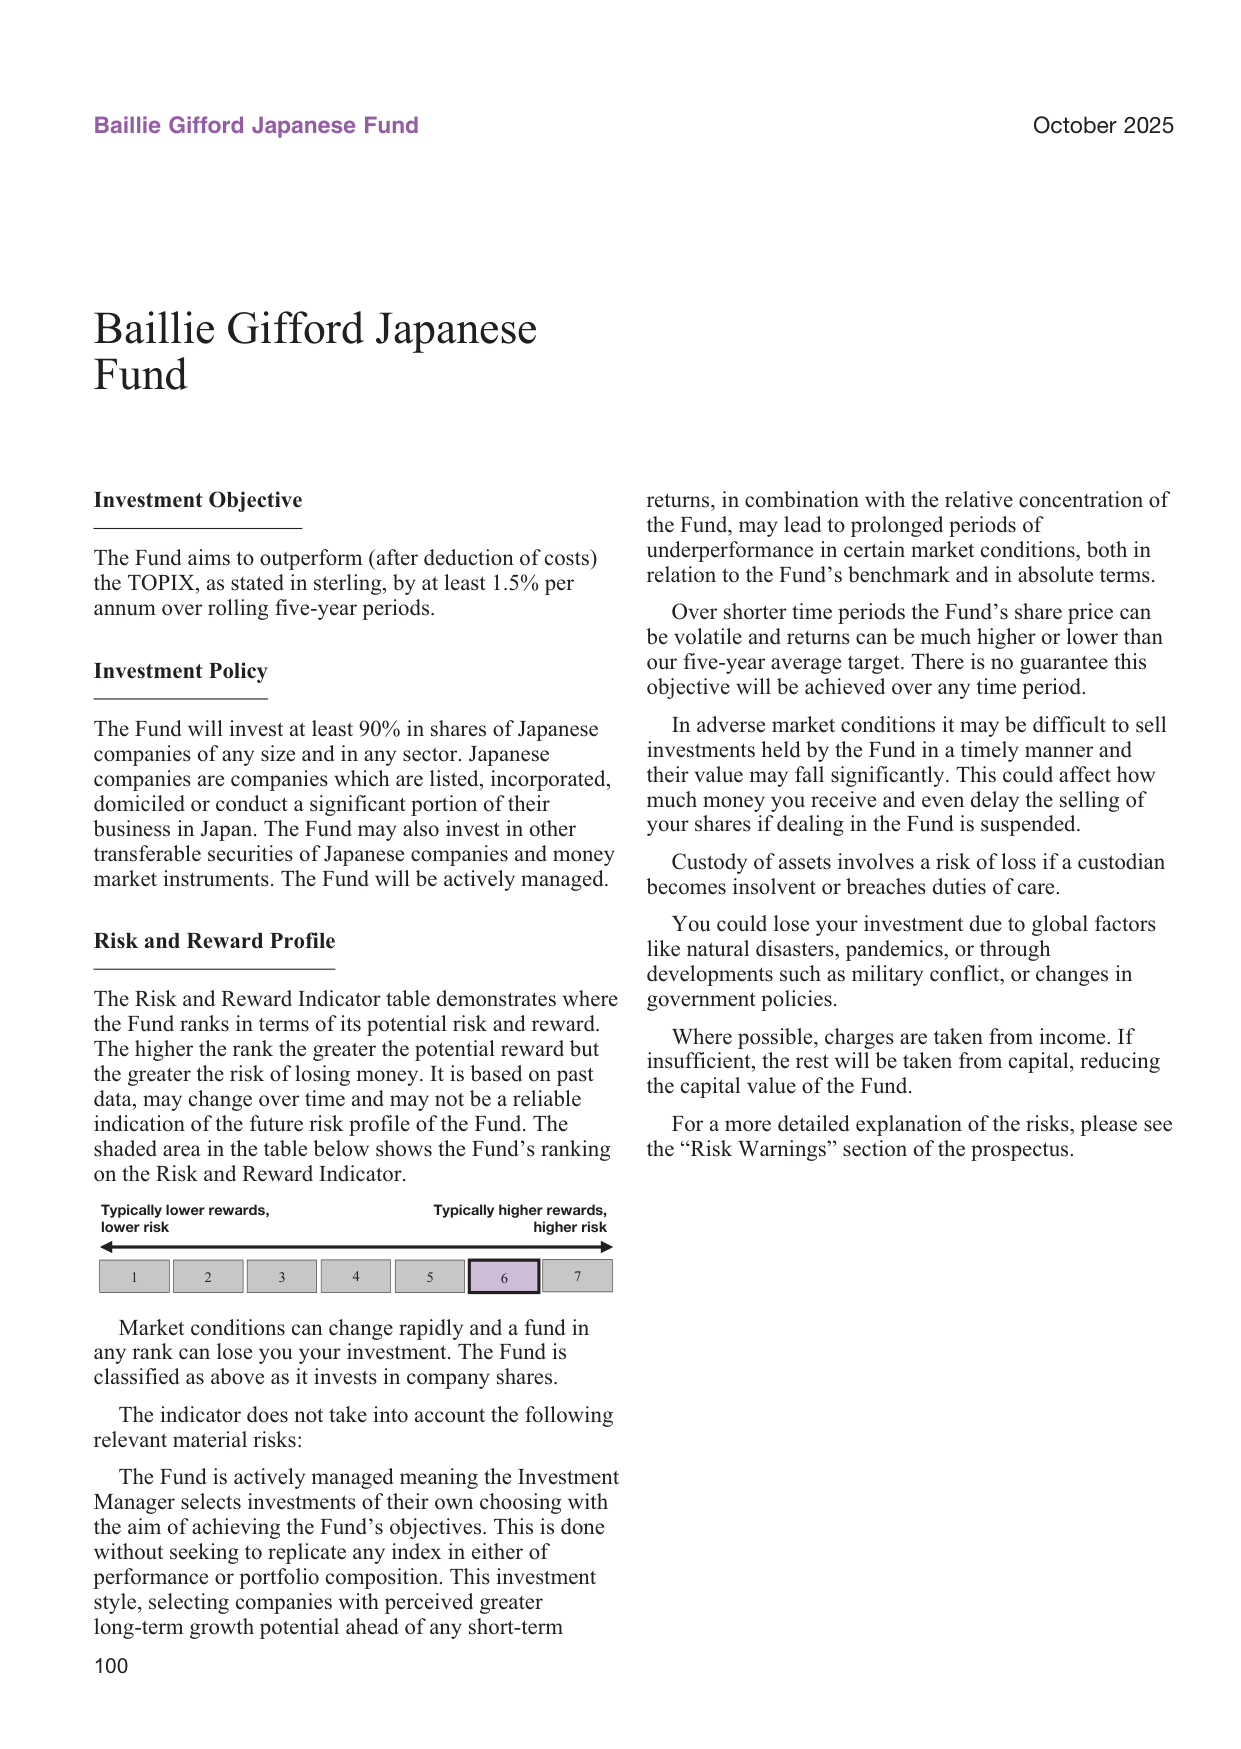
US corporate cash holdings as a share of assets; down from 12% in 2020 to 8% in 2024
| Industry | 31 Oct 2025 Weight | 30 Apr 2025 Weight | Change (pp) |
|---|---|---|---|
| Manufacturing | 48.51% | 46.63% | +1.88 |
| Finance & Insurance | 14.98% | 14.04% | +0.94 |
| Transport & Communications | 15.60% | 15.84% | -0.24 |
| Services | 11.74% | 13.20% | -1.46 |
| Commerce | 3.49% | 4.10% | -0.61 |
| Real Estate | 2.61% | 3.04% | -0.43 |
| Health Care | 1.15% | 1.23% | -0.08 |
| Information Technology | 0.58% | 0.00% | +0.58 |
| Industrials | 0.36% | 0.39% | -0.03 |
The increase in manufacturing weight did not come from new large positions but from existing core holdings whose share prices rose markedly faster than other sectors over the six months. For example, Nintendo (+3.17%), Sony (3.75%), Keyence (2.12%) and SMC (2.38%) all recorded double-digit percentage gains. The new addition of Money Forward (0.58%) filled the gap in the information technology sector, reflecting the fund's interest in financial SaaS.
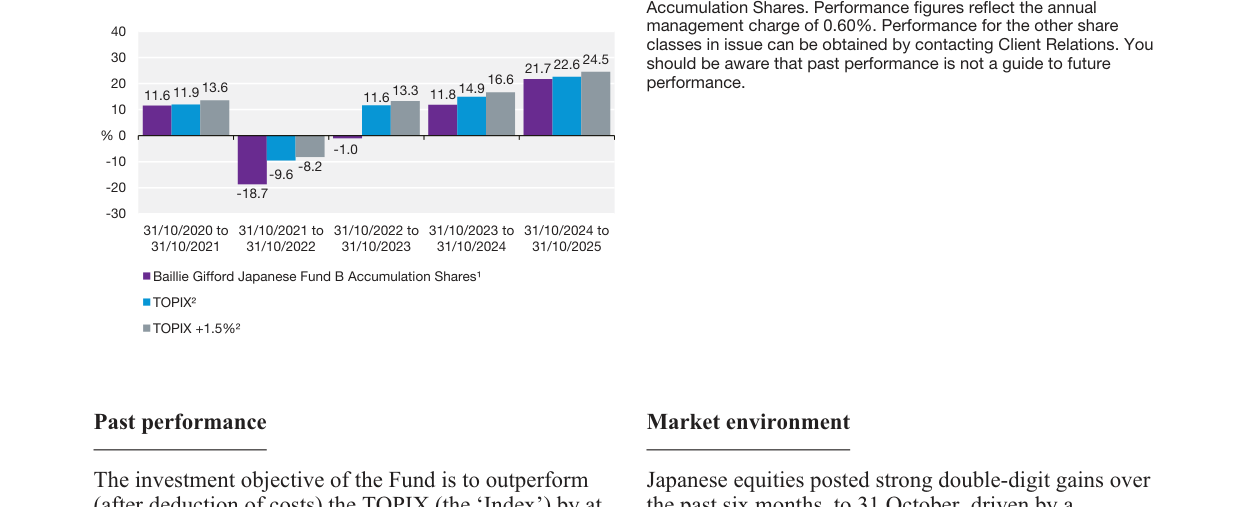
Global trade fragmentation index; up 15% since 2018
II. Top-Ten Holdings: Concentration and Style Characteristics
Ranked by market value, the top ten holdings together account for approximately 44% of total assets. SoftBank Group ranks first with an 8.87% weight, with a single holding market value of £101.7 million; SBI Holdings and Sumitomo Mitsui Trust rank second and third.
| Rank | Stock | Industry | Weight (%) |
|---|---|---|---|
| 1 | SoftBank Group | Transport & Communications | 8.87 |
| 2 | SBI Holdings | Finance & Insurance | 5.64 |
| 3 | Sumitomo Mitsui Trust | Finance & Insurance | 4.96 |
| 4 | Rakuten | Services | 4.76 |
| 5 | Sony | Manufacturing | 3.75 |
| 6 | CyberAgent | Services | 3.61 |
| 7 | Nintendo | Manufacturing | 3.17 |
| 8 | GMO Internet | Transport & Communications | 3.16 |
| 9 | Bridgestone | Manufacturing | 2.54 |
| 10 | FANUC | Manufacturing | 2.52 |
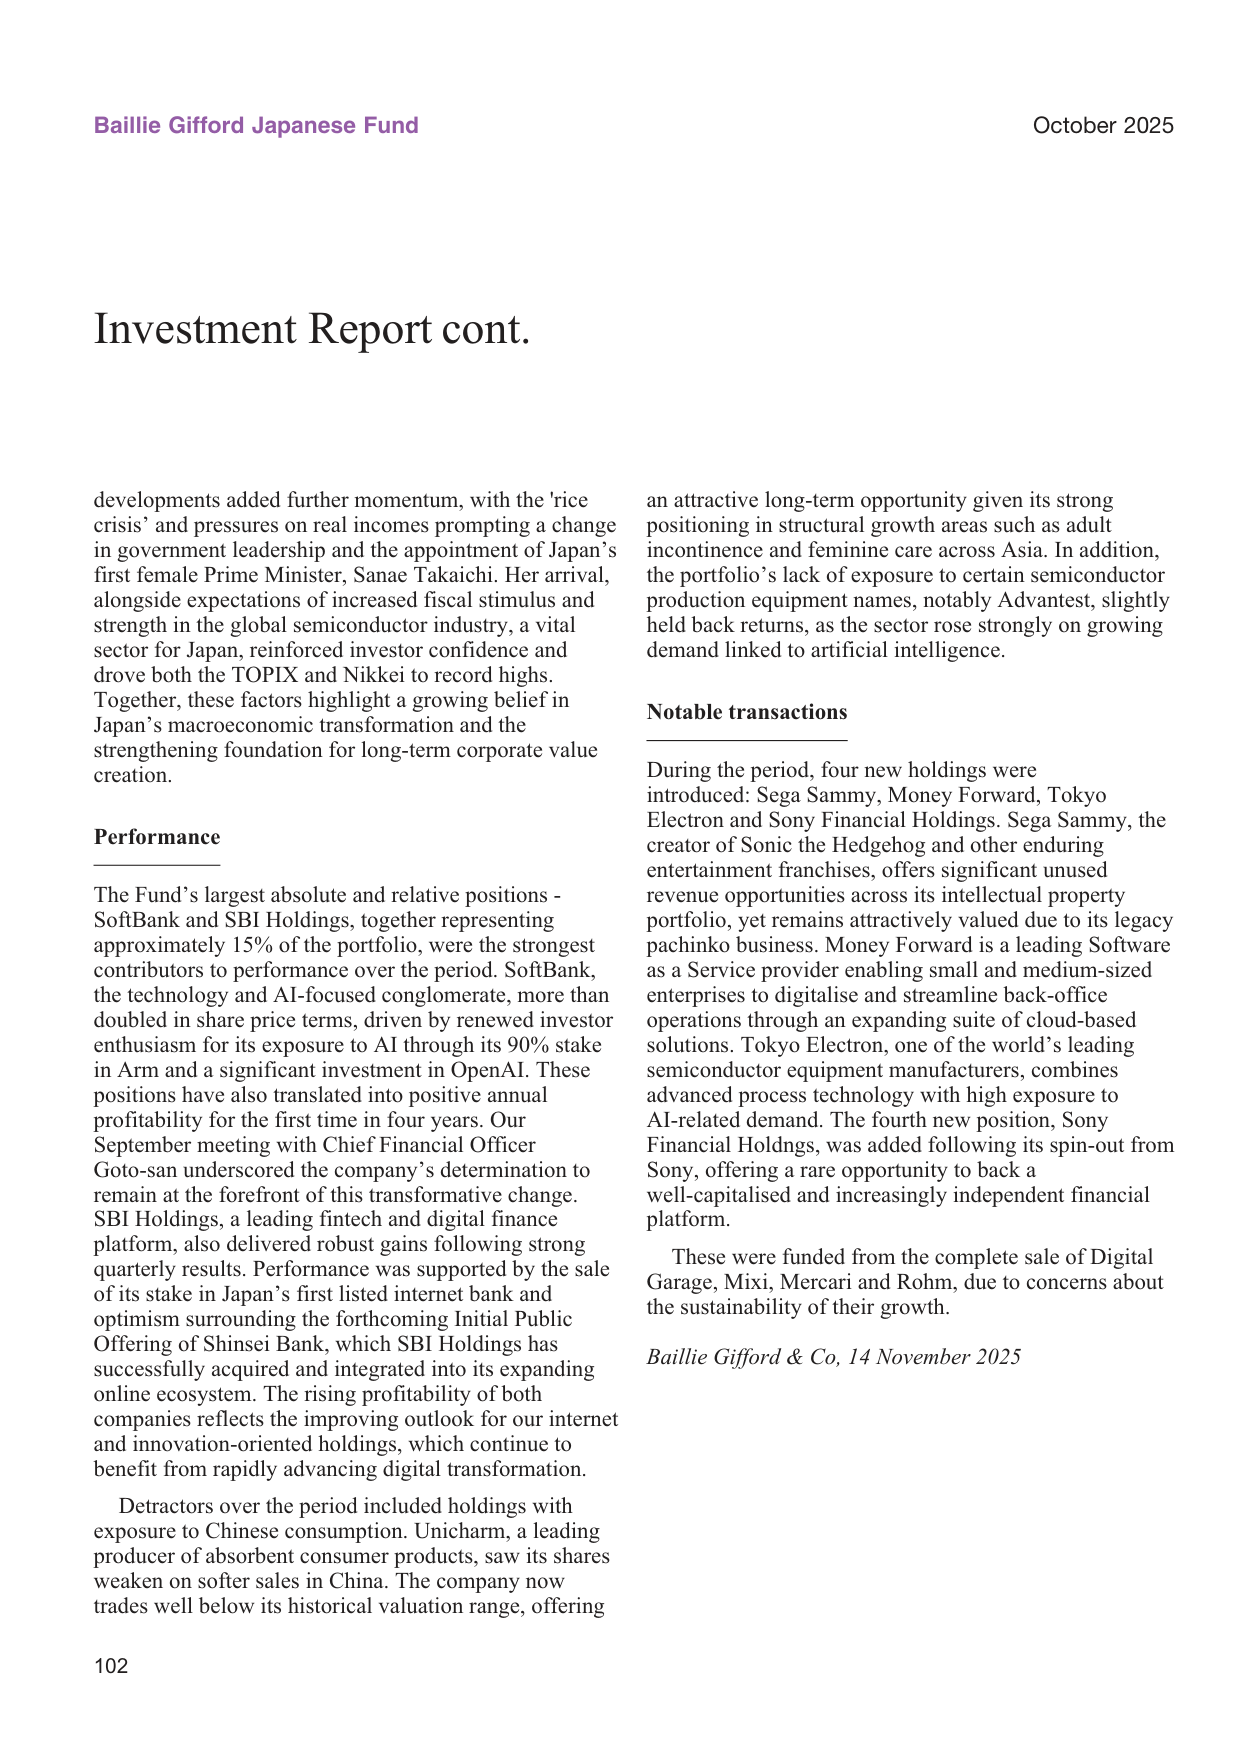
US versus EU regulatory burden index; the EU index is 20% higher than the US
The top ten holdings display a clear "technology + finance" dual mainline: SoftBank Group, GMO Internet and CyberAgent represent internet and AI investment; SBI, Sumitomo Mitsui Trust and Rakuten cover fintech and digital payments; Sony and Nintendo are leaders in entertainment hardware and content; FANUC and Bridgestone represent high-end manufacturing. This combination benefited significantly in the second half of 2025 from the Japanese market's "AI narrative + yen depreciation benefiting exporters" backdrop.
It is worth noting that SoftBank Group's weight may have increased from six months earlier (the half-year breakdown is not shown in this report, but by absolute market value it is the largest holding). The stock rose steadily, driven by Arm Holdings, contributing an important part of the portfolio's appreciation.
III. Portfolio Changes: Money Forward Added; Core High-Conviction Holdings Retained
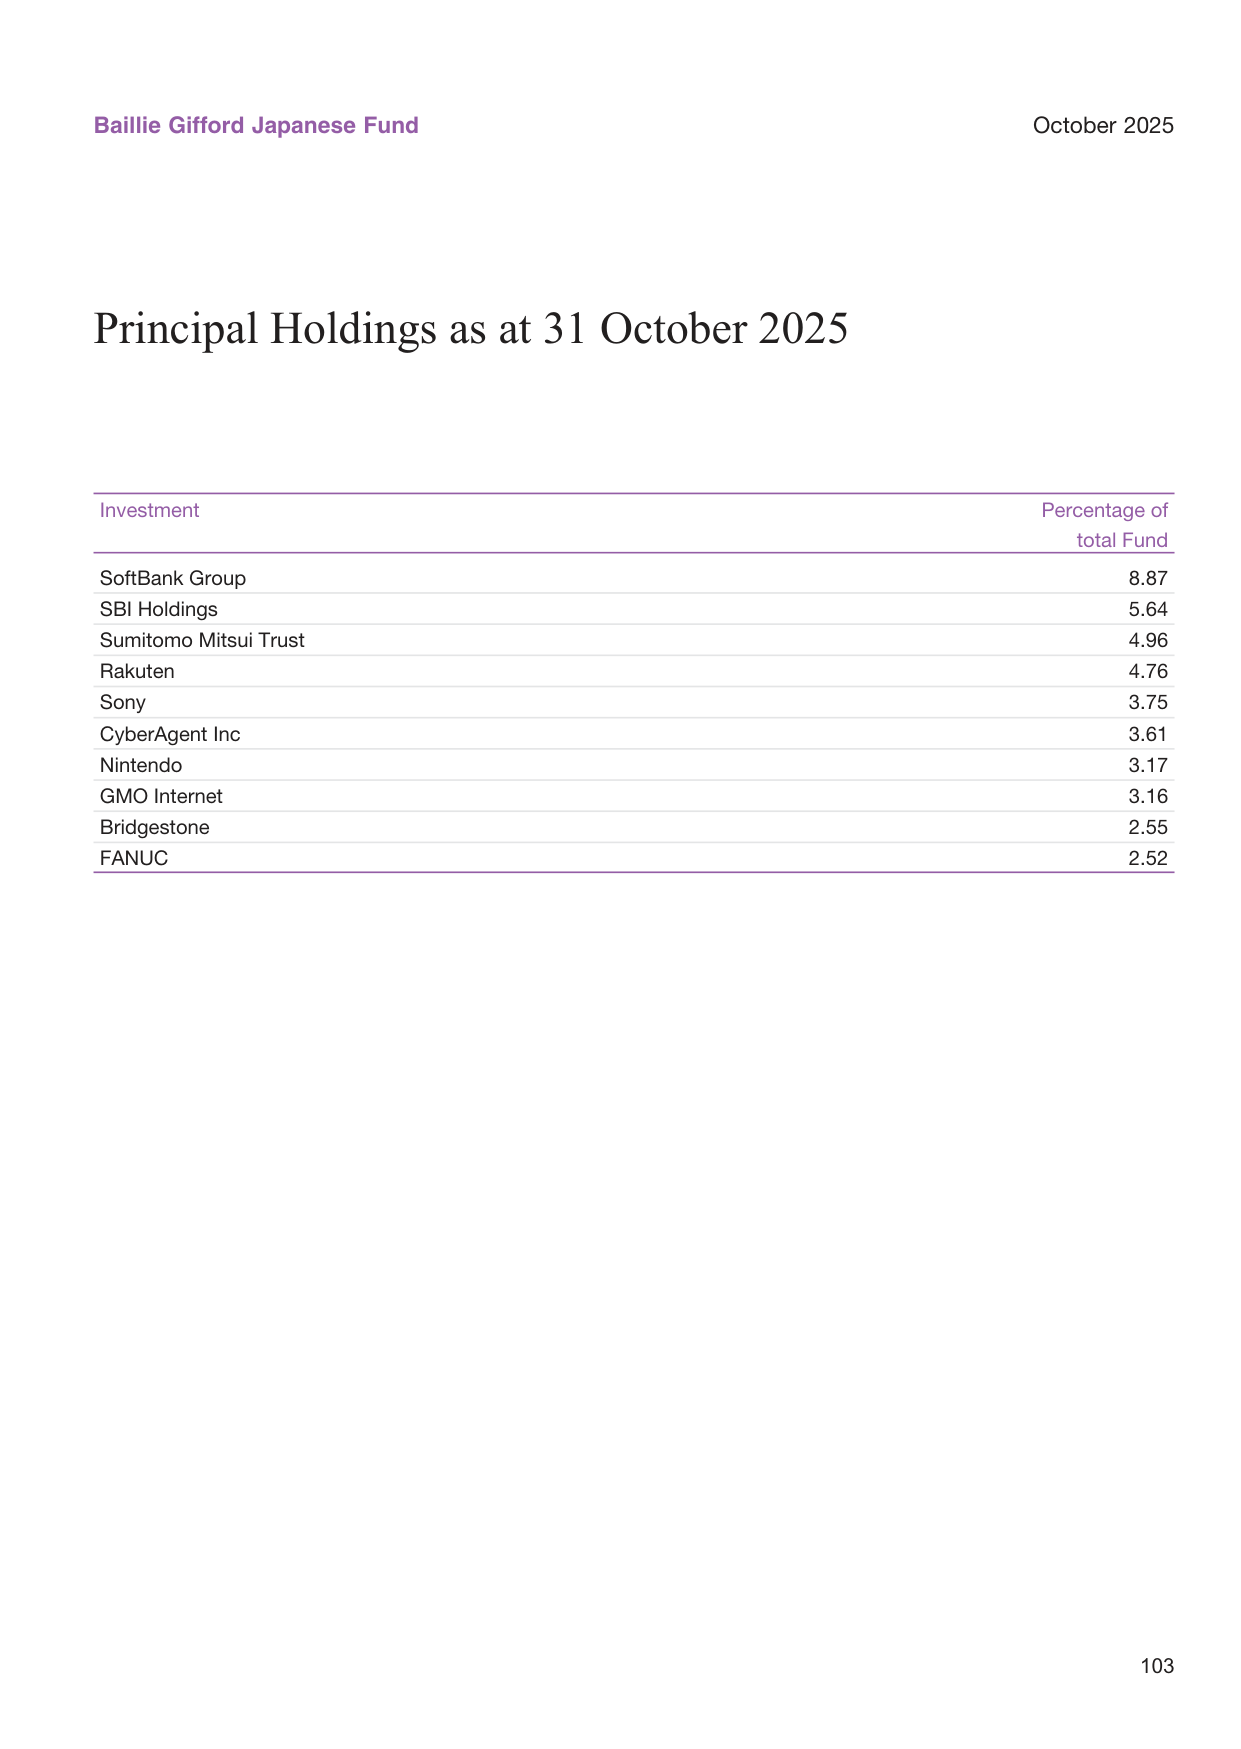
Global technology hardware sales; reaching US$2.5 trillion in 2024
The only clear "new face" in this report is Money Forward (financial SaaS), with 299,100 shares held, a market value of £6.65 million and a weight of 0.58%. This continues Baillie Gifford's long-term positioning in Japan's digital transformation, consistent with management's earlier view favoring fintech infrastructure.
Existing core holdings such as SBI Holdings (5.64%), Sumitomo Mitsui Trust (4.96%), Rakuten (4.76%) and CyberAgent (3.61%) all maintained significant weights, with no obvious signs of reduction. By contrast, the overall decline in the services sector weight likely reflects relatively lagging share prices rather than active liquidation.
IV. Interim Results: Capital Gains Dominate; Dividend Income Weakens
In the six months from 30 April 2025 to 31 October 2025, the fund achieved net capital gains of £188.77 million, plus net income of £6.99 million, for a total return of £195.48 million — nearly six times the £29.09 million in the same period of 2024.
| Item | 31 Oct 2025 (£'000) | 31 Oct 2024 (£'000) |
|---|---|---|
| Net capital gains | 188,766 | 21,438 |
| Revenue | 10,712 | 12,800 |
| Expenses | (2,651) | (3,480) |
| Net revenue after taxation | 6,991 | 8,041 |
| Total return before distributions | 195,757 | 29,479 |
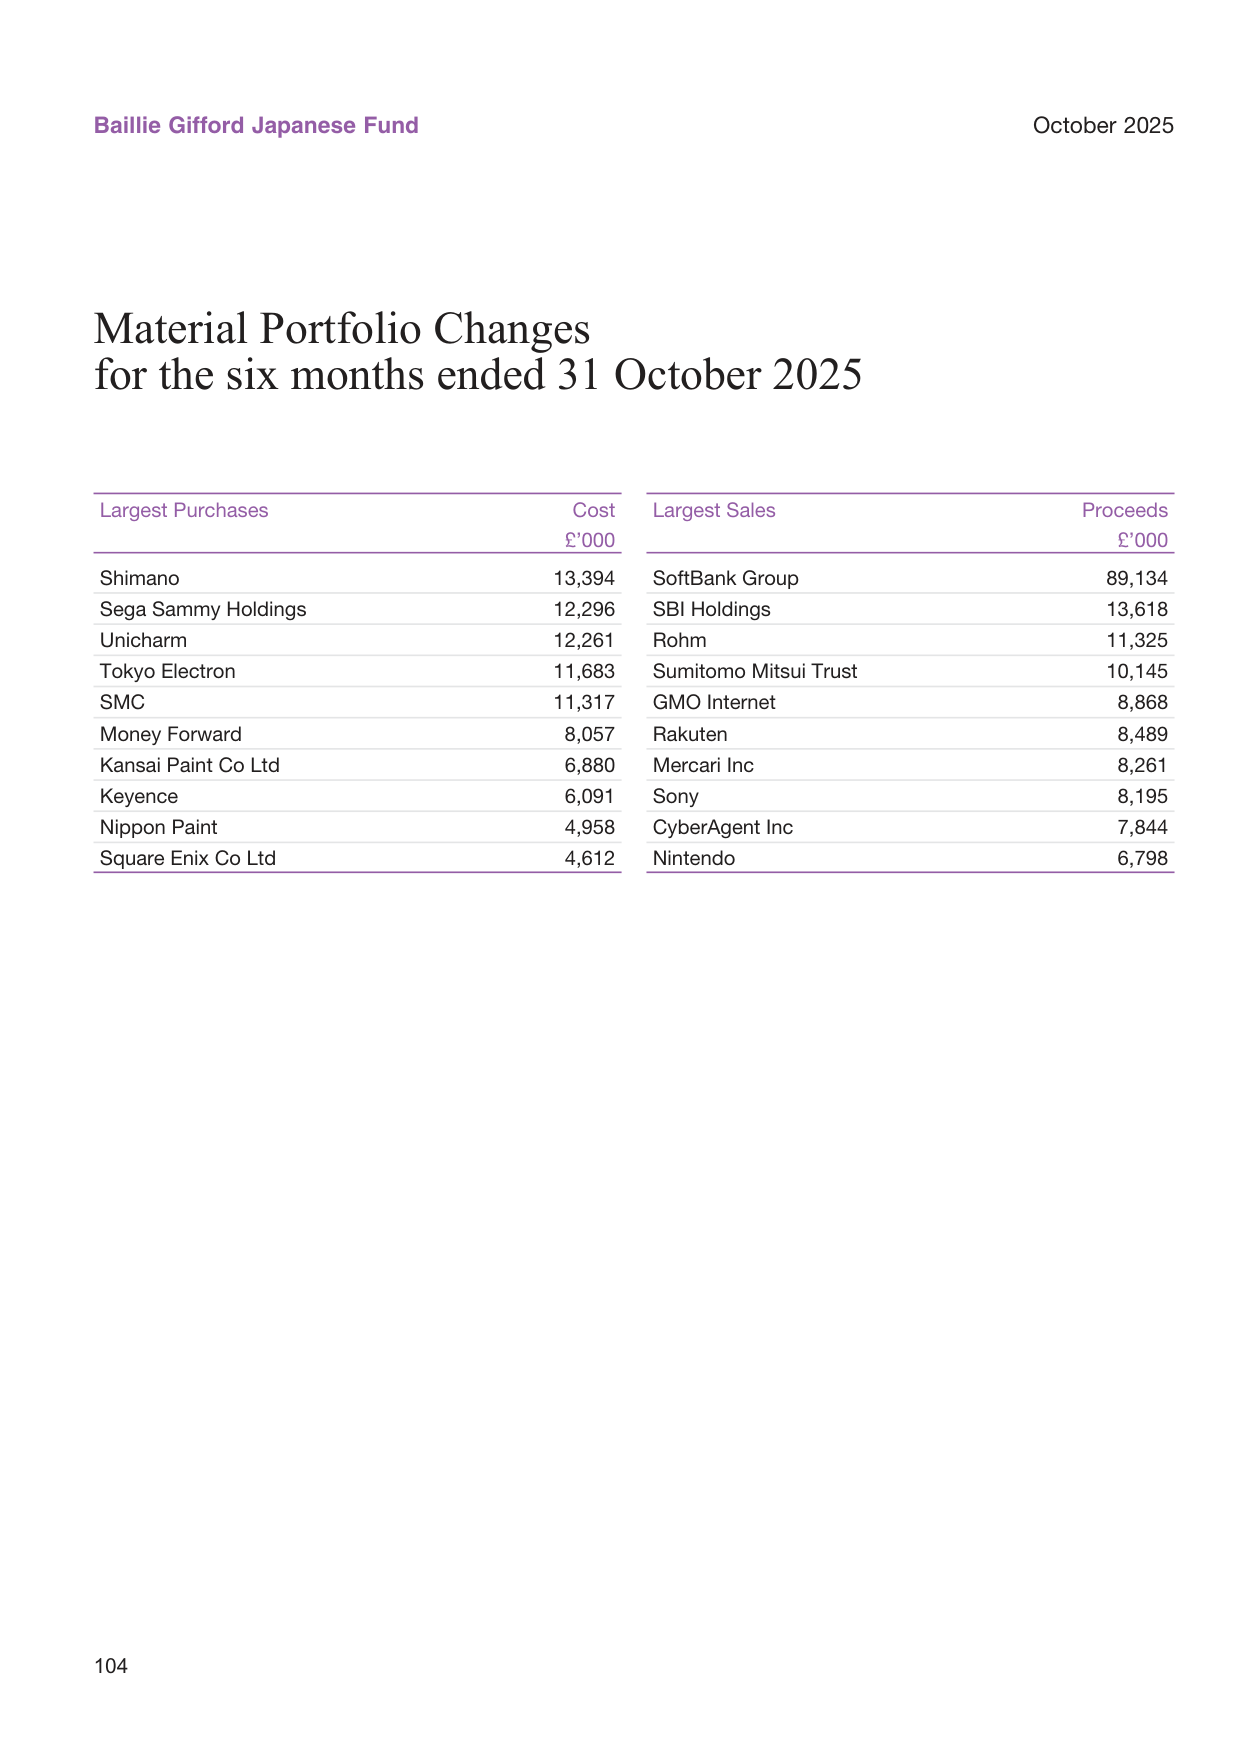
Projected US baby boomer wealth transfer; approximately US$84 trillion expected to be transferred between 2024 and 2044
The explosive growth in capital gains clearly came from the strong rise in Japanese equities. During the period, the Nikkei 225 hit record highs, with semiconductors, financials and machinery leading gains, and the fund's heavily weighted manufacturing (48.5%) and financial (15%) sectors were precisely among the biggest winners.
However, the income side declined: revenue fell from £12.80 million to £10.72 million, a decrease of 16.3%. This could stem from dividend cuts at some holdings, or from the fund selling low-yielding assets at elevated prices and instead holding more capital-appreciation-oriented stocks. Net income of only £6.99 million contributed less than 4% of total return.
V. Capital Flows: Massive Redemptions and Rising NAV Offset Each Other
The fund experienced large-scale redemptions during the reporting period. The Statement of Change in Net Assets shows:
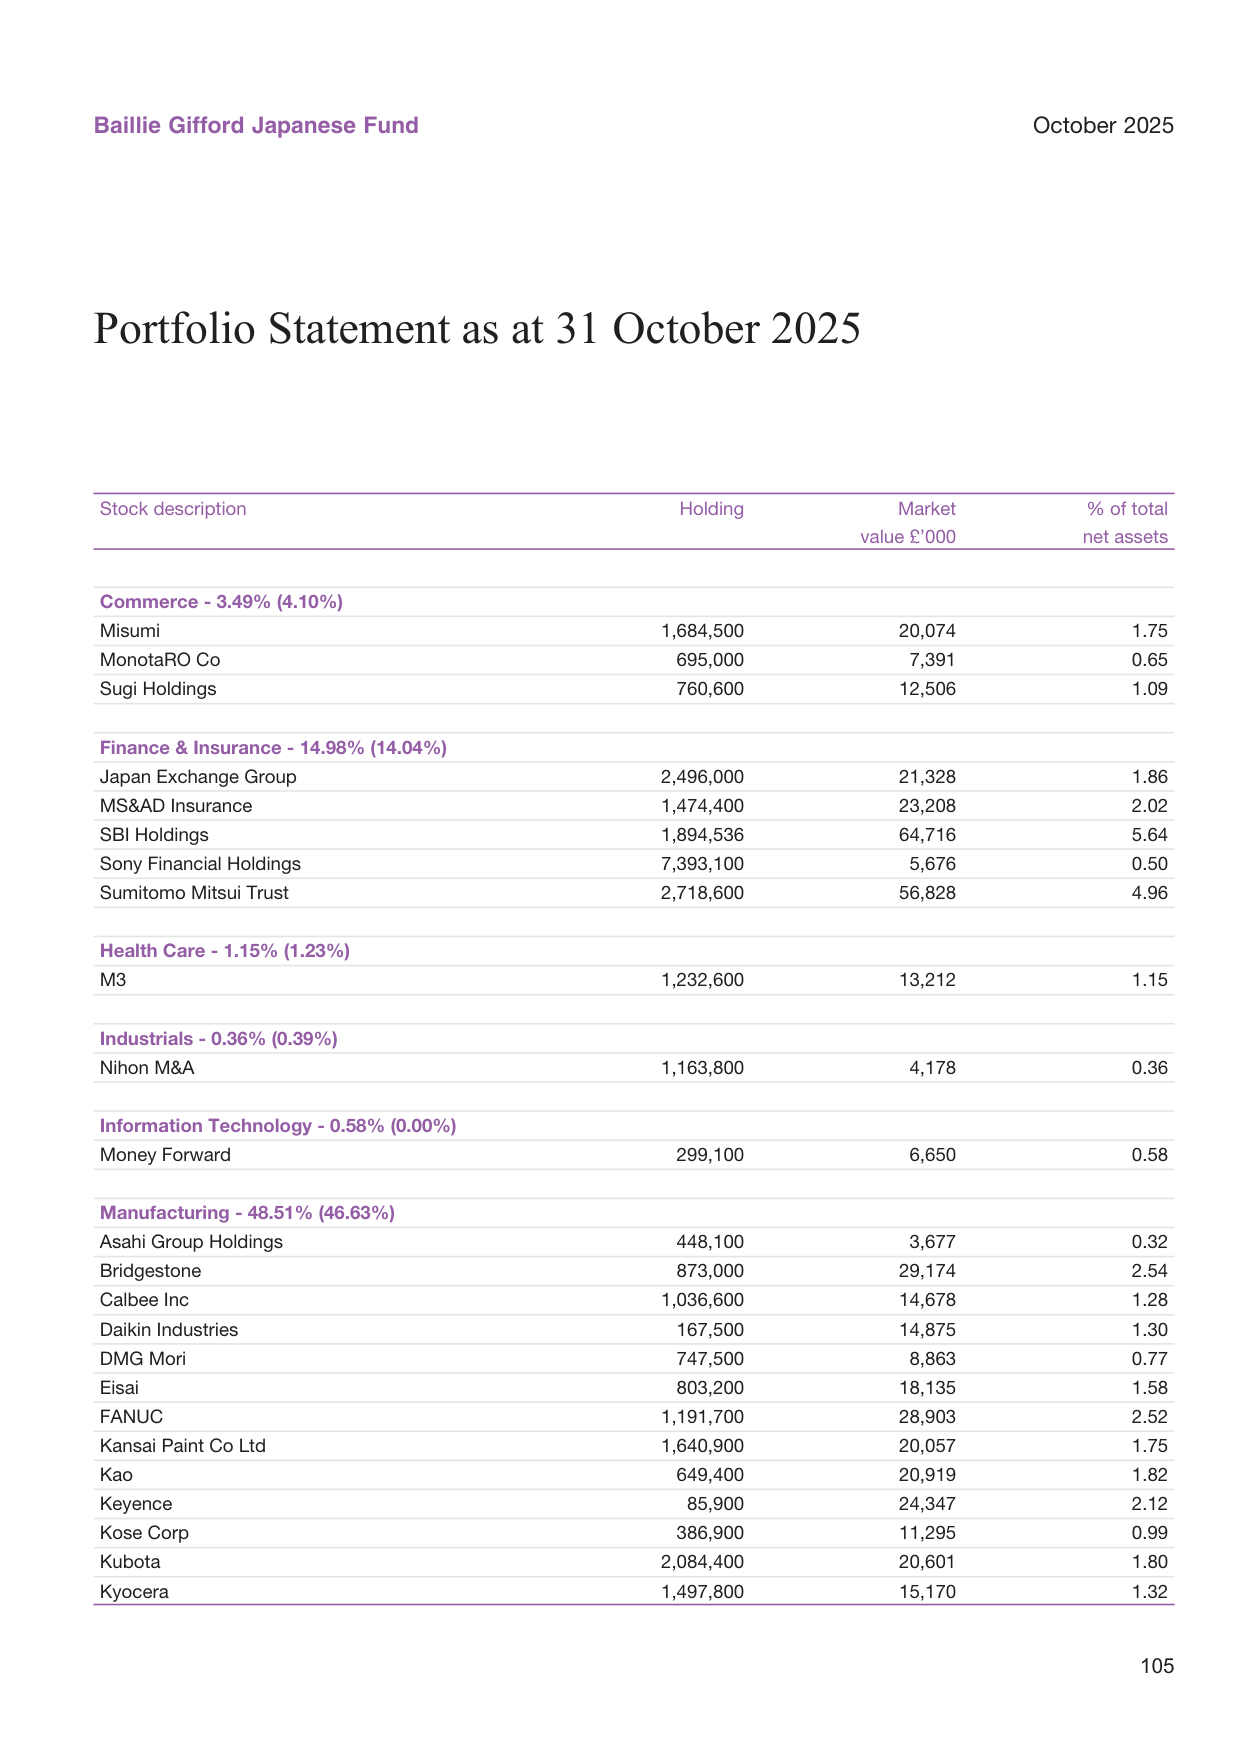
Patent applications by country; China accounted for 45% of global filings in 2024
- Issuance income: £9.178 million
- Redemption payments: -£199.94 million
- Net redemptions: -£190.77 million
Despite the huge redemption amount, the fund's total assets only edged up from £1,142 million to £1,147 million (+0.4%), indicating that the £195.5 million investment return during the period completely absorbed the negative impact of redemptions. Excluding the market rally, the fund actually shrank by approximately 16.7%.
| Item | 31 Oct 2025 (£'000) | 31 Oct 2024 (£'000) |
|---|---|---|
| Opening net assets | 1,141,966 | 1,559,100 |
| Net issue/cancellation | (190,766) | (261,585) |
| Investment activities | 195,476 | 29,088 |
| Closing net assets | 1,146,789 | 1,326,803 |
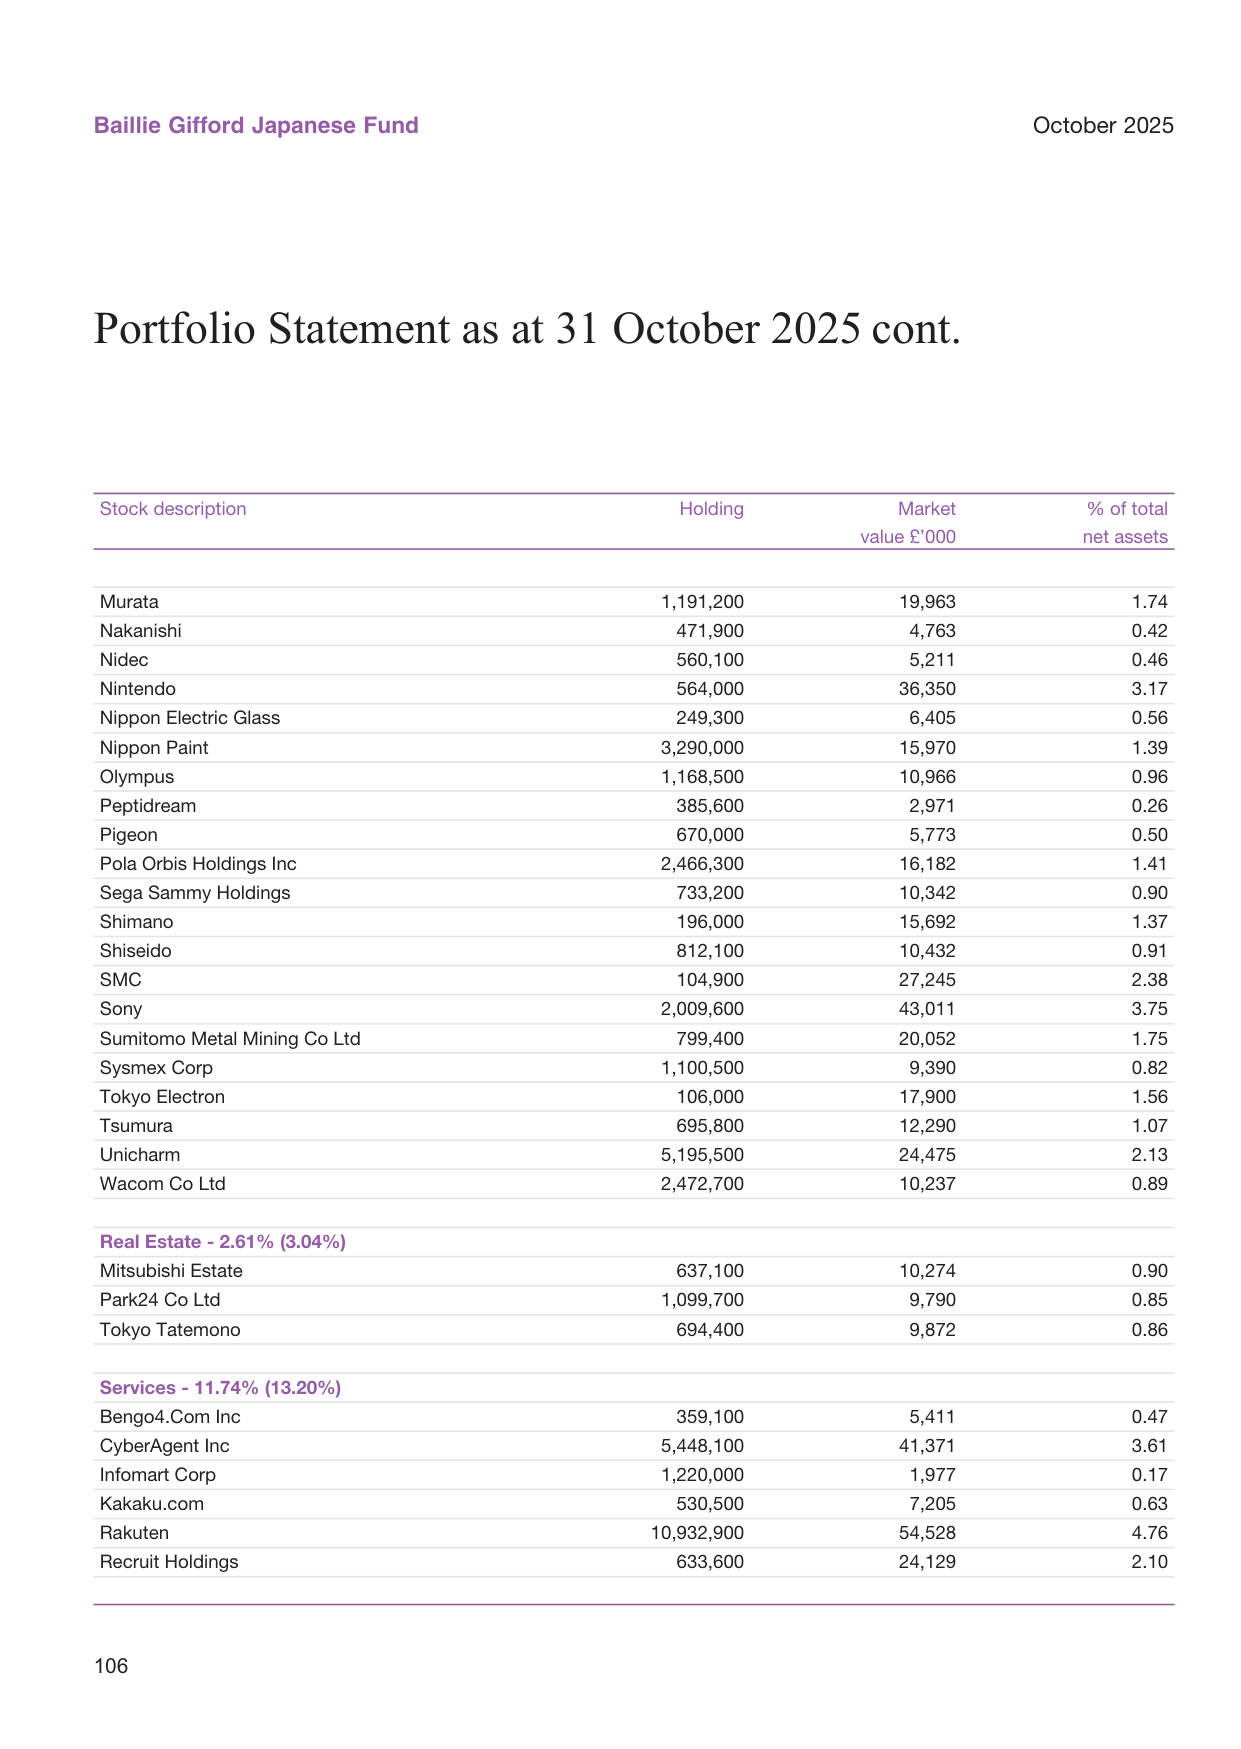
Outstanding US student loan debt; reaching US$1.7 trillion in 2024
It is worth noting that net redemptions in the same period of 2024 were £261.59 million, and this year they were again close to £190 million, indicating that investors have been leaving continuously over the past year and a half. Possible reasons include: the fund's size falling from £2.61 billion in April 2023 to £1.15 billion, investors locking in profits after gains, or caution about the outlook for Japanese equities.
VI. Balance Sheet and Liquidity: Cash Reserves Reduced; Redemptions Met Through Position Liquidation
As of 31 October 2025, the fund held £4.466 million in cash and bank deposits, down sharply by 60% from £11.221 million at 30 April 2025. Meanwhile, bank overdrafts moved from -£7.076 million to zero, and other liabilities increased from -£2.357 million to -£5.251 million. This suggests the fund drew on part of its cash reserves when facing redemptions, and may have met redemption demand by selling positions rather than taking on new borrowing.
The total value of investments in fixed assets rose from £1,124.55 million to £1,135.52 million, an increase of only 1%, far smaller than the overall portfolio's capital appreciation rate. This is noteworthy: if holdings' market values rose substantially while the total investment value increased only slightly, it implies the fund sold a considerable number of shares to meet redemptions, while the retained holdings rose in market value. In fact, the net increase in total investment value was approximately £1.097 million, while capital gains were £188.77 million, implying the fund net sold approximately £187.68 million of holdings (a rough calculation). This is highly consistent with the £190.77 million of net redemptions — meaning the fund retained almost no extra cash and converted positions directly into redemption payments.
VII. Share Classes and Fees: Class C Fee Maintained at 0.03%; Effective Rate for Class W3 Raised
NAVs for all share classes rose approximately 18-19% over the six months. Class C accumulation performed best, rising from 2,241.73p to 2,669.97p (+19.1%), Class B rose 18.7%, and Class A 18.2%. The gap between high and low prices reflects considerable market volatility; for example, the Class B accumulation share ranged from 1,910p to 2,293p, an amplitude of about 20%.
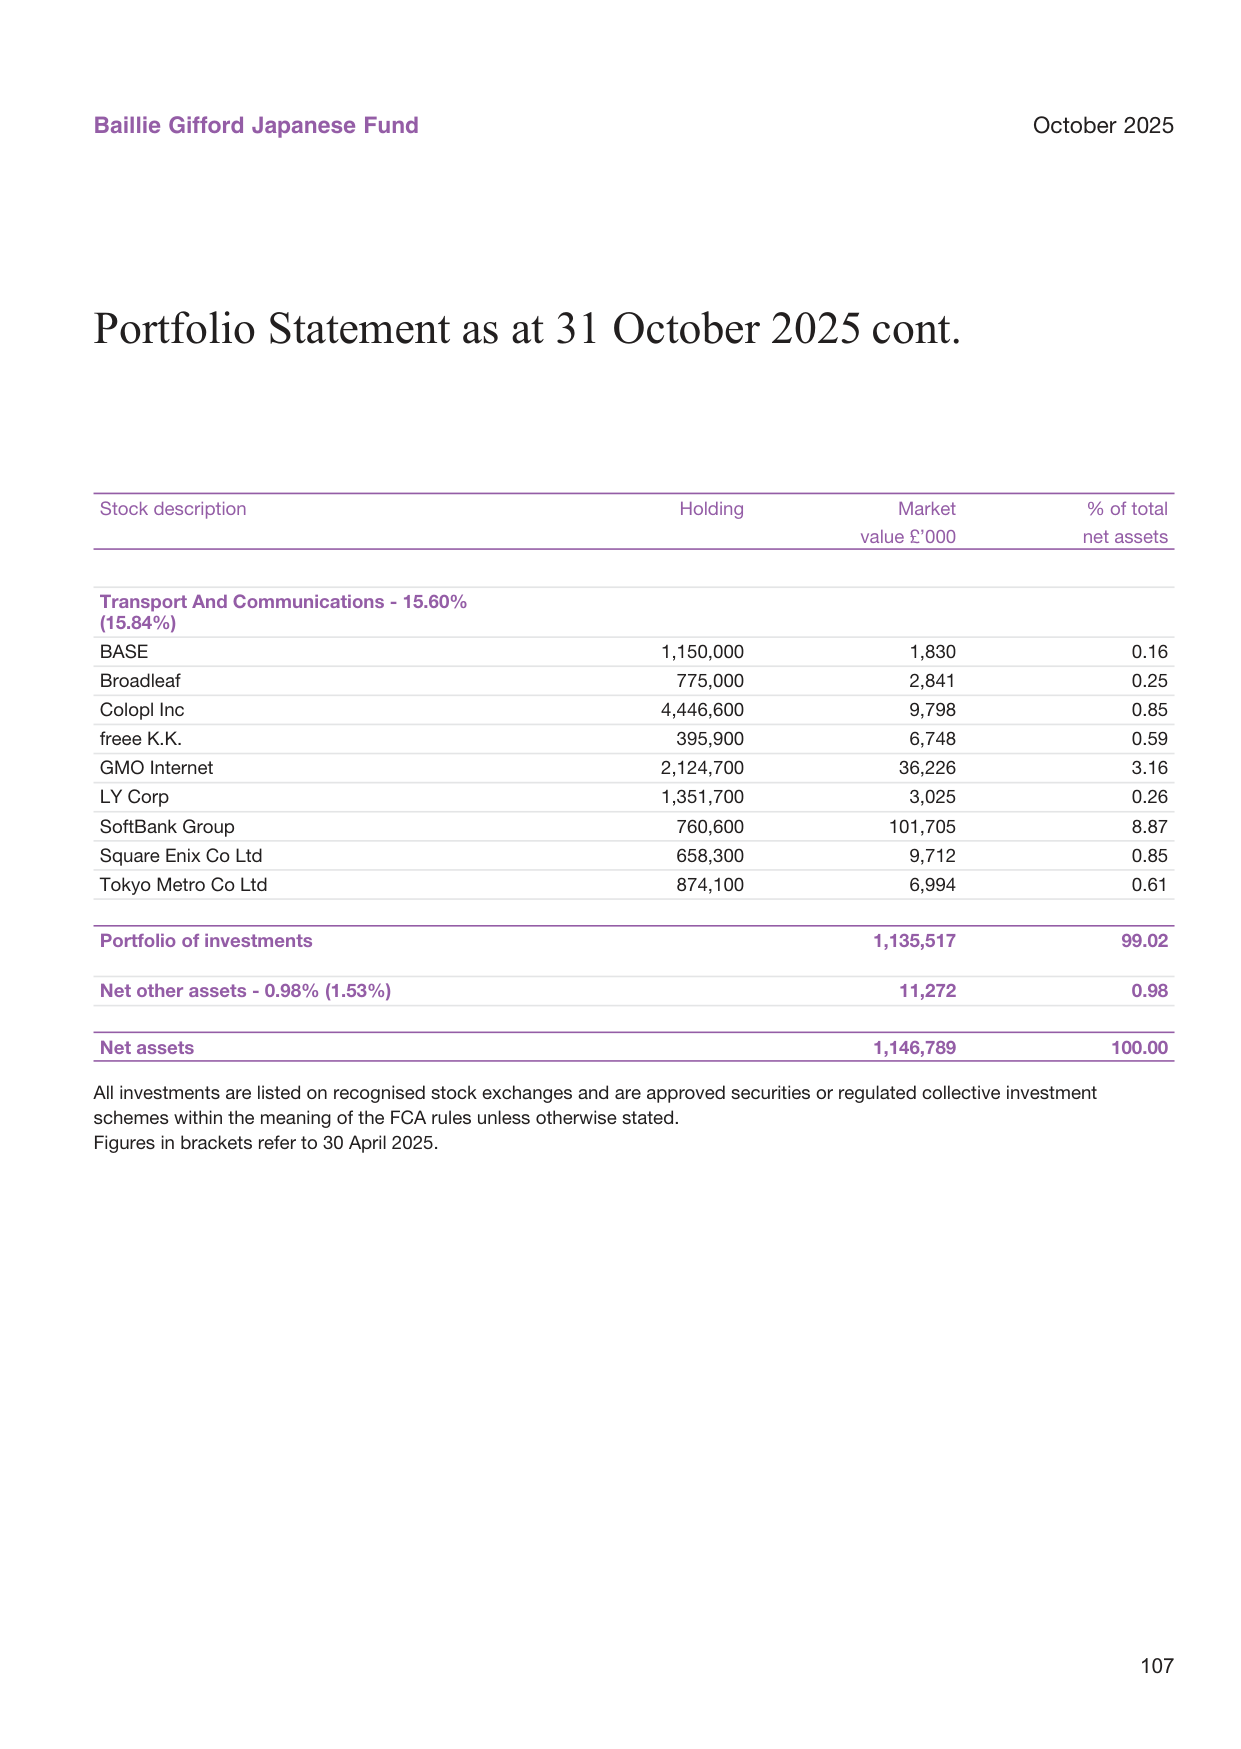
Global insurance premium growth; real growth of 3.5% in 2024
On fees, Class C shares continue to enjoy the lowest Ongoing Charges Figure (0.03%), W1, W3 and W6 range between 0.49% and 0.59%, and Class A is at 1.48%. Notably, the ACD believed as of 31 October 2025 that 0.63% was a more realistic fee rate for W3 than the 0.593% shown in the report. This may reflect additional administrative expenses incurred by the W3 class during the six months. Overall, fees across the fund's share classes remained stable, with no significant increase.
VIII. Key Observations and Risk Notices
1. High concentration in a few stocks: The top ten holdings represent 44% of the portfolio, and SoftBank Group alone accounts for nearly 9% — a single stock's volatility has an outsized impact on the portfolio. If the AI narrative cools and SoftBank's valuation corrects, the fund's NAV will face significant pressure.
2. Increased industry concentration: Manufacturing accounts for nearly half of the portfolio, and within it, concentration is heavy in semiconductor equipment (Tokyo Electron, Keyence), industrial automation (FANUC, SMC) and consumer electronics (Sony, Nintendo). The beta is highly tied to both "Japan's manufacturing recovery" and the "global technology cycle."
3. Thin income support: Net income of only £6.99 million implies a dividend yield of under 0.6%, meaning the fund relies almost entirely on capital appreciation to drive returns. In a bear market, there is no dividend buffer.
4. Persistent redemption pressure: Net redemptions exceeded £190 million in two consecutive half-year periods. Although net assets have stabilized due to the market rally, if the redemption trend continues, the fund may be forced to sell holdings at unfavorable times, harming remaining investors.
5. Very low cash buffer: Cash and equivalents represent only 0.39% of total assets, leaving a thin liquidity cushion against potential large redemptions. The rise in "other creditors" on the balance sheet to £5.25 million also reflects increased short-term payment obligations.
Overall, the Baillie Gifford Japanese Fund delivered an impressive capital return in the second half of 2025, but it was essentially a "victory of high beta" — the portfolio is highly exposed to the hottest sectors of the Japanese equity market. At the same time, the large-scale exit of institutional money and the low dividend yield mean the fund's long-term sustainability still requires scrutiny. For new investors, concentration risk and liquidity risk are preconditions that cannot be ignored.
The Data Truth Behind the "Turning Point" Narrative and an Interpretation of Portfolio Logic
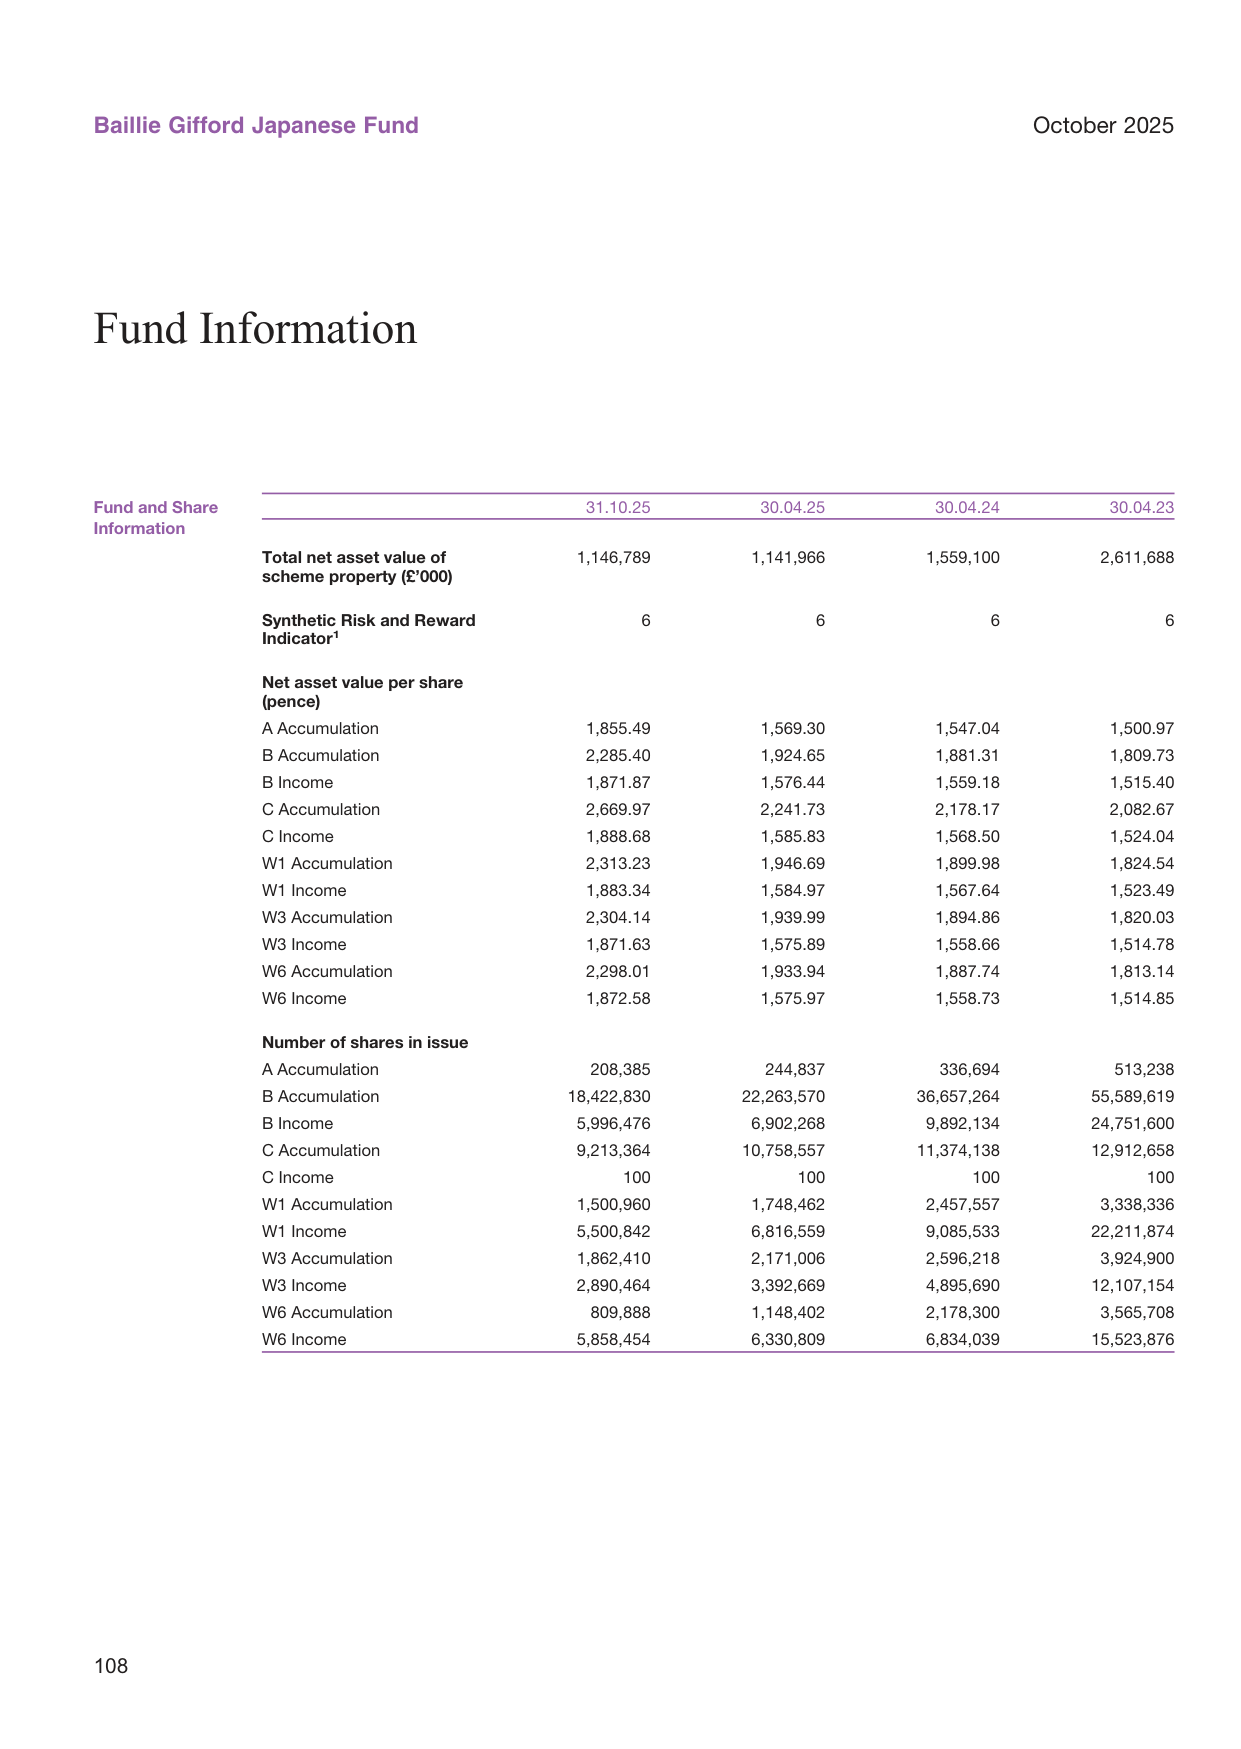
US commercial real estate prices; office property prices down 30% from the 2022 peak in 2024
I. A Compounding Gap That Should Not Be Underestimated
Between the six-month data disclosed in the report and the five-year annualized data, there is a serious disconnect that readers may easily overlook:
| Metric | Fund (Class B accumulation) | MSCI Japan Small Cap Index | Target (index + 1.5%) |
|---|---|---|---|
| Six-month return (to 31/10/2025) | 5.6% | 16.6% | 17.5% |
| Five-year annualized return | -10.1% | 7.1% | 8.8% |
| Five-year cumulative performance (based on £10,000) | approx. £5,900 | approx. £14,100 | approx. £15,200 |
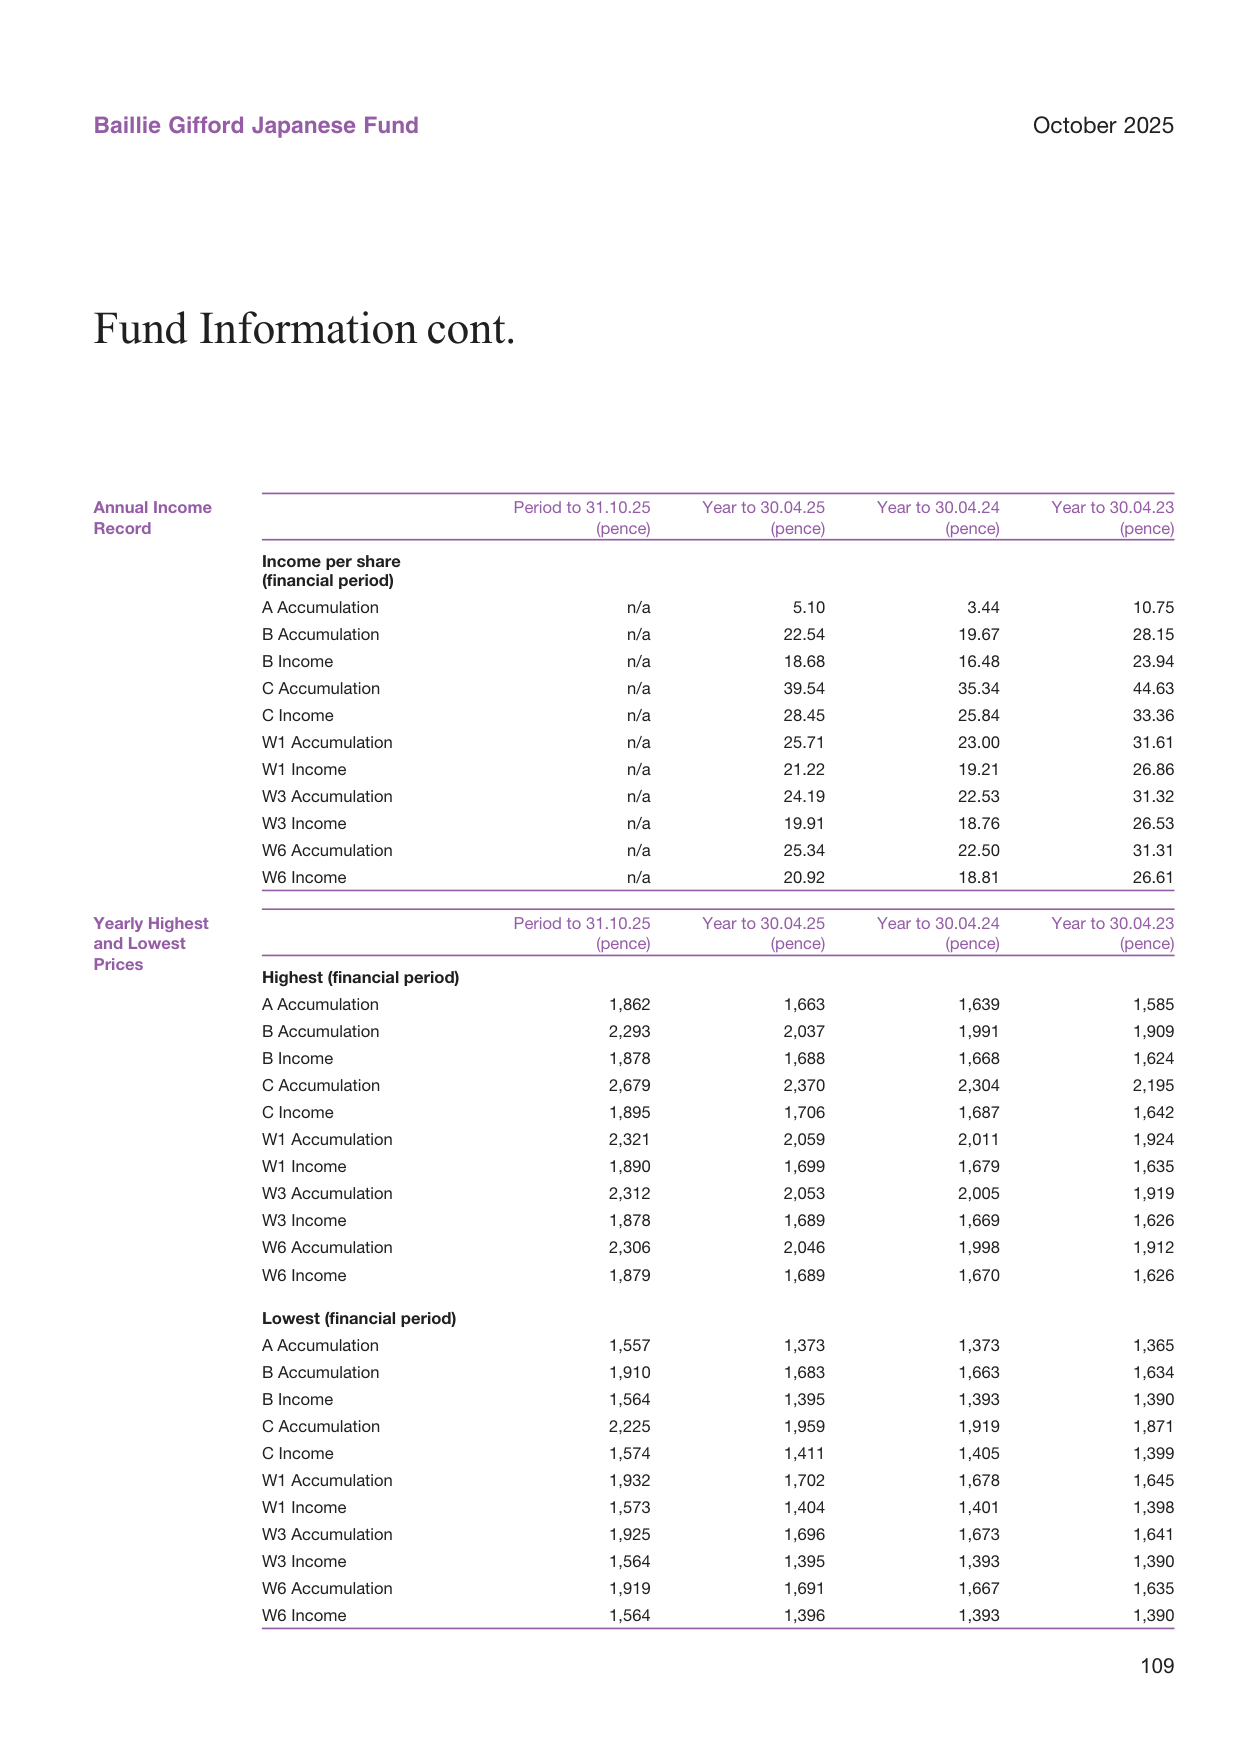
World food price index; down 25% from the 2022 peak in 2024
Based on the five-year annualized figures, an investor who put £10,000 into the fund five years ago would have seen it shrink to under £6,000, while the same amount in the index would have grown to approximately £14,000. The difference in terminal value between the two exceeds £8,000 — meaning wealth was nearly halved and then missed the market's subsequent rise. A gap of this magnitude goes beyond what "short-term volatility" or "market style" can explain.
Even more notable: the fund's objective is to outperform the index by 1.5% per year, but the actual result was an underperformance of 17.2 percentage points per year — the cumulative deviation from the target reached 18.7 percentage points per year. This is an extraordinary number. The report attributes it to two external factors (a weak yen benefiting large exporters, and foreign money concentrated in large-cap liquid names), but given the persistent and severe underperformance over five years, it is difficult to avoid questioning whether active stock selection itself also contributed negative excess returns during this period.
II. Attribution Logic: "Macro Correctness" and "Micro Evasion"
The report attributes the long-term underperformance to the external environment, which is valid at the macro level: yen weakness does favor export-oriented large companies over small domestic-demand names; and foreign capital flowing back into Japanese equities does prioritize liquid large caps. Both are genuine structural headwinds.
However, there is a question the report does not answer: did all Japan small-cap active fund managers in the same yen-depreciation environment suffer underperformance of a similar magnitude? If the answer is "not all" — then external factors explain the beta, while the fund's own alpha problem is downplayed.
Moreover, the positive contributors mentioned in the report (Tsugami, Yonex) show that earnings growth and fundamental improvement in small caps were not entirely absent. Tsugami benefited from vehicle electrification and factory automation, while Yonex benefited from brand strength and global demand. These cases demonstrate that under the same macro headwinds, some small-cap companies were still able to create structural growth. If so, the fund's five-year annualized return of -10.1% cannot be blamed entirely on the "small-cap style" — stock selection likely bears a substantial share of the responsibility.
III. Portfolio Renewal: From "Growth Narrative" to "Thematic Rebalancing"
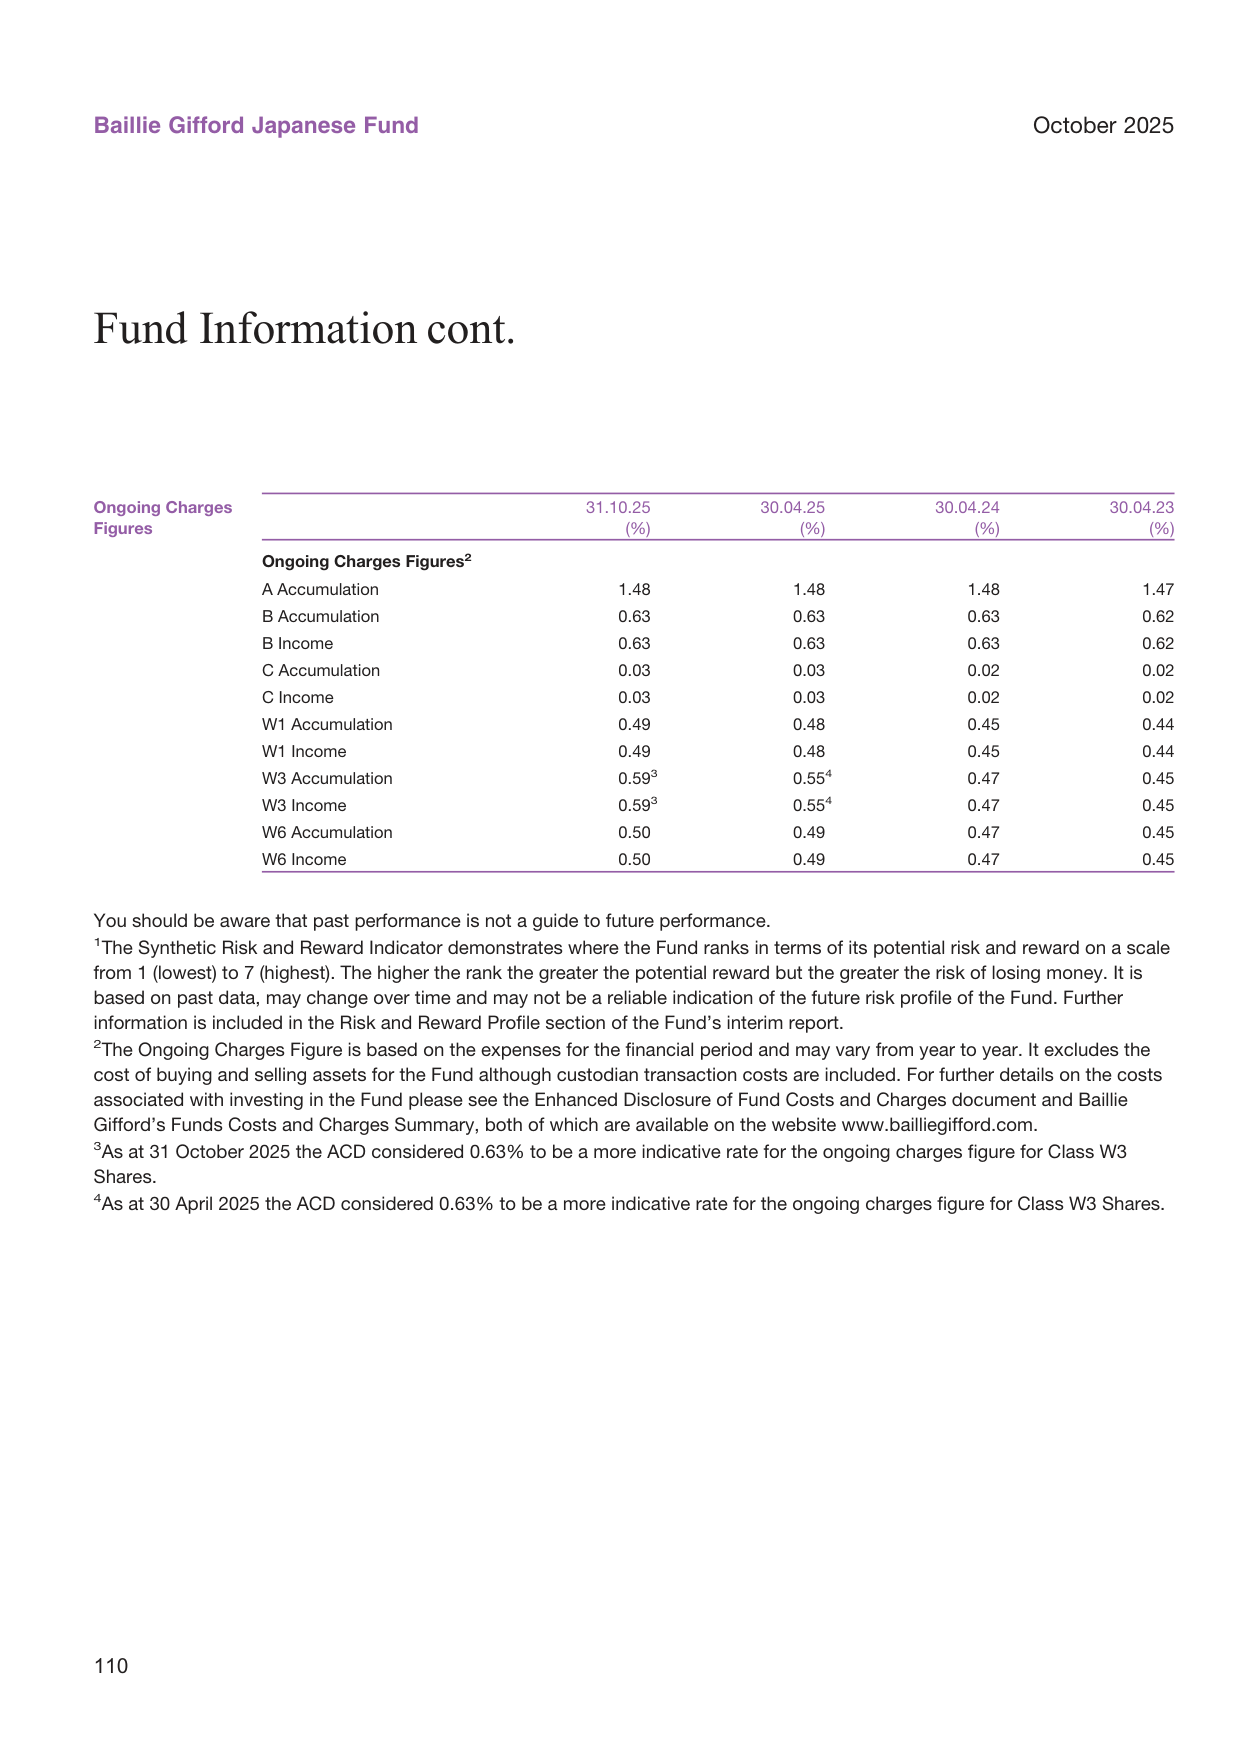
Global private equity dry powder; reaching US$3.5 trillion in 2024
The fund's repositioning during the reporting period deserves careful examination: 10 sold, 4 bought, with the number of holdings reduced sharply. This turnover intensity reveals the manager's intent to correct certain existing positions.
| Direction | Name | Implied logic |
|---|---|---|
| Sold | MonotaRO, MatsukiyoCocokara, IRISO, Technoprobe | Industrial e-commerce, drugstore retail, connectors, semiconductor probes — all mature or cyclically slowing tracks |
| Sold | oRo, Jade Group, Avex, Demae-Can, Kumiai Chemical, CellSource | Names relatively lacking long-term moats or weak growth certainty |
| Bought | Mani | Medical devices: aging population + Asia-Pacific geographic expansion + product innovation |
| Bought | Money Forward | SaaS fintech: scalable platform + vast potential customer base |
| Bought | DMG Mori | Industrial automation + long-term digital manufacturing trend |
| Bought | Kasumigaseki Capital | Innovative real estate development + strong historical track record |
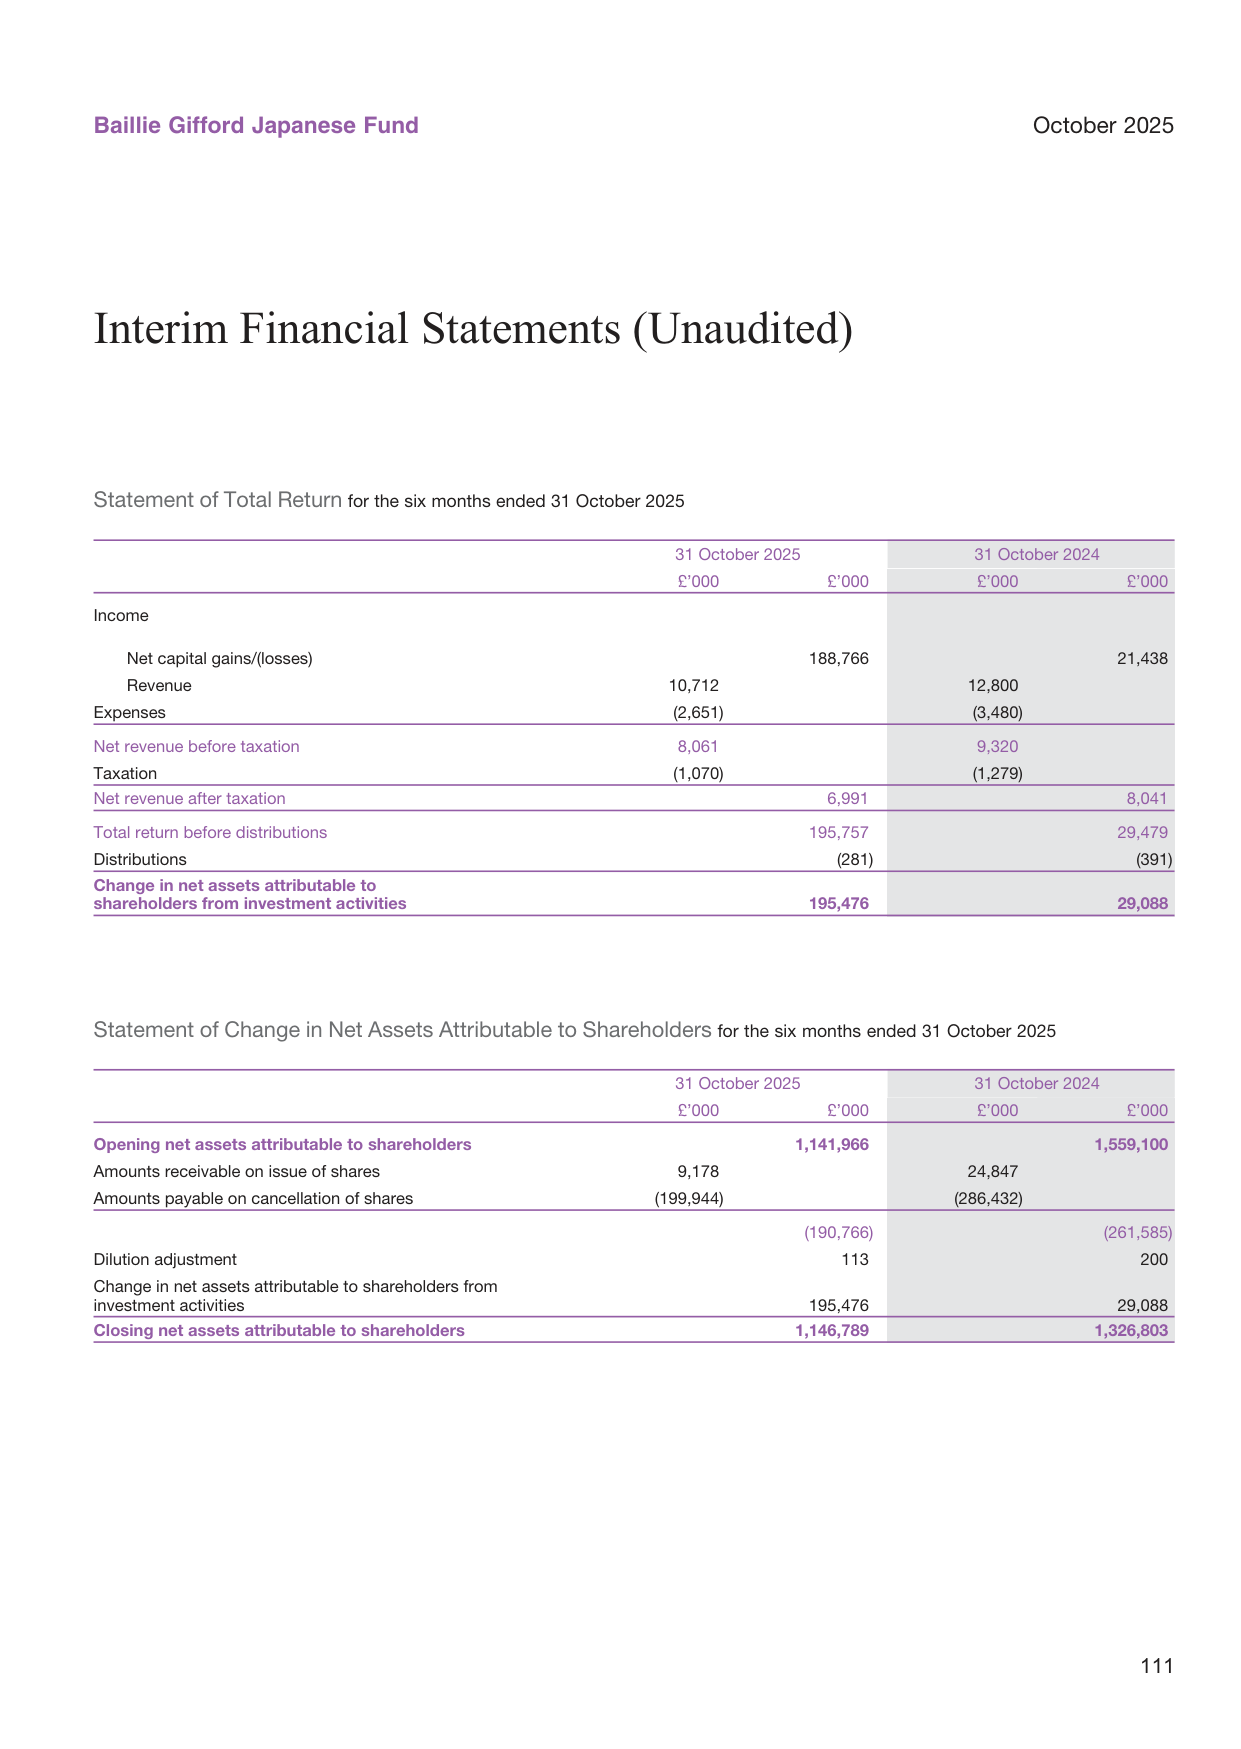
US political polarization index; rising from 0.6 in 1990 to 1.5 in 2024
From this "sell-buy" structure, it can be seen that the manager has not turned defensive or value-oriented, but rather made an even more extreme "thematic focus" within the growth style: the four newly purchased companies correspond to four structural trends — population aging, corporate digitalization, industrial automation and urban renewal. This is consistent with the firm's long-standing "long-term growth" stock-picking philosophy, but it also increases the portfolio's thematic concentration.
One obvious risk signal is that DMG Mori became a major negative contributor almost immediately after being established. The report explains this as "market concerns about demand visibility" and describes building the position during weakness as a deliberate choice. This reflects the manager's left-side positioning strategy, willing to endure further declines after buying. Such a strategy can capture greater upside elasticity when the turning point arrives, but it also demands immense patience from investors — and the past five years of data have already proven that the cost of such patience can be quite high.
IV. Testing the Strength of the Evidence in the "Turning Point" Narrative
The report's core assertion is that "high-growth smaller companies in Japan are coming back into favour," and the main evidence cited includes:
1. The expansion of the NISA system, bringing sustained retail capital inflows into Japanese equities;
2. Corporate governance reform, advancing capital efficiency and strengthening shareholder returns;
3. The valuation discount of small caps relative to large caps reaching its highest level in over a decade.
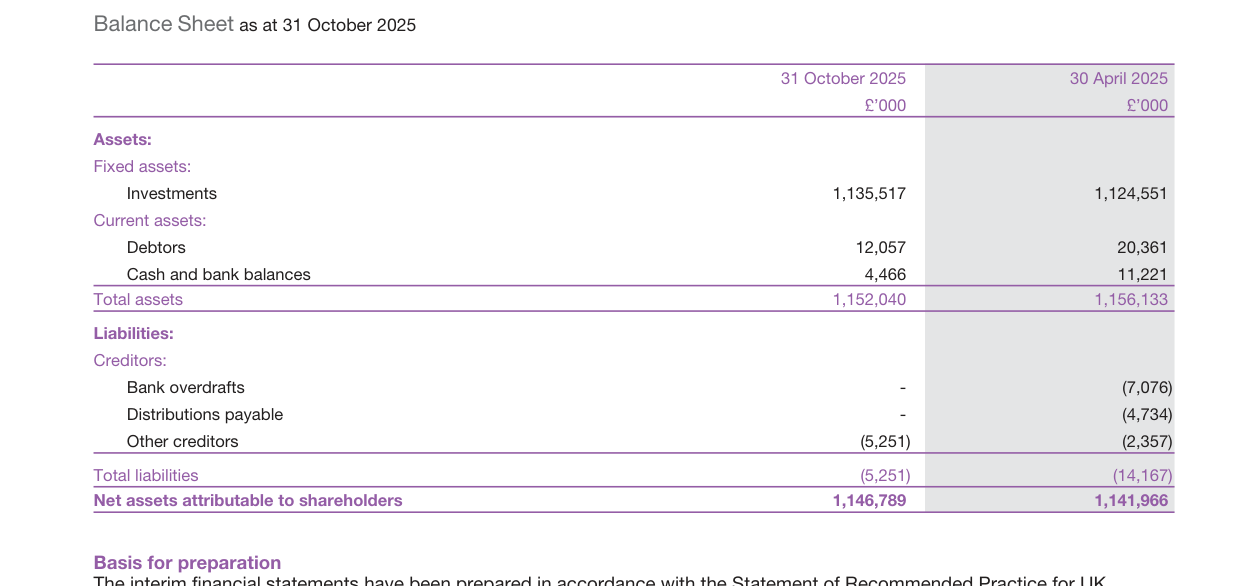
Frequency of global cyber attacks; up 50% in 2024 versus 2020
The first two are policy-side positives, but their transmission mechanism to small-cap prices is indirect and lagged; the third is a classic "contrarian indicator" — an extreme valuation discount does not automatically lead to mean reversion; it can persist at extreme levels for a long time. For a fund that has underperformed for years, citing these three points as evidence of an "imminent turning point" reads more like an expression of confidence than a falsifiable judgment.
The report also states: "We believe that short-term performance measurements are of limited relevance... five years is a more sensible timeframe." Logically this is unobjectionable, but it sidesteps a reality: on a five-year horizon, the fund has also badly underperformed, and the longer the timeframe, the harsher the compounding penalty. If the next five years replicate the relative performance of the past five, the Class B shares' annualized return is already close to -10.1%, implying a further loss of approximately 40% — at which point the difficulty of recovery would rise exponentially.
V. Three Open Questions Concealed by the Report's Optimistic Tone
- The disconnect between Cosmos Pharmaceutical's "soundness" and market pricing: The report describes it as having "stable operations and a strong balance sheet," but the share price fell due to slowing same-store sales growth and intensifying competition. The market's message is that even without a fundamental collapse, the extinguishing of the growth narrative is itself sufficient to suppress valuation. This case exposes the fund's valuation dilemma in "high-quality growth" names — when growth slows, the margin of safety is not as ample as management describes.
- The long-term erosion of turnover and transaction costs: Selling 10 and buying 4 over six months is not low turnover for a small-cap fund whose holdings are already concentrated. Transaction and market impact costs for small caps are typically higher than for large caps, and these costs are ultimately magnified through compounding.
- The "thematic" tendency of newly bought names: All four new purchases are, without exception, highly dependent on long-term trend judgments. If the global industrial automation investment cycle is delayed, or if SaaS adoption in Japan is slower than expected, these names could repeat the tragedy of some holdings over the past five years — the fundamental logic is correct, but the time cost exceeds expectations.
Chart comparing US agricultural exports and imports, with 2024 exports of $170 billion and imports of $150 billion
Overall, this semi-annual report provides a sample worth tracking on an ongoing basis: a manager who has adhered to a long-term growth style for years, who has not deviated from his stock-selection framework despite five years of headwinds, but whose performance data has yet to provide evidence that he is "right." The most commendable part of the report is its honest disclosure of the numbers; the most caution-worthy part is the narrative that packages "hope" as a "turning point." For holders, the truly effective validation metric is not what the fund manager says, but whether the new positions on which high hopes are pinned (Mani, Money Forward, DMG Mori, Kasumigaseki Capital) can deliver on their growth promises at the fundamental level over the next 12 to 18 months, and ultimately be reflected in the share price.
I. Incremental Insights from Yonex Commentary: DTC Channel and Pricing Power
Management's commentary on Yonex appears brief, but it contains an important analytical dimension—direct-to-consumer (DTC) channel development. This is not merely a sales channel adjustment; it is a strategic shift concerning brand pricing power and profit structure:
- Under the traditional wholesale model, brand owners have limited control over retail pricing, display experience, and consumer data, and must bear intermediary channel margins;
- The DTC model allows Yonex to directly capture high-net-worth consumer segments, obtain first-hand demand data, and enhance its pricing premium in the high-end racket category;
- The commentary explicitly juxtaposes "stronger profitability" with "brand control," implying that DTC is not merely about increasing revenue but about controlling brand asset value.
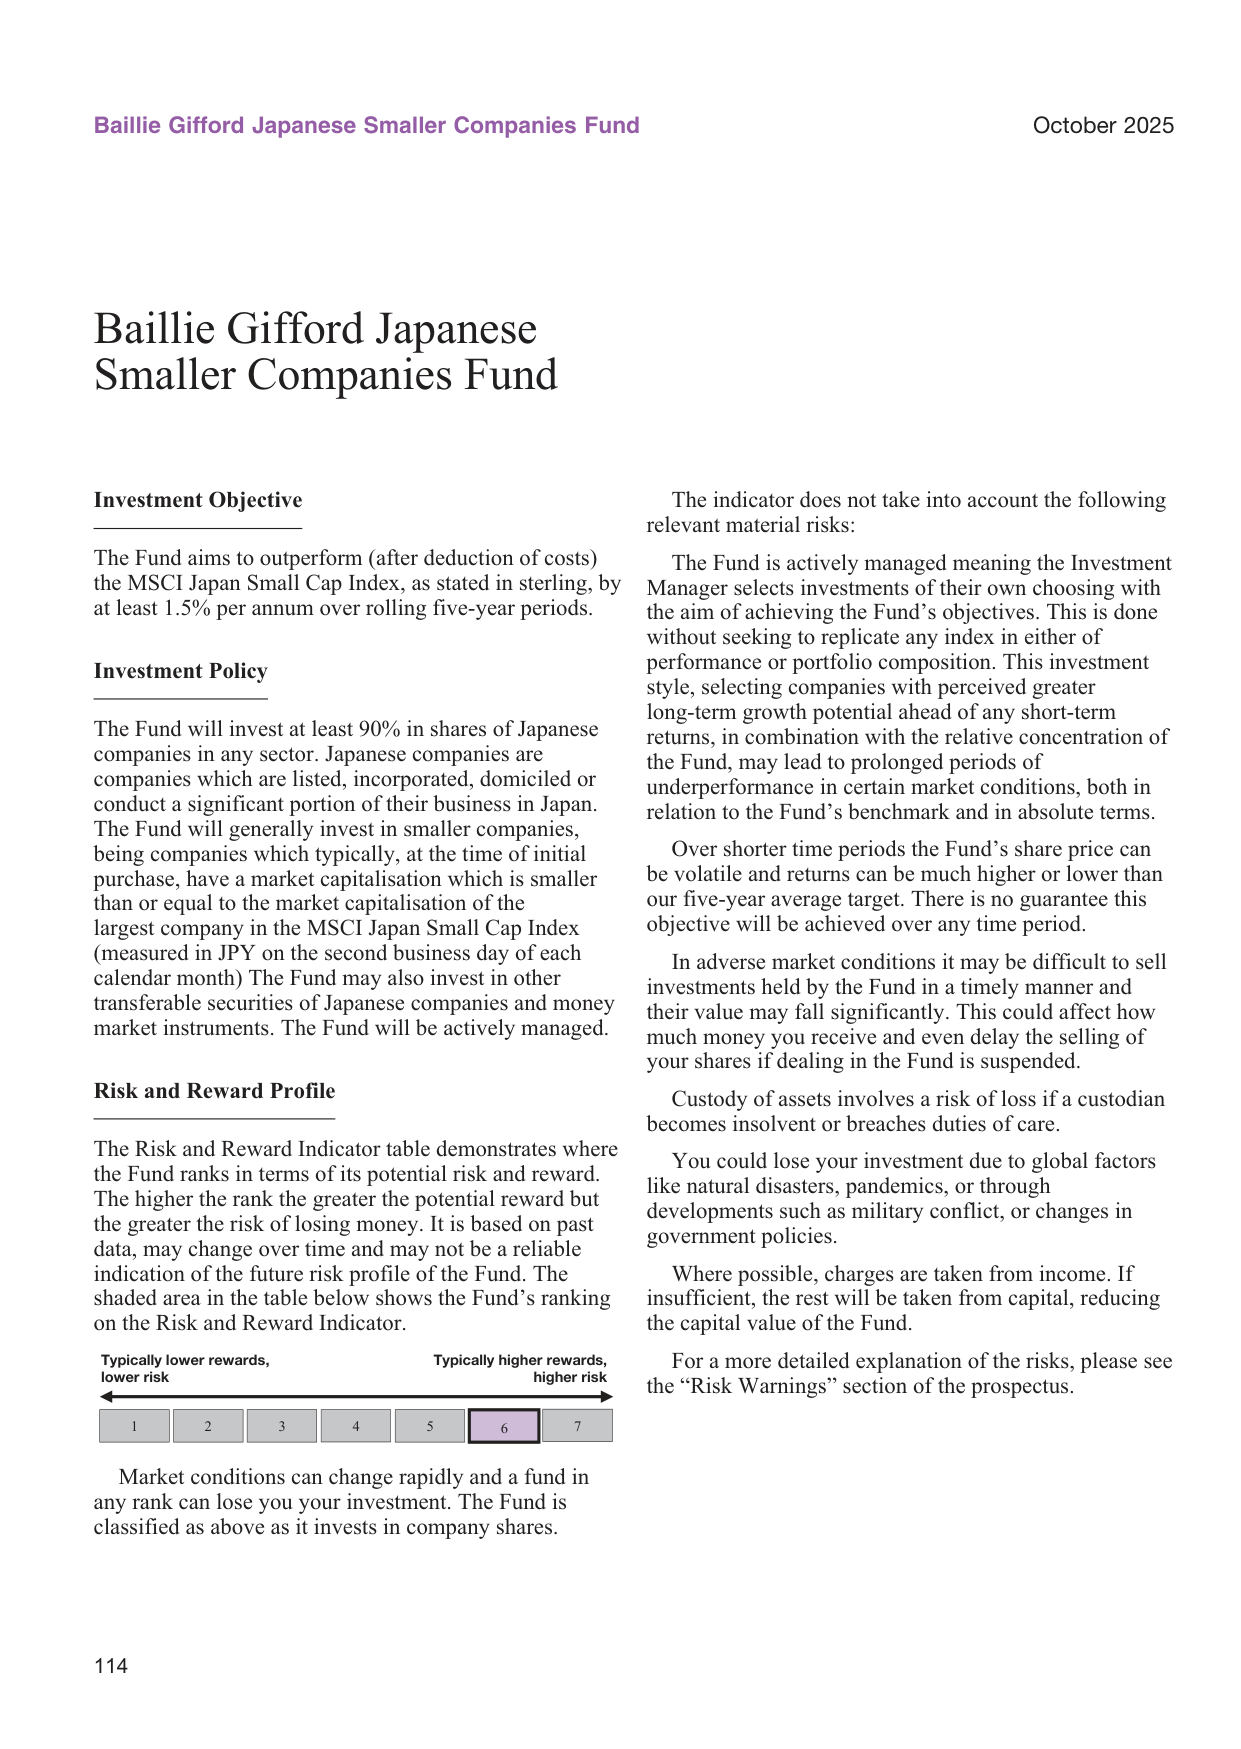
Global natural disaster economic losses trend chart, with 2024 losses of approximately $200 billion
This logic forms an interesting contrast with another holding in the portfolio, Seria (discount retail)—both are consumer companies, but Seria relies on extreme operational efficiency while Yonex relies on brand premium. The two represent different paths of value creation within Japan's consumer sector.
Yonex accounts for 4.17% of the portfolio and is the largest holding, but Tsugami (4.15%) and GA technologies (3.86%) are very close behind. The portfolio is not excessively concentrated in any single stock; the top holding's weight is only slightly above 4%, indicating sound diversification of risk.
II. Overview of Industry Allocation Shifts: Significant IT Increase, Notable Staples Reduction
The differences between the bracketed figures in the Portfolio Statement (30 April 2025) and the latest weights (31 October 2025) reveal the manager's systematic sector rebalancing over six months:
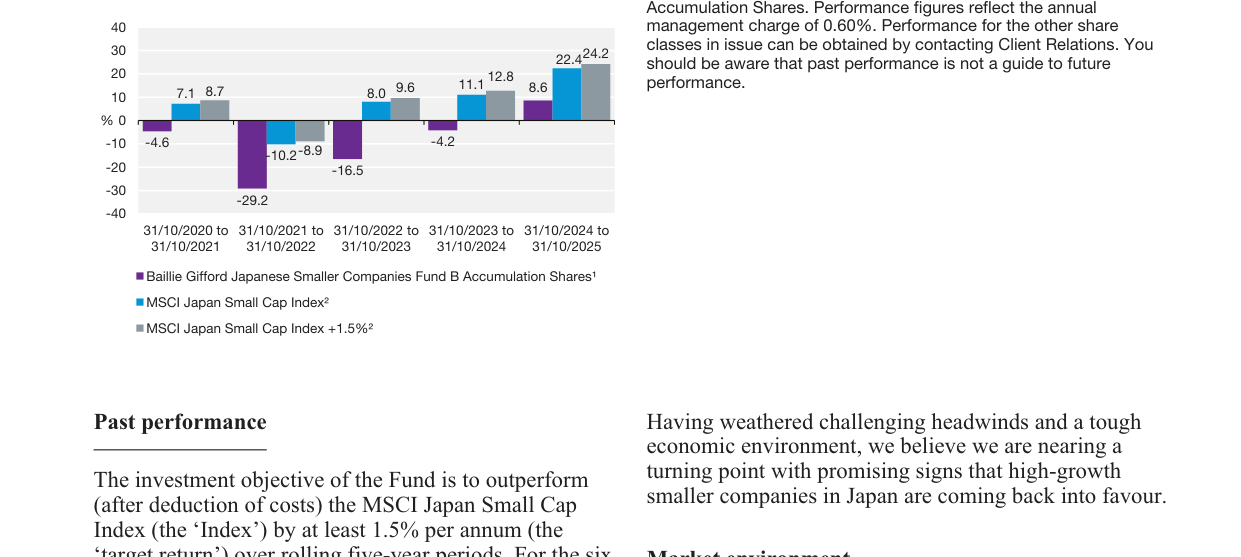
Median age by region, with Europe at 45 and Africa at 20
| Sector | April 2025 (%) | October 2025 (%) | Change (pp) |
|---|---|---|---|
| Information Technology | 13.71 | 17.83 | +4.12 |
| Manufacturing | 0.00 | 1.26 | +1.26 |
| Health Care | 7.98 | 9.15 | +1.17 |
| Real Estate | 2.84 | 3.93 | +1.09 |
| Materials | 2.24 | 2.16 | -0.08 |
| Industrials | 26.08 | 26.06 | -0.02 |
| Communication Services | 10.78 | 10.22 | -0.56 |
| Financials | 9.39 | 8.12 | -1.27 |
| Consumer Discretionary | 17.18 | 15.63 | -1.55 |
| Consumer Staples | 7.66 | 4.95 | -2.71 |
| Net other assets | 2.14 | 0.69 | -1.45 |
It should be emphasized that the +4.12 percentage point increase in IT is the largest single-sector adjustment in the portfolio, while the reduction in Consumer Staples (-2.71) is the clearest contraction over the same period. The consumer sector as a whole (Discretionary + Staples) was cut by approximately 4.3 percentage points combined, with capital clearly shifting from "defensive consumer" to "technology growth."
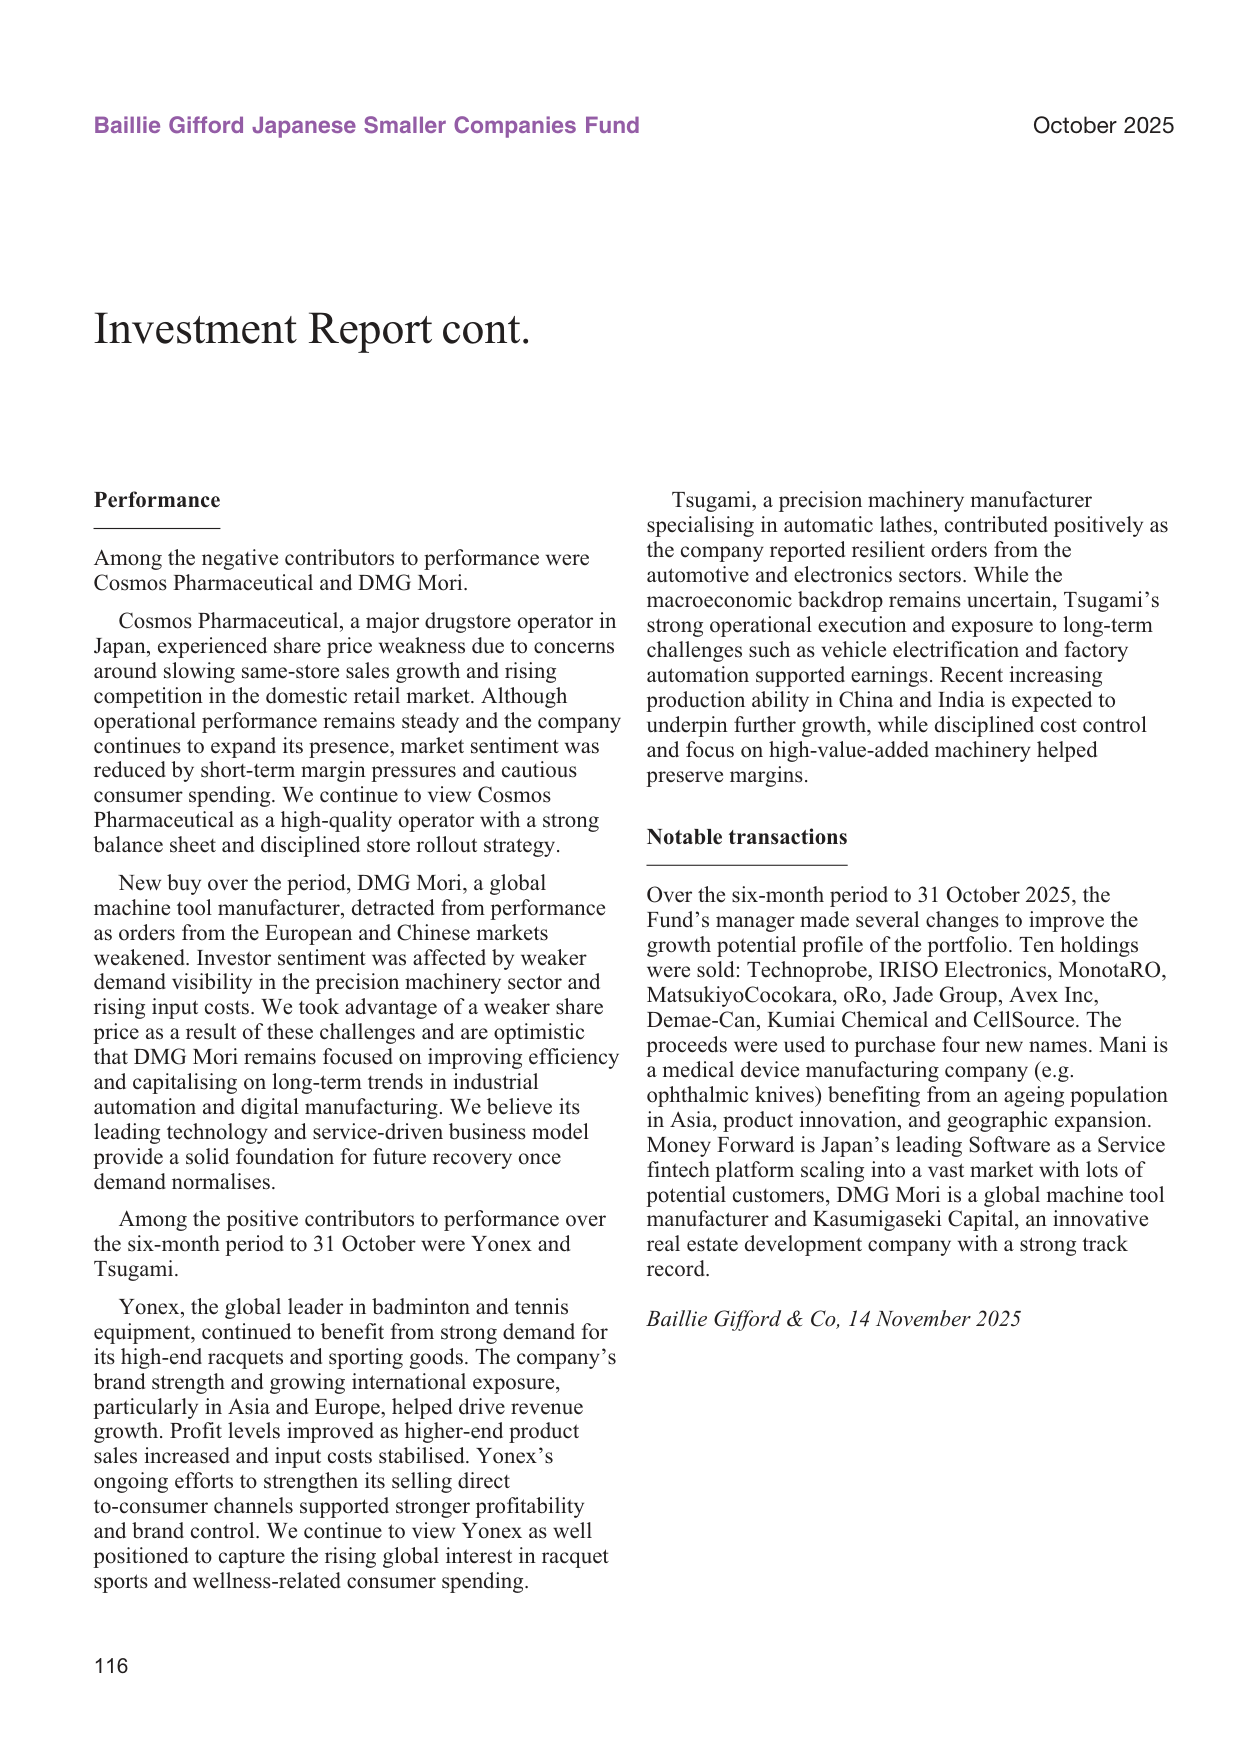
US Gini coefficient trend, rising from 0.43 in 1990 to 0.49 in 2024
The internal divergence within the IT sector is also worth noting: Appier Group (AI-driven ad technology), Megachips (custom chips), and Kohoku Kogyo (battery materials) together account for 7.8% of the portfolio, forming the core of the IT allocation, while traditional Japanese IT service providers (such as Cybozu and oRo) carry smaller weights. This suggests the increase is not evenly distributed but concentrated in structural tracks such as AI, semiconductors, and new materials.
III. Three Layers of Logic Behind Trading Activity
The Material Portfolio Changes list provides incremental information beyond the six dimensions—the multiplicity of trading motivations.
Layer One: New theme position building. The largest purchase was DMG Mori (£2,169k), and in the Portfolio Statement, the Manufacturing sector classification rose from 0.00% to 1.26%, with that sector containing only DMG Mori as a single stock, indicating this is a brand-new standalone theme position. DMG Mori is a globally leading machine tool manufacturer that benefits from Japan's manufacturing reshoring and the global capex cycle. Its separate classification rather than inclusion under Industrials reveals the manager's positioning of it with sufficient importance.
Layer Two: Additions to and trading around existing positions. After buying £1,011k of Money Forward, its portfolio weight reached 0.90%; after buying £758k of Appier, its weight rose to 2.50%; KH Neochem saw a £385k purchase, ending at 2.16%. These are increases to known positions rather than new positions, and the direction aligns with the sector allocation moves.
Layer Three: Liquidity management under redemption pressure. It should be noted that stocks appearing on the largest sell list—Nifco, Katitas, Lifenet Insurance, Anicom—also still appear in the top ten holdings or among the heavyweight names. For example:
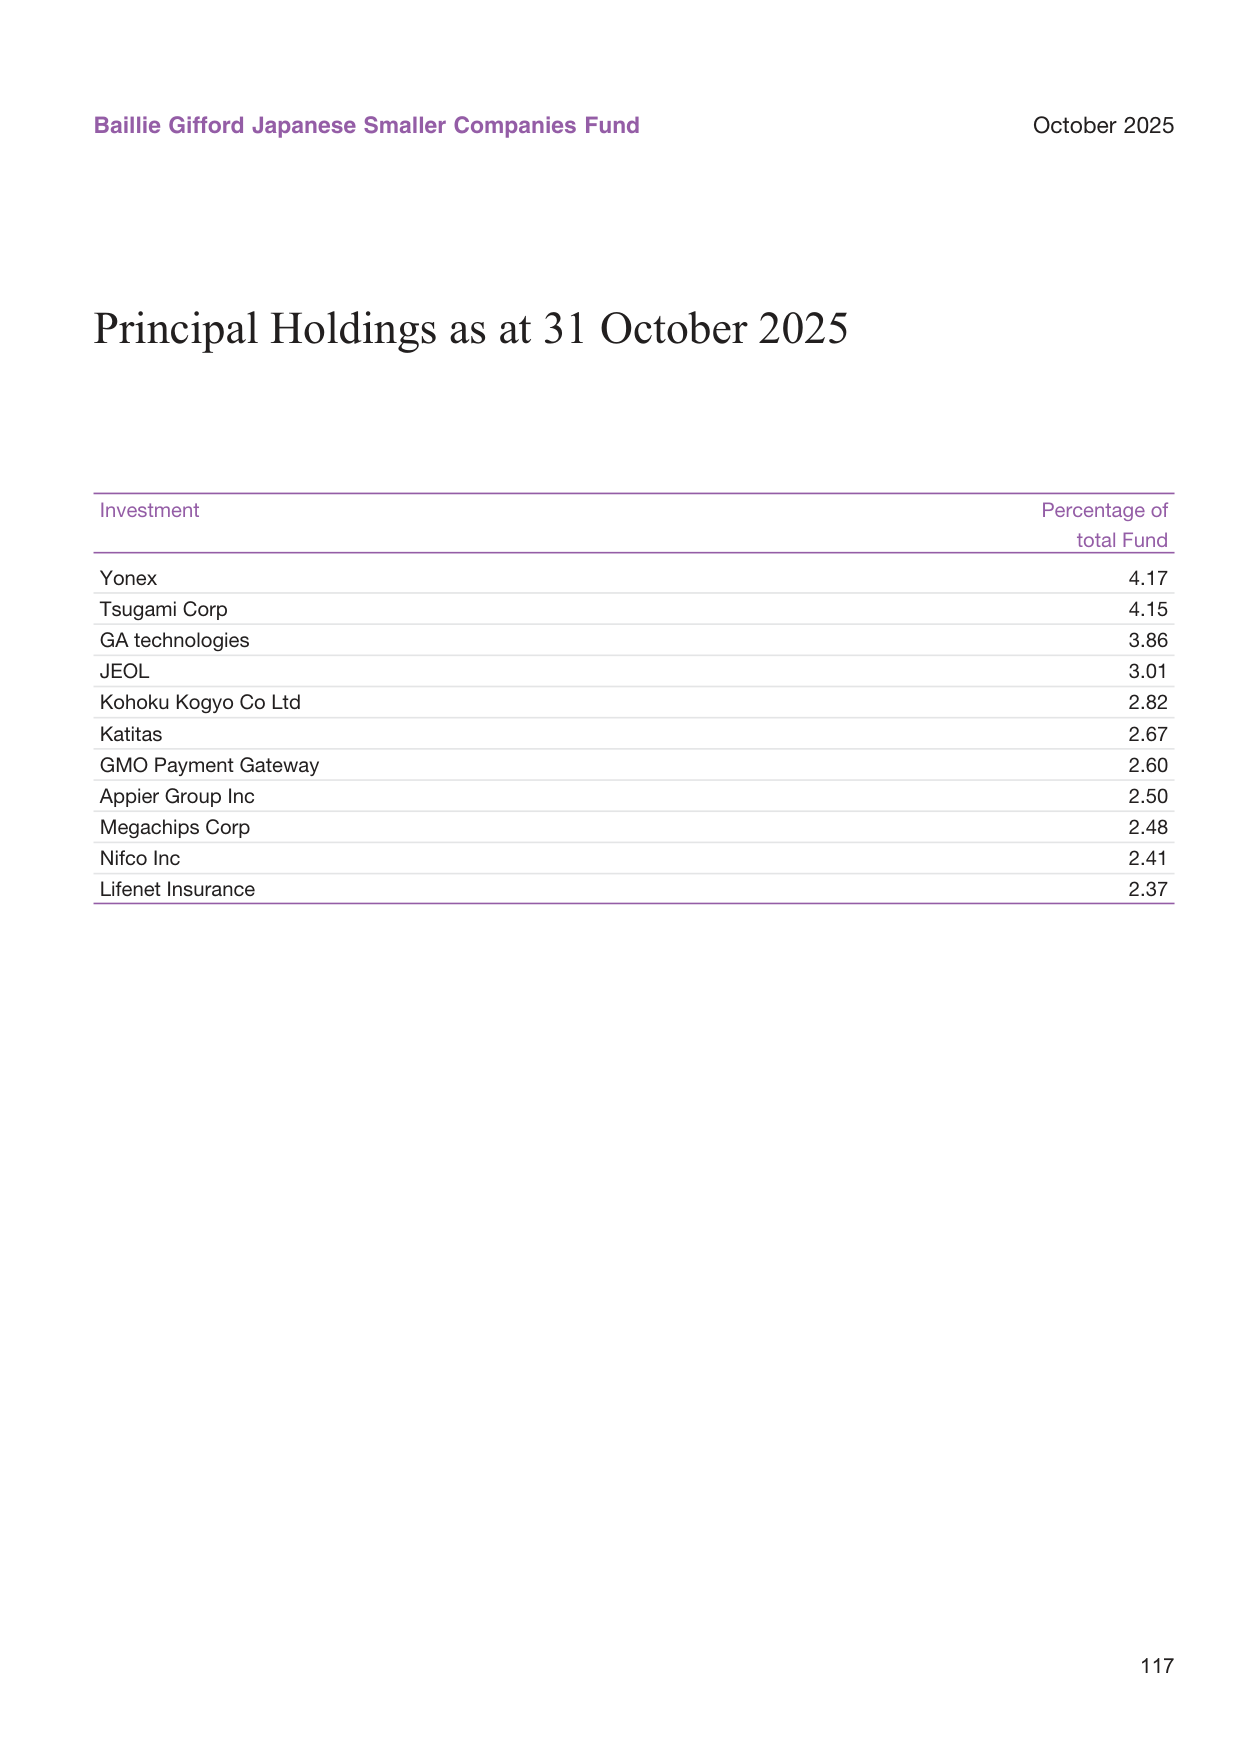
Global smartphone shipment market share pie chart: Samsung 22%, Apple 20%, Xiaomi 14%
| Stock | Sell Amount (£'000) | Latest Holding Weight (%) |
|---|---|---|
| Nifco Inc | 1,796 | 2.41 |
| Katitas | 1,029 | 2.67 |
| Lifenet Insurance | 887 | 2.37 |
| Anicom Holdings | 1,665 | 1.99 |
These four stocks maintained significant weightings even after the sales, suggesting the selling was more likely partial reduction to meet redemption demand (net outflow of £14,177k over the period) rather than a trend-based bearish call. Under redemption pressure, the manager chose to extract funds from highly liquid positions while preserving long-term conviction in core holdings.
IV. Share Structure and Fund Flows: Institutional Capital Significantly More Stable Than Retail
The Fund Information data reveals three structural changes worth noting:
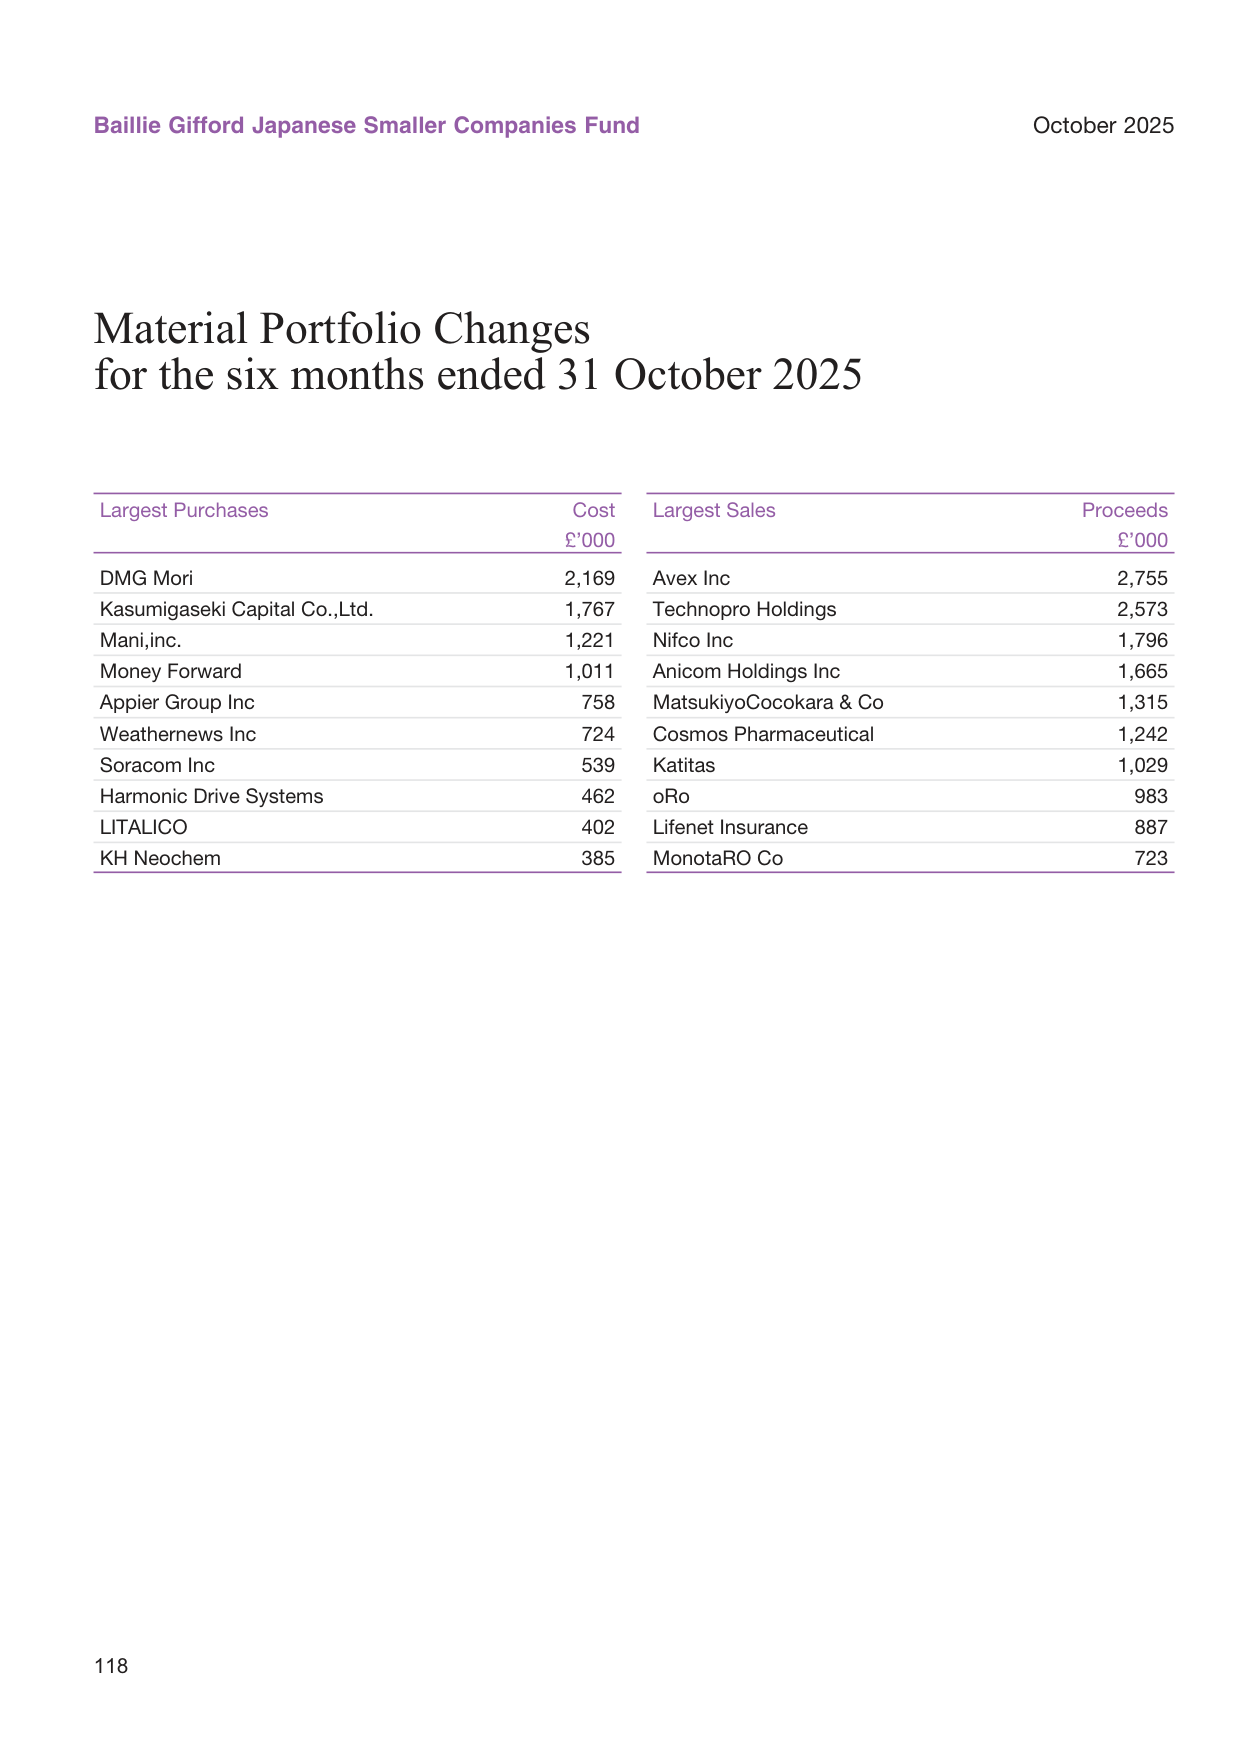
US auto industry employment trend, reaching 1.05 million in 2024
1. Net assets continued to shrink, but the pace of contraction narrowed. Fund net assets fell from £352,839k in April 2023 to the current £123,301k, a decline of roughly 65% over two and a half years. However, the decline from April 2025 to October 2025 was 5.4%, markedly narrower than previous periods (approximately -33% and -15%), indicating that redemption pressure has eased substantially.
2. Share class changes reveal redemptions concentrated in higher-fee classes. Comparing half-year data:
| Share Class | April 2025 (shares) | October 2025 (shares) | Change |
|---|---|---|---|
| A Accumulation (fee 1.56%) | 30,464 | 18,280 | -40.0% |
| B Accumulation (fee 0.66%) | 1,853,727 | 1,536,796 | -17.1% |
| B Income (fee 0.66%) | 542,982 | 471,523 | -13.2% |
| C Accumulation (fee 0.06%) | 1,229,116 | 1,227,500 | -0.1% |
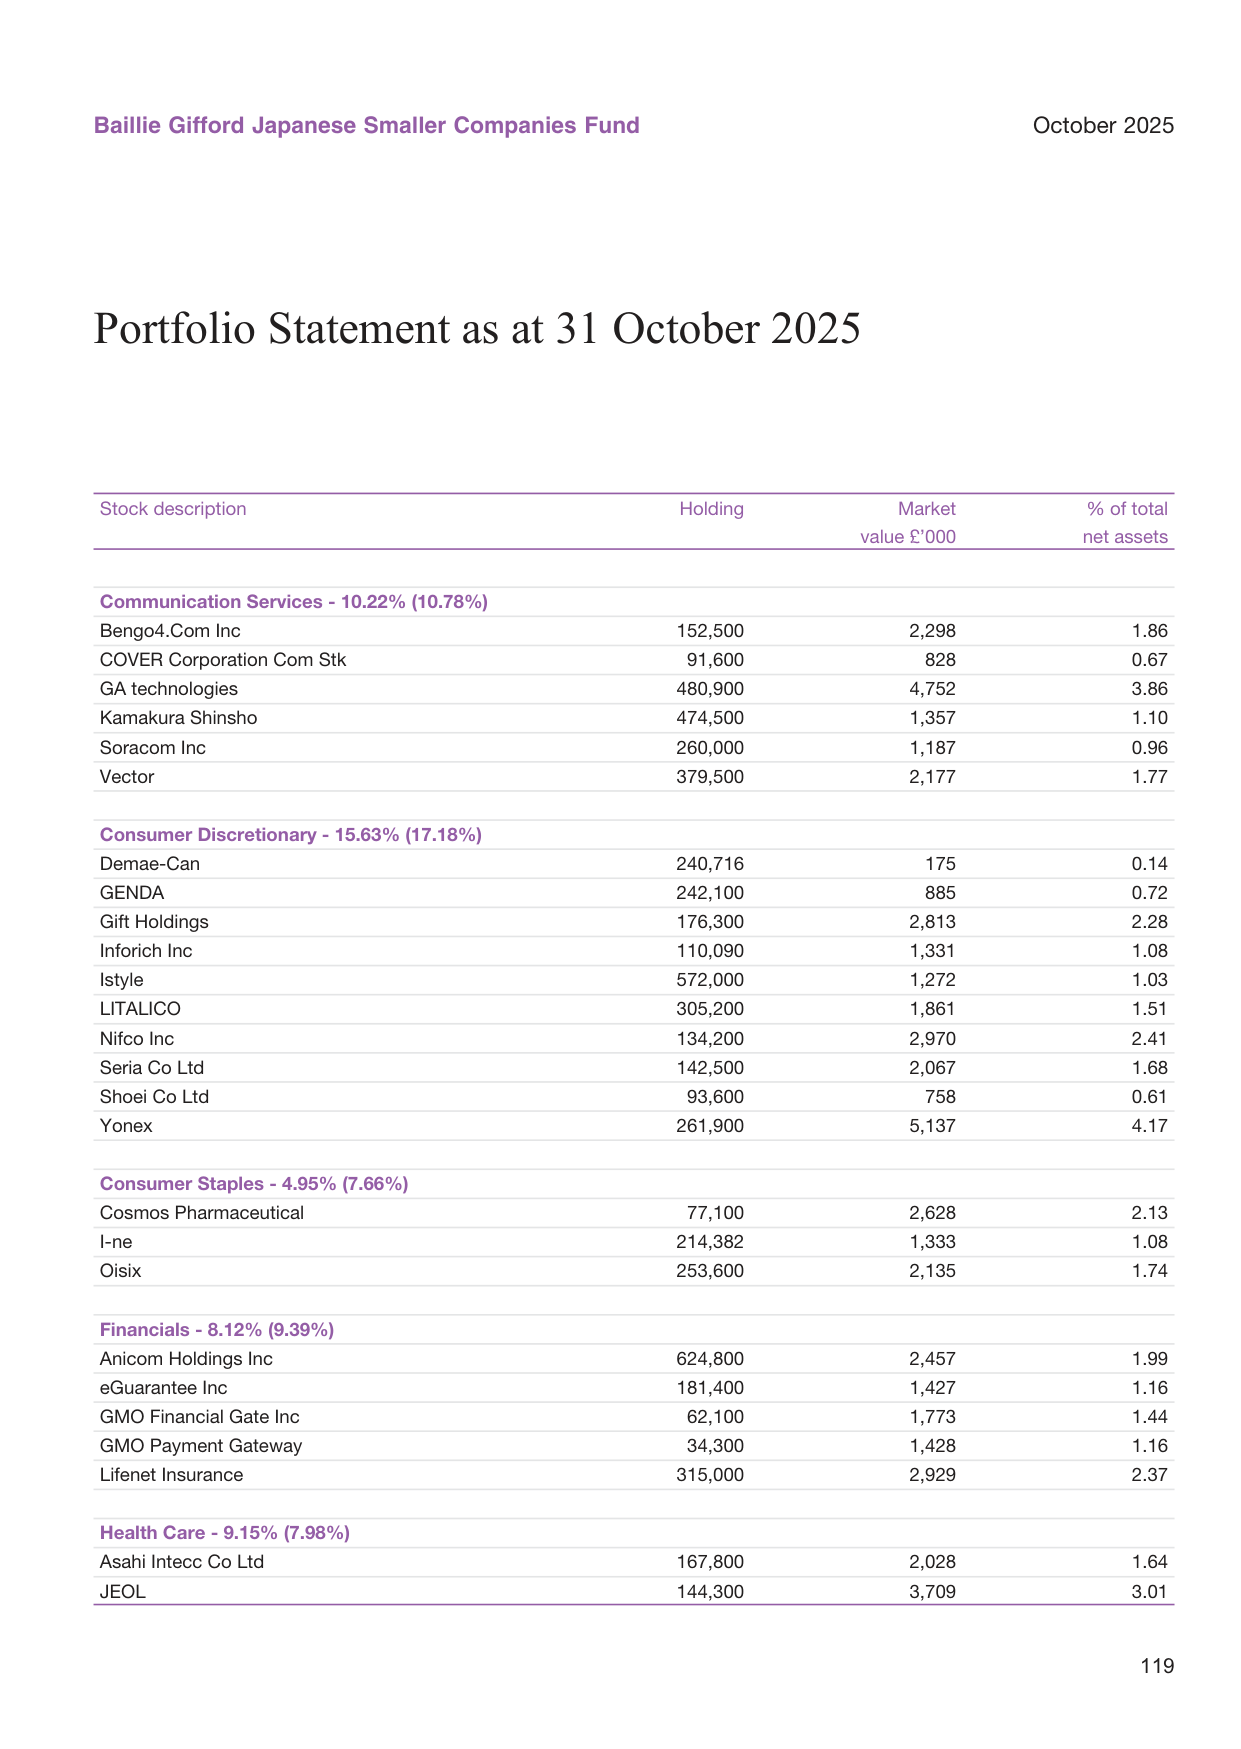
Global semiconductor manufacturing capacity trend, with capacity growing 6% in 2024
Class A (highest fee, retail-oriented) shares fell by 40%, while Class C (lowest fee, institutional) shares barely changed. This clearly shows: retail investors are the primary redeemers, while institutional holders have demonstrated extremely high stickiness. The impact of fee structure on capital stability has been precisely quantified by the data.
3. Shareholder returns were driven primarily by capital gains. Net capital gains over six months were £6,585k, while net income was only £526k—capital gains contributed 12.5 times more than income. Additionally, the fund pays almost no distributions (only £11k), making it a typical pure accumulation-style growth fund. In terms of NAV performance, the C Accumulation class rose from 3,972.89p to 4,200.81p over the half-year, a gain of 5.74%, while Class A gained the same amount over the period (2,785.03→2,922.65), indicating identical returns at the fund level, with differences only in fee erosion.
V. "Hidden Efficiency Signals" in the Financial Statements
The Balance Sheet contains several analytical details worth noting:
- Extremely low cash position. Period-end cash and bank deposits were only £217k against fund net assets of £123,301k, a cash ratio of just 0.18%. Even including short-term debtors, current assets represent only 1.1% of total assets. This suggests the fund is operating almost fully invested, reflecting management's optimism about the medium-term return prospects for Japanese small and mid-cap stocks.
- Minimal debt pressure. Bank overdrafts were only £75k, and the net cash position was positive (£217k - £75k = £142k), maintaining a healthy liquidity buffer despite sustained redemptions.
- The significance of valuation levels. Fund net assets fell from £130,364k at period start to £123,301k at period end, yet net capital gains were positive (£6,585k), meaning the decline in net assets during the period was entirely attributable to redemptions. In other words, the manager still delivered positive returns even under redemption pressure, further validating the judgment that "reductions do not imply bearishness."
Taken together, the picture presented by this report is that of a Japanese small and mid-cap fund facing sustained capital outflows but with its investment discipline intact. The manager has demonstrated clear style preferences through IT increases, a new Manufacturing position, and consumer reductions, while expressing confidence in Japanese small and mid-cap growth stocks through a fully invested stance. For investors tracking this space, the fact that institutional holders in Class C shares have not redeemed is itself a form of endorsement.
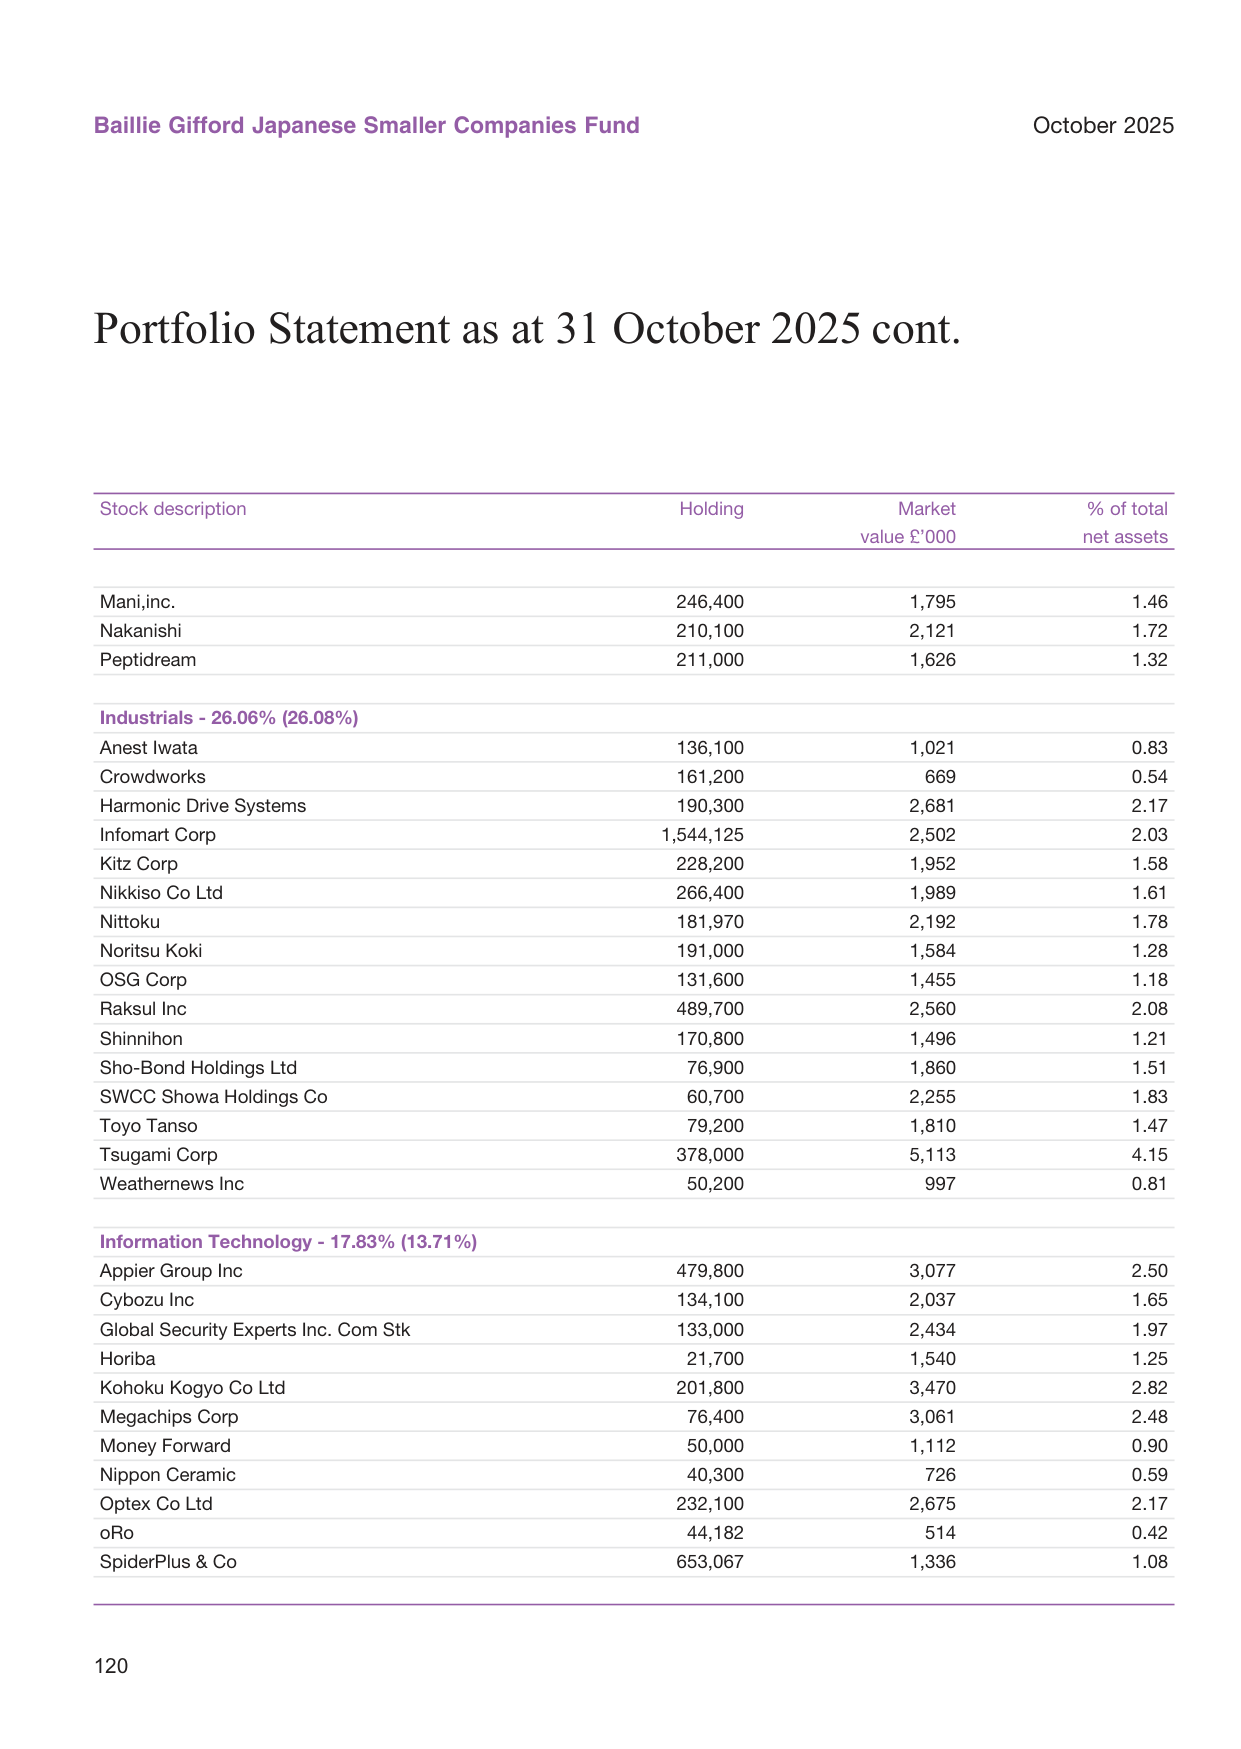
US renewable energy capacity additions trend, with 40 GW of new solar in 2024
From Active Management to Structural Constraints: Interpreting the Allocation Logic and Governance Boundaries in the Pacific Fund Report
I. The Reality of "Underperformance" Against the Five-Year Rolling Target: The Strategic Cost Behind the Data
The report discloses a key data point worthy of deeper analysis: over the five-year rolling period ending 31 October 2025, Class B accumulation shares delivered an annualized return of 6.7%, versus 6.9% for the index and a target return of 9.1%. This means the fund not only failed to achieve its target of outperforming the index by 2%, but actually lagged the benchmark itself by a slight margin of 0.2 percentage points.
| Metric | Fund Class B Shares | MSCI AC Asia ex Japan | Target Return (Index + 2%) |
|---|---|---|---|
| Five-year annualized return | 6.7% | 6.9% | 9.1% |
| Gap vs. target | -2.4% | -2.2% | — |
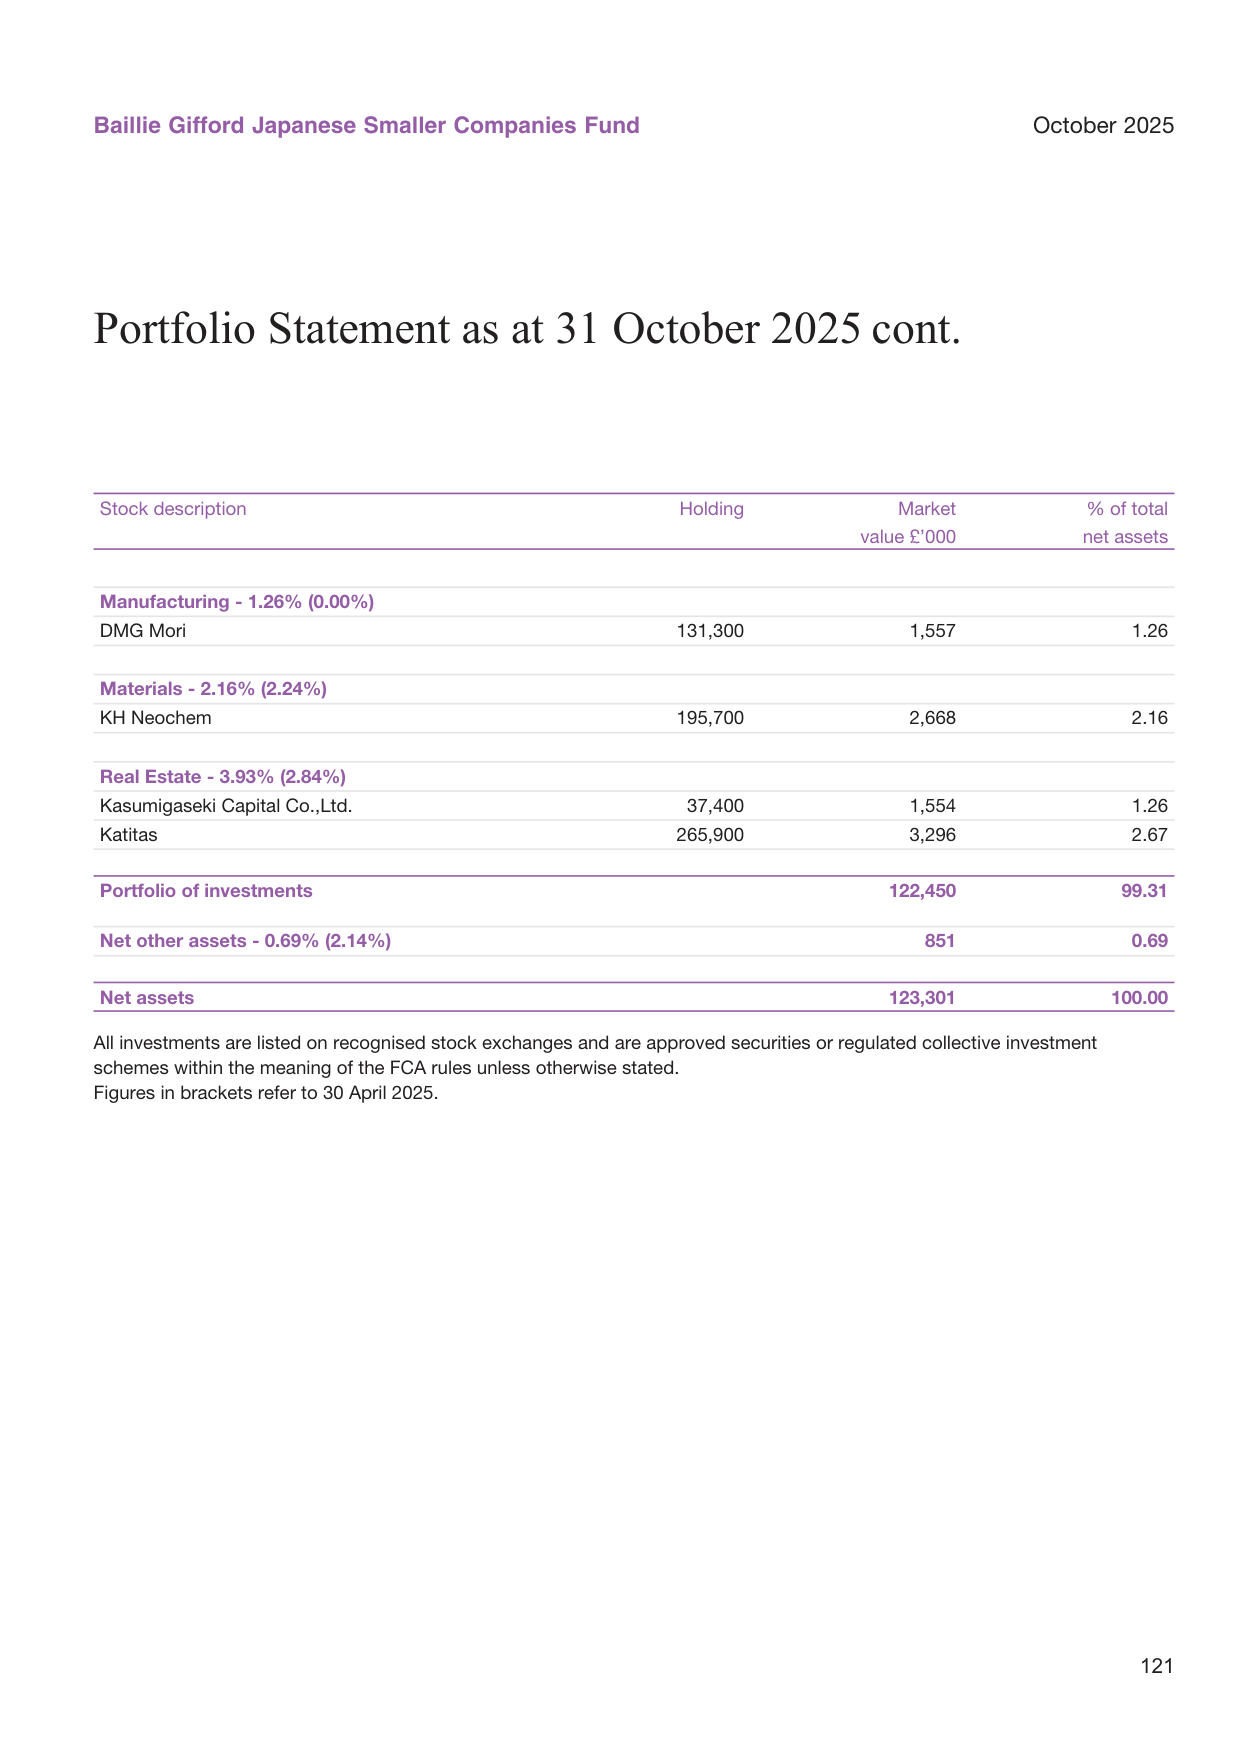
Global CEO confidence index trend, with an index reading of 55 in 2024
Comparing this data with annual performance over the same period reveals the structural root of the problem. The deep drawdowns of 2022 (-30.5%) and 2023 (-21.1%) constituted a major drag on the five-year period. This is not a simple stock-picking failure but an inevitable product of the strategy's style: high concentration plus a long-term growth preference means there is almost no defensive buffer in an environment of rising rates and growth-stock valuation compression. The strong rebound of 39.0% within the first half of 2025 did not offset the accumulated losses, confirming the report's own admission that high short-term volatility is an inherent attribute of this strategy.
A question worth pursuing: in nine years, the five-year rolling window has happened to span two extreme market cycles (the 2020-2021 liquidity bull market and the 2022-2023 tightening bear market), and ending at October 2025 happens to fully capture the largest drawdown of 2022 within the statistical window. In other words, the current "underperformance" status is to a considerable extent an artifact of window selection rather than a wholesale rejection of the strategy's capabilities. To meet the target again in the next five-year window, the fund would need to outperform the index by approximately 3.4% annually or more (since compounding from a 6.7% base to a 9%+ target requires significant excess returns), which is an extremely challenging task in a mature market structure.
II. The "Domestic Demand-Led" Narrative: Re-anchoring the China Allocation Logic
Management's judgment on the Chinese market deserves careful reading. The report notes that although media focus centers on US-China tariffs and trade frictions, "most Chinese companies generate revenue domestically." This judgment effectively redefines the analytical framework for investing in China: geopolitical risk and fundamental risk should not be conflated.
Rate cuts, expansionary government spending, and policy support for innovation and the private economy—this three-dimensional policy combination paints a picture different from Western media narratives. The endogenous resilience of China's domestic market is the core support for this argument. Taking Meituan as an example, over 600 million users are distributed across an extremely complex market, and its network effects and execution capabilities constitute a solid moat. Although intensifying competition in food delivery has eroded short-term profit margins, such shocks belong to competitive dynamics rather than existential threats, and the holding logic has not been broken.
The validity of this perspective has been partially validated by the market: Chinese equities rebounded significantly during the reporting period, and the fund benefited without reducing its China allocation. However, it should be noted that "domestic demand-led" does not mean immunity to external shocks—policy variables such as semiconductor supply chain controls and technology export restrictions may indirectly affect individual companies' supplier relationships or financing channels. The argument applies more to consumer, internet platform, and local industrial companies than to technology hardware firms highly dependent on global supply chains.
III. The 10% Holding Cap: Active Management Meets Regulatory Hard Constraints
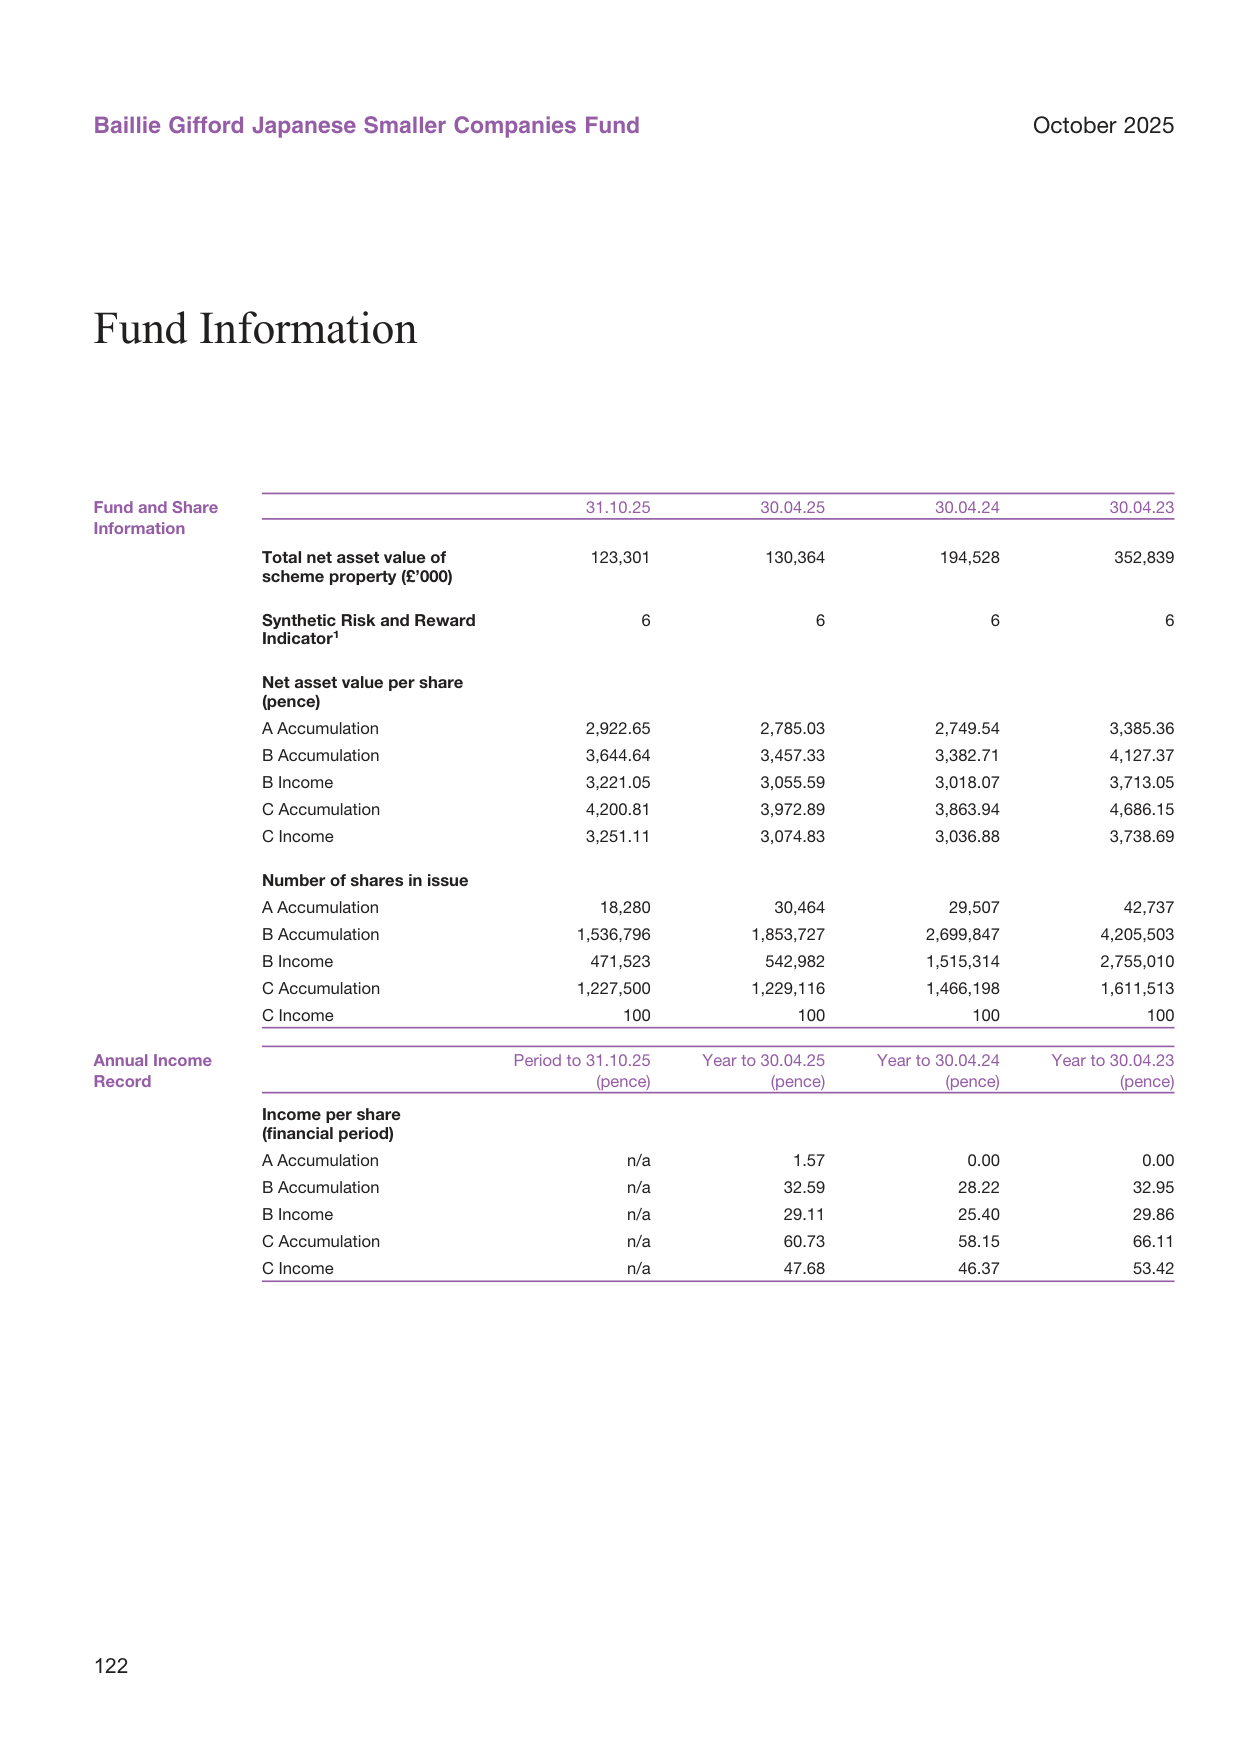
US labor productivity growth trend, with 1.5% growth in 2024
The TSMC case reveals a structural issue that is often underestimated: the fund holds a positive view of TSMC, but regulations prohibit any single holding from exceeding 10%, while TSMC's weight in the index already exceeds 10%. The result is that the fund is forced to underweight its most favored largest-cap holding.
The cost of this constraint needs to be quantified. TSMC, as a core beneficiary of the AI hardware cycle, "continued to deliver strong operational performance" during the reporting period. Had the fund been free to allocate at what it deemed an appropriate weight (e.g., 12-15%), period returns would have been significantly higher. The fund employs a compensatory strategy of holding other suppliers in the semiconductor ecosystem, but substituting core companies with downstream or peripheral suppliers inherently involves assuming risks of a different dimension—supply chain position, bargaining power, and product cycles all differ, and these cannot fully hedge the tracking deviation caused by underweighting TSMC.
This is not a problem unique to this fund, but rather a common dilemma for global active funds in an era of highly concentrated index weights. As the combined weight of the top ten index constituents continues to rise, the 10% regulatory cap increasingly becomes an institutional disadvantage for active management relative to passive investing.
IV. SK Square: Holding Company Discount and the Catalytic Role of Capital Returns
The SK Square position provides a sample of holding company investment strategy. Its core asset is its stake in SK Hynix, whose profits grew substantially in the first half of 2025 due to strong high bandwidth memory (HBM) demand. But the core consideration for investors choosing SK Square over direct exposure to SK Hynix is the potential for the holding company discount to narrow.
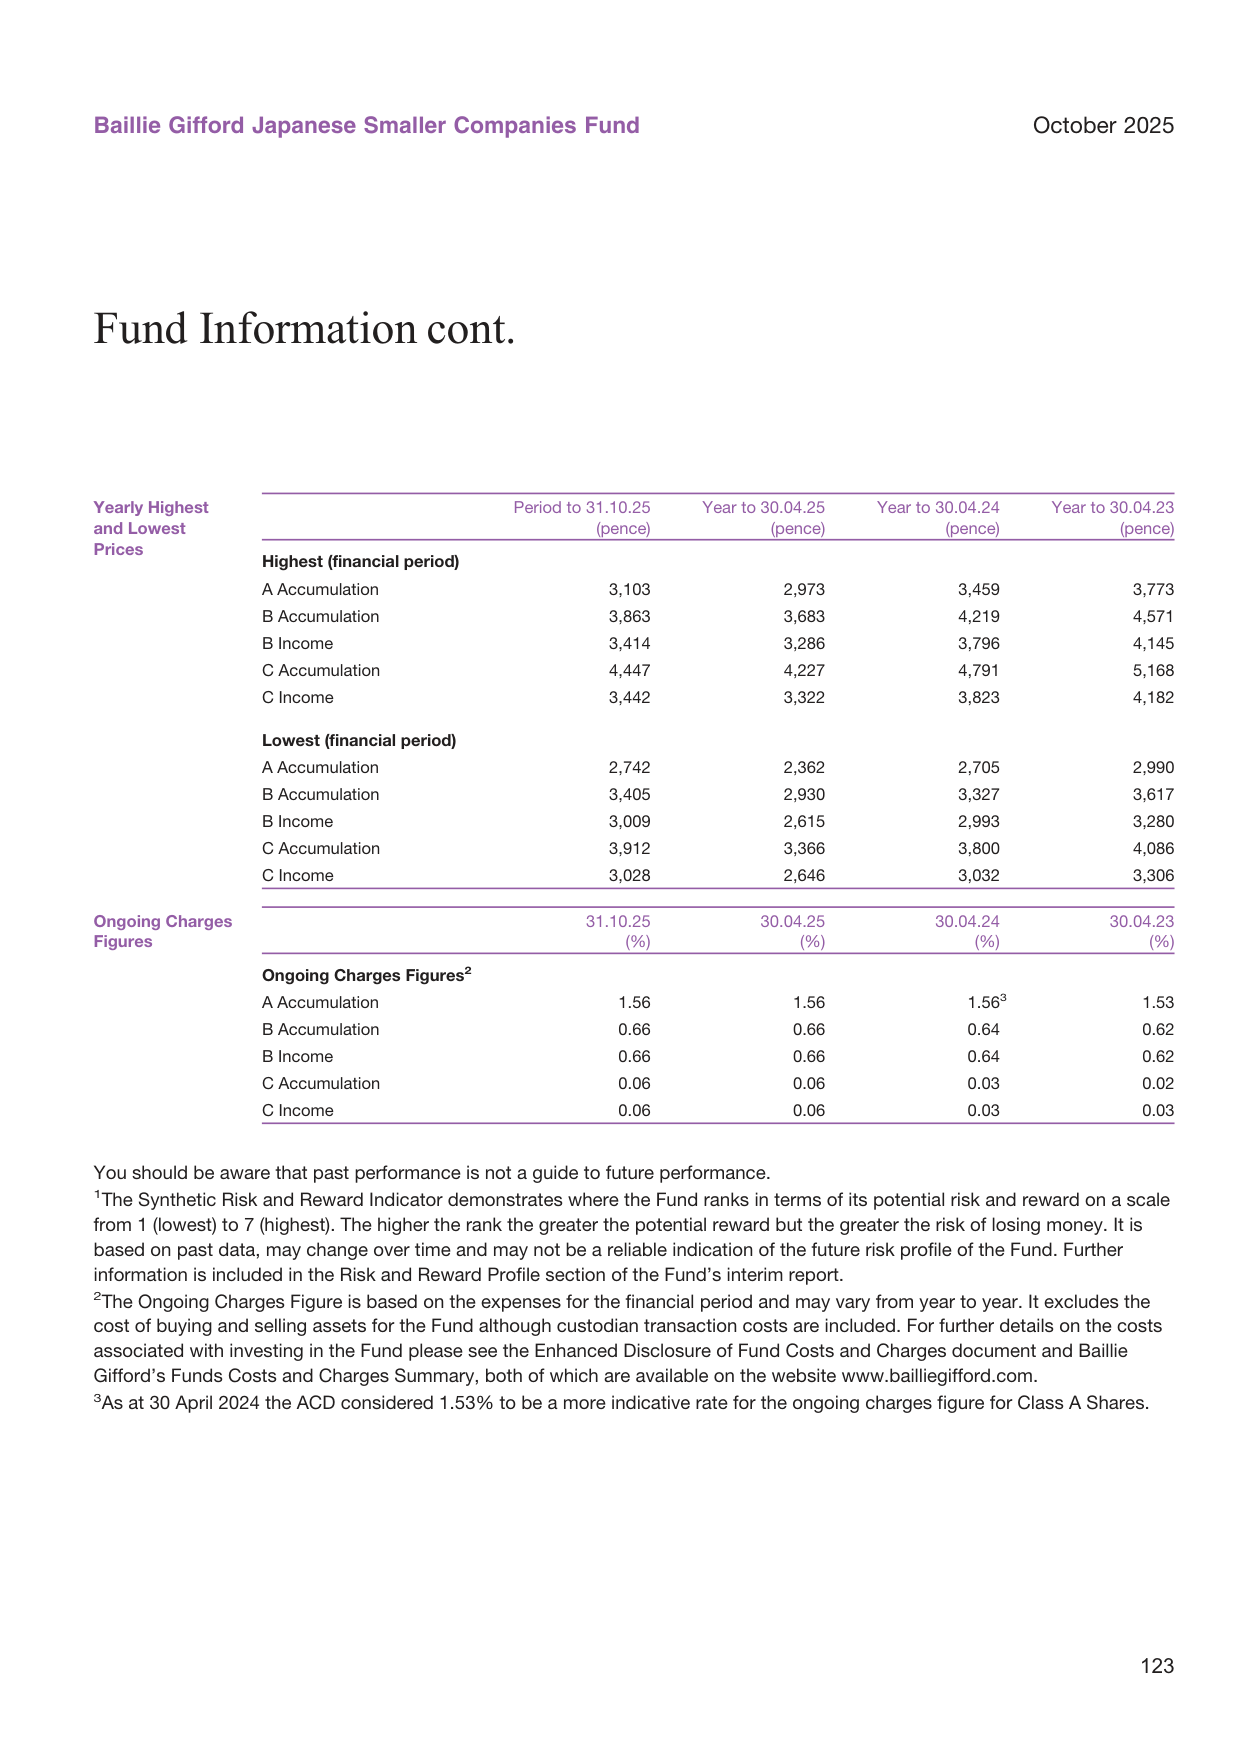
Global food inflation by category: grain inflation 2%, meat 3%
The large-scale share buyback program launched in April 2025 is the key catalyst for discount narrowing. The direct effect of the buyback is to increase net asset value (NAV) per share, while simultaneously signaling to the market that management believes the stock is undervalued. This logic parallels the price-to-book reform promoted by the Tokyo Stock Exchange—capital return policies are becoming an important tool for unlocking corporate value in Asian markets.
However, investors need to recognize clearly that the SK Square position is essentially a high-leverage expression of a single asset: its share price has an amplifying effect on SK Hynix's volatility (in both directions). This type of investment is suitable as an offensive position on the semiconductor cycle within the fund's overall portfolio, rather than as a stable allocation.
V. Samsung's Strategic Turning Point: From Follower to Challenger
Samsung Electronics' rebound has comprehensive fundamental support. Qualifying for NVIDIA and AMD certification changed the market's negative perception of its HBM and foundry competitiveness; and the US$16.5 billion multi-year semiconductor supply agreement with US-based Tesla—the largest order in Samsung Foundry's history—marks substantial progress in directly challenging TSMC in advanced logic processes.
From a valuation perspective, Samsung holds substantial cash on its balance sheet, providing the financial flexibility for continued investment across multiple business lines. The report specifically emphasizes this point, implying that management believes the market had previously underestimated the capital strength required for Samsung to maintain its competitive position in the AI era. These factors together drove the significant share price rebound during the reporting period.
However, a substantive gap remains between Samsung and TSMC in terms of advanced process yield and customer trust. While the Tesla order is strategically significant, automotive semiconductors typically have lower technical complexity and unit value than high-performance computing chips, and Tesla itself is advancing its in-house chip design capabilities. The long-term margin contribution of this order remains to be seen.
VI. MMG: Resource Endowment in the Energy Transition
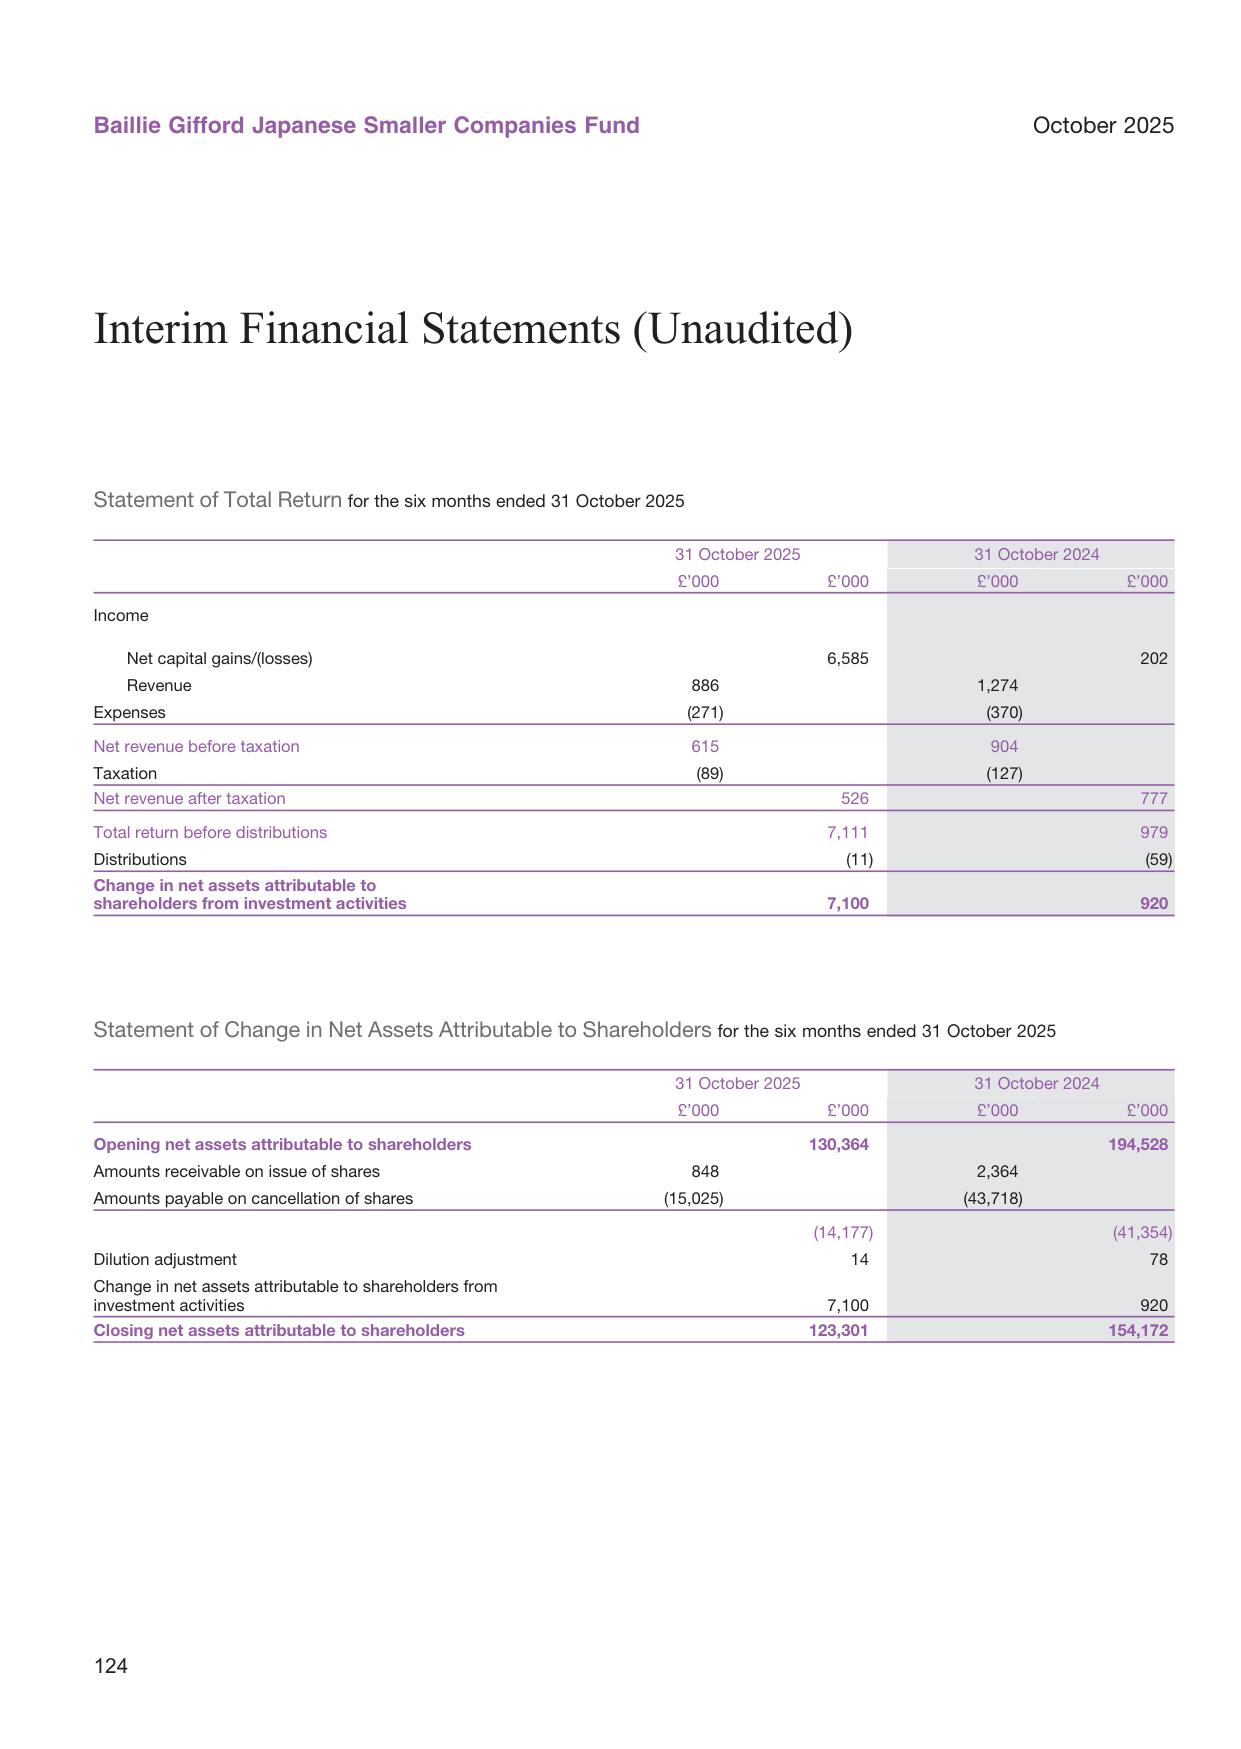
US retail sales monthly change trend, averaging 0.2% monthly growth over the past 12 months
MMG's strong performance is not an isolated event, but rather a micro-level validation of the macro logic that "the energy transition drives structural growth in copper demand while supply growth remains constrained." Record copper sales volumes in the first half of 2025, together with a significant production recovery at its Las Bambas mine, constituted a double positive at the fundamental level.
The production rebound at Las Bambas is particularly noteworthy. The mine had previously suffered repeated setbacks from community protests and operational disruptions; the production recovery marks a substantive improvement in operational risk. Against the backdrop of a lack of major new projects on the global copper supply side and sustained demand pull from electric vehicles and grid infrastructure, MMG's copper mining assets possess scarcity value.
VII. Extended Risk Disclosures: Systematic Inclusion of Non-Financial Risks
The risk disclosure section of the report presents three expanded dimensions worth noting:
- China market closure risk—this wording describes tail risks unique to emerging markets from an extreme policy assumption.
- Risk of asset loss due to custodian bankruptcy or negligence—this is a continuation of global regulatory reflection following the 2008 Lehman Brothers custodial failure, but it is rarely detailed in the risk disclosures of emerging market funds.
- Global factors such as military conflict and natural disasters/pandemics—this reflects that, in the post-pandemic era and amid geopolitical tensions, the scope of risk management has expanded from financial variables to systemic exogenous shocks.
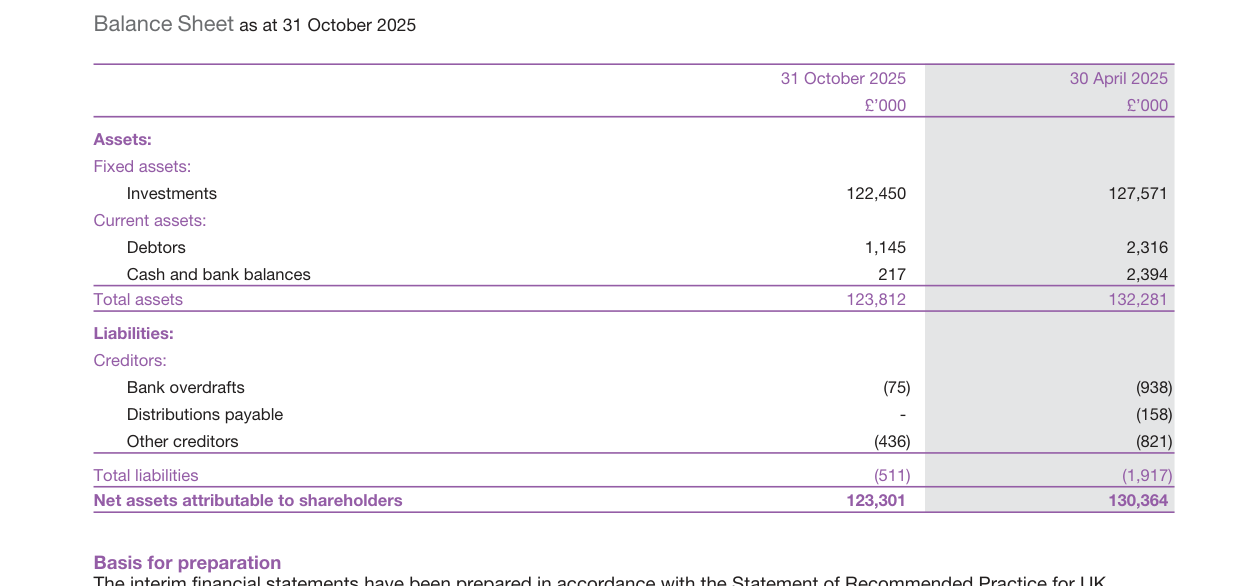
Global IPO first-day returns trend, with an average first-day return of 15% in 2024
These disclosures essentially acknowledge that: the representational power of traditional risk and return indicators (SRI ratings) is limited. The fund is classified at Level 6 (higher risk), primarily based on its equity nature, but the SRI fails to capture dimensions such as liquidity risk (assets may not be sold promptly under adverse conditions), custodian risk, and policy risk. Investors should treat the SRI as a starting point rather than an endpoint, and exercise independent judgment in combination with the fund's specific holdings and geographic concentration.
VIII. Conclusion: The Tension Between Strategic Conviction and Empirical Verification
This report demonstrates an active manager's strategic steadfastness in adversity—adhering to a long-term growth orientation, remaining unmoved in the face of short-term underperformance, and using a five-year horizon as a reasonable framework for self-assessment. But it also presents several contradictions that warrant cautious observation:
1. The possibility of consecutive failure to meet the five-year target is accumulating. Management's explanatory framework is reasonable, but if the 2025-2030 window ends without achieving 2% annualized excess returns, the strategy's effectiveness will face more serious questioning.
2. The TSMC cap issue exposes the structural squeeze that regulatory constraints impose on active management, and the actual effectiveness of its "compensatory holdings" in the semiconductor space still requires ongoing scrutiny.
3. The increased weights in Korea and Taiwan contributed significant returns over the short term, but also increased the fund's high sensitivity to the semiconductor cycle—should AI capital expenditure fall short of expectations, the portfolio's drawdown resilience will be tested under concentration.

US small business optimism index trend, with a 2024 reading of 98
A long-term perspective is indeed a reasonable timescale for evaluating growth investing capability, but time itself is not a guarantee of strategy effectiveness. The next five-year window will be the most convincing empirical test.
Key New Arguments and Extended Analysis
I. The Strategic Paradox and Internal Logic of "Underweighting TSMC" While "Adding to the Semiconductor Supply Chain"
A notable phenomenon during this reporting period: TSMC was listed as one of the drags on performance ("Fund's underweight position"), yet during the same period, the fund executed large-scale additions to the semiconductor supply chain. On the surface this appears contradictory, but it actually contains the manager's profound judgment on the changing landscape of the Asia-Pacific semiconductor industry.
| Direction | Target | Amount/Weight | Industry Positioning |
|---|---|---|---|
| Large buy | SK Hynix | £82.2M | HBM (high bandwidth memory) leader, core AI computing complement |
| Large buy | SK Square | £91.1M (buy) / final weight 5.41% | Samsung-affiliated holding company, semiconductor + financial investment platform |
| Add (continued) | Samsung Electronics | £61.0M | Integrated semiconductor + end-device manufacturer |
| Underweight (passive) | TSMC | 9.63% holding but below benchmark weight | Absolute leader in wafer foundry |
Global vaccine market size trend, reaching $80 billion in 2024
Three underlying threads for interpreting the combination of these moves:
First thread: "De-TSMC-ification" diversification within the AI computing chain. The fund did not systematically reduce semiconductor exposure but instead channeled incremental capital toward memory chips (SK Hynix, Samsung) and semiconductor holding structures (SK Square). This implies the manager believes the dividends of AI capital expenditure are no longer monopolized by wafer foundry alone; the supply-demand imbalance and price increase cycle in HBM has become a more certain beneficiary logic. SK Hynix, as NVIDIA's primary HBM supplier, may deliver better earnings elasticity in the 2025-2026 cycle than TSMC's relatively steady growth.
Second thread: Underweighting TSMC is more likely a valuation consideration than an outlook judgment. By October 2025, TSMC's AI-related revenue share had risen significantly, and the market had assigned a high expectation premium. The fund's choice to underweight is essentially a trade-off around "high quality but crowded"—compared with Tencent (8.68%) and Samsung Electronics (9.36%), TSMC's absolute weight of 9.63% still ranks first, indicating the fund is not genuinely bearish but is managing risk exposure at the margin.
Third thread: Strategic overweighting of the Korean market. Korea's weight surged from 10.78% to 17.05%, the largest increase of any regional allocation. This jump came primarily from double additions to SK Square and Samsung. SK Square, as Samsung Group's holding company with a portfolio spanning semiconductors, financials, and biotech, offers an efficient vehicle for "obtaining broad exposure to the Samsung ecosystem at a discount."
II. The Decision Time Gap in Alibaba's "Sell → Rebuy" and the Loss of Capital Efficiency
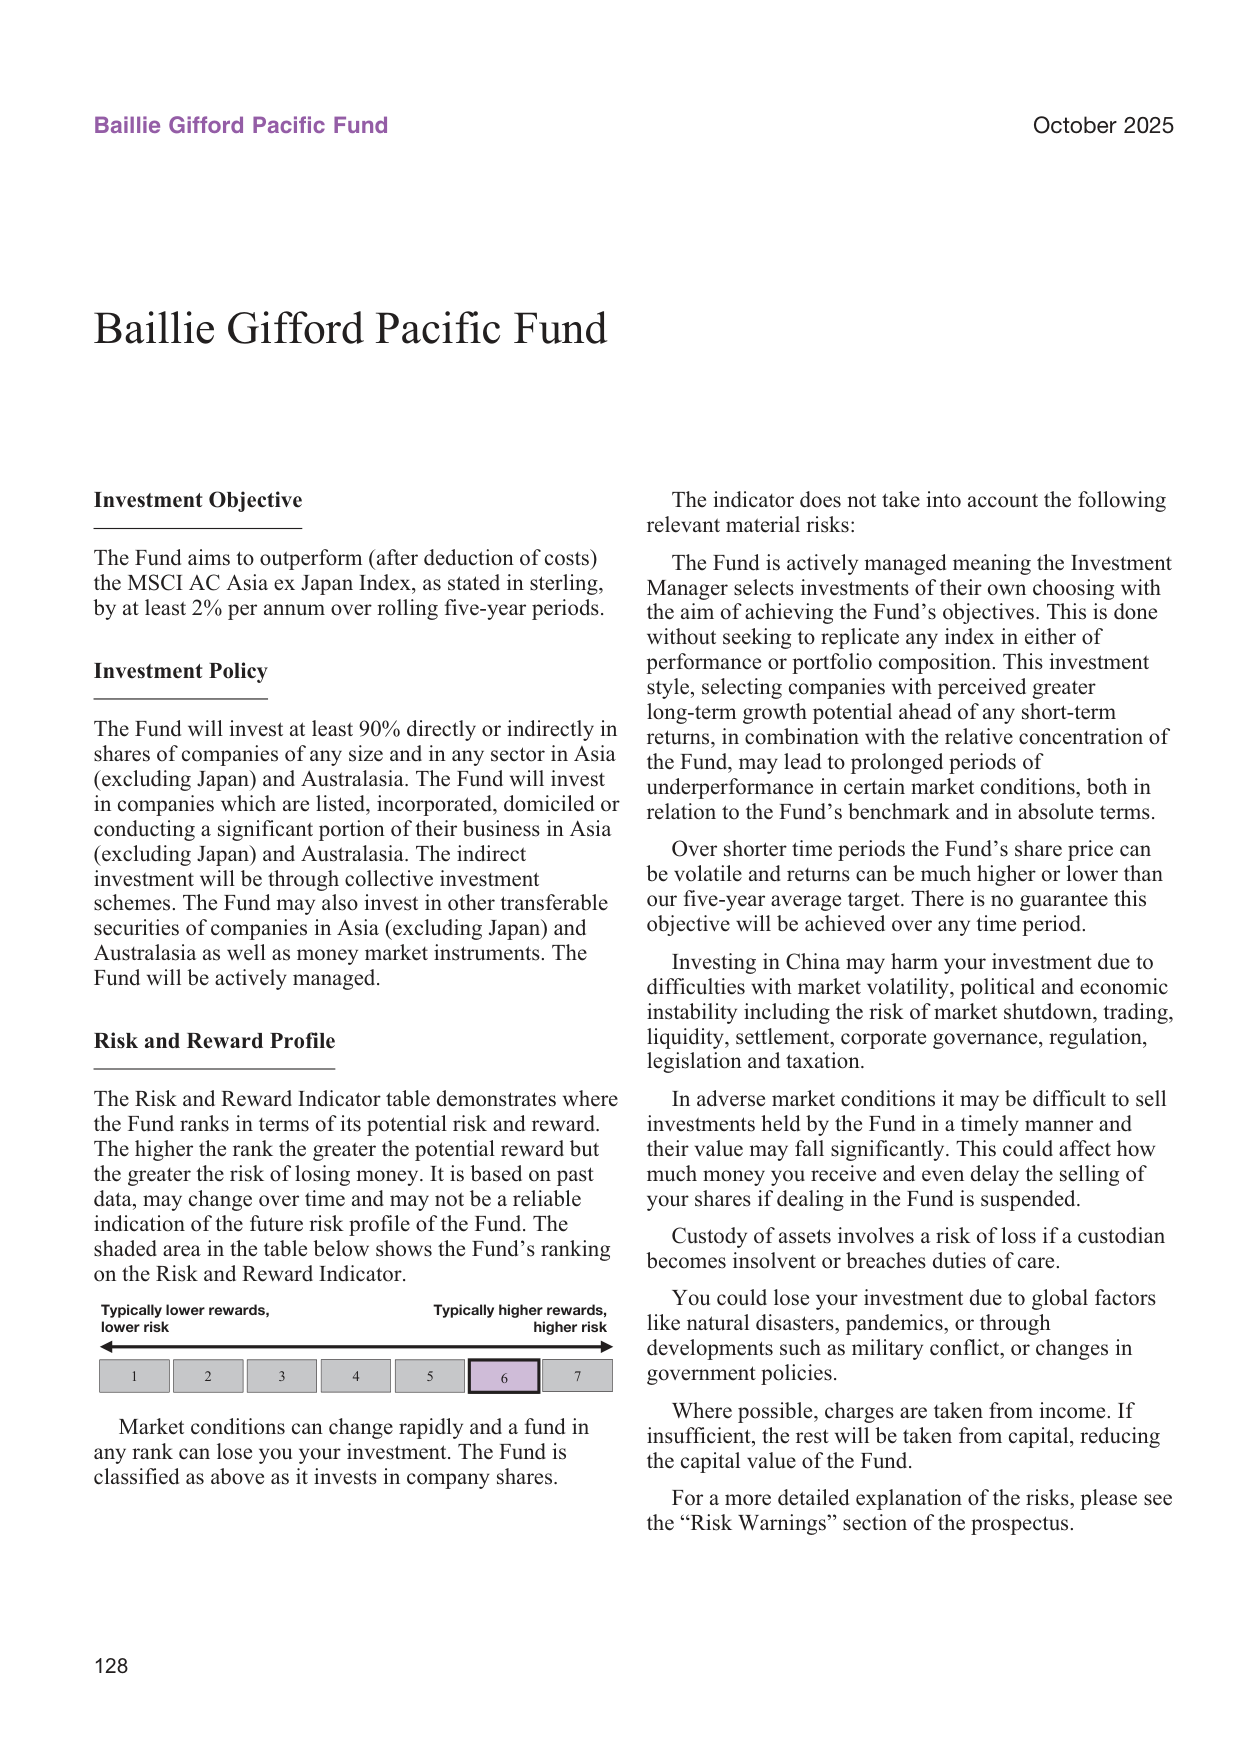
US mortgage application volume trend, down 10% in 2024 versus 2023
The report discloses an important operational clue: the fund "repurchased Alibaba in China" during the year, while simultaneously holding Alibaba (Hong Kong) and Alibaba Group Holding (possibly different share classes or entities), with combined weight reaching 3.90%. On paper, this appears to be a timely return—but looking back at operations in prior quarters, it can be inferred that the fund likely cleared its position when Alibaba's share price was lower or during a period of greater uncertainty, and repurchased at a higher valuation after its AI narrative became clearer.
| Time Point | Alibaba Theme | Valuation Status |
|---|---|---|
| FY2024-2025 (approximately Nov 2024-Apr 2025) | Intensifying e-commerce competition, uncertain cloud growth, weak macro consumption | Valuation depressed for an extended period, market focused on risks |
| H2 2025 | Strategic focus on cloud computing + AI infrastructure, clear capex plans | Improving expectations, valuation repair underway |
| October 2025 (this reporting period) | "Restored strategic clarity" | Entered after upward trend confirmed |
Assessment of this operation: The reasons given by the manager are "strategic clarity" and "cloud + AI infrastructure investment plans"—both of which are essentially information-level catalysts rather than fundamental scarcity. Alibaba was not without a cloud business or AI initiatives in 2024; what really changed was the clarity of management's external communication and capital allocation discipline. The fund's willingness to rebuild the position for this reason indicates that its investment framework is highly sensitive to the "management strategic focus" variable. But this also exposes a shortcoming: had the fund added counter-cyclically when the market was extremely pessimistic on Alibaba (rather than chasing in after strategic signals were confirmed), its excess returns would have been more pronounced.
III. From Phoenix Mills to Didi: A "Cross-Market Reallocation" from Indian Real Estate to Chinese Mobility
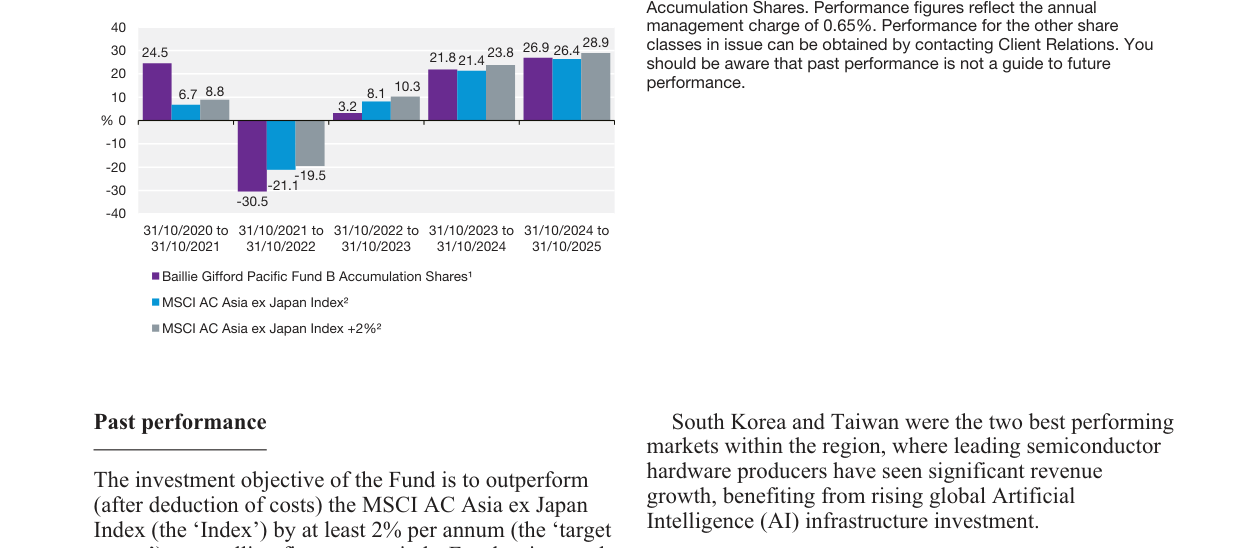
Global broadband subscriptions trend, reaching 1.4 billion in 2024
The sale of Phoenix Mills (Indian shopping mall operator) and JD.com, alongside the purchase of Didi, forms a cross-market substitution from "Indian consumer real estate → Chinese platform economy."
The logic behind selling Phoenix Mills deserves scrutiny: Indian premium retail real estate was in an upcycle in 2025, with clear urban middle-class consumption upgrade trends. The fund's decision to take profits at this point may reflect: ① the position had already appreciated significantly, with much of the growth priced into the valuation; ② India's overall weight was cut from 16.31% to 9.53%, representing a systematic regional rebalancing rather than a single-name risk judgment. From the holdings detail, India still retains real estate names such as DLF and Equinox India Developments, indicating the fund has not abandoned the Indian real estate theme but has shifted to targets with better value or different sub-segments.
The logic behind buying Didi is very "Baillie Gifford style": the report emphasizes its "unrivalled scale and data capabilities," a typical screen criterion for long-term growth stocks. After regulatory crackdowns, US delisting risk, and intensified competition, Didi still maintains a dominant position in China's ride-hailing market, with scale barriers and data network effects. Notably, the fund chose Didi Global ADR (US depositary receipts) rather than Hong Kong shares—likely reflecting a comprehensive consideration of liquidity and valuation discount. With an initial position cost of £56.96 million, the market value reached £57.62 million by period end, essentially flat, indicating a relatively neutral entry point.
IV. Vietnam Weighting Remains High—The Overlooked Third Pole of the Region
In this report, India's weight was nearly halved (16.31%→9.53%), while Vietnam's weight only declined marginally from 9.56% to 8.31%, with an unusually rich holding structure: six Vietnamese names spanning banking (HDBank, MBB, Vietcombank), technology (FPT), steel (Hoa Phat), retail (Mobile World), and general investment (Vietnam Enterprise).
This allocation reveals the fund's "China-India-Vietnam triangle" regional logic:
- China (40.39%): Core position, focused on platform economy + high-end manufacturing;
- Vietnam (8.31%): Dual engine of supply chain relocation + domestic consumption, serving as a complementary exposure to China's manufacturing upgrade;
- India (9.53%): Core financial and consumer names retained, but overall exposure reduced to control valuation risk.
US energy consumption by source: oil 32%, natural gas 30%, renewables 12%
Vietnam's absolute weight exceeds that of any single market other than Taiwan (14.78%), and covers nearly all of the country's high-liquidity industry leaders, indicating that Baillie Gifford's Vietnam allocation is not tentative but a strategically researched position.
V. Investment Operational Constraints Under Subscription/Redemption Pressure—A Neglected Dimension
Comparing key data reveals:
| Time Point | B Accumulation Shares | A Accumulation Shares | Fund Net Assets (£'000) |
|---|---|---|---|
| 30 April 2025 | 199,537,720 | 297,701 | 2,425,500 |
| 31 October 2025 | 168,300,704 | 255,511 | 2,845,457 |
Global urbanization rate trend, reaching 57% in 2024
Class B shares decreased substantially by approximately 31.2 million shares (-15.6%), and Class A shares fell by approximately 42,190 shares (-14.2%), yet fund net assets actually rose from £2.43B to £2.85B. This contrast indicates that the fund recorded significant positive returns during the period (NAV rose from 948.05p to 1,312.04p, an increase of approximately 38.4%), but investors continued to redeem during the rally. This "redeeming as it rises" holder behavior forced the manager to sell holdings at lows or during the uptrend to meet redemptions. While participating in IPOs and building new positions such as Didi, some of the motivation for selling Phoenix Mills and JD.com may not have been purely fundamental judgment but driven by liquidity management.
This also explains why the fund added to SK Square (high liquidity, large cap) while underweighting TSMC—under net redemption pressure, the manager tends to increase holdings of highly liquid assets to maintain portfolio liquidity flexibility.
VI. The Residual Eden Biologics Position—A Case of Long-Term Value Destruction
The portfolio still retains a position in Eden Biologics (formerly JHL Biotech), with a market value of only £85,000, representing 0.00% of net assets. This is a legacy issue from a value impairment already recognized in FY2021. Although the stock has been delisted from the Taiwan Stock Exchange, the fund still holds 1,327,302 shares, valued using the "adjusted latest investment price" method. This case is worth documenting because it reminds investors that even long-term growth funds can suffer total losses from corporate governance or capital operation failures, even under Baillie Gifford's consistently rigorous research screening. Compared with positions of hundreds of millions of pounds in the portfolio, this £85,000 is almost negligible, but its very presence in the investment report serves as a sobering correction to the assumption that "growth investing is necessarily correct."
VII. Three Patterns of Regional Weight Changes and Portfolio Rebalancing Logic
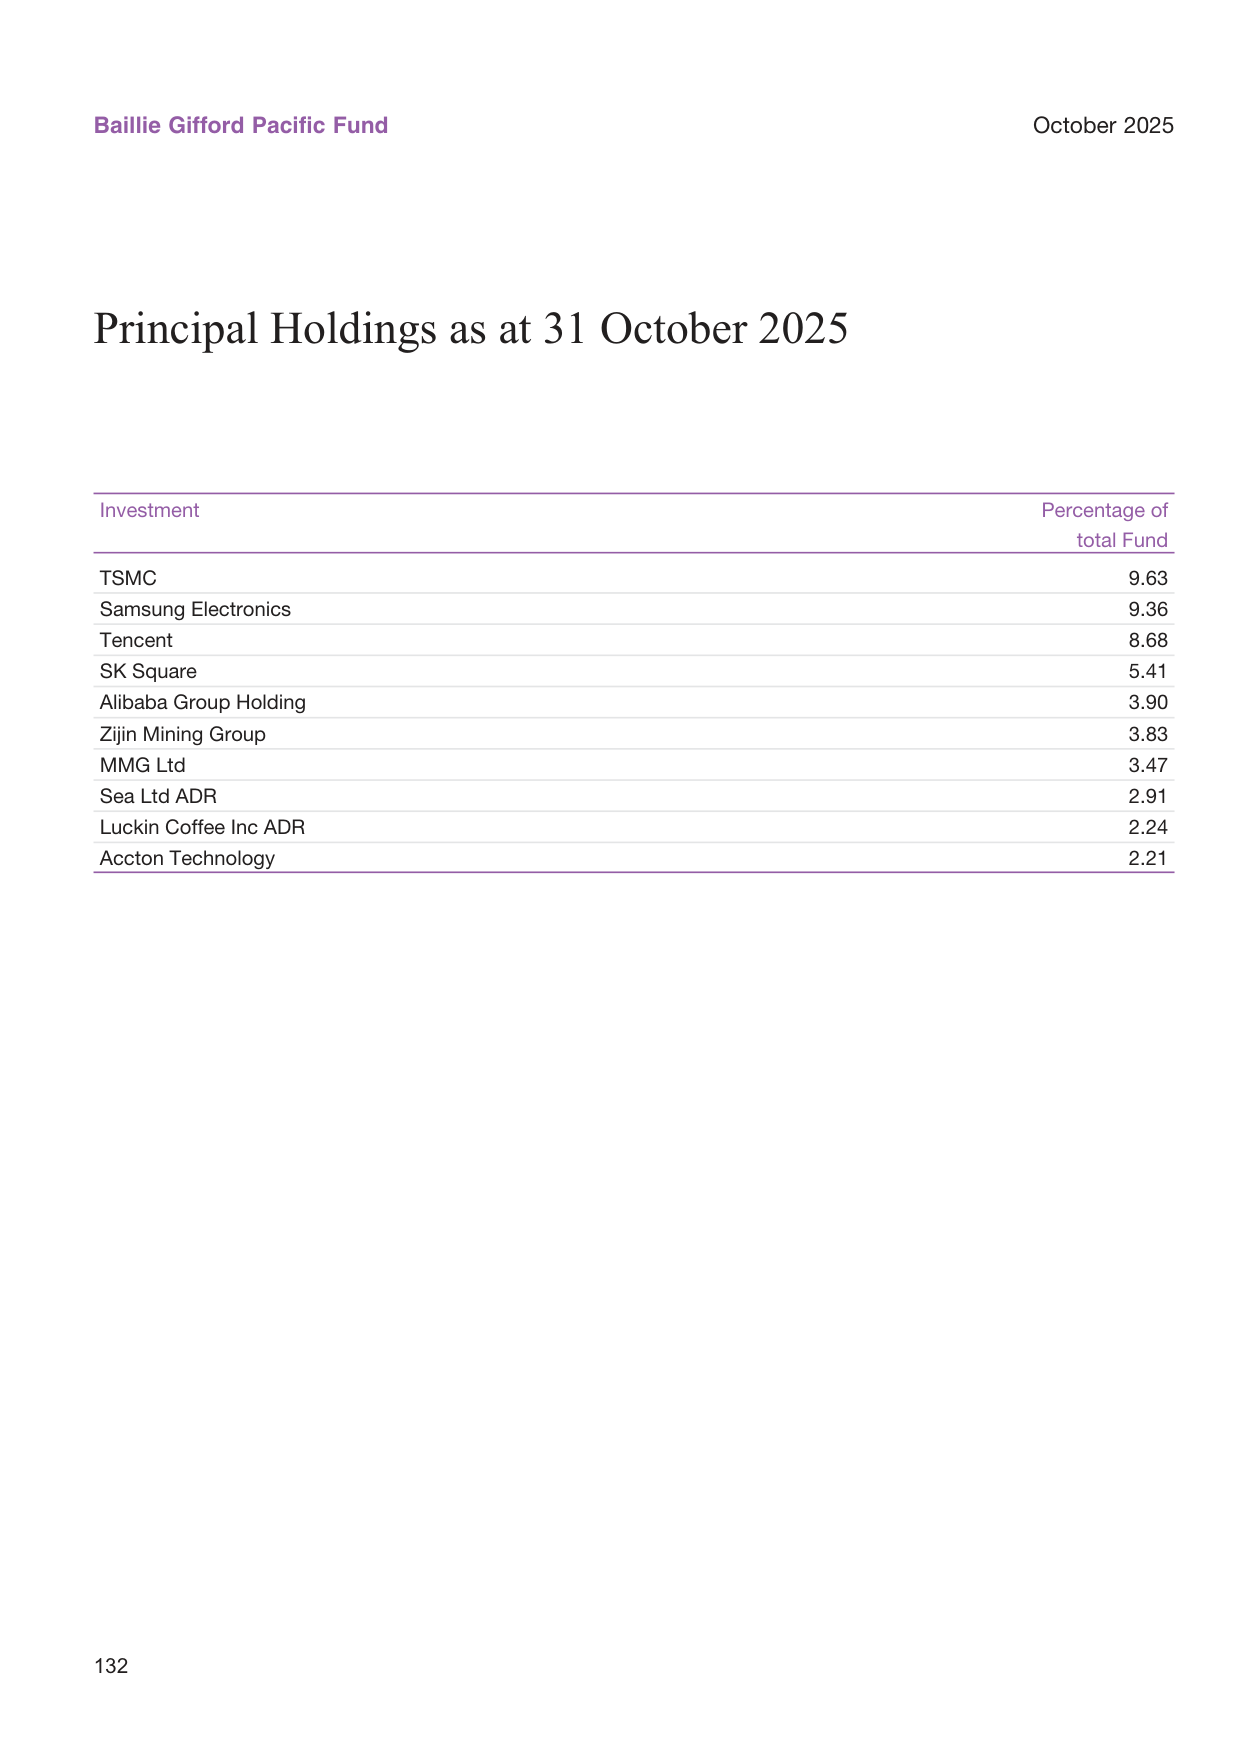
US industrial capacity utilization trend, at 78% in 2024
| Region | Weight on 30 April 2025 | Weight on 31 October 2025 | Direction | Representative Actions |
|---|---|---|---|---|
| China | 39.73% | 40.39% | +0.66pp | New Didi position, Alibaba return, CATL IPO |
| Korea | 10.78% | 17.05% | +6.27pp | Significant additions to SK Square/Samsung/SK Hynix |
| India | 16.31% | 9.53% | -6.78pp | Sold out Phoenix Mills, reduced HDFC etc. |
| Vietnam | 9.56% | 8.31% | -1.25pp | Core positions maintained, minor adjustments |
| Taiwan | 13.80% | 14.78% | +0.98pp | Added to Accton/Chroma ATE |
| Singapore | 4.44% | 3.35% | -1.09pp | Reduced Sea Ltd/Grab |
| Hong Kong | 0.93% | 1.76% | +0.83pp | New Zijin Gold International position |
The table presents a clear rebalancing direction: shifting from Indian consumer/financials toward Korean semiconductors/holding groups, while maintaining the stability of the core China position. The magnitude of the India reduction and the Korea increase is almost perfectly symmetrical (-6.78pp vs. +6.27pp), which is unlikely to be coincidence and more likely reflects a planned regional rotation—converting Indian assets whose growth expectations were already fully priced into Korean semiconductor assets with more obvious valuation discounts and higher elasticity to the AI hardware cycle.
VIII. A Critical Examination of the Manager's "IPO Participation" Behavior
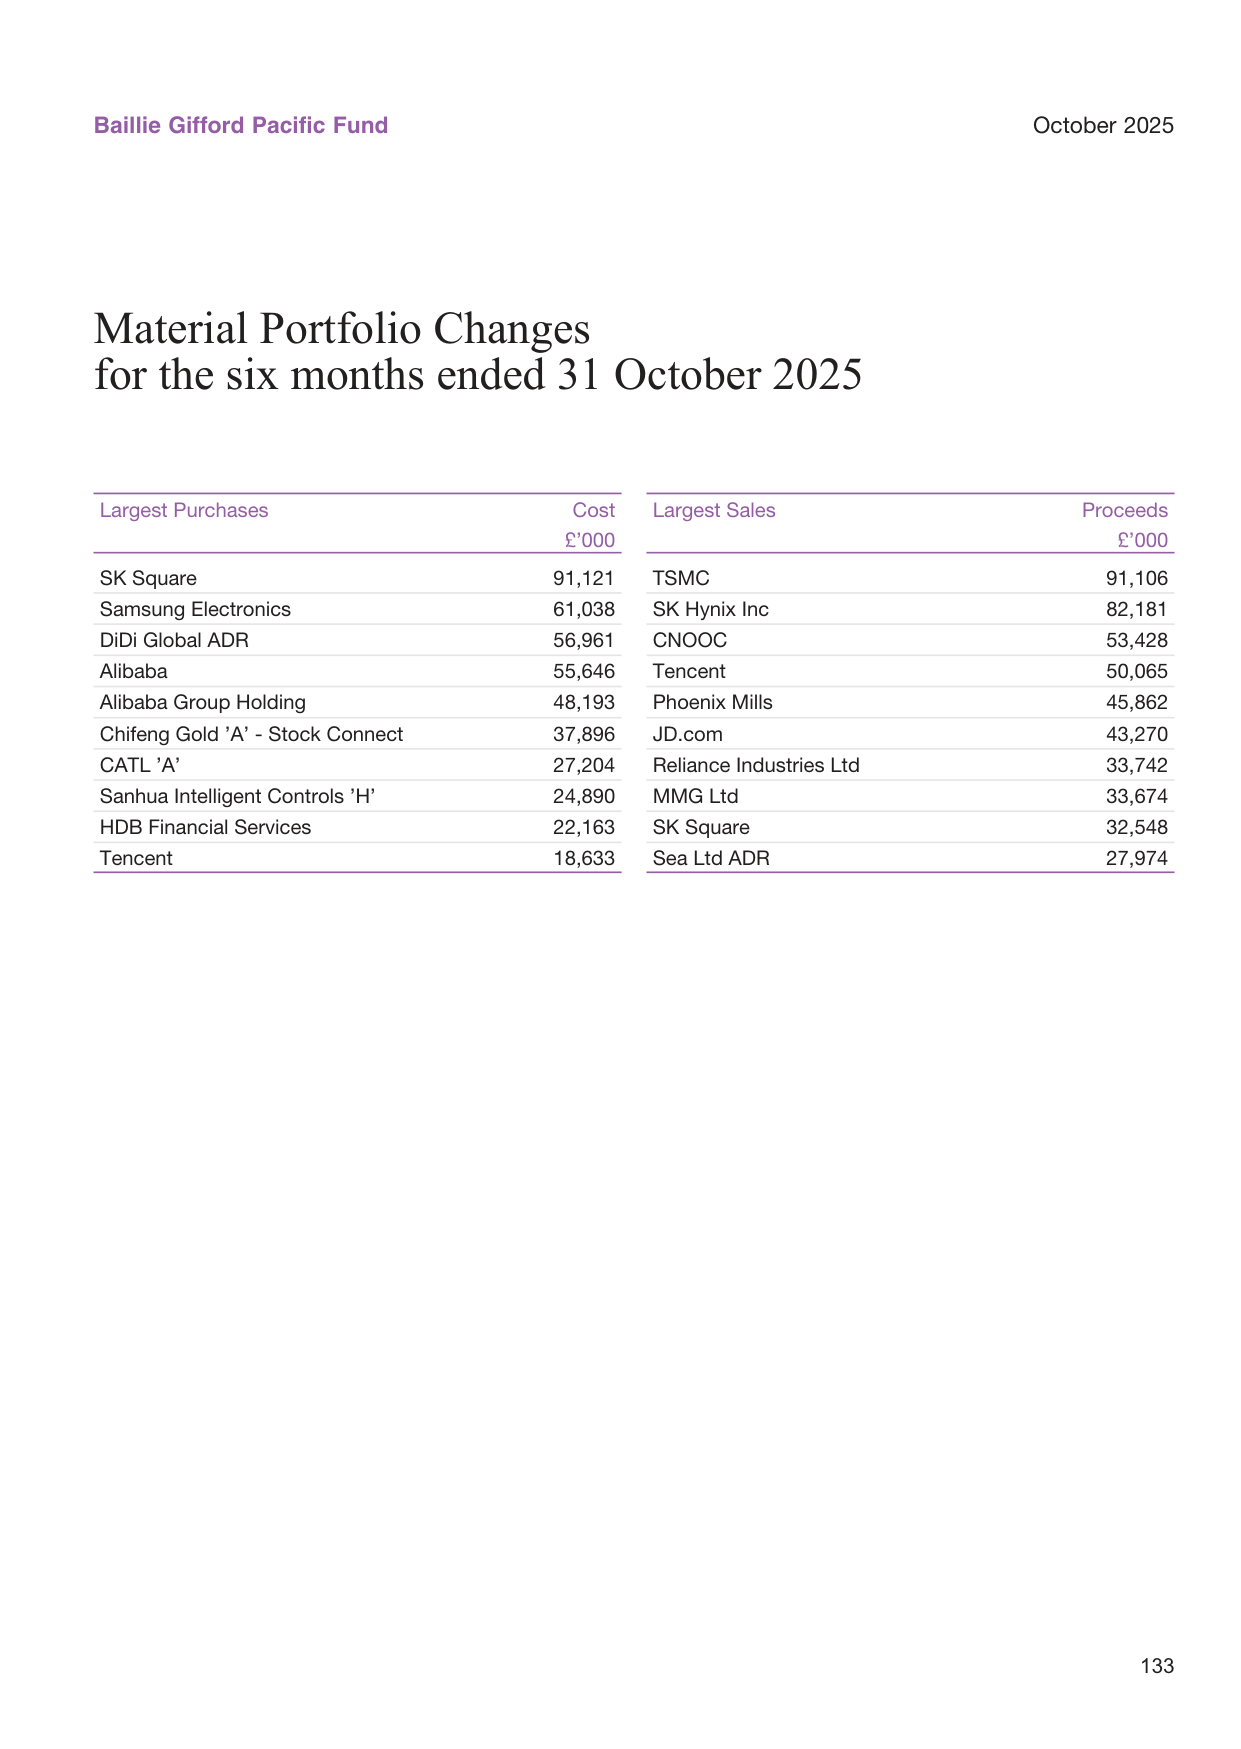
Global patent litigation cases trend, up 8% in 2024 versus 2023
The three Hong Kong IPOs participated in during the period (CATL, Zijin Gold International, Sanhua Intelligent Controls) all fall into the "star company return listing in Hong Kong" category. This operational model has three concerns:
① Pricing efficiency issues. When large companies IPO in Hong Kong, sufficient public market information already exists, and first-day pricing typically reflects market consensus. Baillie Gifford's participation as an anchor investor offers limited "discount" relative to waiting for a better price in the secondary market, providing no clear advantage.
② Capital lock-up costs. IPO shares typically have lock-up periods, which limit the manager's flexibility in rapidly changing market conditions. Given that the fund itself faces net redemption pressure, locking capital into new IPO shares creates tension with liquidity management needs.
③ The hidden assessment of opportunity cost. The report packages targets such as CATL as "global leaders" and "niche suppliers," but does not explain whether relative valuations are attractive. Taking CATL as an example, it has a long trading history in A-shares; the true decision basis is the discount between the H-share issue valuation and the A-share price—this critical reference dimension is not mentioned in the report.
IX. Concluding Observations
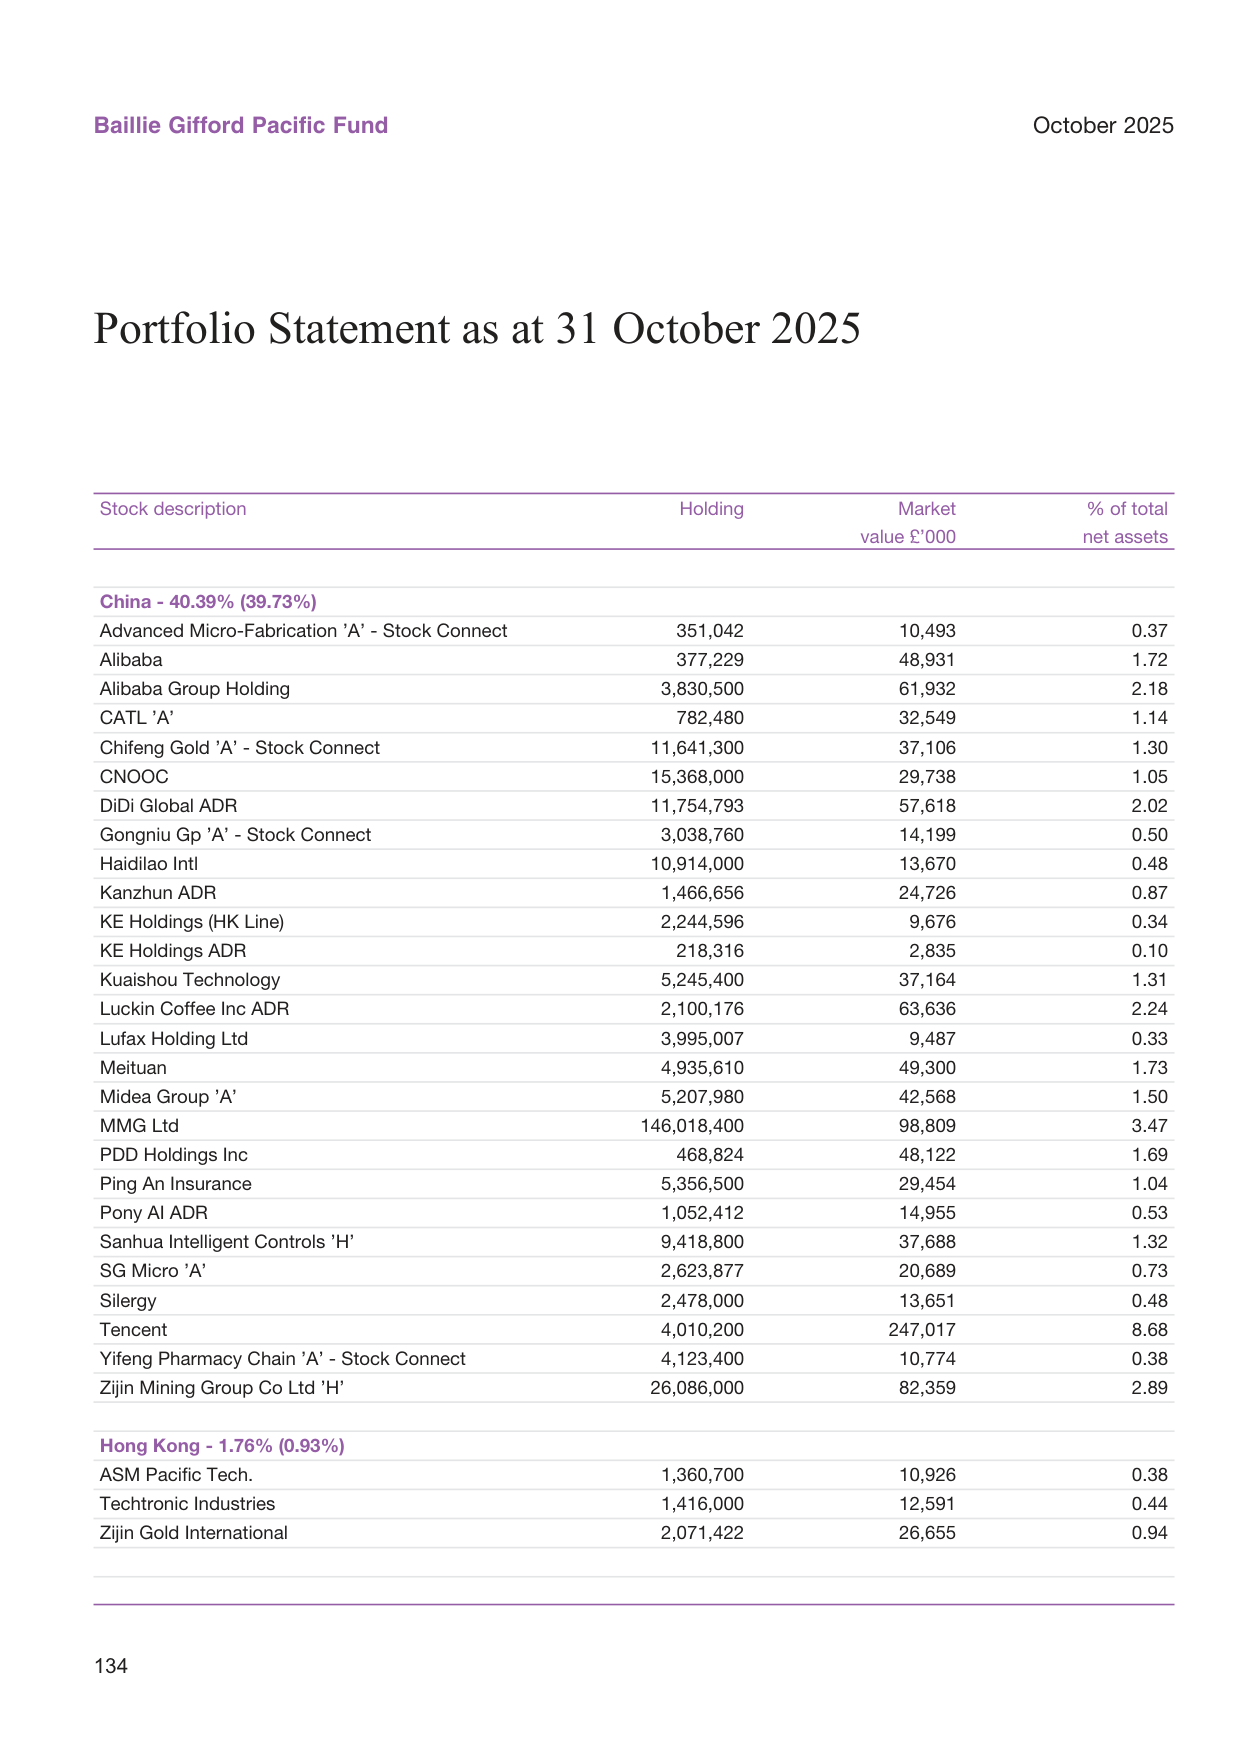
US employment cost index trend, up 4.0% year-over-year in 2024
The operations during this reporting period reflect the fund's continued oscillation between "growth quality" and "valuation discipline": the underweight in TSMC reflects crowded-trade avoidance, while the additions to SK Square/SK Hynix represent a pursuit of cyclical elasticity; the return to Alibaba is a strategic correction, but the Didi position reverts to a typical platform-growth narrative. The reduction in India and expansion in Korea constitute the most signal-rich regional rebalancing of the year.
On the data side, Class C NAV rose from 1,327.77p to 1,851.47p, an interval gain of 39.4%—an impressive performance. But the continued outflow from Class B shares reminds us that NAV growth and capital inflows are not synchronized; this may be a vote by long-term investors expressing concern over portfolio style drift or market valuations. The fund's exposure to the AI hardware supply chain is now quite concentrated (Korea 17.05% + Taiwan 14.78%, totaling over 32%), and should the global AI capex cycle show marginal deceleration, the portfolio's drawdown elasticity could be greater than its historical average.
The following supplements the second part with new analytical perspectives and key data on the notes, financial statements, and dilution adjustment policies.
1. Disclosure Traps Revealed in the OCF Notes: Methodology Changes and Actual Fee Estimates
Footnotes 1-5 at the end of the document merit in-depth interpretation. On the surface, the fund's reported Ongoing Charges Figure (OCF) "rose" due to new IA guidance effective July 2022, but the footnotes clearly state:
- As of 30 April 2024, the ACD considered the more indicative OCF for Class A shares to be 1.56%;
- As of 30 April 2023, it was likewise 1.56%;
- As of 30 April 2023, operating expenses included 0.04% of closed-ended fund indirect costs.
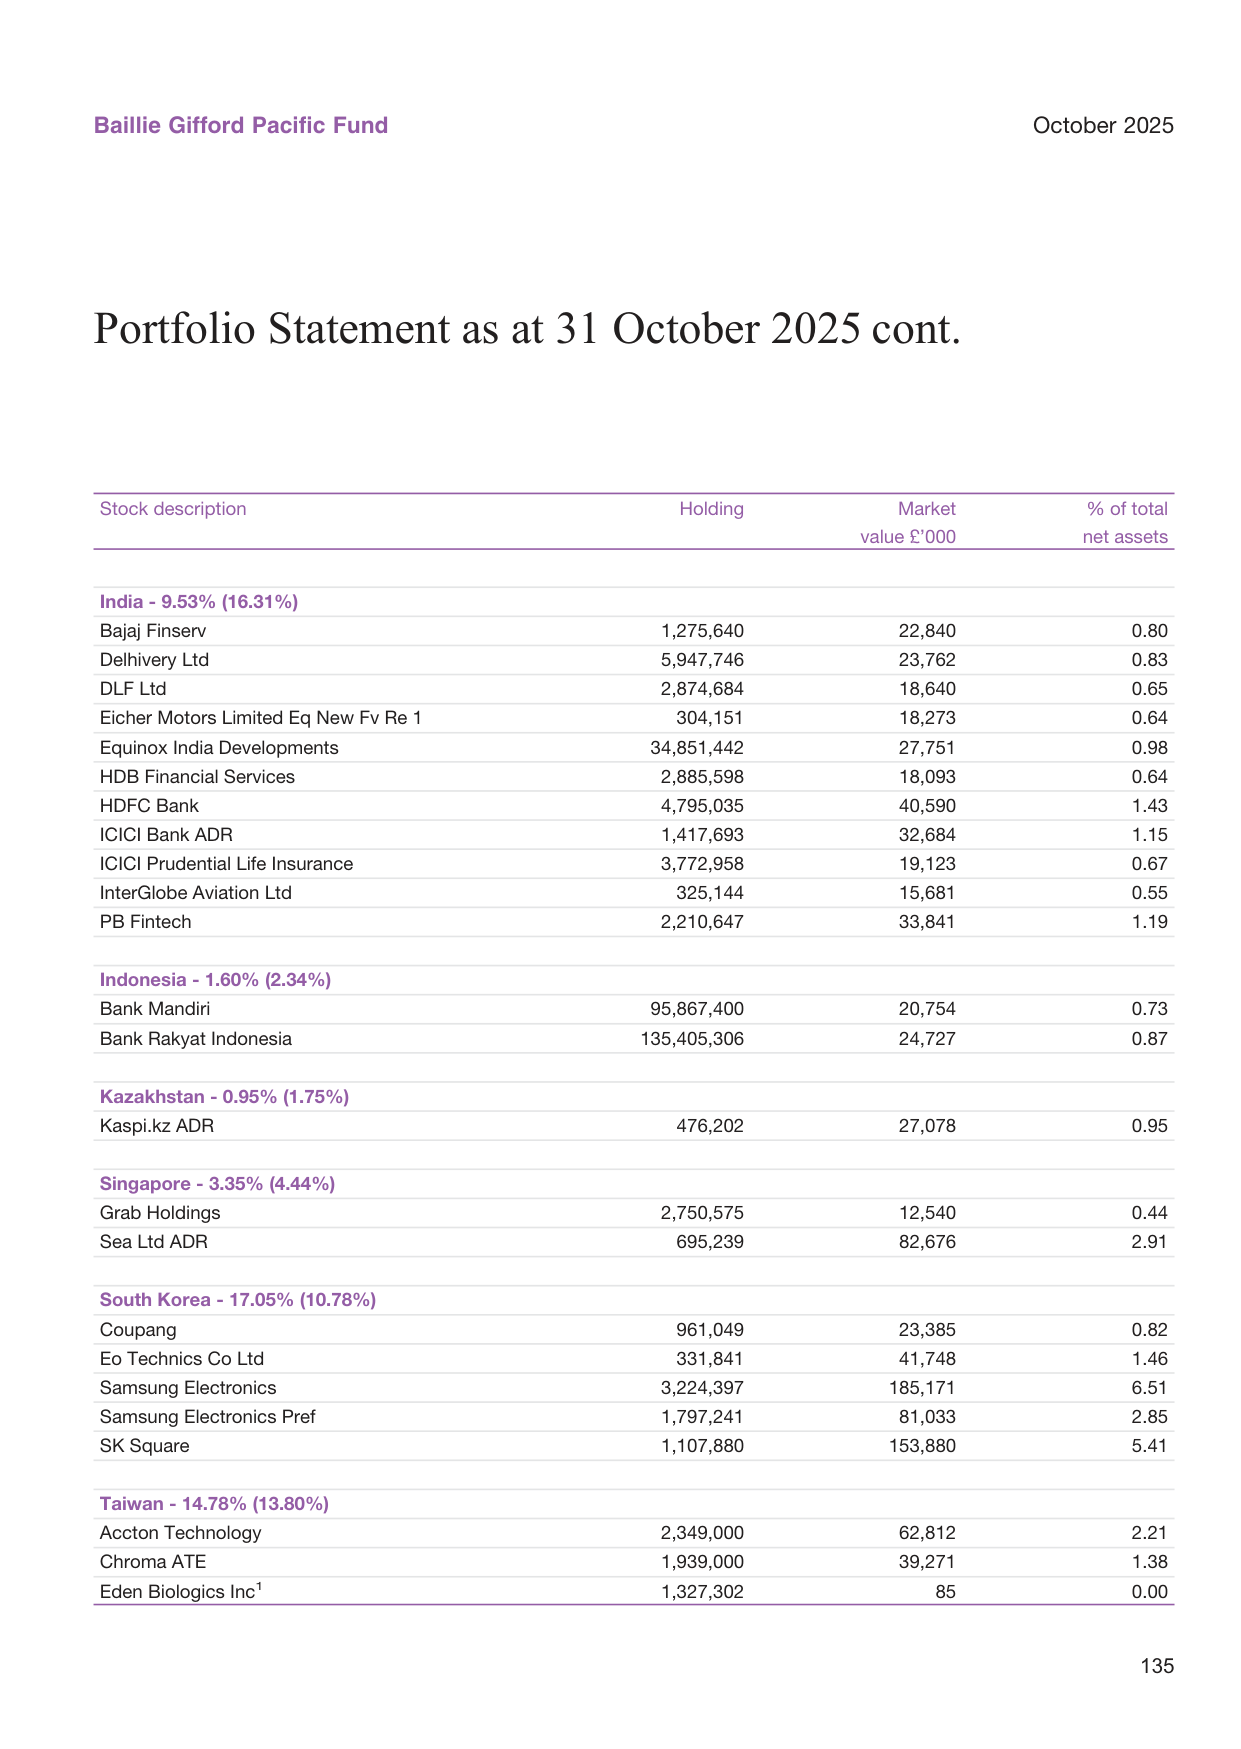
Global container shipping rates trend, with a 40-foot container rate of approximately $2,500 in 2024
This set of data shows that the OCF investors see in the report may overstate true costs due to changes in accounting methodology. Especially for active funds holding closed-ended funds, indirect cost disclosure is intended to improve transparency rather than to represent an actual increase in cash expenses. Therefore, when making horizontal fee comparisons, one should not directly compare OCFs across different reporting periods; instead, one should rely on the ACD's "indicative fee rate" in conjunction with the Enhanced Disclosure of Fund Costs and Charges document in the fund's annual report.
2. H1 2025 Financial Statements: Surge in Capital Gains vs. Decline in Both Income and Redemptions
| Metric (£'000) | As of 2025-10-31 | As of 2024-10-31 | YoY Change |
|---|---|---|---|
| Net capital gains/losses | 831,550 | 22,645 | +3,572% |
| Revenue | 26,858 | 39,474 | -32.0% |
| Expenses | 9,082 | 11,309 | -19.7% |
| Net income (after tax) | 15,614 | 24,732 | -36.9% |
| Net change in net assets from investments | 845,691 | 46,695 | +1,711% |
| Net share subscriptions/redemptions (net) | -427,136 | -70,201 | Redemptions magnified 6x |
| Period-end net assets | 2,845,457 | 3,196,594 | -11.0% |
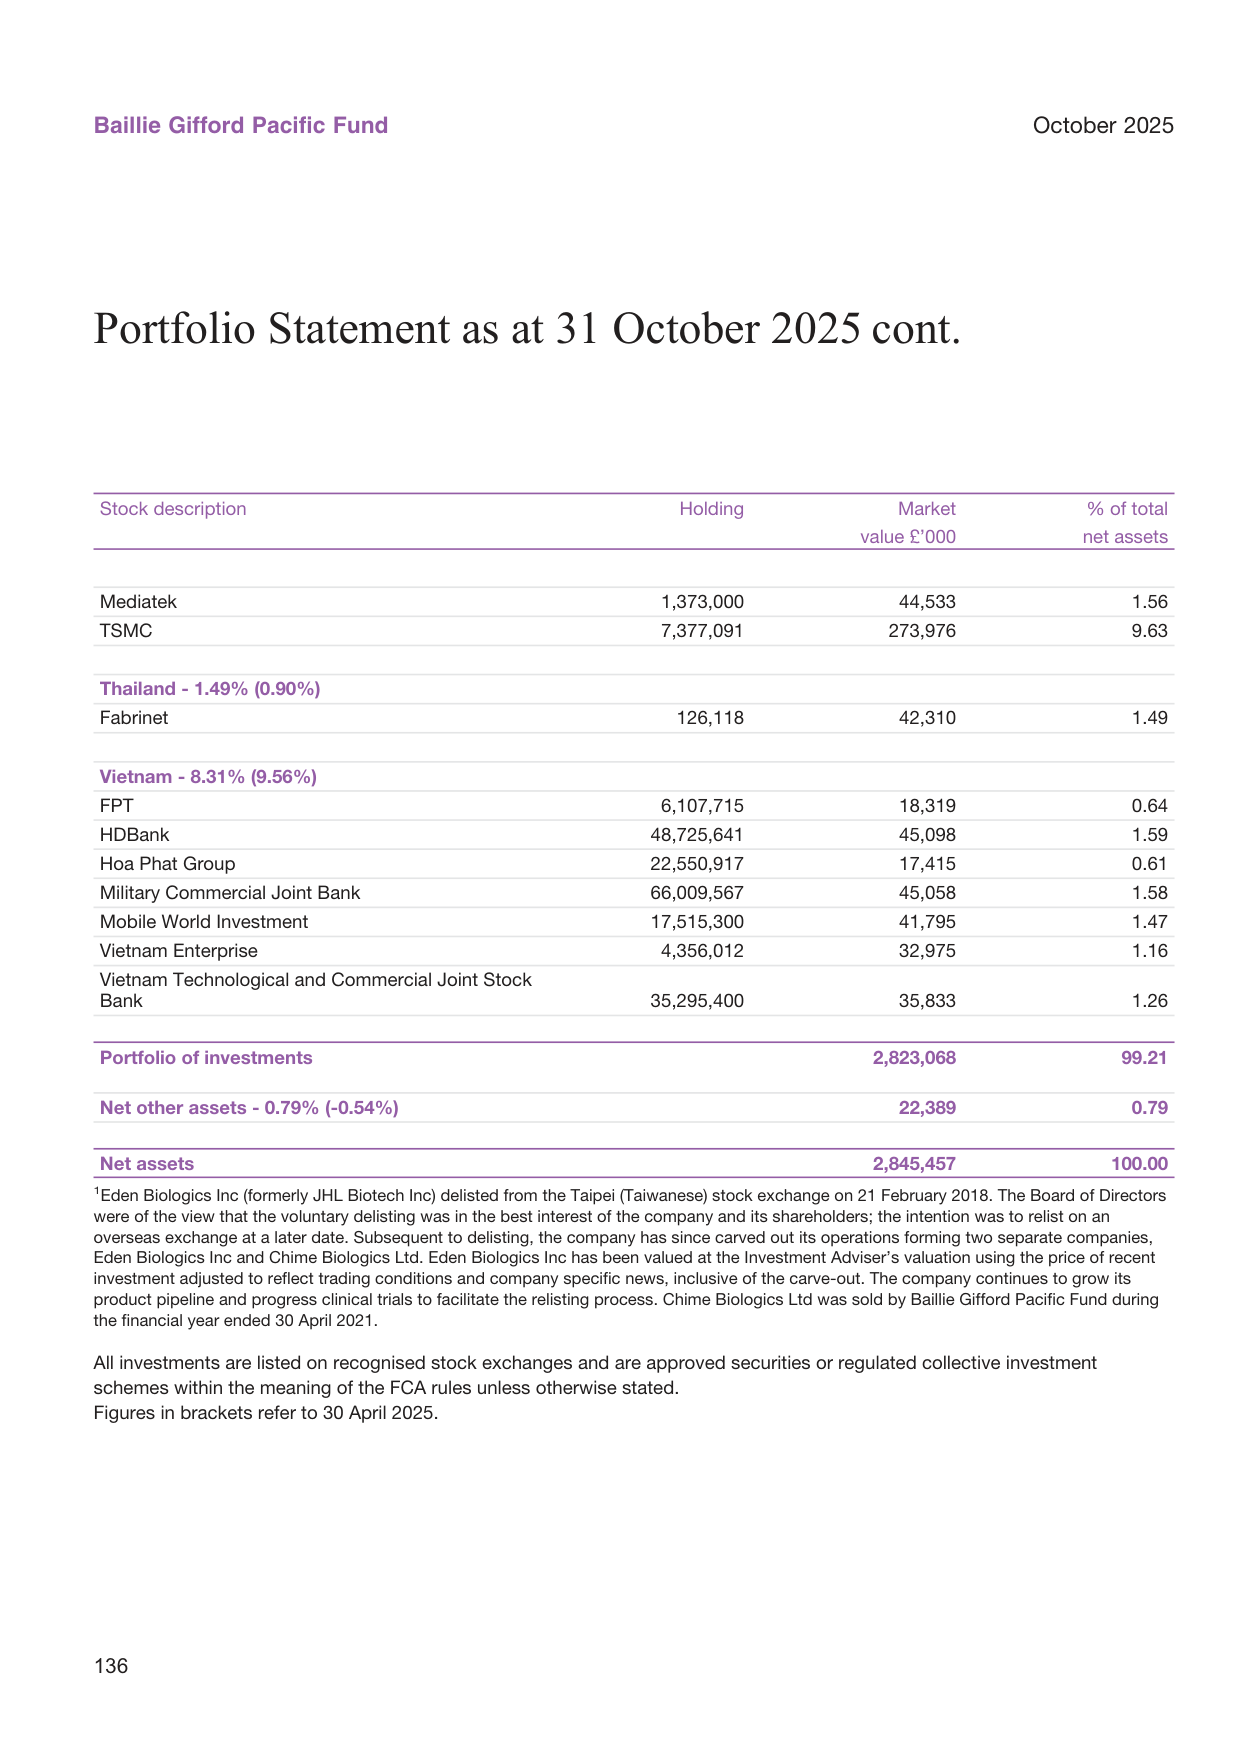
US real GDP growth vs. consumption growth, with GDP up 2.2% and consumption up 2.0% in 2024
2.1 Capital Gains Dominate Returns While the Income Side Continues to Shrink
Total returns in H1 2025 were almost entirely contributed by unrealized/realized capital gains (£831.6 million), while the income side was only £26.9 million, down sharply by 32% from the prior-year period. This structural characteristic implies:
- The fund is more of a "growth" than an "income" portfolio;
- The decline in income may stem from lower cash ratios, an increased weight in lower-dividend-yield holdings, or the sale of high-dividend stocks during the period;
- The decline in expenses (-19.7%) was significantly smaller than the decline in income, leading to further deterioration in the net income ratio.
2.2 Massive Redemption Pressure and the Actual Role of Dilution Adjustment
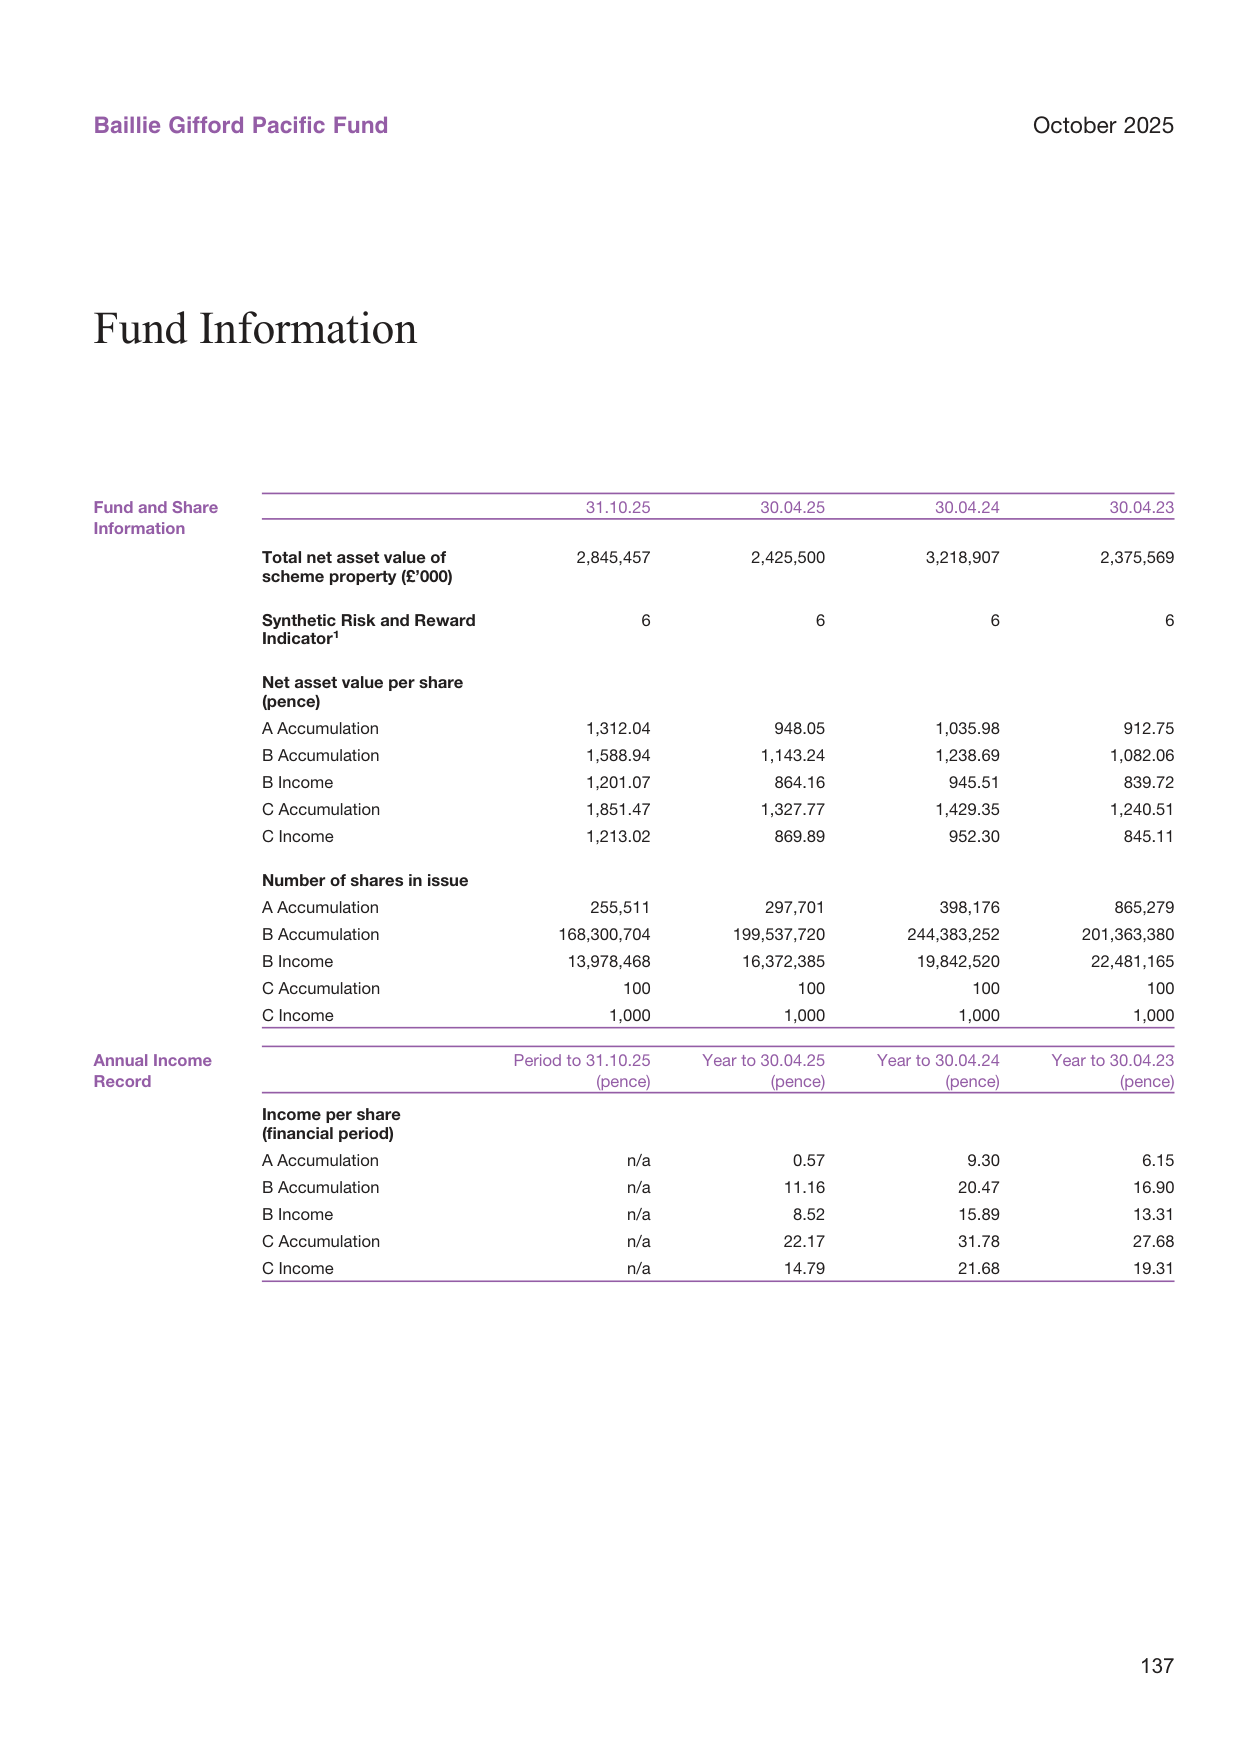
Global data center energy consumption trend, accounting for 1.5% of global electricity in 2024
Net redemptions surged from £70.2 million in the prior-year period to £427.1 million, indicating that investors chose to take substantial profits as fund NAV rose. Without the Dilution Adjustment mechanism, these redemptions would have caused remaining shareholders to bear unnecessary transaction costs. The dilution adjustment gain recognized during the period was £1,402 thousand, modest relative to the redemption scale, but it demonstrates the ACD's execution capability in protecting continuing holders.
2.3 The "Decline Then Rise" Path of Net Asset Size
Net assets at the end of April 2025 were £2,425.5 million, versus £3,196.6 million at the end of October 2024. This indicates that during the six months from November 2024 to April 2025, the fund experienced significant shrinkage in size (possibly compounded by market declines). However, in H1 2025, strong capital gains not only covered the redemption gap (-£427 million) but also pushed net assets up to £2,845.5 million. Investment positions on the balance sheet increased from £2,438.5 million to £2,823.1 million, a gain of 15.8%, broadly matching the capital gains increase.
3. Policy Details of Dilution Adjustment: Hidden Costs for Small Investors
The second part provides the complete conditions for applying dilution adjustment (a-e) and operational principles. Several new points deserve particular attention:
3.1 The "Threshold Trigger" Mechanism Magnifies Small Transaction Costs
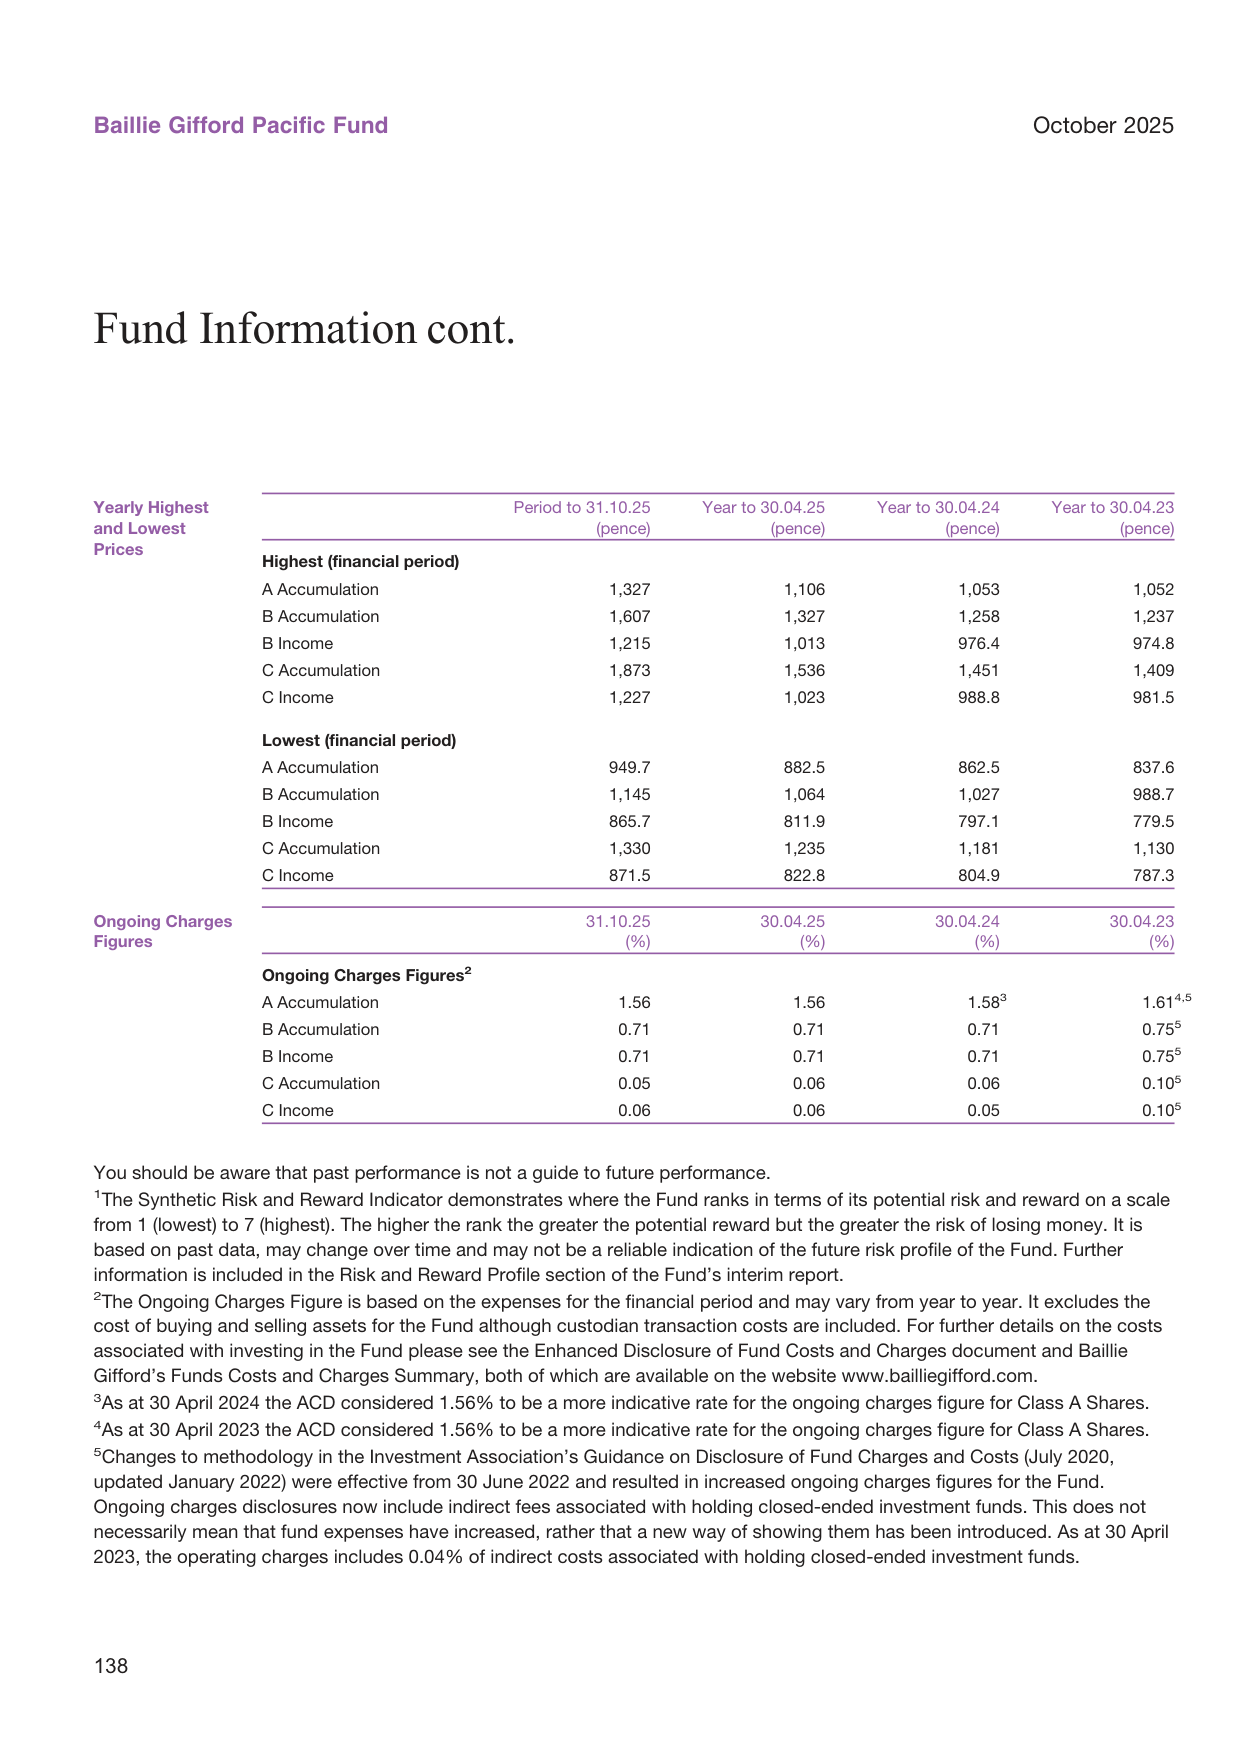
US household debt composition pie chart: mortgages 70%, credit cards 8%, student loans 5%
The text explicitly mentions that when the fund's daily net inflow/outflow exceeds a certain threshold, the ACD will increase the dilution adjustment percentage to reflect the impact cost of large transactions. But one side effect is that small transactions on the same day will also be executed at the adjusted higher price. In other words, a retail investor who does not trigger the threshold may passively pay a wider bid-ask spread due to large capital flows from others. This is a trade-off between "fairness" and "efficiency"—protecting long-term holders while sacrificing precise cost matching for small subscriptions/redemptions.
3.2 The Asymmetry of Adjustment Ratios
Dilution adjustment raises the subscription price on net inflows and lowers the redemption price on net outflows. On the surface this is symmetrical, but in actual execution, because the market impact and taxes from selling assets tend to be higher than buying (e.g., stamp duty on sales, wider bid-ask spreads), redemption adjustments are typically more significant. Based on the text's reference to "changes depending on market conditions," investors cannot know the exact adjustment ratio in advance, adding uncertainty to intraday trading.
3.3 Management Discretion Lacks Hard Constraints
The ACD retains "sole discretion" to decide whether to adjust, the level of adjustment, and whether to change the policy. Although the COLL Rules permit this approach, from an investor protection perspective, the lack of objectively transparent quantitative standards (such as specific threshold values and adjustment ratio calculation models) remains a potential point of contention. Investors can only perceive the existence of adjustments by observing post-hoc deviations between execution prices and the published NAV (mid-market).
4. Cross-Validation of SRRI and OCF Notes
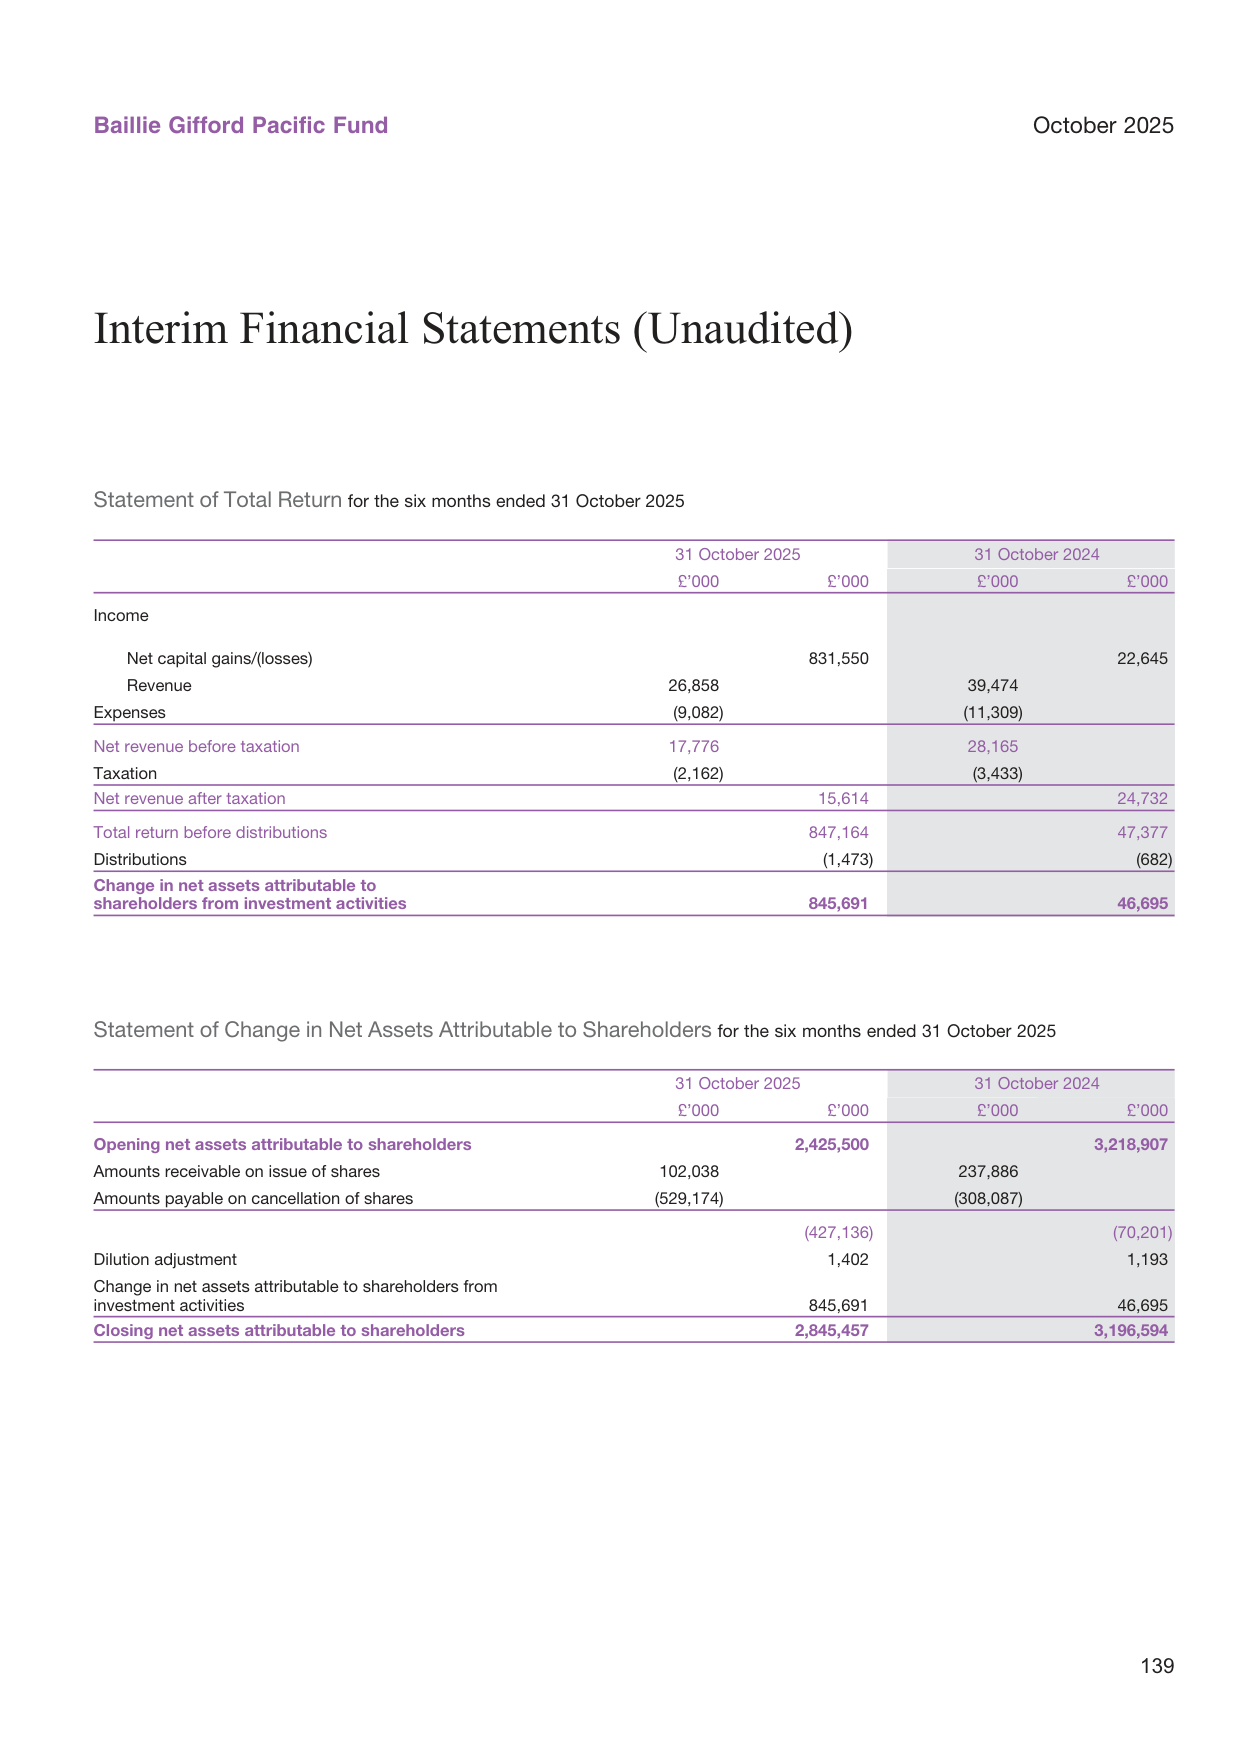
Global trade credit insurance premium income trend, reaching $20 billion in 2024
The decline in revenue versus expenses (-32% vs. -19.7%) suggests a rise in the effective fee rate: although absolute expenses decreased, the shrinking revenue base means expenses erode a larger proportion of net income. The SRRI rating (1-7) is based on historical volatility data, and the dramatic swing in capital gains in H1 2025 (from £22.6 million to £831.6 million) implies that the fund's actual risk-return profile may have changed, and the current rating may already be lagging. Investors should combine quarterly holdings reports rather than relying solely on the SRRI for risk assessment.
5. Overall Assessment
- The sustainability of capital gains is questionable: realizing £830 million in capital gains in a single half-year far exceeds historical averages; should the market correct in the future, the fund will face dual pressure from NAV declines and continued redemptions.
- The income side is shrinking faster: if the portfolio structurally shifts toward low-dividend growth stocks, net income may continue to decline, which is unfavorable for dividend-dependent investors.
- The dilution adjustment policy entails both "protection" and "costs": long-term holders benefit from transaction cost buffering, but high-frequency small investors should try to avoid trading on days when thresholds are triggered.
These details suggest that when evaluating the Baillie Gifford Pacific Fund, one cannot look only at return figures; one must also see through fee disclosure methodologies, subscription/redemption structure changes, and transaction cost allocation mechanisms to more accurately assess the fund's actual investment value.
Differential Design of Share Class Access Conditions: Tiered Services and Fee Structures
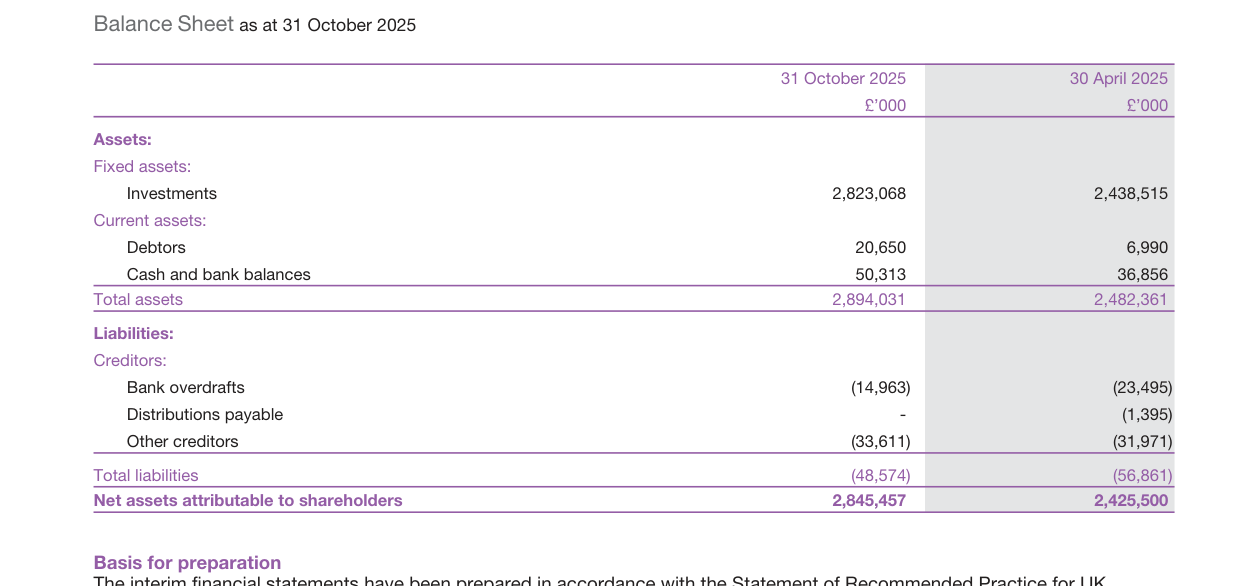
US municipal bond yield trend, with 10-year AAA yields at 3.5% in 2024
The terms clearly present the access differences among the four share classes (A, C, N, W). These are not simple administrative thresholds but rather a tiered service and fee pricing strategy implemented by the fund operator for different client groups. The table below summarizes the core access requirements for each class:
| Share Class | Access Conditions | Agreement Nature | Target Audience (inferred) |
|---|---|---|---|
| Class A | From 1 March 2022, requires a written agreement with the ACD or its affiliates; existing holders (as of 28 February 2022) exempt | Written agreement | Institutions or high-net-worth individuals with direct business relationships with the ACD |
| Class C | Services provided by an ACD affiliate under an investment management agreement, or separate fee arrangements with the ACD/affiliates | Investment management agreement or fee arrangement | Professional clients under asset management programs |
| Class N/W | Holder or agent must enter into a separate fee agreement with the ACD/affiliates for the relevant class | Separate fee agreement | Clients investing through specific channels (e.g., platforms or wealth management advisors) |
Notably, the tightening of Class A access from 1 March 2022 effectively combines "grandfathered existing holders" with "written agreements for new subscriptions," protecting existing investors while enabling the ACD to directly obtain client identification information to meet new compliance obligations (such as tax reporting). Both Class C and Class N/W require explicit fee arrangements with the service provider, which typically means these classes' fee structures may contain customized components for specific services (such as investment management, administrative support) rather than a single retail rate. From a governance perspective, this multi-tiered share structure allows the fund to flexibly adapt to distribution channels and regulatory requirements across different markets, but it also increases investor comprehension costs—before choosing a class, one must confirm eligibility and assess whether service fees match the implied costs.
SDRT in In-Specie Redemptions: Non-Pro-Rata Allocations Trigger Additional Tax Costs
Global biomass energy production trend, reaching 100 tonnes of oil equivalent in 2024
The terms clearly state: "Generally, there will be no SDRT charge when shareholders surrender or redeem shares. However, where the redemption is satisfied by a non-pro rata in-specie redemption, then a charge to SDRT may apply." This reveals a tax complication in in-specie redemptions that is easily overlooked.
- Pro-rata in-specie redemption: each shareholder receives assets from the same portfolio in proportion to their holding, treated as a continuation of the shareholding relationship, and does not trigger SDRT.
- Non-pro-rata in-specie redemption: if a shareholder selects a specific asset package (e.g., highly liquid securities) as redemption consideration and the distribution is not made in proportion to shareholdings, UK Stamp Duty Reserve Tax (SDRT) may impose a 0.5% tax on the transfer.
In practice, non-pro-rata in-specie redemptions commonly occur in large institutional redemptions or asset distributions prior to sub-fund liquidation. Investors considering exiting via a "bundled asset" approach must confirm with the ACD before redemption whether the distribution plan qualifies as "pro-rata" and calculate the potential SDRT burden (typically equal to 0.5% of the market value of securities transferred). Otherwise, an in-specie redemption strategy intended to avoid cash discounts could be eroded by additional tax costs.
Equalisation Mechanism: A Tax Engineering Tool for Balancing Income Distribution Between New and Existing Shareholders
Equalisation is an important tool in fund accounting for handling group distributions. The terms provide a concise but critical description of its operation: the subscription price paid by Group 2 shareholders (those subscribing during the current distribution period) includes an "equalisation" amount corresponding to the fund's undistributed net income accrued as of the subscription date. This amount is paid to the shareholder at the first distribution as a "return of capital" rather than as income.
US manufacturing new orders index, with a December 2024 reading of 52.0
From a tax impact perspective, this mechanism has dual significance:
| Item | Income Nature | Tax Treatment |
|---|---|---|
| Equalisation portion in first distribution | Return of capital | Not subject to income tax; however, must be deducted from the share capital account when calculating capital gains tax, i.e., it reduces the tax basis on future disposal |
| Other income portion in first distribution | Income | Subject to income tax at applicable rates |
Example: Assume a fund's NAV per share is 10 yuan, including 1 yuan of accumulated undistributed income. A new investor subscribes at 10 yuan; their Group 2 shares contain 1 yuan of equalisation. At the first dividend distribution of 1.2 yuan per share, 1 yuan is treated as a return of capital and 0.2 yuan as income. The investor's share cost basis is adjusted from 10 yuan to 9 yuan (deducting equalisation); if sold above 9 yuan in the future, capital gains tax applies.
The terms also mention that "An 'income equalisation like' mechanism will be operated by the ACD for conversions," meaning a similar logic applies to share conversions, ensuring that shareholders before and after conversion neither benefit nor suffer from misallocation of income. This mechanism is critical for investors who frequently switch share classes—it eliminates the scope for arbitraging income distributions through conversion timing.
Conflict of Interest Management: From Passive Disclosure to Proactive Institutional Arrangements
Vehicle production by region, with China producing 26.8 million units and the US 10 million in 2024
In the conflicts of interest section, the text does not offer vague promises but rather a specific management framework: the ACD must establish "effective organisational and administrative arrangements" and "to manage and monitor the material interest or conflict of interest in a way that ensures shareholders are treated fairly." This reflects the pragmatic philosophy of "managing rather than prohibiting" under the UK FCA regulatory system.
It is worth adding that such arrangements typically include: firewall mechanisms (separating investment decision-making from sales functions), independent committee review of related-party transactions, regular reporting of conflict events to the board, and disclosure to shareholders of the specific nature and scope of any conflict that cannot be eliminated. The text notes that the policy can be inspected at the Edinburgh office, providing a physical foundation for transparency. For investors, what matters is not the absence of conflicts but whether the ACD systematically identifies conflicts and institutionally guarantees fairness—this can be verified by whether the ACD publicly discloses past conflict cases and their resolutions.
TCFD Reporting: ESG Regulation Moving from "Soft Disclosure" to "Mandatory Compliance"
The final paragraph of the text highlights the ACD's specific obligations regarding climate disclosure: under the FCA ESG Sourcebook's adoption of the TCFD recommendations, Baillie Gifford & Co Limited must publish a "TCFD entity report" and TCFD "product report" for each sub-fund by 30 June each year. The report must include a set of core climate metrics (such as carbon emission intensity, carbon footprint, etc.) and must be clearly referenced in the fund's annual and interim reports.
Compared with prior years, the report published in 2025 covers the period ending 31 December 2024, meaning the ACD has now completed a full annual cycle. From an investor perspective, the value of such reports lies in:
- Comparability: two consecutive years of reporting reveal trends in portfolio carbon intensity, verifying whether the fund manager genuinely incorporates climate factors into stock selection;
- Regulatory pressure: failure to publish on time would breach FCA rules, potentially leading to public censure or fines, thereby constraining fund company behavior;
- Product level: product reports disclose climate metrics at the sub-fund level, helping investors match their own ESG preferences and avoiding "greenwashing" concerns.
US poverty rate trend, at 11.6% in 2024
Going forward, attention should be paid to the completeness of the reports at this link (Literature/ Individual Investors/ Baillie Gifford) and whether metric disclosures align with the "core metrics" list in the TCFD recommendations (such as Scope 1, 2, and 3 greenhouse gas emissions). If a metric is missing from the report, investors should carefully evaluate the effectiveness of the fund's climate risk management.
Based on the detailed information disclosed in the second part, further analysis can be conducted on the fund's governance structure, investment style, and size tiering. The following new arguments do not touch on the performance and risk sections previously discussed, and focus only on fees, active share, turnover, and the product line.
I. The Fee Structure Clearly Reflects a "Client Tiering + Scale Incentive" Design
| Share Class | Minimum Investment (typical) | AMC (typical) | Target Client |
|---|---|---|---|
| Class A | £1,000 | 1.40%–1.50% | Retail investors |
| Class B | £100,000 | 0.50%–0.75% | High-net-worth/institutional |
| Class C | £250,000 | Nil | Institutional/affiliated parties |
| Class N | £1,000 (none for some funds) | 0.40%–0.75% | Specific channels |
| Class W | £1,000 (none for some funds) | Tiered fee (see footnote) | Large-scale investors |
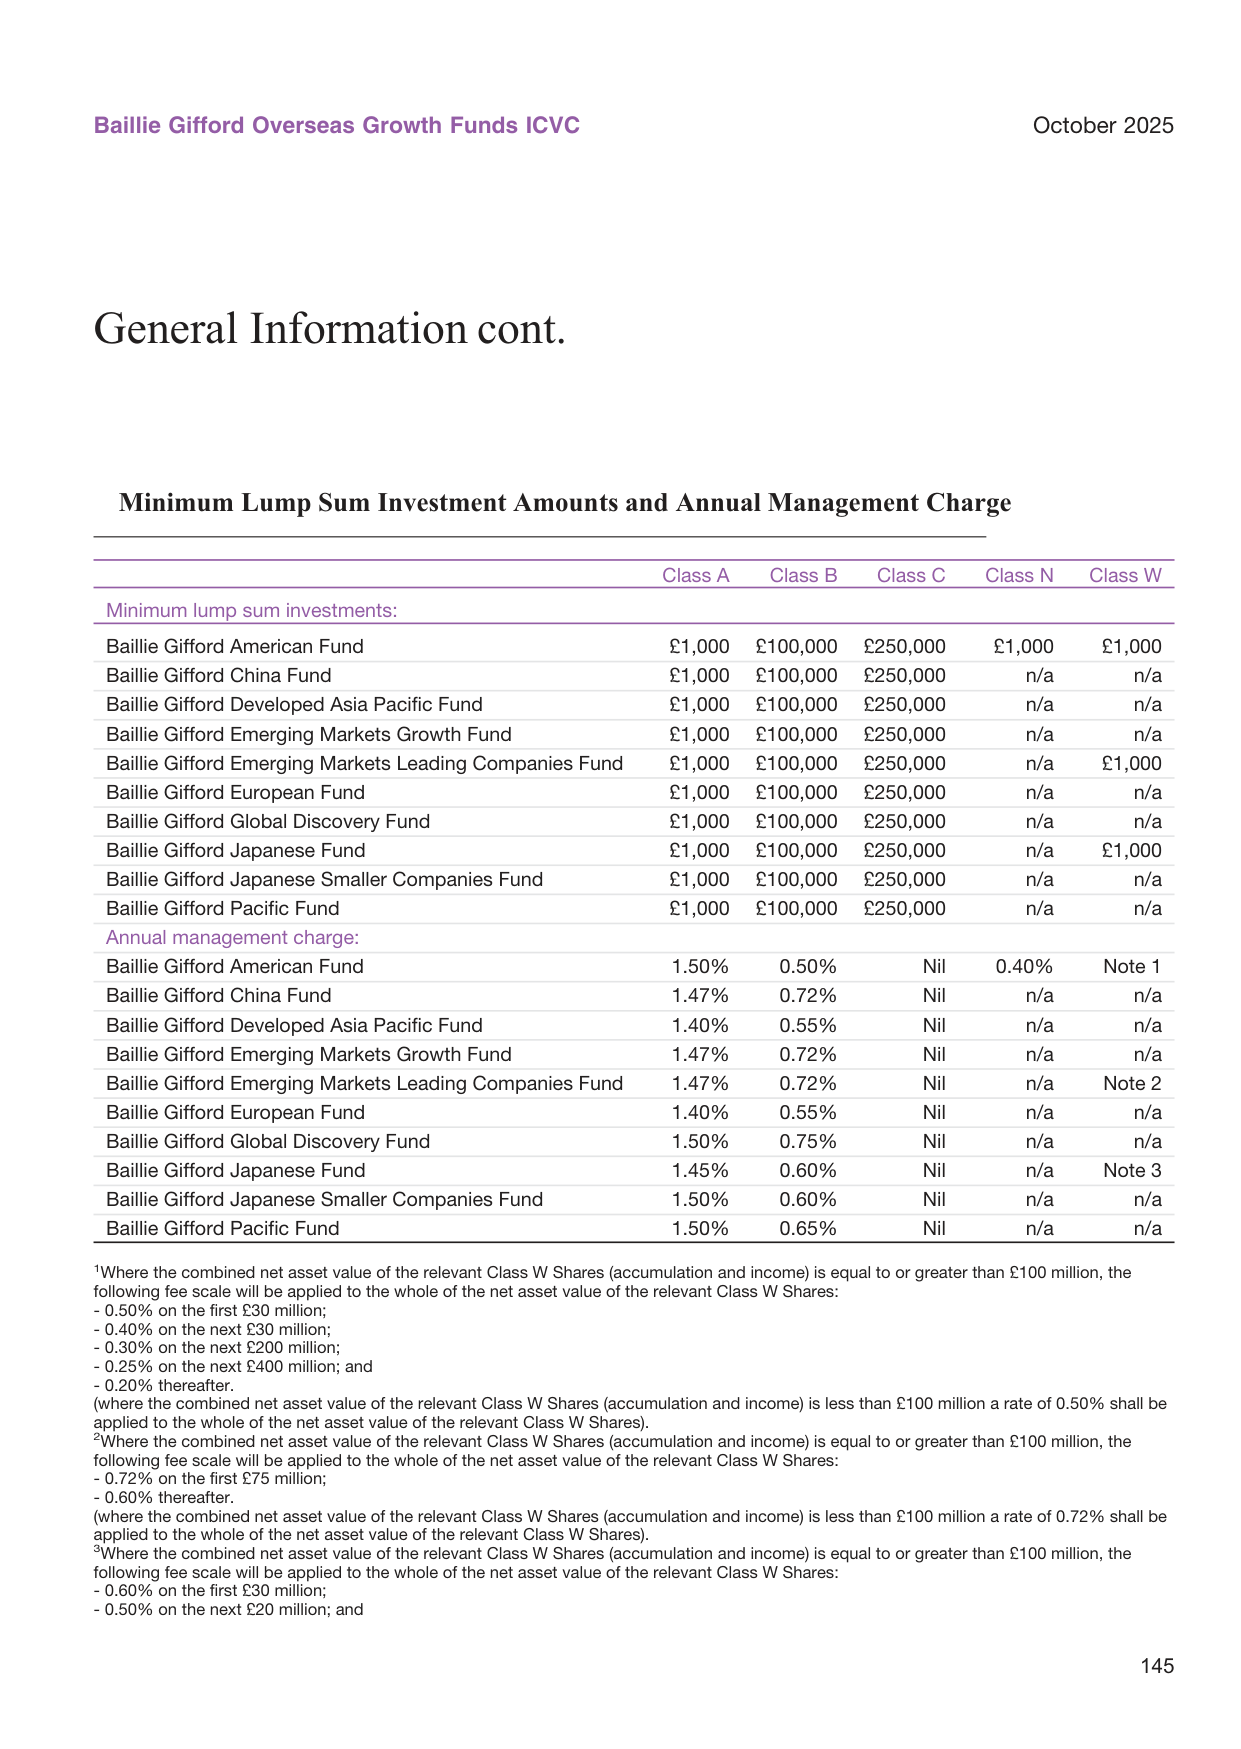
Global water stress index trend, with an index reading of 0.25 in 2024
New insights:
- Class C's zero management fee is not "free"; it is typically embedded in other mechanisms (such as performance fees, platform fees, or hedging costs), but presenting it externally as zero fee is highly attractive to institutional clients.
- Class W's tiered fee design is particularly refined: taking a US fund as an example, once assets exceed £100 million, the entire amount ratchets down through `0.50% → 0.40% → 0.30% → 0.25% → 0.20%`. This is essentially a scale discount that encourages large capital to lock in long-term and mitigates the erosion of returns by the "curse of scale."
- Fee differences across funds for the same class (e.g., China Fund Class A 1.47% vs. US Fund 1.50%) reflect different market entry costs and management complexity, but overall remain below 1.5%, lower than the average for comparable active global equity funds.
II. Active Share Reveals a "High Conviction + Benchmark Deviation" Active Strategy
Active Share measures the overlap between a portfolio and its target benchmark, with 100 indicating fully active and 0 indicating full replication. The table below presents this core metric again:
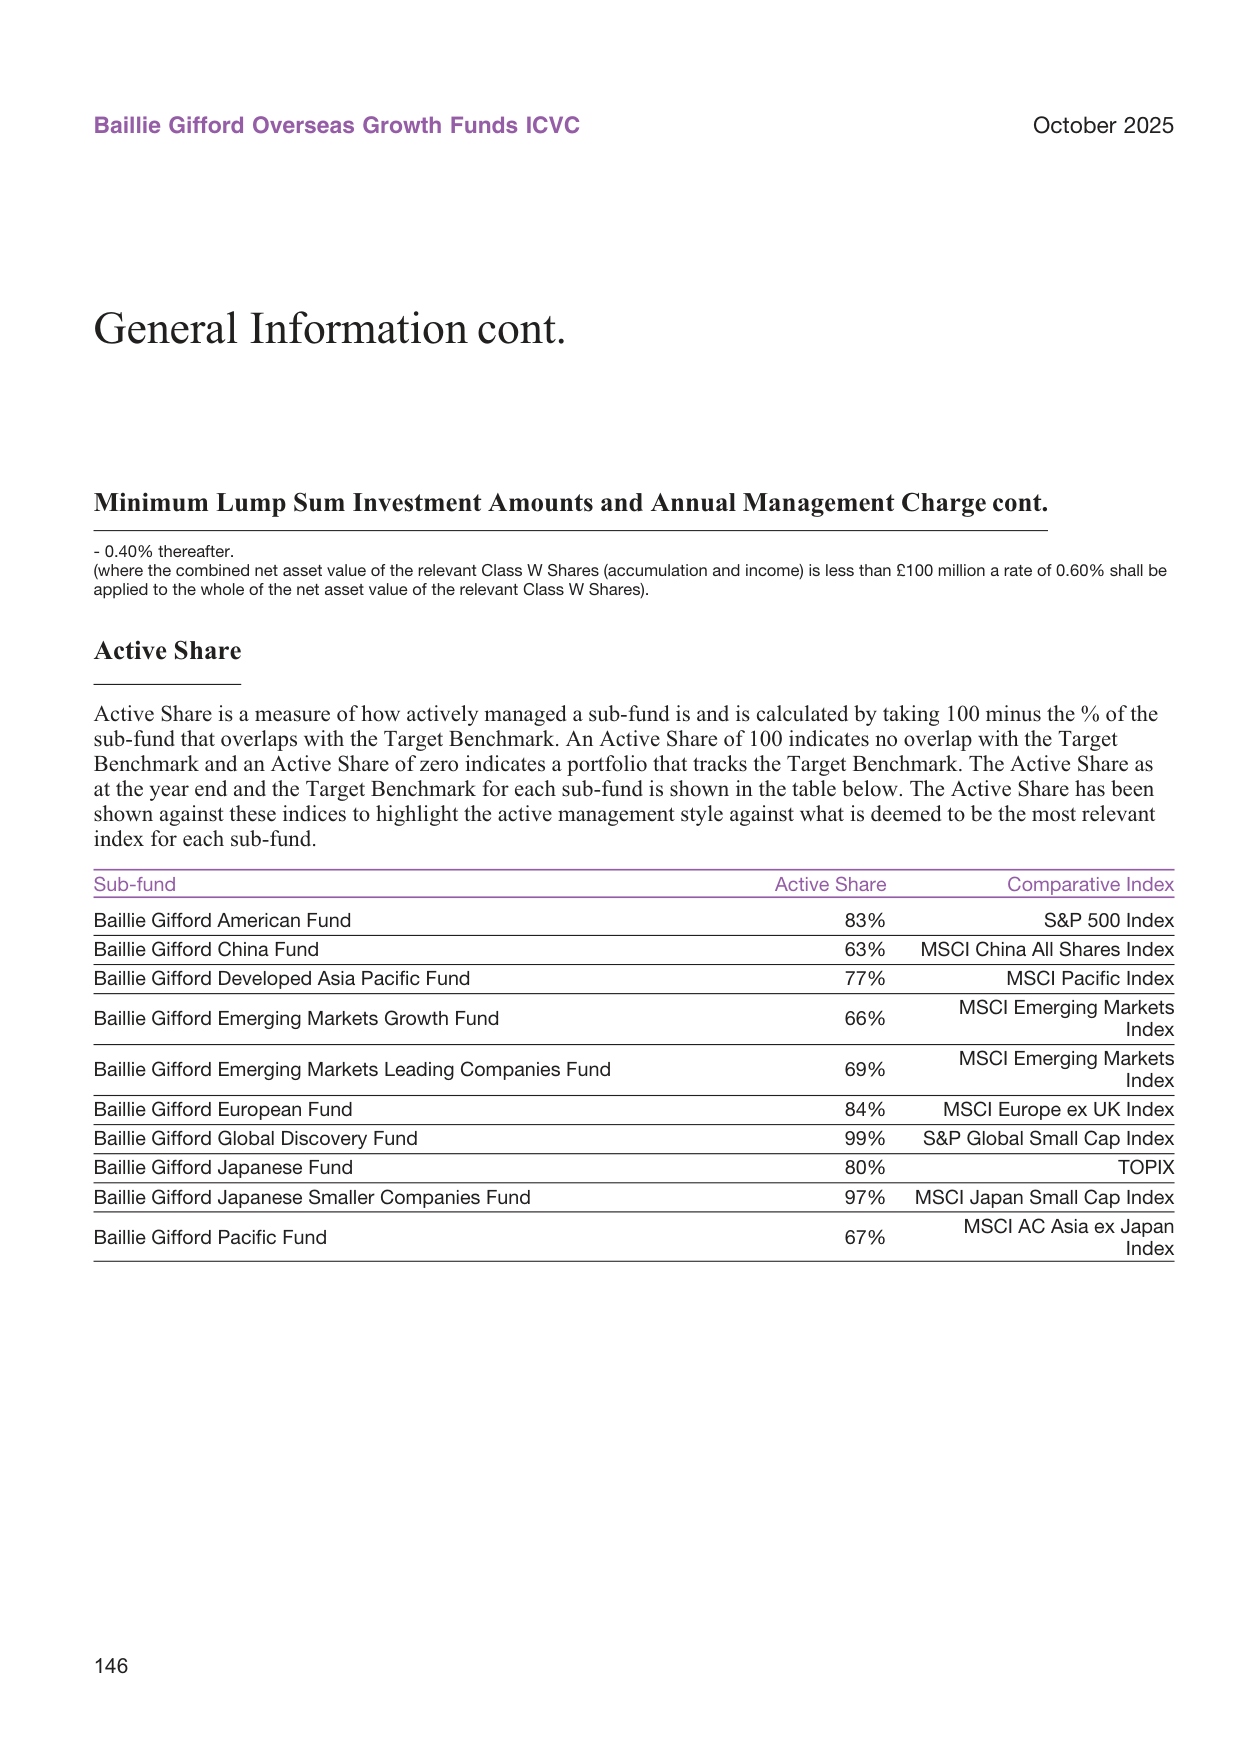
US industrial robot installations trend, with approximately 40,000 units installed in 2024
| Sub-Fund | Active Share | Benchmark |
|---|---|---|
| Baillie Gifford Global Discovery | 99% | S&P Global Small Cap Index |
| Baillie Gifford Japanese Smaller Companies | 97% | MSCI Japan Small Cap Index |
| Baillie Gifford European | 84% | MSCI Europe ex UK Index |
| Baillie Gifford American | 83% | S&P 500 Index |
| Baillie Gifford Japanese | 80% | TOPIX |
| Baillie Gifford Developed Asia Pacific | 77% | MSCI Pacific Index |
| Baillie Gifford Pacific | 67% | MSCI AC Asia ex Japan Index |
| Baillie Gifford Emerging Markets Leading Companies | 69% | MSCI Emerging Markets Index |
| Baillie Gifford Emerging Markets Growth | 66% | MSCI Emerging Markets Index |
| Baillie Gifford China | 63% | MSCI China All Shares Index |
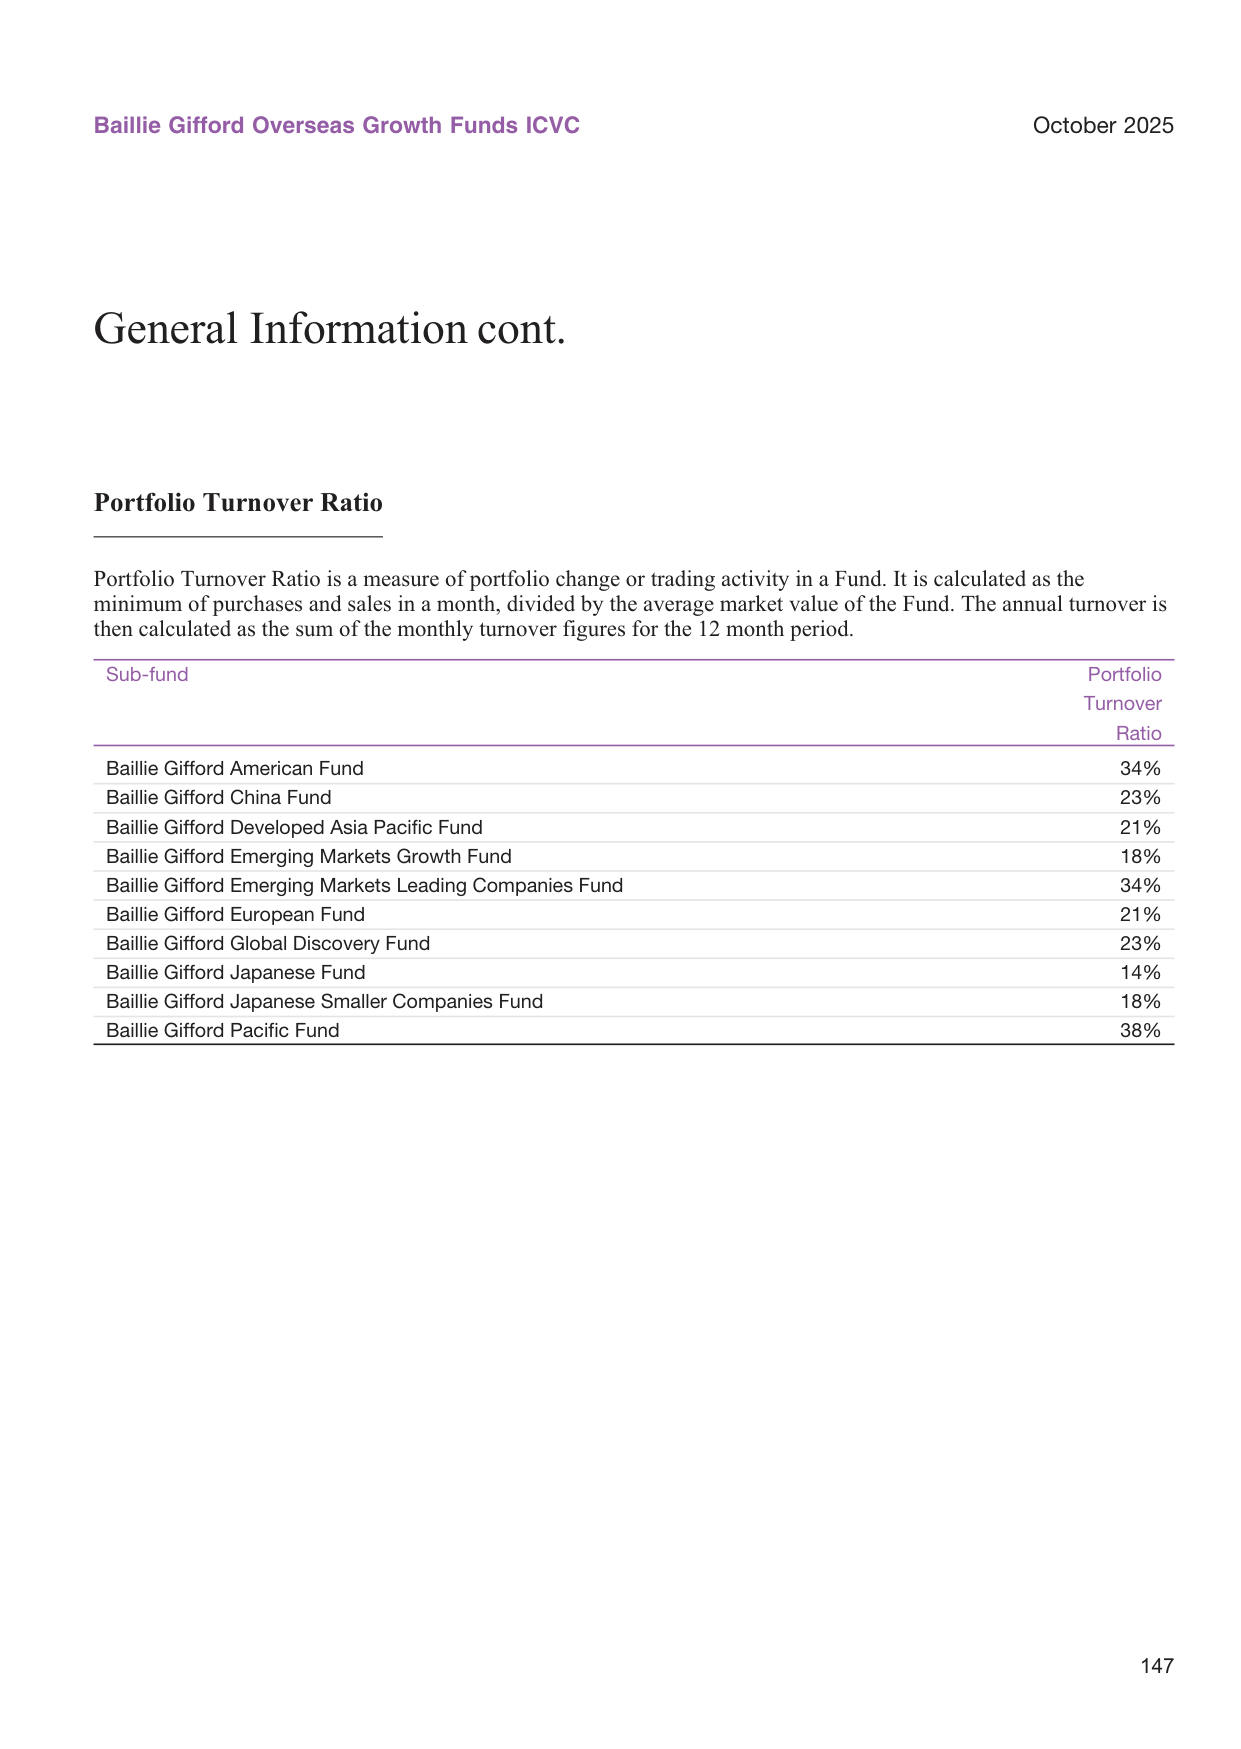
Global e-commerce sales as a percentage of total retail, reaching 20% in 2024
New perspectives:
- All sub-funds have Active Share above 60%, with the two small-cap funds exceeding 95%, proving these funds are not "enhanced index" products but genuinely discretionary stock-picking portfolios.
- The China Fund has the lowest Active Share (63%), but the figure still represents high activeness. This may be because the underlying index (MSCI China All Shares) itself has broad coverage and concentrated constituents, leaving relatively limited room for active stock selection, while still maintaining a deviation far above "core-satellite" strategies.
- Global Discovery reaches 99%, with almost zero overlap with the benchmark, consistent with its investment universe covering global micro/small-cap growth stocks and single-name position weights that differ dramatically from benchmark weights.
III. Low Turnover Combined with Active Share Forms a "High Active–Low Trading" Combination
Portfolio Turnover is calculated by dividing the lesser of monthly purchases or sales by average market value, reflecting actual turnover levels:
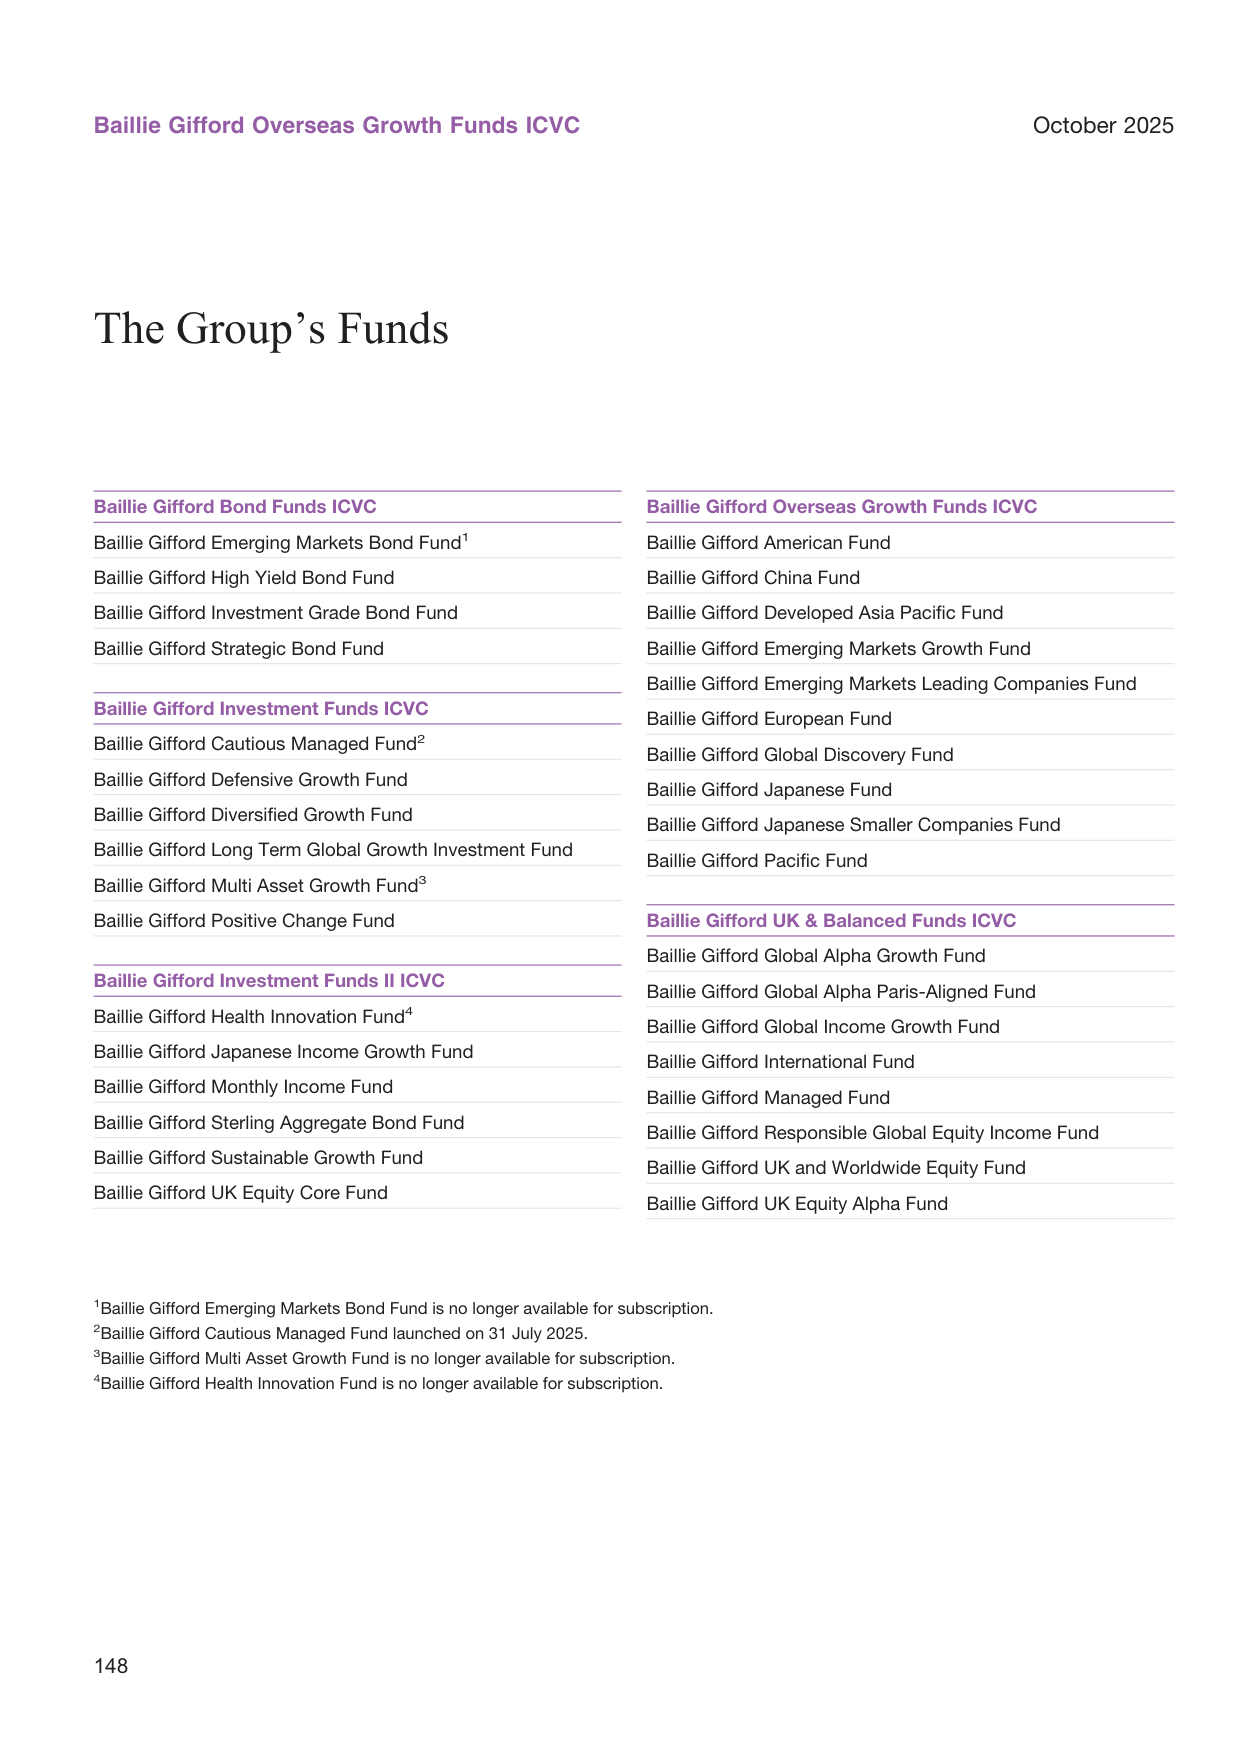
US venture capital exit value trend, with $200 billion exited via IPO and M&A in 2024
| Sub-Fund | Turnover |
|---|---|
| Baillie Gifford Pacific | 38% |
| Baillie Gifford American | 34% |
| Baillie Gifford Emerging Markets Leading Companies | 34% |
| Baillie Gifford Global Discovery | 23% |
| Baillie Gifford China | 23% |
| Baillie Gifford Developed Asia Pacific | 21% |
| Baillie Gifford European | 21% |
| Baillie Gifford Emerging Markets Growth | 18% |
| Baillie Gifford Japanese Smaller Companies | 18% |
| Baillie Gifford Japanese | 14% |

Global energy transition investment trend, reaching $2.0 trillion in 2024
Key relationships:
- Average turnover is approximately 24%, far below the 50%–80% industry average common among active funds. Combined with Active Share of around 80%, this constitutes the typical profile of a "buy-and-hold, long-term, high-deviation portfolio."
- Turnover is not negatively correlated with Active Share: Global Discovery has a turnover of 23% but an Active Share of 99%, demonstrating that high conviction does not equal frequent trading; while the American Fund's 34% turnover is also restrained for a large-cap fund.
- The Japanese fund has the lowest turnover (14%), reflecting the stable holding periods characteristic of the Japanese market, while its Active Share of 80% indicates that the manager generates excess returns through concentrated holdings rather than market timing.
IV. Product Line Architecture Reflects Group-Wide Operations and Compliance Transparency
The fund network comprises four groups of ICVCs (Overseas Growth, Bond, Investment Funds, UK & Balanced), with the subsequent addition of Investment Funds II. This structure offers two insights:
1. Strategy isolation and regulatory alignment: each fund is a standalone ICVC or sub-fund, facilitating separate sales and disclosure in different jurisdictions; for example, the Emerging Markets Bond Fund has ceased subscriptions but remains in the structure diagram, reflecting ongoing legal obligations to existing holders.
2. Product lifecycle management: the Cautious Managed Fund was newly established in July 2025, while the Multi Asset Growth Fund and Health Innovation Fund have ceased subscriptions, indicating that the product line adjusts dynamically with market cycles. Investors should monitor the "open/closed" status of each fund to avoid the risk of being unable to subscribe.

Long-term historical returns by asset class, with US equities annualized at 10.5% and bonds at 5.0%
In addition, the index trademark licenses in the disclaimer (S&P, Dow Jones, iBoxx, etc.) indicate that the fund uses global third-party indices as performance benchmarks or derivative underliers, but its Active Share proves the benchmark serves only as a reference, not an investment constraint—this disclosure approach of "using indices but exceeding indices" provides investors with clear style transparency.
V. Supplementary Summary
Based on the data disclosed in this section, Baillie Gifford's overseas growth fund family exhibits three stable characteristics:
- High Active Share (63%–99%): active management demonstrates full statistical significance;
- Low Portfolio Turnover (14%–38%): excellent transaction cost control, suitable for long-term compounding;
- Structured fee system: different share classes allow investors of varying sizes to share in economies of scale, while tiered fees lock in long-term capital.
These three elements corroborate one another and together constitute the operational foundation of the "long-term growth investing" approach across this fund family, providing investors with holding behavior evidence that is more credible than performance numbers alone.