
April 28, 2026
Dynatrace, Inc.
280 Congress Street, 11th Floor
Boston, Massachusetts 02210
Attention: Rick McConnell (Chief Executive Officer)
Jim Benson (Chief Financial Officer and Treasurer)
Board of Directors
Dear Rick, Jim, and Members of the Board:
As you know, Starboard Value LP (together with its affiliates, “Starboard” or “we”) is one of the largest shareholders of Dynatrace, Inc. (“Dynatrace,” “DT,” or the “Company”). We appreciate the time you have spent with us and look forward to continuing our constructive engagement.
Starboard has made a significant investment in Dynatrace because we believe the Company is a high-quality, durable observability platform with long-term headroom for continued growth and significant margin expansion opportunities. We also believe the Company has significant strategic value as observability becomes even more important in an AI-enabled world and as the convergence of observability and security continues. In the recent software sell-off, the market appears to have assigned Dynatrace significant near-term risks. However, we believe this perception does not properly reflect Dynatrace’s durable and differentiated platform, its strong competitive position, and the increasing importance of observability as enterprise AI adoption accelerates. We believe these factors will make Dynatrace more important in the future, not less. In fact, enterprise AI adoption should ultimately accelerate Dynatrace’s revenue growth. Simultaneously, we believe Dynatrace has an opportunity to meaningfully improve operating efficiency, driving higher profitability and cash flow while returning significant capital to shareholders. In summary, we believe Dynatrace has an opportunity to create significant value and look forward to working constructively with management and the Board of Directors (the “Board”) to achieve this goal.
Dynatrace is a Leading Observability Platform That Should Benefit from AI Adoption
Dynatrace is a leading observability player and the clear leader in Application Performance Monitoring, the largest segment of the observability market. Dynatrace’s end-to-end platform enables it to manage complex, heterogeneous environments for large enterprise customers across on-premises infrastructure, cloud environments, and traditional and modern applications. In these environments, where reliability and integration are critical, we believe Dynatrace will remain well-positioned for many years as the preferred observability vendor.
The Company’s consumption-based pricing model further reinforces this market position and helps mitigate the risk of declining software seat counts resulting from increased AI usage within enterprises. While many software vendors are still adapting their pricing models to better align with usage, Dynatrace has the advantage of a business model already tightly linked to customer activity and the value it delivers. We believe continued adoption of the Dynatrace Platform Subscription (“DPS”) model presents additional growth opportunities, and this model already represents 70% of ARR since its launch in 2022. As customers increase workloads and consolidate their observability environments, Dynatrace should be able to continue growing wallet share, strengthening customer relationships, and taking market share from legacy vendors. Management recently noted that DPS customers consume at twice the rate of non-DPS customers, and we believe the continued transition to DPS will support net retention rates and ultimately drive revenue growth.
From a broader industry perspective, we believe the rapid expansion of enterprise AI workloads will increase demand for observability solutions. AI agent adoption is still in its early stages, with recent industry reports indicating that less than 5% of enterprises have achieved full-scale deployment¹, suggesting significant growth headroom for end-to-end observability platforms like Dynatrace as penetration increases. As enterprises deploy more applications and more AI agents, the volume and complexity of telemetry data will increase substantially. This growth will enhance the value of platforms capable of ingesting and interpreting data across the full stack, particularly in large, heterogeneous enterprise environments where reliability, trust, and actionable insights are paramount.
Looking ahead, we believe the next major step in observability will be more automated, self-healing through the deployment of AI agents. Transitioning from detection to diagnosis to intelligent action, securely and at scale, will differentiate leading platforms. We believe Dynatrace is well-positioned for this evolution with its Davis AI engine, which has been an integral part of the Dynatrace platform for nearly a decade, reflecting the Company’s continued significant investment in applying AI to observability workflows. Combined with Dynatrace’s strong existing market position, we believe the Company is well-equipped to help customers progressively adopt more automated, AI-driven operations.
Despite Strong Position, Dynatrace Has Underperformed
Despite strong tailwinds in the observability space and Dynatrace’s favorable position within that market, the Company’s stock price performance has been disappointing. As shown in the table below, Dynatrace has significantly underperformed the broad market, broad technology indices, the software sector, and its closest public peer, Datadog, over the past one, two, three, four, and five years². Notably, this underperformance existed prior to any concerns about AI disruption in the software industry, and during this period of uncertainty, Dynatrace has also lagged behind other similarly exposed software companies.
¹ McKinsey: “The State of AI in 2025: Agents, Innovation, and Transformation” (November 2025).
² Source: Bloomberg, Capital IQ, public filings. Market data as of April 24, 2026.
In addition to stock price performance, Dynatrace’s valuation is significantly below infrastructure software and cybersecurity peers. In fact, as shown in the table below, despite having revenue growth near the median of the peer group, Dynatrace’s valuation is roughly half the median multiple of its peers. We believe this discount does not reflect the quality of the Company’s platform, its strong competitive position, or its relevance in addressing critical enterprise needs in an AI-first world.
We believe the Company’s poor stock price performance and valuation discount relative to peers stem from slowing growth, lack of operating leverage, and investor skepticism that business performance will improve in the near or medium term. We believe these factors are addressable, and as described below, Dynatrace has a significant value creation opportunity.
Dynatrace Has an Opportunity to Accelerate Revenue Growth
After a period of high growth, Dynatrace’s revenue growth has decelerated in recent years in a more challenging software demand environment and after scaling meaningfully. However, we believe this deceleration is not permanent and view recent Key Performance Indicator (“KPI”) trends as early signs of a potential return to accelerating growth rates.
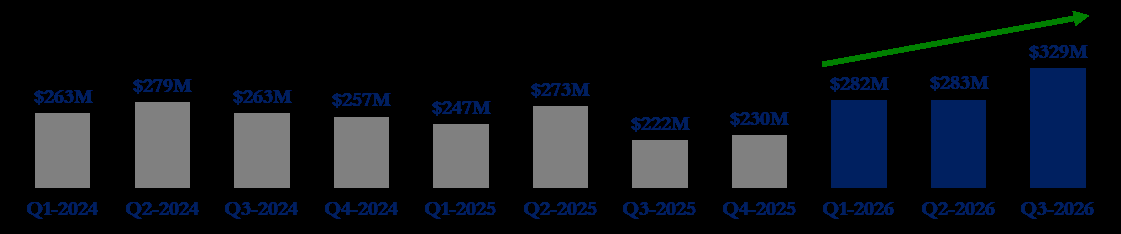
As shown in the table below, net new ARR, a key leading indicator of revenue growth, has grown double digits for three consecutive quarters.
Total Shareholder Return
| Period | 1 Year | 2 Years | 3 Years | 4 Years | 5 Years |
|---|---|---|---|---|---|
| Russell 3000 Index | 37% | 46% | 78% | 66% | 76% |
| S&P 500 Information Technology Index | 59% | 72% | 134% | 134% | 150% |
| iShares Expanded Tech-Software Sector ETF (IGV) | (0%) | 10% | 44% | 33% | 19% |
| Datadog | 42% | 8% | 92% | (1%) | 55% |
| Dynatrace | (18%) | (22%) | (16%) | (17%) | (29%) |
| Underperformance vs. Russell 3000 | (54%) | (68%) | (94%) | (82%) | (105%) |
| Underperformance vs. S&P 500 Information Technology | (77%) | (94%) | (150%) | (151%) | (179%) |
| Underperformance vs. IGV | (17%) | (32%) | (60%) | (50%) | (48%) |
| Underperformance vs. Datadog | (60%) | (30%) | (108%) | (15%) | (84%) |
Total Shareholder Return by Period²
Enterprise Value / 2026E Free Cash Flow²
Additionally, on a constant currency basis, ARR growth has been stable in the mid-teens for the past three quarters. If Dynatrach meets its guidance for the fiscal fourth quarter of 2026, the Company will have delivered constant currency ARR growth of 16% in each of the past four quarters.
On the positive side, management has also noted that underlying consumption growth has been above 20% for several quarters. Over time, we believe consumption growth and ARR growth should converge, as consumption growth drives future expansions and larger customer contracts, which are recognized proportionally in revenue.
These data points suggest the business is improving and provide a foundation for ultimately re-accelerating revenue growth. Furthermore, we believe this recent momentum should be sustainable as Dynatrace continues to take market share from legacy competitors, and as we enter fiscal 2027, DPS customers will experience the first full three-year compounding effect, meaning three DPS cohorts will simultaneously become eligible for annual commitment resets, providing a larger base for consumption growth to translate into ARR improvements.
We are also encouraged by the recent momentum in Dynatrace’s Logs product and its contribution to growth. We believe Logs is an important growth driver, as the product is increasingly becoming a core component of the observability stack, with customers wanting to analyze logs, traces, metrics, and events on a single unified platform. With a high-quality Logs product now available, Dynatrace should be able to continue gaining share in this market and provide more value to customers. Management recently disclosed that Logs annualized consumption exceeded $100 million as of the fiscal third quarter of 2026 and is on track to reach $250 million in ARR by the end of fiscal 2027. If Dynatrace can achieve this goal and maintain steady growth in its core business, we believe the Company is well-positioned to achieve a meaningful re-acceleration in revenue growth.
Net New ARR Over Trailing Twelve Months Over Time²
Constant Currency ARR Growth Over Time²
Moreover, as AI adoption increases among large enterprises, demand for observability should also increase, driven by the need to monitor more applications, workloads, agents, and increasingly complex environments. We expect this trend to first appear in consumption metrics, then ARR, and ultimately in reported revenue.
Dynatrace Has an Opportunity to Improve Profitability
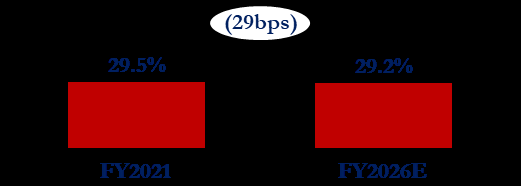
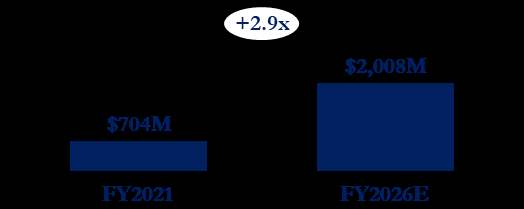
Although Dynatrace has nearly tripled its revenue over the past five years, its adjusted operating margin has remained largely flat, as shown below. We believe the Company has a significant opportunity to improve profitability in the future.
During this period, Dynatrace’s incremental adjusted operating margin has lagged behind peers growing at a comparable pace, as shown below. Over the past five years, despite having a higher gross margin than its peer group, Dynastrace achieved an incremental margin of just over 30%, while peers of similar scale and growth profile achieved approximately 40% incremental margins. If Dynatrace had achieved the median peer incremental margin over this period, its current adjusted operating margin would be over 700 basis points higher than it is today.
Revenue Over Time²
Adjusted Operating Margin Over Time²
Incremental Adjusted Operating Margin versus Revenue Growth for Dynatrace and Peers²
Looking ahead, we believe higher incremental margins can and should be the core driver of a significant improvement in Dynatrace’s profitability. While consensus estimates suggest below-average incremental margins for the next several years, we believe Dynatrace should be able to achieve at least 40% incremental margins on future revenue growth. If it can achieve this, while also meeting consensus revenue expectations (which do not include assumptions for accelerating growth), Dynatrace would be able to improve its margin by approximately 350 basis points by fiscal 2029 without any discrete cost cutting. We believe there is further upside to margins if Dynatrace were to implement cost reduction opportunities across the Company’s major cost centers. Combined, we believe Dynatrace should target at least 500 basis points of adjusted operating margin expansion by fiscal 2029.
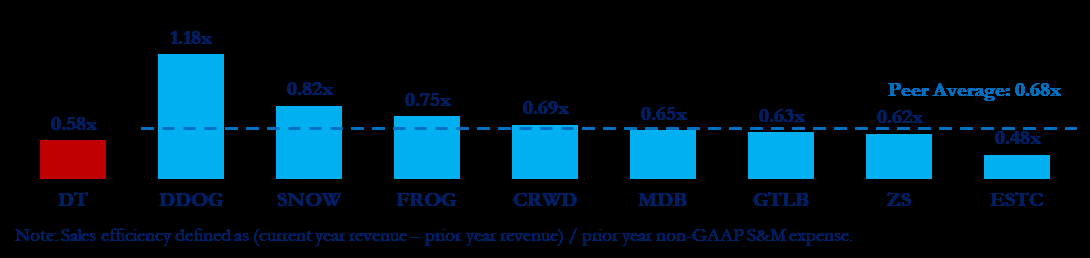
We believe the largest opportunity to drive margin improvement is in the sales and marketing (“S&M”) function. As shown in the chart below, Dynatrace’s sales efficiency has been declining over the past five years and compares unfavorably to peers. This commonly used metric measures the efficiency of S&M spend in generating incremental revenue in the following year. If Dynatrace achieved the average sales efficiency of its peers, we estimate the Company could either generate significantly higher revenue growth while maintaining current spend levels, or reduce S&M costs by approximately $75 million annually while maintaining current growth rates.
Our research suggests this inefficiency stems from two factors: headcount growth outpacing business growth, and lower sales representative productivity due to a suboptimal go-to-market strategy. Despite nearly tripling revenue over the past five years, Dynatrace’s S&M as a percentage of revenue has remained nearly flat, indicating the Company has not achieved the operating leverage that would be expected for a business of its scale and growth characteristics. This is particularly pronounced for a business with strong net retention rates. We believe these issues are addressable and represent clear margin expansion opportunities. While we are encouraged by management’s recent adjustments to improve the Company’s go-to-market function, our research indicates significant room for improvement.
We also believe Dynatrace has an opportunity to improve the efficiency of its research and development (“R&D”) function. Although we are encouraged by the recent momentum of the Logs product, historically Dynatrace’s product launches have often missed initial revenue milestones, suggesting that the ROI on new product development has been mixed at best. We agree that significant investment in product development is critical to maintaining Dynatrace’s competitive position, but we believe that improved execution and greater discipline in prioritizing R&D investments could yield meaningful efficiency gains in R&D.
Furthermore, recent advancements in AI tools should enable significant productivity improvements and cost reductions across the organization, particularly in R&D and customer success.
In summary, we believe Dynatrace can meaningfully improve its revenue growth and operating margin profile by achieving higher growth rates and better margins. We believe doing so would unlock significant shareholder value and reinforce Dynatrace’s position as a leader in the observability market.
Dynatrace Has a Significant Capital Return Opportunity
Dynatrace also has an opportunity to create value by combining the operational improvements described above with an aggressive capital return program. In the current market environment, high-quality software businesses like Dynatrace are trading at a significant discount to intrinsic value, creating a rare opportunity, not seen in years, to repurchase shares at highly attractive valuations.
While the recently announced incremental $1 billion share repurchase authorization was a step in the right direction, we believe the Company should execute on this authorization in the near term and further commit to using its substantial free cash flow (“FCF”) to continue repurchasing shares at these attractive valuation levels over the long term. We believe that over the next three years, Dynatrace could repurchase more than $2.5 billion of stock, representing approximately 25% of its current market capitalization, while still maintaining a sizeable net cash balance. By combining a significantly reduced share count with the operational improvements discussed above, we believe Dynatrace can meaningfully increase free cash flow per share—a key valuation metric—and generate substantial long-term value for shareholders.
Continued Convergence of Observability and Cybersecurity
As AI advances, we believe the convergence of observability and cybersecurity will continue, because real-time visibility into application behavior, infrastructure anomalies, and data flows is a common foundation for both performance monitoring and threat detection. Dynatrace’s deep telemetry capabilities and its ability to map dependencies in complex environments position it well to expand into adjacent security use cases over time, especially as customers seek to consolidate vendors and reduce complexity in their monitoring and security stacks.
Furthermore, large recent transactions in both observability and security, such as Palo Alto Networks’ acquisition of Chronosphere and Cisco’s acquisition of Splunk, highlight the strategic importance of these capabilities and the significant value the market places on platforms that can operate at this intersection. In this context, we believe Dynatrace, as a large independent observability player, possesses significant strategic optionality to bring deep observability expertise to cybersecurity platforms. While we see clear opportunities for Dynatrace to improve revenue growth and profitability, the long-term convergence of observability and cybersecurity cannot be ignored, and the Board and management team must be open to all paths that maximize shareholder value.
Conclusion
In closing, we believe Dynatrace represents a highly attractive investment opportunity. Dynatrace has been mischaracterized as a business with significant AI risk; however, we believe the business is well-positioned to benefit from enterprise AI adoption. In our view, Dynatrace can deliver a re-acceleration of revenue growth and significant margin expansion in the coming years, while returning substantial capital to shareholders. If Dynatrace captures these opportunities, we believe it can achieve free cash flow per share of over $3.30 by fiscal 2029, nearly double the level in fiscal 2026². At the same time, we believe Dynatrace’s strategic value will only continue to grow, and the Board must be open to all value-creation pathways.
We are pleased to be one of Dynatrace’s largest investors and believe the Company has an attractive opportunity to create value through improvements in growth, profitability, capital allocation, and other strategic options.
We look forward to further discussing these and other matters with you.
Sincerely,
Peter A. Feld
Managing Member
Starboard Value