May 28, 2026
Flowserve Corporation
5215 N. O’Connor Blvd., Suite 700
Irving, Texas 75039
Attention: Board of Directors
Copy to: R. Scott Rowe (Chief Executive Officer and President)
Amy Schwetz (Chief Financial Officer and Senior Vice President)
Dear Members of the Board,
Starboard Value LP (together with its affiliates, “Starboard” or “we”) is a significant shareholder of Flowserve Corporation (“Flowserve” or the “Company”). We appreciate the time that Scott, Amy, and the management team have spent with us.
Flowserve is a good business operating in strong end markets, held back by poor execution. The Company trades at a notable discount to its peers—even before accounting for the significant potential to improve Flowserve’s margins and profitability. We believe that with improved performance, Flowserve has considerable value creation potential. The Board must ensure that Flowserve delivers a meaningful step change in both growth and profitability. We will be closely monitoring the Company’s progress and will not hesitate to hold the Board accountable if Flowserve fails to deliver results commensurate with the quality of its business.
Flowserve is a high-quality business with expanding exposure to powerful secular trends including re-industrialization, power generation, nuclear energy, and energy security
Flowserve has long been a leading provider of fluid control equipment, manufacturing pumps, valves, seals, and related hardware that are essential to keeping critical industrial processes running. Its products help customers move, control, and manage liquids, gases, and other materials in applications where reliability, safety, and uptime are paramount. When a critical pump, valve, or seal fails, it can result in downtime, safety risks, emergency maintenance, and unplanned replacement. This mission-critical role underpins a valuable installed base, durable aftermarket demand, and long-standing customer relationships.
Historically, however, Flowserve was viewed as a more cyclical oil and gas supplier, with investors focused on the Company’s exposure to energy capital expenditures and upstream activity. This characterization fails to reflect the breadth of Flowserve’s product portfolio and the evolution of the business. Today, Flowserve serves a broader and more attractive set of end markets. Approximately 50% of orders come from power generation and industrial markets, around 30% from energy (of which over 90% is downstream and refining, with only a small portion tied to upstream), and about 20% from chemicals.¹ This mix should provide Flowserve with a solid base in attractive core markets while enabling the Company to benefit from several incremental growth drivers.
Re-industrialization is driving investment in manufacturing capacity, industrial infrastructure, and supply chain resilience. Power demand is rising significantly, fueled by electrification, artificial intelligence, and data center growth, driving massive investment in generation capacity and related infrastructure. According to Gartner, global data center electricity consumption is expected to roughly double from 448 TWh in 2025 to 980 TWh in 2030.
Nuclear power is regaining prominence as governments and industries seek reliable, low-carbon baseload power. According to the International Energy Agency (IEA), annual nuclear investment is expected to nearly double to approximately $120 billion by 2030, creating significant opportunities for Flowserve.² Importantly, Flowserve is a leading supplier to the nuclear industry, with its products installed in approximately 75% of the world’s operating nuclear reactors. Flowserve is already seeing this demand materialize, with nuclear representing over 20% of the Company’s backlog. Moreover, given the safety-critical nature of nuclear applications, long certification cycles, and the need for specialized engineering, Flowserve is one of the few qualified suppliers capable of serving critical pump and valve applications in nuclear markets. We believe Flowserve will be a go-to supplier for pumps and valves in both traditional nuclear and small modular reactor (“SMR”) deployments.
Energy security and independence are also driving incremental investment in both conventional and new energy systems, particularly as countries and companies seek to reduce geopolitical risk exposure and improve resilience. Industry research firm Wood Mackenzie recently noted that recurring supply shocks, including crises in the Middle East, are elevating energy security to a “weight with a similar magnitude or higher than climate policies” in power generation investment decisions, while a 2025 survey by Siemens found that 62% of respondents expect future energy systems to rely more on local or regional production rather than global trade.
Meanwhile, the chemicals end market—which has been a significant drag on Flowserve’s growth over the past few years—appears to be approaching a cyclical trough. Boston Consulting Group (BCG) estimates that global commodity chemical utilization has fallen to approximately 70%-80%, well below the historical norm of around 90%, and Deloitte describes the industry as “nearing the bottom of the capital cycle.”
Taken together, these trends should provide Flowserve with a robust demand backdrop for the next several years. This is why the Company’s inconsistent performance is so frustrating. Flowserve should be benefiting from some of the most attractive long-term growth themes in industrial markets today. If the Company cannot deliver stronger organic growth in this environment, shareholders have every right to question whether the issue lies in execution.
Why has Flowserve’s leading competitive position not translated into strong performance?
¹ Source: Public filings.
² In The Path to a New Era for Nuclear Energy (2025), the IEA cites approximately $120 billion in annual nuclear investment by 2030 under its “Announced Pledges Scenario,” compared to approximately $65 billion in 2023.
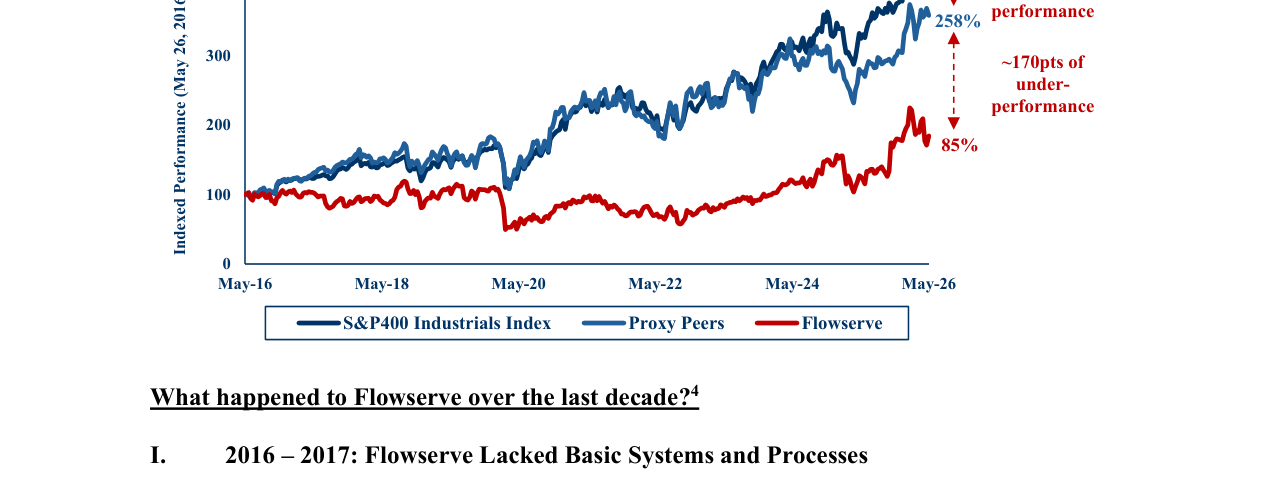
Despite operating in attractive end markets and serving as a leading supplier in many mission-critical applications, we believe Flowserve has consistently failed to deliver the level of performance that shareholders expect from a high-quality business like this one. The results are clear: Over the past decade, Flowserve’s Total Shareholder Return has meaningfully lagged both the broader industrial sector and the Company’s self-selected proxy peer group.³
What has happened at Flowserve over the last ten years?⁴
I.
2016 – 2017: Flowserve lacked basic systems and processes
In the early-to-mid 2010s, Flowserve had significantly greater exposure to the upstream oil and gas business. The sharp downturn in energy markets prior to 2016 pressured revenue and earnings across the industry. But the market backdrop only explains part of the underperformance. During this period, Flowserve operated with a decentralized and inefficient legacy model, including over 50 P&Ls, excessive plant autonomy, disparate business systems and processes, and a bloated corporate structure.
> “…the current margin level of the business is clearly not acceptable and execution improvement is needed.”
> —Stifel (October 30, 2016)
> “FCD margins, traditionally strong, have fallen to a ten-year low […] The only other factors we can think of besides poor execution to explain this is either an inability to pass along rising raw material costs (primarily steel) in the near-term distribution valve business (~50% of the segment) or mix shift. What is happening to margins in this business?”
> —Stifel (July 27, 2017)
> “IPD is the biggest near-term opportunity to improve internal cost structure, and we note healthy gross margins and solid orders in the backlog, but those are being diluted by internal execution issues.”
> —Bank of America (September 27, 2017)
II.
2018 – 2022: Flowserve 2.0 was the Company’s first attempt at operational change… and it didn’t work
In 2018, Scott Rowe’s first full year as CEO, Flowserve launched Flowserve 2.0, the Company’s first genuine attempt to drive broad operational change. This initiative aimed to significantly reduce the number of P&Ls, establish company-wide consistent processes and metrics, improve visibility into operating data, lower corporate costs, and enhance product and service capabilities to support strategic growth. These were necessary steps, but they did not deliver the step change in execution that shareholders were expecting. While COVID-19 and supply chain disruptions clearly affected performance during this period, they do not explain why Flowserve continued to struggle even as markets began to normalize and peers improved. By 2022, operational miscues and repeated guidance reductions led analysts to describe Flowserve as being in the “penalty box” due to poor execution.
> “…we would prefer to stay on the sidelines until executional distractions show signs of abating…”
> —Citi (February 16, 2018)
> “This is disappointing because it feels like every time Flowserve reports, there is at least one operational issue.”
> —BMO (May 11, 2018)
> “…Flowserve is in the penalty box for poor execution and repeated guidance downgrades while others continue to beat and raise, but demand and orders are there, giving us confidence the stock has meaningful upside if they can execute….”
> —Stifel (July 12, 2022)
> “It is hard to imagine execution getting any worse.”
> —UBS (November 9, 2022)
III.
2023 – 2025: Early progress finally gave shareholders reasons to believe
After years of underperformance, Flowserve showed signs of operational improvement from 2023 to 2025. The Company made divisional leadership changes and began implementing an 80/20 initiative to reduce complexity. These actions finally began to translate into results, and for the first time in years, shareholders had reason to believe Flowserve was turning the corner.
> “We think the operational execution/margin trajectory ahead will be the biggest open question for investors; 2023 guidance seems to imply margins still below 2020/pre-COVID levels, suggesting embedded upside, but we expect the path to sustained LDD+ profitability will remain a ‘show me’ story for most.”
> —UBS (February 21, 2023)
> “FLS appears to have turned a corner on its execution issues that have weighed on results in prior years… we are constructive on the trend, but need to see consistent margin execution before getting more positive.”
> —Morgan Stanley (May 3, 2023)
By the end of fiscal 2025, Flowserve seemed to have moved from recovery to acceleration. On its Q4 FY2025 earnings call, the Company issued long-term targets, calling for mid-single-digit organic revenue growth, an adjusted operating margin of approximately 20%, and double-digit adjusted EPS CAGR through FY2030. Management’s confident commentary on the Q4 FY2025 earnings call gave shareholders reason to believe Flowserve was finally ready to accelerate, with management highlighting a healthy project pipeline, clear growth visibility, and positive momentum into 2026.
> “The project pipeline for 2026 looks very healthy. So, we have clear line of sight as to our ability to grow the business.”
> —CEO Scott Rowe (Q4 FY2025 Earnings Call)
> “Given the progress we have made to date and the positive momentum we have heading into 2026, we believe our strategic focus areas will provide opportunities to drive growth and create increasing value for our shareholders over the coming years.”
> —CEO Scott Rowe (Q4 FY2025 Earnings Call)
IV.
Today: Flowserve’s Q1 results have rekindled long-standing concerns about execution and credibility
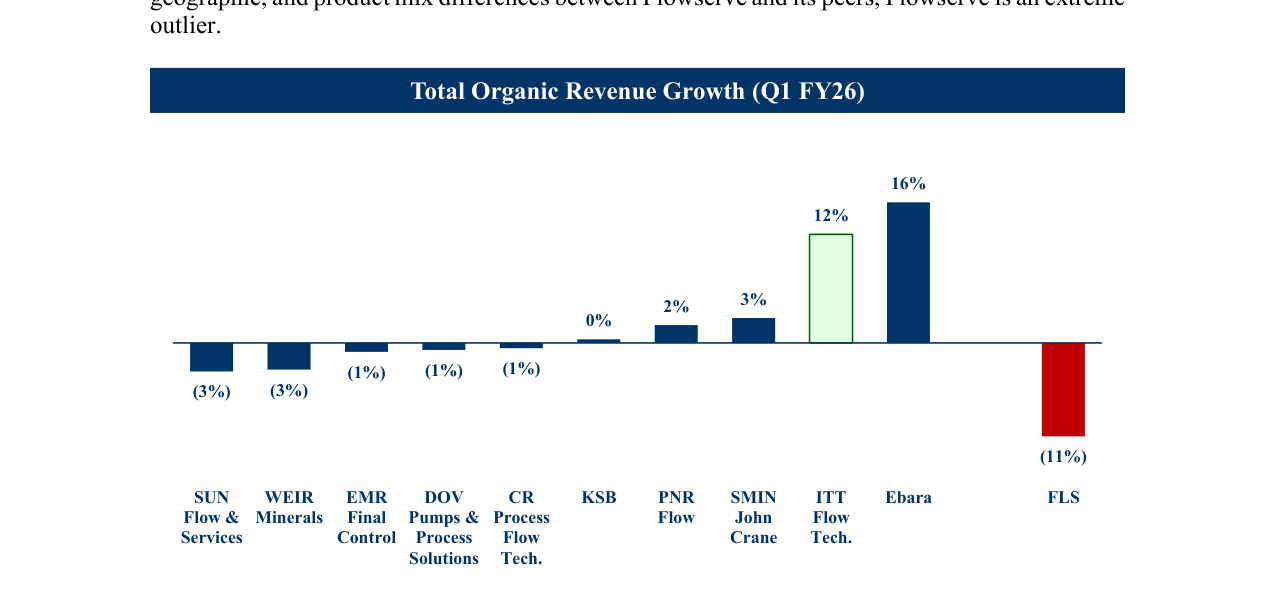
The Q1 results were supposed to validate this confidence. Instead, they have rekindled concerns about execution, visibility, and credibility that have plagued Flowserve for years. Flowserve reported organic revenue growth of negative 10.5%, significantly below its peers, highlighting the Company’s failure to convert its strong market positions and favorable secular trends into the growth that shareholders deserve.⁵ We acknowledge that there are end-market, geographic, and product mix differences between Flowserve and its peers, but Flowserve is an extreme outlier.
The poor results, lack of clarity on the drivers of the shortfall, and confusion about one-time adjustments to EPS have re-raised questions about whether management has sufficient visibility, is clearly communicating key variables to investors, or is simply not executing. None of this is acceptable. Sell-side commentary highlights the extent of the credibility problem.
> “…we see tactical communication missteps in the quarter that put the stock in a difficult position currently, as investors worry about future earnings revisions.”
> —TD Cowen (May 1, 2026)
> “Many have long memories of FLS earnings disappointments in the past, and they will quickly revert to those rather than recent performance. The shortfall ex-Middle East vs the confidence shown after Q4 is indeed puzzling…”
> —TD Cowen (April 29, 2026)
⁵ Source: Company filings. Note: Peer data reflects disclosed organic revenue growth; Sulzer Flow & Services is shown on a booked revenue growth basis, while KSB and Ebara are shown on a total revenue growth basis, as these are the most recent reported data available. Data for Sulzer Flow & Services, KSB, and Ebara are not adjusted for FX or M&A due to limited disclosures. Smiths Group’s John Crane segment reflects results for the third quarter of fiscal 2026 ending May 2, 2026. Starboard believes the flow control equipment peers shown in the “Fiscal Q1 2026 Organic Total Revenue Growth” chart are the most comparable group for measuring Flowserve’s revenue growth due to product similarity. This analysis is a matter of judgment and involves some subjectivity. Because not all potential peers are listed here, the comparisons made in this letter could differ materially if other companies were included.
> (3%)
> (3%)
> (1%)
> (1%)
> (1%)
> 0%
> 2%
> 3%
> 12%
> 16%
> (11%)
> SUN Flow & Services
> WEIR Minerals
> EMR Final Control
> DOV Pumps & Process Solutions
> CR Process Flow Technologies
> KSB
> PNR Flow
> SMIN John Crane
> ITT Flow Technologies
> Ebara
> FLS
> Fiscal Q1 2026 Organic Total Revenue Growth
> “Admittedly, we were already cautious on FLS given this elevated exposure, but the actual results came in even below our own estimates… Orders declined 6% year-over-year and were negative even excluding the Middle East. The overall organic decline of 10% (and 8% ex-Mid East) was significantly worse than our expectation which was close to flat organic growth.”
> —UBS (April 29, 2026)
Unfortunately, the Company’s subsequent explanations seemed to amplify investor concerns. In response to analyst questions, management pointed to several factors driving the Q1 weakness, including: (i) internal expectations for an approximately 4.5% organic revenue decline in the quarter due to the prior year’s high comparison and SKU rationalization associated with the 80/20 initiative; (ii) a ~200bp headwind from the Middle East; and (iii) a slow start to January and February, particularly in the Company’s maintenance and repair business. This was particularly frustrating because the largest driver—management’s expectation for an organic revenue decline of approximately 4.5% in the quarter—should have been easily knowable; however, because management does not provide quarterly guidance, none of the sell-side analysts had modeled this decline.
Even accepting management’s explanations, the underlying performance is weak—after adjusting for the Middle East headwind, high comparison, 80/20-related SKU rationalization, and other one-time items, the implied Q1 organic revenue growth run rate is approximately negative 3.8%.⁶ And while management expects improvement in Q2—the Company has guided to organic revenue growth of approximately negative 4.0% in Q2, inclusive of an additional 400bp of headwinds (200bp from the Middle East and 200bp from 80/20 SKU rationalization)—the Q2 underlying run rate only improves to roughly flat organic growth.
Flowserve’s operational underperformance has created a significant margin gap
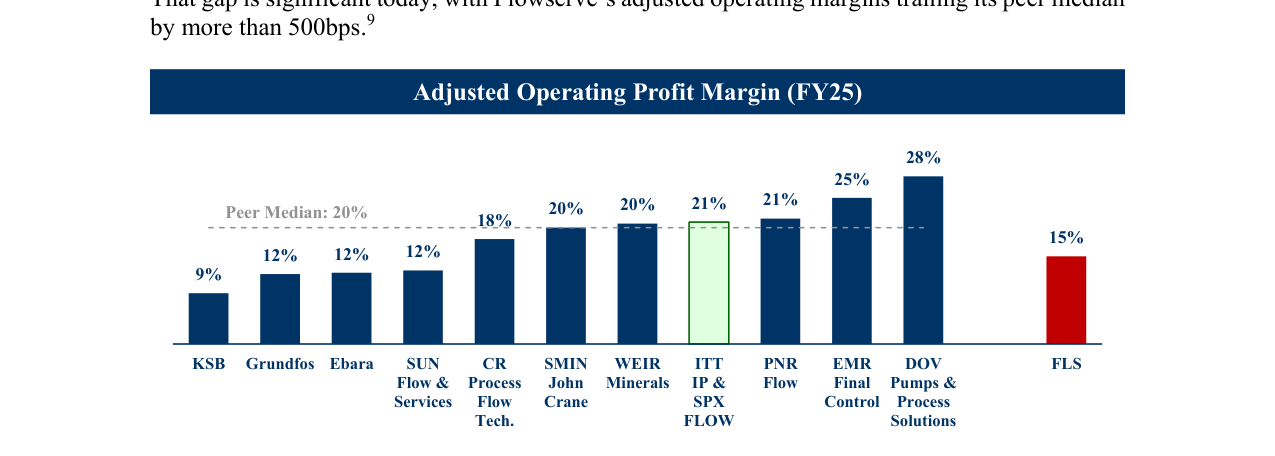
While improved organic growth is one driver of value creation, we believe the opportunity to drive outsized margin expansion is equally significant. We appreciate that Flowserve has recently begun to make some progress on margins, but this needs to be viewed in a longer-term context. Over the past decade, Flowserve’s fluid control peers have generally realized significant operating margin improvement, with peer medians expanding by approximately 500bp.⁷ In contrast, Flowserve’s adjusted operating margin has declined over the same period.
[6] Source: Public company filings, Starboard estimates. All estimates are based on information believed to be derived from reliable sources and include certain assumptions, including a ~200bp headwind from the 80/20 initiative, a ~220bp headwind from the Middle East, and a ~250bp headwind from difficult year-over-year comparisons and other items. Such information and assumptions may be inaccurate. The estimate for run-rate Q1 organic revenue growth is based on a number of data points.
[7] Source: Public company filings. Note: Margin rates are based on each company’s respective fiscal year-end reporting period and include unallocated corporate expenses. Unallocated corporate expenses are allocated to each segment in proportion to each segment’s share of total company revenue. Over the past ten years, due to name changes or reclassifications, the definitions of some peer segments have changed; however, the Company has sought to maintain the most comparable analysis possible. Emerson Final Control has been excluded because Emerson did not disclose operating profit for its valves, actuators, and regulators business in fiscal year 2015. Starboard believes the flow control equipment peers shown in the “FY15-FY25 Change in Adjusted Operating Profit Margin” chart are the most relevant group for benchmarking Flowserve’s margin profile given the similarity of their products. This analysis is subject to a degree of subjectivity. As the full universe of potential peers is not listed here, the comparisons made herein may differ materially if other firms had been included.
This persistent margin underperformance has not gone unnoticed and reinforces the market’s long-standing concern that Flowserve’s margin gap is driven by execution.8
“Over time, we've seen little improvement, and the gap today is much wider than it was a decade ago.”
– TD Cowen (January 16, 2025)
That gap is significant today, with Flowserve’s adjusted operating margins trailing its peer median by more than 500bps.9
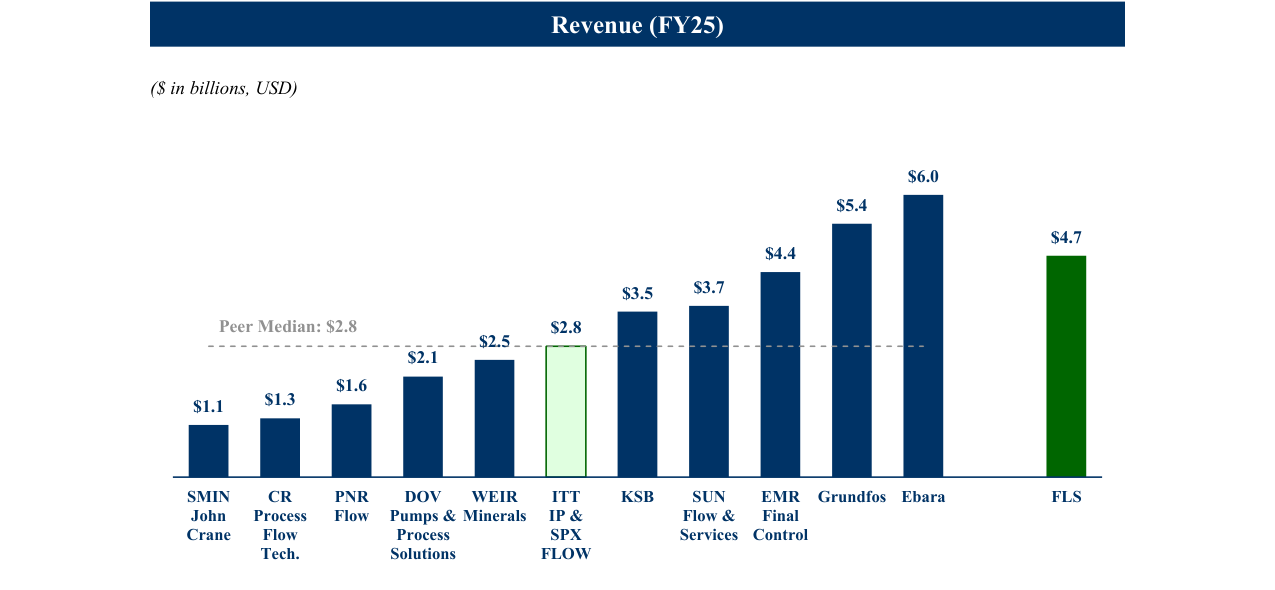
We believe the Company has many of the characteristics that should support a meaningfully stronger margin profile, including highly engineered products viewed by customers as best-in-class for mission-critical applications, a valuable installed base, a robust aftermarket business, and scale that is comparable to, if not greater than, most of its peers in the pumps and valves market.10
($ in billions, USD)
We believe the margin gap stems from weaker historical operational execution rather than structural differences.
“Taking a broad look at FLS's portfolio vs. ITT's…we can see the overarching similarities suggesting that vastly different margin profiles likely shouldn't exist on a structural basis. There will be friction points certainly, but overall, the portfolios are likely more similar than different. Seals (with attractive aftermarket characteristics) are an area of differentiation, however.”11
– TD Cowen (January 16, 2025)
The margin divergence versus ITT, despite the portfolio similarities highlighted above, reinforces this point: Flowserve’s margin gap is not simply the result of portfolio differences, but rather appears to reflect company-specific issues around operational execution and consistency.
10 Source: Public company filings, Capital IQ. Note: Revenue is shown based on each company’s respective fiscal year-end reporting period. Revenue converted into USD at exchange rate on May 26, 2026. Starboard believes the flow control equipment peers shown in the “Revenue (FY25)” chart are the most relevant group for benchmarking Flowserve’s scale given the similarity of their products. This analysis is a determination that is subject to a certain degree of subjectivity. As the full universe of potential peers is not listed here, the comparisons made herein may differ materially if other firms had been included.
11 Source: Wall Street Research. Note: Quotes are bolded and underlined for emphasis.
$1.1
$1.3
$1.6
$2.1
$2.5
$2.8
$3.5
$3.7
$4.4
$5.4
$6.0
$4.7
SMIN
John Crane
CR Process Flow Tech.
PNR Flow
DOV Pumps & Process Solutions
WEIR Minerals
ITT
IP & SPX
FLOW
KSB
SUN Flow & Services
EMR Final Control
Grundfos
Ebara
FLS
Peer Median: $2.8
Revenue (FY25)
Flowserve's operational transformation is still in its early stages, with the most significant work still ahead.
Flowserve has begun taking some important initial steps, including simplifying the organizational structure, improving data collection, strengthening systems and processes, and appointing new business segment leadership. We understand that many of these systems and processes were not in place historically and hope these changes help lay a stronger operational foundation. While these actions are necessary, they should not be viewed as sufficient progress. The next phase of operational improvement will include meaningful footprint rationalization, plant productivity enhancements, supply chain optimization, better commercial execution, more dynamic pricing, and tighter cost discipline across the company. These more complex operational changes will require stronger execution to translate into the margin improvements the business should be able to achieve.
Flowserve's FY30 targets are directionally correct but should be viewed as milestones, not the full opportunity.
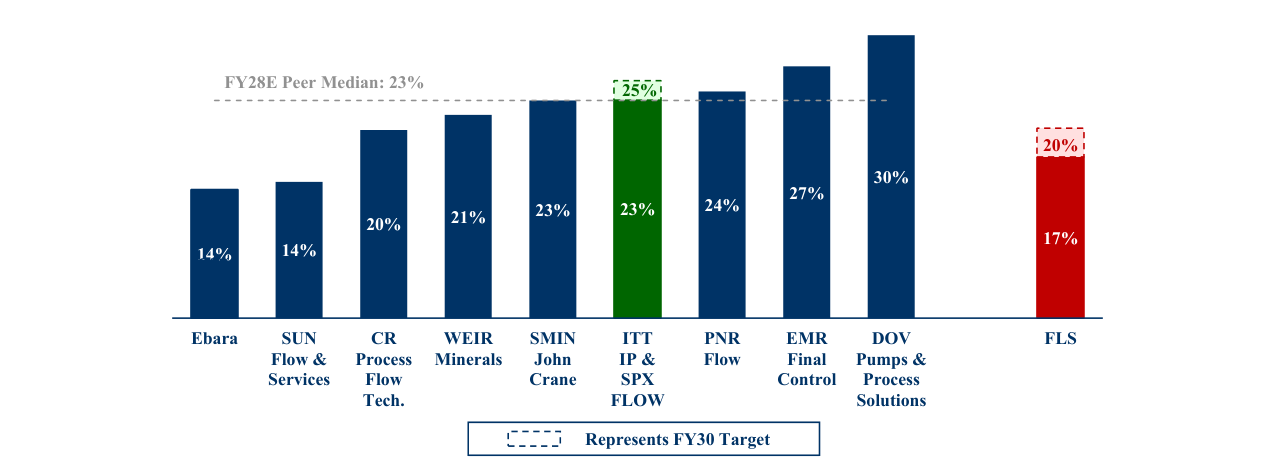
We are encouraged that the Company has established FY30 targets, including: (1) mid-single-digit organic growth CAGR from FY25 to FY30, (2) adjusted operating profit margin of approximately 20%, and (3) double-digit adjusted EPS CAGR from FY25 to FY30. We believe all three targets are highly achievable. End-market demand and the secular trends previously discussed should support at least mid-single-digit organic revenue growth. If anything, the potential for retrofit, repair, and redundancy opportunities in the Middle East should provide upside to the Company's long-term organic revenue growth target. Through improved working capital management, we believe Flowserve's free cash flow generation potential should enable it to buy back a meaningful amount of shares by FY30, thereby supporting a strong double-digit EPS CAGR. Most importantly, achieving a 20% adjusted operating profit margin by FY30 would only bring Flowserve roughly in line with where peers are today, leaving room for further improvement. We believe 20% should be viewed as an intermediate milestone, not the full margin opportunity.
Peers are not standing still.¹² For example, ITT's Industrial Process business currently has an adjusted operating profit margin of approximately 21% and has set an FY30 target of 25%, which highlights the feasibility of achieving higher margins in this business. More broadly, while the average for flow control peers is currently around 20%, the median margin for this group is expected to reach 23% by FY28, implying that the margin level Flowserve is targeting for FY30—
¹² Source: Public company filings, Wall Street consensus estimates. Market data as of May 26, 2026. Not all peers have FY28E consensus estimates, and among those that do, not all have disclosed FY30 margin targets. Due to differences in timing, margin definitions, and corporate cost allocation methods, company long-term targets may not be directly comparable. FY28E margin estimates are based on Wall Street consensus estimates and have been fully burdened with unallocated corporate costs. Unallocated corporate expenses are allocated to each business segment in proportion to each segment's share of total company revenue. Definitions of adjusted operating profit vary among companies and sell-side analysts and therefore may not be fully comparable to Flowserve's adjusted operating income margin, which excludes amortization of acquisition intangible assets. Even so, the amortization of acquisition intangible assets is relatively small and, based on our calculations, does not have a significant impact on peer margin comparisons. Starboard believes the flow control equipment peers shown in the "Adjusted Operating Profit Margin (FY28E Consensus vs. FY30 Target)" chart are the most relevant group for benchmarking Flowserve's margin profile due to product similarity. This determination is subject to a degree of subjectivity. As the full universe of potential peers is not listed here, the comparisons made herein may differ materially if other firms had been included. Note: ITT's targets, published at its May 2025 Investor Day, predate its announced acquisition of SPX FLOW, and its Industrial Process adjusted operating profit margin target does not include unallocated corporate expenses.
Performance that peers have already achieved and are expected to significantly exceed in the coming years.
We believe more aggressive action is needed to accelerate operational improvement, and Flowserve must skate to where the puck is going, not where it currently is.
Flowserve must deliver more consistent performance to regain shareholder trust.
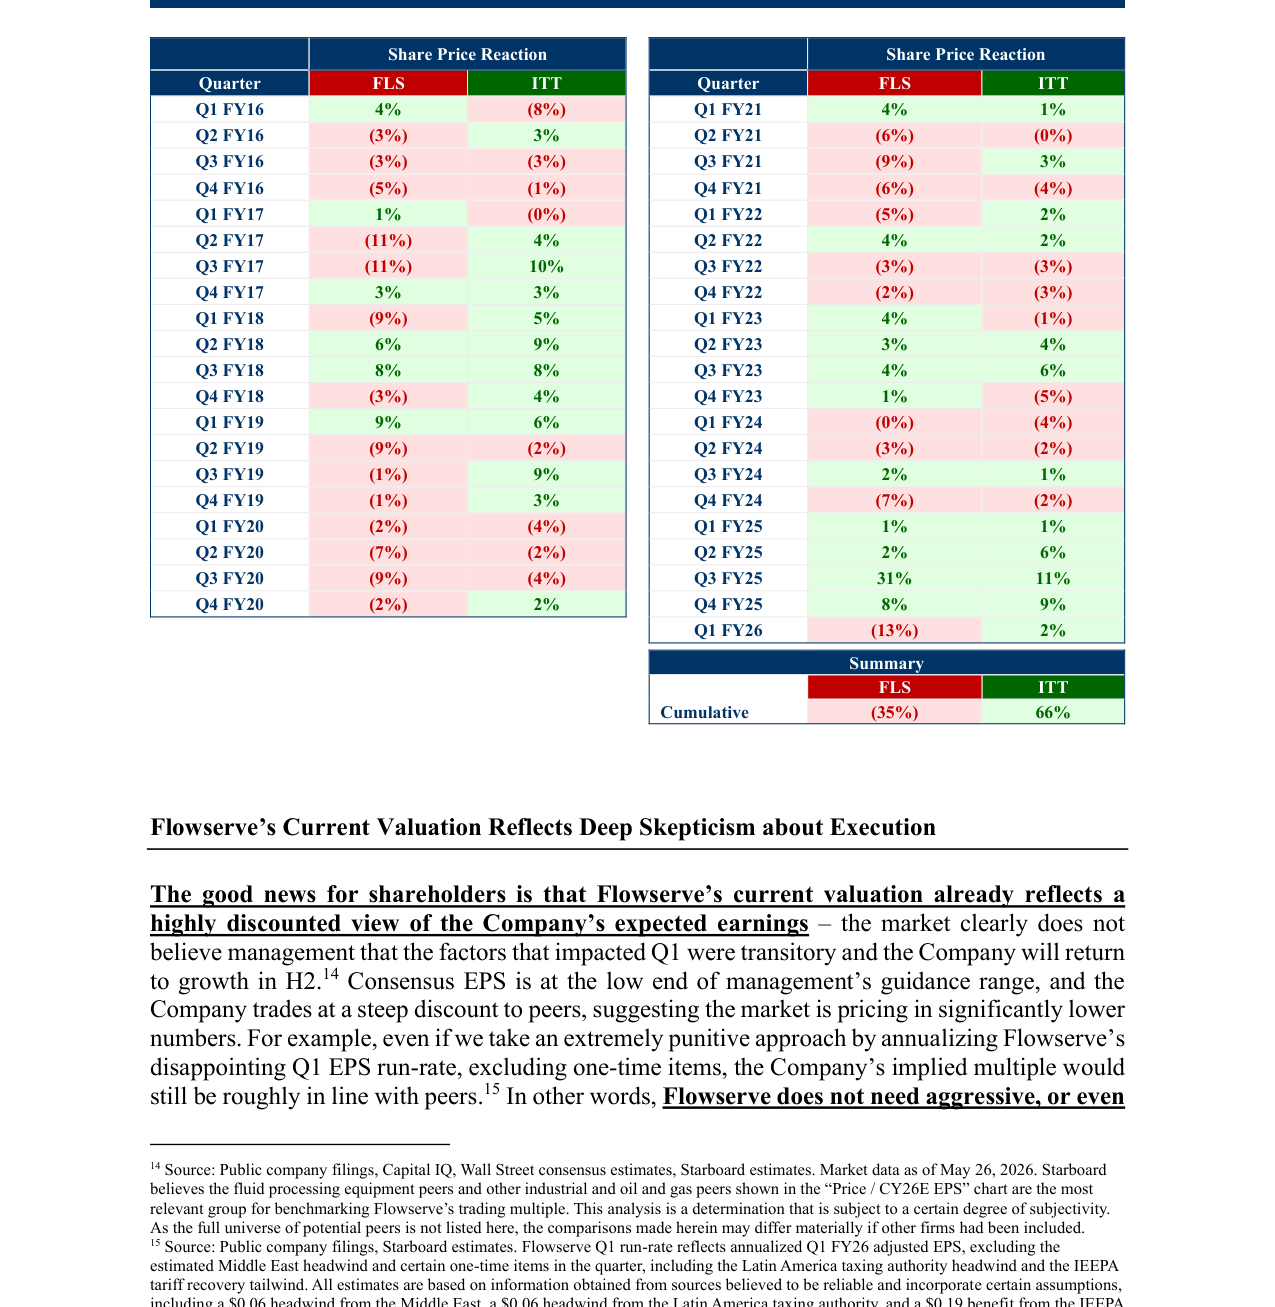
For a demonstration of how consistent execution can reward investors, Flowserve need only look at ITT. Over the past decade, Flowserve's quarterly earnings reports have repeatedly reinforced investor concerns about execution, resulting in a cumulative stock price reaction of approximately negative 35% following earnings announcements. In contrast, ITT's cumulative post-earnings stock price reaction over the same period was positive 66%.¹³ This combined earnings performance gap of approximately 100 percentage points largely explains Flowserve's long-standing stock price underperformance.
¹³ Source: Bloomberg. Represents the cumulative stock price reaction one day after earnings announcements from Q1 FY16 to Q1 FY26. Starboard believes the comparison to ITT in the "One-Day Post-Earnings Stock Price Reaction (10 Years)" chart is the most relevant benchmark for Flowserve's post-earnings stock price reaction due to the similarity of their products. This analysis is subject to a degree of subjectivity. As the full universe of potential peers is not listed here, the comparisons made herein may differ materially if other firms had been included.
14%
14%
20%
21%
23%
23%
24%
27%
30%
17%
14%
25%
20%
Ebara
SUN
Flow &
Services
CR
Process
Flow
Tech.
WEIR
Minerals
SMIN
John
Crane
ITT
IP &
SPX
FLOW
PNR
Flow
EMR
Final
Control
DOV
Pumps &
Process
Solutions
FLS
FY28E Peer Median: 23%
Represents FY30 Target
Adjusted Operating Profit Margin (FY28E Consensus vs. FY30 Target)
Stock Price Reaction
Stock Price Reaction
Quarter
FLS
ITT
Quarter
FLS
ITT
Q1 FY16
4%
(8%)
Q1 FY21
4%
1%
Q2 FY16
(3%)
3%
Q2 FY21
(6%)
(0%)
Q3 FY16
(3%)
(3%)
Q3 FY21
(9%)
3%
Q4 FY16
(5%)
(1%)
Q4 FY21
(6%)
(4%)
Q1 FY17
1%
(0%)
Q1 FY22
(5%)
2%
Q2 FY17
(11%)
4%
Q2 FY22
4%
2%
Q3 FY17
(11%)
10%
Q3 FY22
(3%)
(3%)
Q4 FY17
3%
3%
Q4 FY22
(2%)
(3%)
Q1 FY18
(9%)
5%
Q1 FY23
4%
(1%)
Q2 FY18
6%
9%
Q2 FY23
3%
4%
Q3 FY18
8%
8%
Q3 FY23
4%
6%
Q4 FY18
(3%)
4%
Q4 FY23
1%
(5%)
Q1 FY19
9%
6%
Q1 FY24
(0%)
(4%)
Q2 FY19
(9%)
(2%)
Q2 FY24
(3%)
(2%)
Q3 FY19
(1%)
9%
Q3 FY24
2%
1%
Q4 FY19
(1%)
3%
Q4 FY24
(7%)
(2%)
Q1 FY20
(2%)
(4%)
Q1 FY25
1%
1%
Q2 FY20
(7%)
(2%)
Q2 FY25
2%
6%
Q3 FY20
(9%)
(4%)
Q3 FY25
31%
11%
Q4 FY20
(2%)
2%
Q4 FY25
8%
9%
Q1 FY26
(13%)
2%
Summary
FLS
ITT
Cumulative
(35%)
66%
Flowserve's current valuation reflects deep market skepticism about execution.
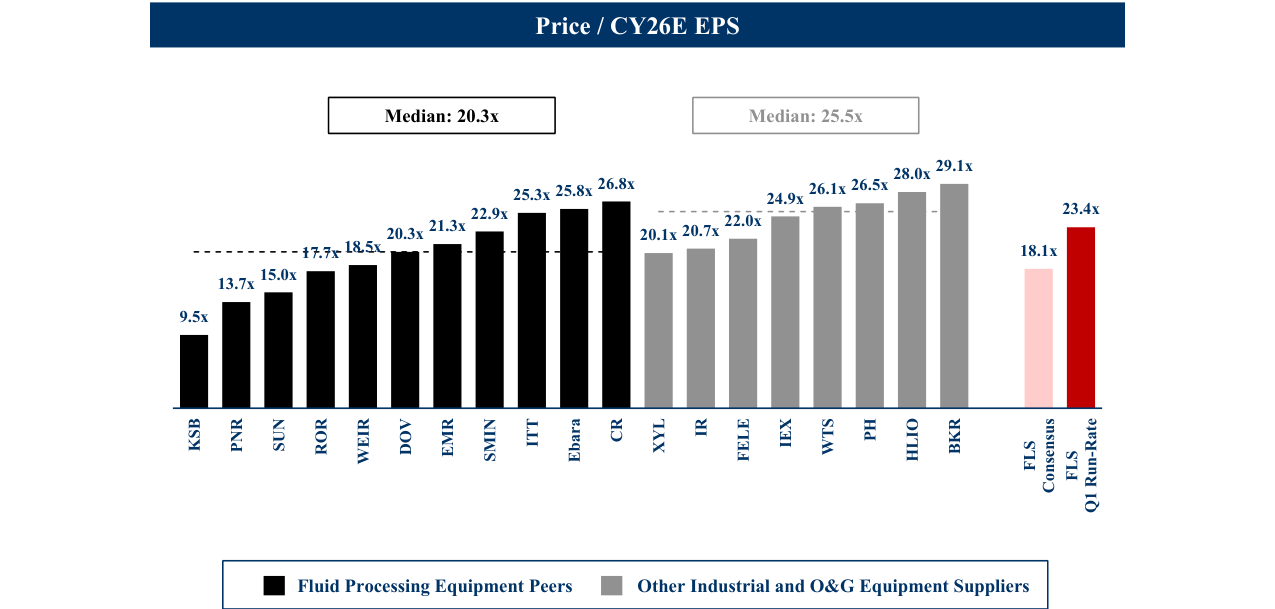
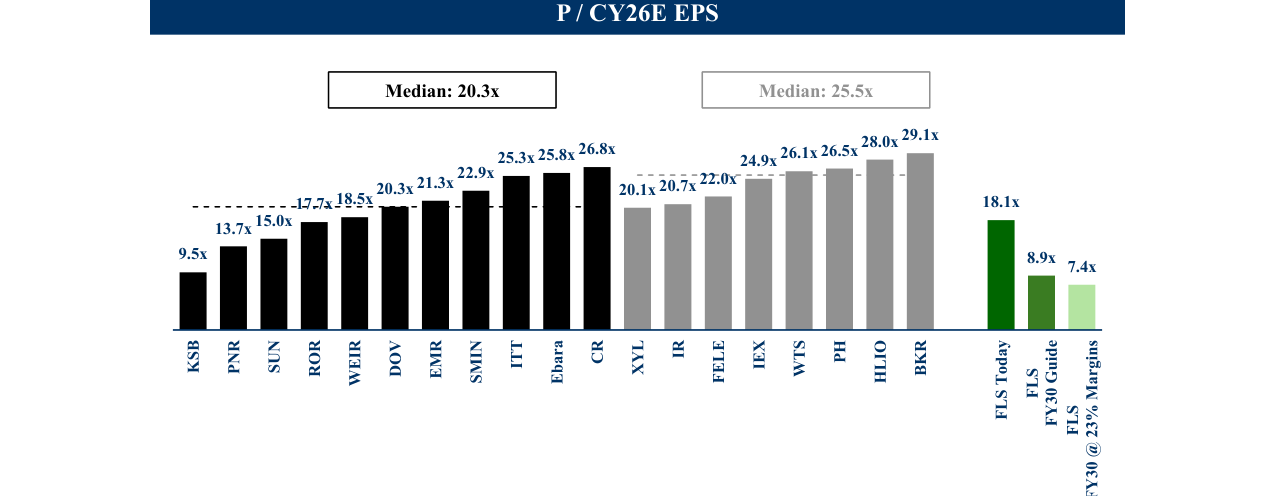
The good news for shareholders is that Flowserve's current valuation already reflects a significant discount to the company's expected earnings—the market clearly does not believe management's assertion that the factors impacting the first quarter are temporary and that the company will resume growth in the second half of the year.¹⁴ Consensus EPS is at the low end of management's guidance range, and the company's stock trades at a substantial discount to peers, suggesting the market is pricing in significantly lower numbers. For example, even if we take an extremely draconian approach and annualize Flowserve's disappointing first-quarter EPS (excluding one-time items), the company's implied valuation multiple is still roughly in line with peers.¹⁵ In other words, Flowserve does not need aggressive, or even
¹⁴ Source: Public company filings, Capital IQ, Wall Street consensus estimates, Starboard estimates. Market data as of May 26, 2026. Starboard believes the fluid handling equipment peers and other industrial and oil & gas peers shown in the "Price / CY26E EPS" chart are the most relevant benchmark group for Flowserve's trading multiples. This analysis is subject to a degree of subjectivity. As the full universe of potential peers is not listed here, the comparisons made herein may differ materially if other firms had been included.
¹⁵ Source: Public company filings, Starboard estimates. Flowserve's first-quarter annualized rate reflects the annualized value of adjusted EPS for the first quarter of FY26, excluding estimated Middle East headwinds and certain one-time items in that quarter, including an unfavorable tax authority outcome in Latin America and a favorable IEEPA tariff recovery. All estimates are based on information obtained from sources believed to be reliable and include certain assumptions, including a $0.06 headwind from the Middle East, a $0.06 headwind from Latin American tax authorities, and a
reasonable earnings assumptions to support its valuation—even if the company fails to improve from its disastrous first quarter, its current trading multiple is still reasonable; and if management can execute on its full-year guidance, there is significant upside.
The most exciting prospect is that fiscal 2026 should be the starting point for a significant acceleration in margin improvement and earnings growth! If not, changes must be made.
Better execution will unlock substantial shareholder value.
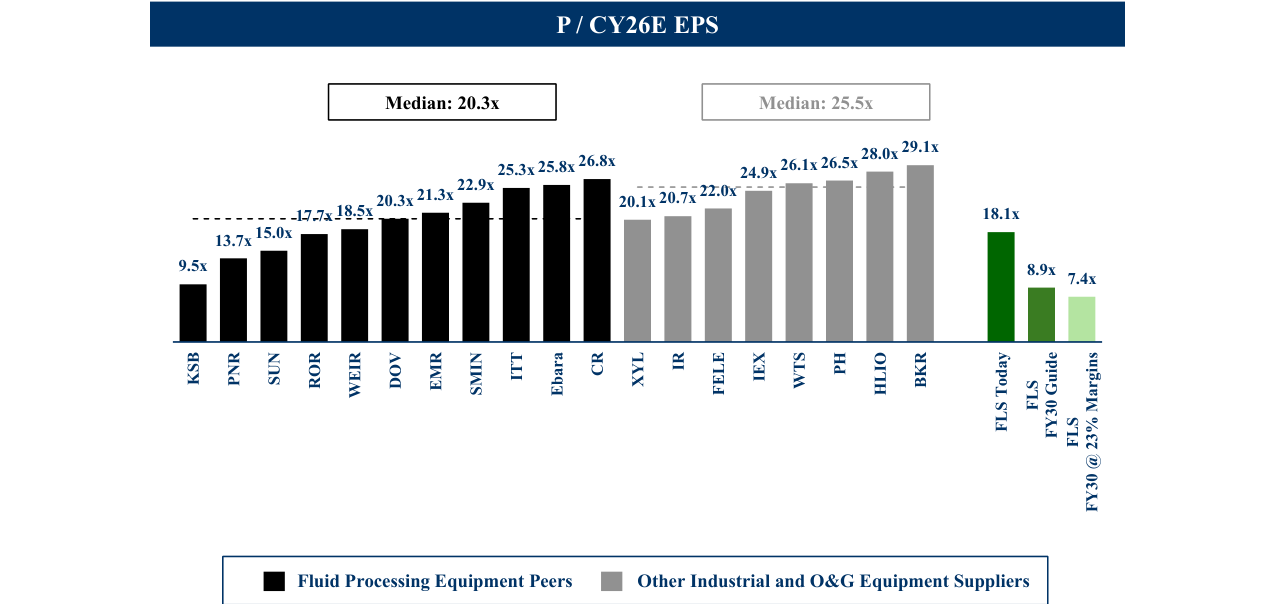
Flowserve's FY30 targets provide a clear path to significantly higher profitability. If the company can execute on its mid-single-digit organic revenue growth plan, expand adjusted operating profit margins to at least 20%, improve free cash flow conversion, and maintain disciplined capital allocation, by FY30 Flowserve should generate significantly higher adjusted EPS. Assuming Flowserve achieves its long-term targets and uses 100% of excess free cash flow for share repurchases, the company currently trades at only 8.9x pro forma FY30 adjusted EPS¹⁶. If Flowserve expands adjusted operating profit margins to 23% by FY30 (still below the expected level of best-in-class peers at that time), we estimate its implied pro forma multiple would be even lower, at just 7.4x¹⁶.
We believe Flowserve can achieve or even surpass these targets, and shareholders should expect the company to deliver. If Flowserve executes effectively, the current stock price implies significant upside. Based on our extensive due diligence and discussions with industry executives, we see no structural barriers preventing Flowserve from achieving margins comparable to best-in-class peers. We hope management will seize this exceptional opportunity, but it is the board's responsibility to ensure Flowserve has the right leadership to deliver value for shareholders.
Footnotes:
¹⁶ Source: Public company filings, Capital IQ, Wall Street consensus estimates, Starboard estimates. Market data as of May 26, 2026.
Note: The "FLS FY30 LT Guide" scenario assumes FY25 reported revenue of approximately $4.7 billion, plus $210 million in revenue from the acquisition of Trillium Flow Technologies' valve division (based on management's guidance of $200+ million in Flowserve's Q4 FY25 earnings presentation), growing at a 5% CAGR to FY30 revenue of $6.3 billion; FY30 adjusted EBIT of $1.3 billion, based on a 20% adjusted operating profit margin; FY30 adjusted EBITDA of $1.4 billion, based on a 22% adjusted EBITDA margin, reflecting an assumed 200bp spread between adjusted EBIT margin and adjusted EBITDA margin. The "FLS FY30 @ 23% Margins" scenario assumes the same revenue; FY30 adjusted EBIT of $1.5 billion, based on a 23% adjusted operating profit margin; maintaining the 200bp spread between adjusted EBIT margin and adjusted EBITDA margin. Both scenarios assume 60% free cash flow to adjusted EBITDA conversion, implying FY30 FCF to net income conversion of approximately 95% and 92%, respectively (company target is 100%); a 21% tax rate; and pro forma net interest expense based on FY25 adjusted net interest expense (including interest expense and interest income), plus incremental interest expense from financing the Trillium acquisition, reflecting $500 million in debt raised at a 5.7% interest rate. The "FLS FY30 LT Guide" scenario assumes cumulative share repurchases of $2.8 billion by FY30, repurchasing approximately 26 million shares at an average price of $107, based on an assumed annual stock price appreciation of 15.0%. The "FLS FY30 @ 23% Margins" scenario assumes cumulative share repurchases of $3.3 billion by FY30, repurchasing approximately 29 million shares at an average price of $114, based on an assumed annual stock price appreciation of 18.0%. All estimates are based on information from sources believed to be reliable and include certain assumptions that may prove to be inaccurate.
Additionally, while Flowserve may have opportunities for disciplined tuck-in M&A to enhance the company's growth profile, product portfolio, or aftermarket position, any such capital deployment should be weighed against the clear and measurable accretion benefits of repurchasing stock at Flowserve's current discounted valuation.
Starboard believes the fluid handling equipment peers and other industrial and oil & gas peers shown in the "P / CY26E EPS" chart are the most relevant group for benchmarking Flowserve's trading multiples, given product similarity. This analysis is subject to a degree of subjectivity. Since the full universe of potential peers is not listed here, comparisons made herein may change materially if other companies were included.
Shareholders can benefit from a win-win situation, but the board does not have that luxury.
Despite a weak first-half earnings trajectory, Flowserve maintained its full-year EPS guidance and only slightly lowered its full-year organic growth guidance. The company's full-year outlook requires a significant acceleration in the second half. To reach the midpoint of its FY26 organic growth guidance, Flowserve would need to achieve organic growth of approximately 8.0% in the second half of 2026. Management has set clear expectations for FY26, and we hope this reflects confidence in the business and improving execution. If Flowserve delivers, shareholders will benefit from improved growth and significant upside from the current discounted valuation. Even without meaningful improvement, shareholders would still be acquiring a quality business at a reasonable price.
On the other hand, the board cannot afford to wait for execution to improve—it is the board's duty to oversee the company and hold management accountable. We expect board members to share management's confidence. If not, please find ways to strengthen accountability and execution immediately. If the company fails to meet its targets again, we believe shareholders will expect significant changes. We fully expect the board to take decisive action to ensure Flowserve has the right leadership team.
In either scenario, shareholders should benefit from higher standards of performance and a more urgent focus on value creation. In either scenario, shareholders should expect the board to oversee a leadership team that drives operational improvements well beyond the FY30 targets.
Conclusion
Flowserve has the characteristics of a best-in-class industrial company: a leading position in mission-critical products, a valuable installed base, a strong aftermarket business, and exposure to attractive and growing downstream end markets. However, the company's margin and overall operational performance have not met the level shareholders should expect from a business with these advantages. The gap between the quality of the business and its current growth and profitability levels remains too wide. This is an excellent business, and it can do better. We look forward to working with management and the board to ensure the company operates better, improves faster, and captures the positive trends across its business lines.
Sincerely,
Jeffrey Smith
Managing Member
Starboard Value LP