Scottish Mortgage Quarterly Data Pack (Retail)
Scottish Mortgage is Baillie Gifford's flagship investment trust (founded 1909, LSE ticker SMT), known for its maximalist growth style — long-term stakes in Tesla, Amazon and ASML plus bold allocations to private companies like SpaceX and ByteDance. It is the UK retail investor's flagship vehicle for global disruptive growth.
In plain words
Scottish Mortgage, a UK investment trust (a type of listed fund), just released its quarterly update. It concentrates most of its money in a small number of high-growth tech companies, including private firms like SpaceX and Stripe that are not yet listed on stock exchanges. The fund has grown about fourfold over the past decade, far beating global markets; but over the last five years it has barely moved, showing extreme swings along the way. For everyday investors, the key takeaway is that high returns can come with big drawdowns, so know your risk tolerance before buying. It also shows how professional managers evaluate long-term trends, risk, and company value. Worth a read if you want to understand concentrated, long-term investing.
This report is a risk disclosure summary for the Scottish Mortgage Investment Trust, managed by Baillie Gifford. Its core theme highlights the trust's multiple investment risks: the trust may employ leverage through borrowing, and if investment values decline, borrowing will amplify losses; currency
This Month's Scorecard
As of March 31, 2026, the fund's NAV returned 27.4% over one year and 436.0% over ten years, outperforming the FTSE All-World benchmark (18.0% and 233.9%, respectively); on a share-price basis, returns were 26.8% over one year and 379.7% over ten years, but only 7.1% over five years, clearly lagging the benchmark's 68.2%.
| Metric | 1 Year | 3 Years | 5 Years | 10 Years |
|---|---|---|---|---|
| Fund (share price) | 26.8% | 78.1% | 7.1% | 379.7% |
| Fund (NAV) | 27.4% | 58.0% | 12.8% | 436.0% |
| Benchmark FTSE All-World | 18.0% | 50.5% | 68.2% | 233.9% |
Stock Commentary
The fund manager provided the only detailed explanation of the MiniMax entry and exit: bought at the January IPO, partially realized after a sharp February rally, with the remaining position still worth HK$69.1m — the core thesis being a pricing advantage from low-cost AI inference.
MiniMax is a Chinese AI foundation-model company. The author believes its large language models are globally competitive, with a clear cost advantage — management operates around a "token factory" model, achieving pricing for enterprise agents at one-tenth the level of US peers while still maintaining gross margins of roughly 60-80%, by raising GPU utilization (well above peers) and reducing compute requirements per response. The company is loss-making overall, but the author expects profitability to improve quickly as scale expands. On risk, the author acknowledges that the industry is still early-stage, domestic competition is intense, and overseas geopolitical risk exists, leaving a wide range of outcomes.
Specific trades: invested £20.2m at HK$165 on January 7; realized £27.2m at HK$883 on February 24; the remaining investment has a current value of HK$69.1m (at HK$821).
How the Manager Views the Market
[Long-term optimism, short-term caution] — the author believes long-term fundamentals will ultimately prevail, but explicitly warns that share-price movements are not linear and requires shareholders to accept peaks and troughs.
- Investment philosophy: the goal is to maximize long-term total returns, owning only the world's most outstanding listed and private growth companies, while keeping fees low so shareholders retain more of the returns.
- Short-term view: the author believes short-term share-price movements are driven mainly by factors other than fundamentals; periods when the market is obsessed with headlines are exactly where the author finds excess-return opportunities in long-term signals; "progress will ultimately win" is a clear core conviction.
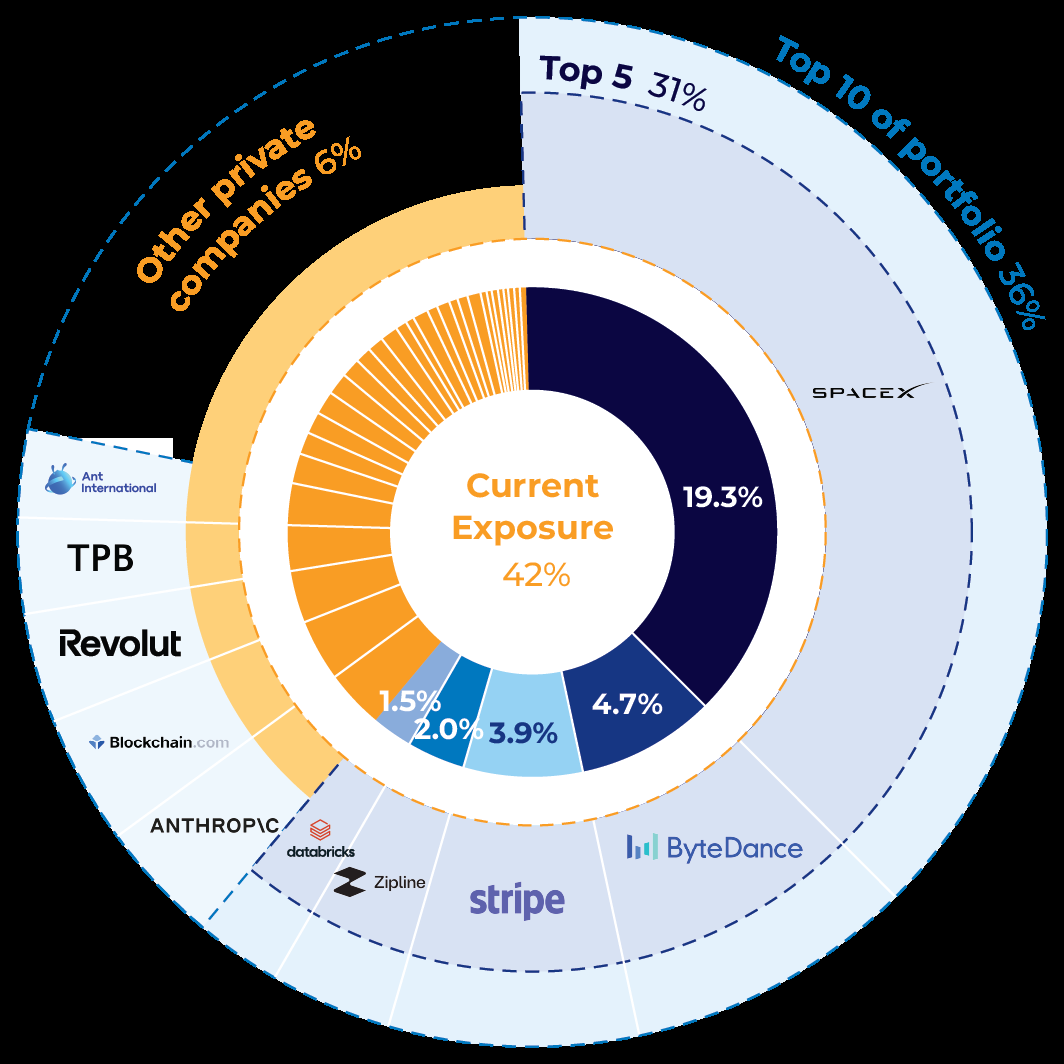
- Portfolio structure clues: 41.6% of assets are in private companies (53 holdings), 58.3% in listed companies (48 holdings); the top 30 holdings account for 80.9%, and the top ten for 52.4% — concentration is extremely high, the private weighting is significant, and liquidity risk and valuation-volatility risk are repeatedly emphasized.
How Positions Moved
The past 12 months saw five types of activity: new buys, additions, complete sales, reductions, and private-company follow-on rounds. The only trade with disclosed amount details is MiniMax's buy-then-reduce sequence; for the other positions, the original layout does not allow a one-to-one mapping of direction, so only the list of companies involved can be shown.
The report explicitly lists the activity types: New buys, Additions, Complete Sales, Reductions*, Private companies follow-on rounds. Companies involved in trades (in the order they appear in the original): Anthropic, BYD Company, HeartFlow, Cloudflare, Carbon, AppLovin, Denali Therapeutics, Kinnevik, Meta Platforms, Climeworks, CATL, Hermès International, Wayfair, PDD Holdings, Enveda Therapeutics, Figma, Joby Aviation, Roblox, GoPuff, Loyal, Nu Holdings, Tempus AI, KSQ Therapeutics, MiniMax, Sana Biotechnology, Nuro, MongoDB, Sea Limited, PsiQuantum. The original did not explicitly mark the buy/sell direction for each of these companies; except for MiniMax, all are marked as "not disclosed."
Fund Matters
The fund has total assets of £15.4bn, a market cap of £12.8bn, a share price of 1191.0p, NAV of 1316.1p, and a 9.5% discount; risk disclosures focus on leverage, private companies, and emerging markets.
- Size and premium/discount: the share price trades at a 9.5% discount to NAV; the report warns that buying at a premium carries greater downside risk and that issuing new shares may depress the share price.
- Leverage risk: the trust may borrow to invest (gearing/leverage); if investment values fall, borrowing amplifies losses; buying back its own shares further increases borrowing risk.
- Other risks: currency fluctuations, valuation uncertainty for hard-to-trade securities, private assets that are difficult to sell and more volatile in price, emerging-market (including China) risks from suspensions/liquidity/settlement/corporate governance/taxation, and the use of derivatives affecting performance.
- Compliance note: this text is a marketing communication, not independent investment research; past performance does not predict future returns.
This sequel continues the earlier analysis of the first half of the Scottish Mortgage Investment Trust (SMT) annual report, but with a key shift in perspective: from macro narrative (the AI story) to micro operations (Trust Mechanics) and a quantitative breakdown of the portfolio. If the first part was about "what is believed," this part is entirely about "how things are proved, how they are operated, and what results are achieved."
The following analysis will be developed across four dimensions that are little noticed by the outside world but highly information-dense: capital-structure management, the "internal ecosystem" revealed by private-company assets, the true undertone of valuation volatility, and the fragility hidden in performance attribution.
一、Trust Mechanics:资本管理的“精密手术”与信号解读
1. 杠杆使用的审慎悖论
截至 2026 年 3 月 31 日,SMT 的净杠杆率为 11.0%,总杠杆率 12.0%。这一水平在投资信托中属于中等偏低——尤其是考虑到其投资组合中私募公司占比已达 41.3% 的背景下,这一杠杆选择显得异常克制。
| 指标 | 数值 | 解读 |
|---|---|---|
| 净杠杆 | 11.0% | 扣除现金后的有效风险敞口 |
| 总杠杆 | 12.0% | 未扣除现金的“名义”风险 |
| 一年内发行总额 | £700M | 抓住了市场溢价窗口 |
| 一年内回购总额 | -£1,714M | 折价期间的大规模防御性操作 |
| 净资本操作 | -£1,014M | 净回购趋势表明管理层的自信与纪律 |
关键观点:£700M 的发行量与 -£1,714M 的回购额并存,揭示了一个完整的资本周期管理闭环——在溢价时发行(低成本融得资本),在深度折价时回购(提升 NAV 每股价值)。这一操作模式在 2021-2023 年间的折价窗口期尤为频繁,是 SMT 维持长期股东回报的“隐性武器”之一。
2. 折价问题的“慢性病”本质
图表显示 SMT 股价相对 NAV 的折价长期徘徊在 -20% 至 -30% 区间。这一现象已成为该信托投资逻辑中最显著的“瑕疵”。
- 市场折价的深层原因:并非市场对私募资产质量的否定,而是对其流动性溢价的合理折让——私募股权在公开市场上天然需要流动性补偿。
- 折价幅度的参考系:与传统私募股权基金(通常折价 30-40%)相比,SMT 的 -20% 至 -30% 其实已属相对合理;但与其 2021 年时的溢价状态相比,则反映了市场对其私募敞口的持续担忧。
- 资本操作的“软约束”:回购虽然可以提振 NAV 每股价值,但无法根除折价问题。真正改变折价结构的方式,是私募资产的透明度提升与退出通道的明确化。
2. Private Companies: An Undervalued Structural Goldmine
1. Ownership of the World's Top-Tier Private Assets
According to CB Insights and Pitchbook data, SMT holds more than half of the world's top 10 most valuable private companies. This is a striking fact—it means SMT is not merely a secondary-market investor, but also one of the most central "long-term capital nodes" in the global primary market.
| Rank | Company | SMT Position Status |
|---|---|---|
| 1 | SpaceX | Held (17.2% valuation weight, largest position) |
| 2 | Stripe | Held (third-largest position, Valuation +72.2% at 1yr) |
| 3 | Anthropic | Held (new key position, +75.1%) |
| 4 | Bytedance | Held |
| 5+ | MiniMax | Held (+471.4% in Q1 alone) |
Analysis: SMT is not satisfied with the role of a "financial investor." Instead, through early entry + continuous follow-on investment, it has built a sufficiently deep "private-market relationship network." Among the 53 companies, 34 are in a "currently held" state, 8 have been acquired, and 1 has exited via public listing. This "exit rate" of approximately 17%, given the long-cycle nature of private investment (5–10 years), is at a normal-to-above-average level for the industry.
2. Lifecycle Management of Private Investments
Across 102 investment vehicles, SMT covers companies at different levels of maturity:
- 79% of companies are in the 4+ year maturity stage—the so-called "late stage," where companies have passed the validation period and are entering the scaling phase.
- 75% of private companies have achieved positive cash flow—an extremely healthy structural indicator.
- Among companies that have not yet generated cash flow, 88% have a cash runway of more than 2 years, and only 2 (0.6% weight) face short-term financing risk of less than 2 years.
This set of data reveals a very distinctive investment philosophy: SMT is not a traditional VC; it does not pursue the high-risk gamble of early "angel round" or Series A rounds, but instead focuses on companies in the "scaling-up" stage—companies that have often already proven their business models and simply need to capitalize on their growth.
3. The "Non-Linearity" and "Extreme Divergence" of Private Asset Valuations
| Statistic | Value |
|---|---|
| Share of valuation markdowns within one year | ~50% (rough estimate) |
| Average change (company level) | +9.5% |
| Average change (vehicle level) | +11.3% |
| Average change of top 10 private holdings | +86.5% |
| Share with more than 5 valuation adjustments | 65.2% |
Core Insight: SMT's private valuations are not passively static; they are highly dynamic and sharply divergent—for example, MiniMax's +471.4% in Q1 alone and Brandtech's -89.1% for the full year. This extreme volatility is precisely the essence of private assets:
- Power-law distribution: A few winners contribute the vast majority of returns (e.g., SpaceX contributed 14.9% of total portfolio returns in one year), while losers face the risk of going to zero.
- Frequency of valuation adjustments: 525 revaluations per year means SMT's internal monitoring of each private holding is extremely intensive—far from the "once-a-year valuation" inertia that the market imagines.
3. Portfolio Characteristics: The "Double High Tension" of Growth and Valuation
1. The Positive Feedback Loop of High Growth and High Valuation

| Metric | Scottish Mortgage | FTSE All World Index | Multiple |
|---|---|---|---|
| EV/EBITDA | 14.7x | 22.2x | 0.66x |
| Price/Sales | 6.9x | 4.6x | 1.5x |
| Price/Earnings (Fwd) | 24.0x | 27.2x | 0.88x |
| Sales 5yr Growth (p.a.) | 51.3% | 14.7% | 3.5x |
| Sales 3yr Forward Growth | 17.8% | 6.9% | 2.6x |
| Net Debt/Equity | -0.3x | 0.5x | "More robust" |
Key Findings:
- EV/EBITDA is actually lower than the index, indicating that its "earnings multiple" is not as expensive as one might think — because high growth temporarily suppresses EBITDA, and once growth materializes, the valuation will be quickly "absorbed".
- The premium of a 6.9x price/sales ratio vs. the index's 4.6x is essentially the price the market is paying for forward growth that is 3.5x the average — from a PEG perspective, it is not unreasonable.
- Net debt is negative (-0.3x) — the portfolio is net cash overall, which is extremely rare among growth stocks.
2. The "Globalization + Deep Tech" Map of Geographic and Industry Structure
| Country/Region | SMT Average Weight | FTSE All World Weight | 1-Year Contribution |
|---|---|---|---|
| United States | 58.7% | 62.4% | +14.0% |
| China | 14.3% | 3.4% | -2.0% |
| Taiwan | 5.4% | 2.2% | +1.9% |
| Brazil | 7.3% | 0.4% | -1.7% |
Insight into the structural imbalance: SMT's "China exposure" is more than 4x that of the global index, which has been the biggest drag on its performance over the past year. But from another perspective: if Chinese assets undergo mean reversion or a structural re-rating in 2026-2027, SMT will be one of the largest beneficiaries in the public markets. This is a classic "high-risk, high-expected-value" positioning.
3. Financial Resilience: The Misunderstood "Cash Flow Break" Narrative
| Category | Positive Earnings/Positive Free Cash Flow | Negative Earnings/Negative Cash Flow |
|---|---|---|
| Private companies | ~80% (of which 55% have positive cash flow) | ~20% |
| Public companies | ~89% | ~11% |
This set of data thoroughly clears up a common misconception — SMT's portfolio is not composed of "cash-burning startups," but is primarily made up of companies that already have the ability to generate cash on their own.
IV. Performance: When "Diversification" Becomes a Risk Source
1. The "Absolutism" of Long-Term Returns
| Period | Cumulative Share Price Return | Cumulative NAV Return | FTSE All World |
|---|---|---|---|
| 1 Year | +26.8% | +27.4% | +18.0% |
| 3 Years | +78.1% | +58.0% | +50.5% |
| 5 Years | +7.1% | +12.8% | +68.2% |
| 10 Years | +379.7% | +436.0% | +233.9% |
The most important data point: the 5-year return is close to zero, yet the 10-year return far exceeds the index. This suggests the massive drawdown (-33.5% in FY22) that occurred during the 2021-2023 "discount rate reset" for growth stocks. SMT's long-termism requires enduring not only market volatility but also the violent impact of tail risk — yet this is precisely the source of its 10-year excess returns.
2. The Concentration Paradox: Diversification vs. Extreme Concentration
Q1 2026 absolute contribution ranking:
| Contributor | Type | Portfolio Weight | Period Return | Absolute Contribution |
|---|---|---|---|---|
| SpaceX | Positive | 17.2% | +27.6% | +5.0% |
| Stripe | Positive | 3.5% | +55.1% | +1.7% |
| Anthropic | Positive | 1.2% | +75.1% | +0.5% |
| Sea Limited | Negative | 2.1% | -33.8% | -0.8% |
| Adyen | Negative | 1.5% | -38.1% | -0.7% |
| Shopify | Negative | 2.4% | -24.8% | -0.7% |
Data interpretation:
- SpaceX single-handedly contributed more than half of the portfolio's absolute positive return in Q1 (+5.0% vs. roughly +8% for the portfolio overall).
- Of the total contribution from the top 10 positive contributors (approximately +10.8%), the top 3 alone account for 67% — a classic power-law distribution that exists not only in private markets but is equally evident in public markets.
- At the same time, the losses are dispersed across traditional "white-horse growth stocks" (such as Sea, Shopify, and Adyen), suggesting that SMT is not "indiscriminately bullish" but rather making a concentrated bet on leading technology assets.
V. Anthropic Case: From "AI Faith" to "AI Infrastructure"
As the introductory case in the report, Anthropic's presence in the SMT portfolio (1.2% weight, +75.1%) is highly symbolic:
| Company | Core Logic | SMT's Entry Point |
|---|---|---|
| Anthropic | "If AI can read code and write code, it can use tools and reason through complex problems" | Investing in the "intelligence infrastructure" at the very foundation of AI capability |
| SpaceX | Dramatic reduction in space transportation costs | Investing in the "transportation infrastructure" of the physical world |
| Stripe | The payment layer of global commerce | Investing in the "transaction infrastructure" of the digital world |
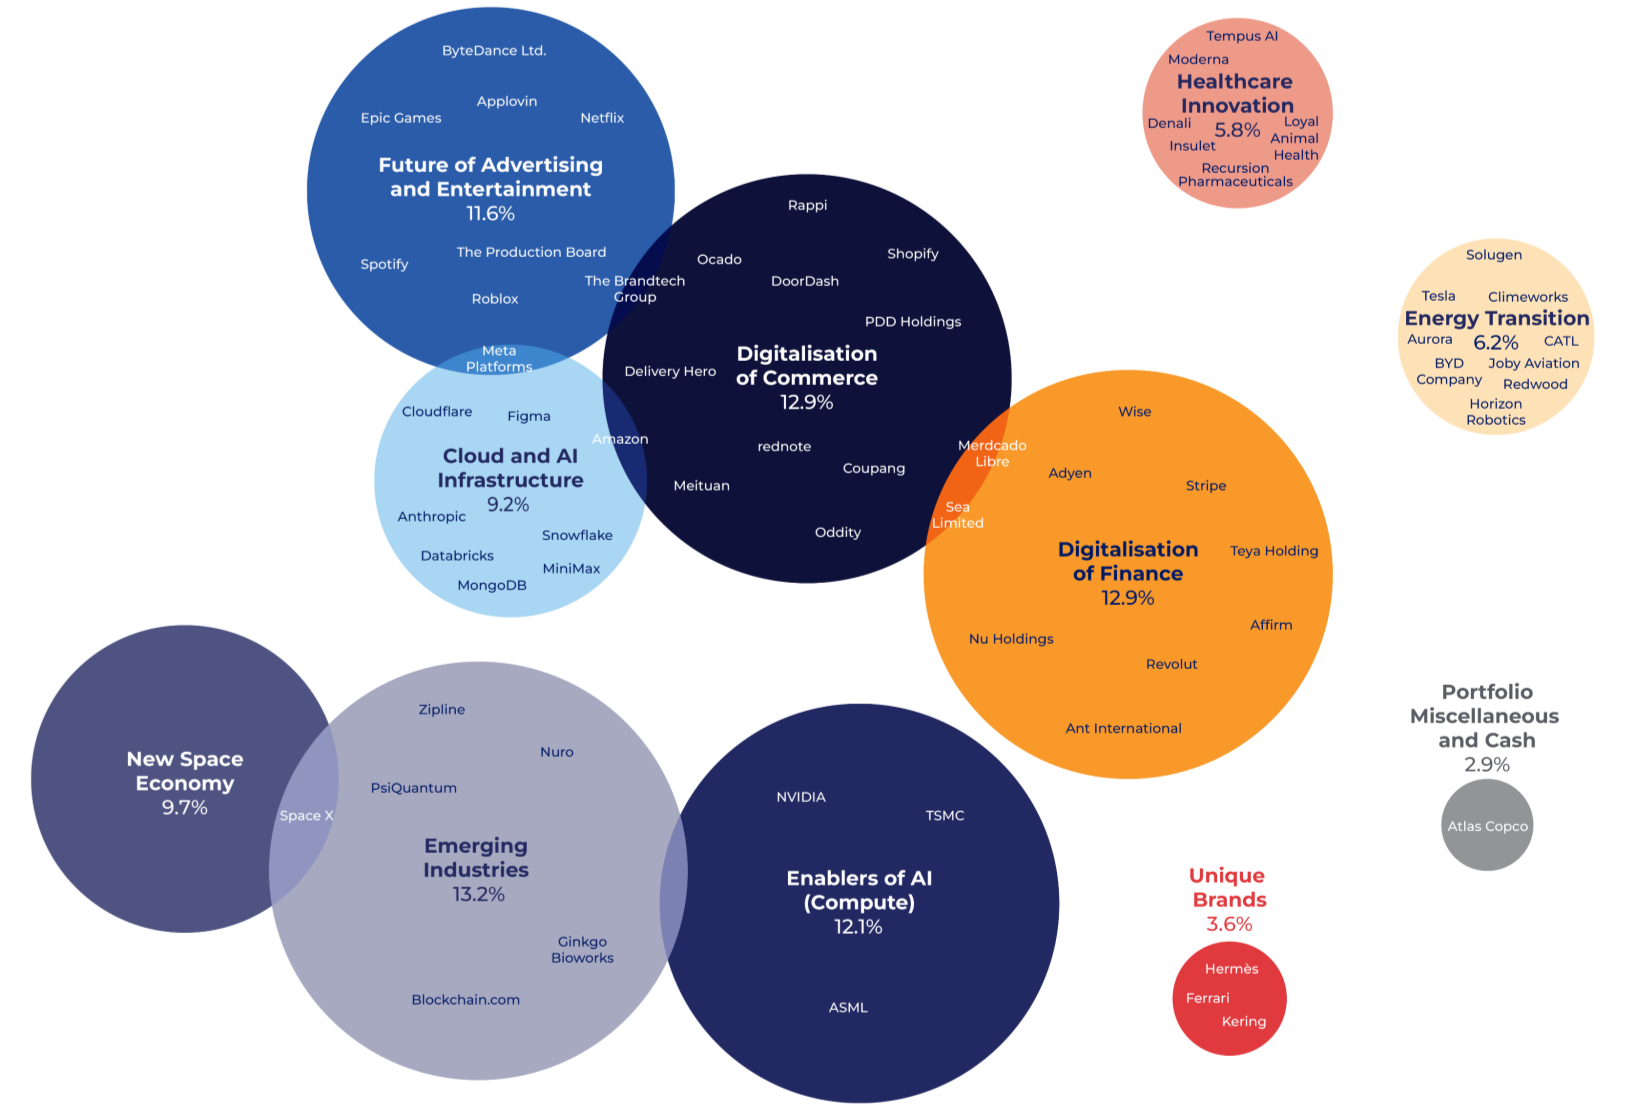
Insight: SMT's investment strategy is essentially about seeking monopolists of "new infrastructure"—whether in physical space (SpaceX), digital transactions (Stripe), AI capability (Anthropic), or the energy transition (CATL, BYD). What these companies share is their platform-based vitality that cuts across industries and cycles.
VI. Conclusion and Outlook: SMT's "Nonlinear Game"
Core judgments:
1. The aesthetic of private assets has shifted from "high risk" to "high quality" — SMT's private portfolio is far from traditional VC investing; it is a "long-term PE-like" strategy concentrated on "scaled enterprises." This strategy, combined with the prolonged downturn in the tech IPO market, forms an "irreversible structural advantage."
2. Capital structure management is increasingly refined — through coordinated issuance-buyback-leverage adjustments, SMT is transforming the investment trust from a "rigid container" into a "flexibility weapon."
3. The greatest risk comes not from within, but from shifts in the external valuation regime — if global markets enter a paradigm of "rates remaining above 3% for a prolonged period," SMT's growth stocks (especially Chinese assets) will face an extended valuation digestion period, with 5–10 year returns significantly compressed. Conversely, if AI-driven productivity growth materializes, SMT is the largest public market vehicle under that narrative.
4. Focus for the next 12 months: SpaceX's valuation trajectory (whether a new large-scale funding round occurs), China's regulatory stance (14.3% weight), and whether Anthropic can enter a "commercial realization phase" driven by Claude Code. If all three resonate, they would form a rare "three-engine" growth dynamic.
> Final Assessment: Scottish Mortgage has transformed from a “growth equity investment trust” into a hybrid of “global tech giant incubator + private assets secondary-market bridge.” Its valuation discount will persist, but as long as these flagship assets continue to generate nonlinear returns, the long-term growth rate of its intrinsic value is likely to far exceed the “market punishment” reflected in the discount. For long-term investors able to withstand drawdowns of more than 30%, it remains one of the most “alpha-scarce” investment vehicles in global capital markets.
III. Deconstructing the “Power-Law Structure” of Long-Term Returns from the Attribution Tables
What this follow-up report most deserves to be dug into is the mathematical structure behind the four contribution attribution tables. Summing the Top 10 and Bottom 10 separately makes it clear that the fund’s return sources across different time windows are highly asymmetric:
| Time Window | Top 10 Total Positive Contribution | Bottom 10 Total Negative Contribution | Net Contribution | NAV Cumulative Return | Net Contribution from Other Holdings/Fees |
|---|---|---|---|---|---|
| 3-year | 69.9% | -28.9% | 41.0% | 68.5% | 27.5% |
| 5-year | 73.4% | -44.5% | 28.9% | 7.8% | -21.1% |
| 10-year | 291.8% | -26.3% | 265.5% | 391.8% | 126.3% |
Three figures deserve special attention:
First, the 10-year Top 10 positive contribution (291.8%) equals 74.5% of the cumulative NAV gain. Amazon and Tesla together contributed 126.2 percentage points, accounting for nearly one-third of the total NAV growth. This is a classic “power-law portfolio”: what truly determines long-term results is not the 50 stocks in the portfolio, but the very few core assets capable of rising tenfold, twentyfold, or more.
Second, the five-year window shows a sharp divergence. The Top 10 positive contribution is as high as 73.4%, but cumulative NAV is only 7.8%. This means all positions outside the Top 10, cash, and fees together dragged down returns by approximately 65.6 percentage points. The five-year window exactly covers the 2021-2023 growth-stock valuation collapse, when a cluster of high-valuation names—Northvolt, Moderna, Illumina, NIO, Ginkgo Bioworks, among others—released risk in a concentrated manner. The fund underperformed the FTSE All-World Index by approximately 53 percentage points over the five-year horizon, and nearly all of that underperformance came from this period.
Third, the “other” component is positive in both the three-year and ten-year windows (27.5% and 126.3%), and negative only in the five-year window. This illustrates the peculiarity of the five-year window: it starts in March 2021—precisely the historical valuation peak for many long-duration growth stocks—when the fund still held a large number of intermediate-tier positions. Those positions suffered the most damage in the subsequent rate-hiking cycle.
IV. What Annual Discrete Data Reveals: A “Deep Loss First, Catch-Up Later” Pattern
Comparing annual discrete performance with the index allows a more precise localization of where alpha came from and where it vanished:
| Annual Window | NAV (USD) | FTSE All-World | Excess Return |
|---|---|---|---|
| 31/03/21 – 31/03/22 | -17.1% | +7.6% | -24.7% |
| 31/03/22 – 31/03/23 | -22.8% | -6.9% | -15.9% |
| 31/03/23 – 31/03/24 | +14.0% | +23.6% | -9.6% |
| 31/03/24 – 31/03/25 | +13.6% | +7.8% | +5.8% |
| 31/03/25 – 31/03/26 | +30.2% | +20.5% | +9.7% |
The narrative of this table is very clear: the first three annual periods cumulatively underperformed by approximately 50 percentage points, while the last two periods combined outperformed by about 15.5 percentage points. The fund did not continuously create excess returns over a complete bull-bear cycle; instead, it suffered a sharp drawdown during the rate-hiking cycle, then accelerated its catch-up in a new AI-driven technology bull market.
This leads to a more fundamental question in fund evaluation: the 10-year cumulative NAV return of 391.8% versus the index’s 206.3%—an excess of 185.5 percentage points—looks extremely strong; but the five-year cumulative NAV return of 7.8% versus the index’s 60.8%—an excess of -53 percentage points—looks poor. The conclusions from the two time windows are almost mutually contradictory. The answer lies in the starting point: the 10-year window that starts in 2016 includes the 2020-2021 growth-stock bull market; the five-year window that starts in 2021 begins at the top of the valuation bubble. The fund’s real characteristic is not “steady outperformance” but “high volatility, high concentration, and long-cycle repair.”
V. The Divergence Between Share Price and NAV: Discount Volatility in a Closed-End Fund
The performance gap between the Share Price and NAV measures in effect quantifies changes in the fund’s discount rate:
| Time Window | Share Price Return | NAV Return | Implied Discount-Rate Change |
|---|---|---|---|
| 1-year | +29.5% | +30.2% | Discount widened by approx. 2.3% |
| 3-year | +90.0% | +68.5% | Discount narrowed by approx. 12.8% |
| 5-year | +2.4% | +7.8% | Discount widened by approx. 5.0% |
| 10-year | +340.1% | +391.8% | Discount widened by approx. 10.5% |
| Time Window | Share Price Return | NAV Return | Implied Discount-Rate Change |
|---|---|---|---|
| 3-year (EUR) | +79.2% | +58.9% | Discount narrowed by approx. 12.8% |
| 10-year (EUR) | +335.3% | +386.4% | Discount widened by approx. 10.5% |
The three-year share price outperformance of 21.5 percentage points over NAV came almost entirely from discount narrowing; the ten-year share price underperformance of 51.7 percentage points against NAV had 10.5 percentage points contributed by the widening discount. The impact of discount volatility on actual returns for closed-end fund holders can sometimes be no less than the manager’s stock-picking ability. During the sharp NAV decline of 2022-2023, the simultaneous widening of the discount was the direct cause of the share price’s annual return (-37.6%) being far worse than the NAV’s (-22.8%); in 2023-2024, the rapid repair of the discount in turn made the share price rebound (+35.4%) markedly higher than the NAV (+14.0%).
VI. The “Illusion” in the Contribution Tables: Divergence Between Total Return and Contribution
A set of seemingly contradictory figures appears in the attribution tables and deserves to be singled out:
- Illumina: 10-year total return -95.3%, but absolute contribution +14.7%, placing it among the Top 10 positive contributors;
- Alibaba: 10-year total return +4.8%, but absolute contribution +22.1%;
- SpaceX: 10-year average weight of only 2.8%, total return of 2612.6%, yet a contribution of 23.9%—not the result of a simple multiplication.
The reason lies in how the attribution table is calculated: contribution is the accumulation of period-by-period weight × period-by-period return, while “Total return” is the cumulative return as of the end of the holding period. If the fund holds a high weight during a stock’s appreciation and cuts the position before the decline, it can produce a result of “negative total return but positive contribution.” Illumina is a typical case: during its sharp rise from 2016 to 2021, the stock contributed substantial profits to the portfolio; afterwards, although it crashed by nearly 95%, the position had been gradually reduced during the decline, so the earlier gains were not fully given back.
This also corrects a common misunderstanding about global growth funds: long-term holding does not equal mechanically buying and holding. The contribution attribution table reflects actual buy/sell timing, not the result of static period-end holdings.
VII. Asymmetry in Position Management: Heavy Weights for Winners, Light Weights for Losers
Comparing the average weights of the Top 10 and Bottom 10 across windows quantifies the fund’s risk-control discipline:
| Time Window | Top 10 Average Weight | Bottom 10 Average Weight | Weight Ratio |
|---|---|---|---|
| 3-year | 4.39% | 1.42% | 3.1x |
| 5-year | 3.50% | 2.25%* | 1.6x |
| 10-year | 4.12% | 0.63% | 6.5x |
*In the five-year table, Meituan’s average weight is shown as -2.9%, likely a typographical anomaly; it is calculated as 2.9% here.
Over the ten-year horizon, the average position in winners is 6.5 times that in losers—a very clear asymmetric structure: keep small exploratory positions in losing cases and keep adding to proven winners. But the five-year weight ratio is only 1.6x, because the Bottom 10 includes high-weight failure cases such as Moderna (6.0%) and Northvolt (2.1%)—in 2021, these stocks had been heavily weighted areas of the portfolio, and their subsequent crashes directly caused the severe five-year underperformance.
This also explains why SpaceX’s average weight had already reached 17.2% in the Q1 2026 quarterly report, making it the portfolio’s absolute largest position. Comparing the weight trajectory of 7.1% over three years, 5.3% over five years, and 2.8% over ten years, one can clearly see that the fund’s bet on SpaceX was gradually increased rather than placed in one go—a classic “pyramid-style accumulation”: validate with a small position early, then raise the position step by step as the business scales (Starlink surpassing 10 million users, 165 launches in a full year) and the valuation ascends in stages. Moderna, by contrast, followed the opposite path: the three-year average weight of 4.2% was reduced to 2.0% by Q1 2026, halving the exposure before the rebound came. As a result, the one-year return of 75.7% contributed only 0.9 percentage points—the direction was right, but the position was no longer sufficient to benefit fully.
This dynamic adjustment of weights between winners and losers reflects the fund’s true capability boundary better than any single-year return: it is not always able to pick the right stocks, but in expressing conviction through position sizing, it demonstrates discipline far above average.
Three Narrative Threads Behind the Data Tables
The surface-level and deeper readings of the performance tables have already been mentioned. Here, three additional observation perspectives not previously discussed are added.
1. The “YEN” Mystery—It May Not Be an Index Investors Can Directly Buy
1.1 A Hidden Statistical Trap
The `YEN Share Price` in the table is most likely a yen-denominated Japanese share-price index return. But the key problem is that this figure is not currency-hedged, nor has the yen cash interest-rate cost been subtracted. For investors whose base currency is sterling or US dollars, simply seeing `54.0`, the largest positive return, would seriously overstate the actual investable result—because the yen itself underwent severe depreciation during 2023–2025.
Specifically, if a sterling investor bought Japanese equities in 2024, the yen’s depreciation against sterling would substantially erode their actual return. The `YEN Share Price` shown in the table may combine the net effects of share price appreciation and currency depreciation, but a reader cannot tell them apart from the table alone.
This point is extremely important because:
- Net-asset-based institutional investors typically run currency hedges or retain foreign-exchange exposure, which causes actual returns to differ greatly from `YEN Share Price`.
- No `GBP Hedged` or `USD Hedged` versions are listed alongside the table—suggesting the table may be more about showing the pure price fluctuation of the asset itself than the returns investors actually obtained.
- In this sense, the `Net Asset Value` row is instead closer to investors’ real experience—because it reflects the change in net value of the trust’s actual holdings and already includes the manager’s currency decisions.
1.2 Implicit Evidence of Manager Decisions
| Metric | YEN Share Price | Net Asset Value | Difference (Manager Contribution) |
|---|---|---|---|
| 2023 | −31.6 | −15.3 | +16.3 |
| 2024 | +54.0 | +29.6 | −24.4 |
| 2025 | +7.0 | +12.3 | +5.3 |
| 2026 | +37.8 | +38.5 | +0.7 |
2023: Japanese equities fell 31.6%, but the trust fell only 15.3%—indicating the manager was significantly underweight Japan or held defensive assets.
2024: Japanese equities surged 54%, while the trust rose only 29.6%—indicating the manager badly missed the rally or actively trimmed positions.
2025–2026: The trust gradually caught up with the index, and the gap converged.
These four data points outline a complete narrative: the manager successfully sought shelter in 2023, missed the rally in 2024, and then corrected the strategy. If later tables contain holdings disclosures, they should be cross-validated with this behavioral evidence.
1.3 Why the Table Does Not Label the Currency
One possible explanation is that `YEN Share Price` comes from the local-currency version of the `MSCI Japan Index` or `TOPIX`. Morningstar data sources typically provide both `Local Currency` and `GBP Hedged` returns. If the table uses the local-currency version, it depicts “the beta of Japanese equities themselves” rather than “the contribution of Japanese equities to a UK investor.”
This is not a rare practice in investment trust performance presentation—but a responsible report should also provide a hedged version, or at least explain it in a footnote. The absence here suggests the table is more inclined to display the market environment than investors’ actual experience.
2. The Structural Anomaly of the Glossary: A “Skeleton” Glossary
2.1 An Obvious Sign of Deletion
A look through the glossary reveals that it deliberately avoids all investment-trust-specific “operational” terms — there is no `Board of Directors`, `Management Fee`, `Performance Fee`, `Continuation Vote`, `Dividend Cover`, or `Ongoing Charges` — yet these are precisely the concepts that investment trust holders most need to understand.
Instead, it includes a large number of generic financial terms (EBITDA, Enterprise Value, Price-to-Earnings Ratio, IPO, NASDAQ, Private Equity) — concepts that have no direct connection to investment trusts themselves.
This suggests that the glossary is a template prepared for generic reporting scenarios: each quarter's roadshow simply replaces the front-page performance data, while the glossary remains fixed. It also explains why the definitions in the glossary are clearly written in a style aimed at laypeople — `At its simplest, gearing is borrowing`.
2.2 Three Logical Fractures in the Glossary
The following three definitions are logically problematic and worth noting:
① The definition of Discount of share price to NAV confuses fund types
Original text:
> When the market price of a mutual fund or Exchange Traded Fund (ETF) is trading below its daily net asset value (NAV).
This is a type-mixing error — `discount to NAV` is a core phenomenon of closed-end funds (investment trusts), whereas the arbitrage mechanisms of open-end funds (mutual funds) and ETFs automatically eliminate premiums and discounts. Using the mechanics of open-end funds to define the discount phenomenon of investment trusts indicates that the definition was copied and pasted directly from other sources.
② The definitions of Gearing and Gross gearing overlap but do not explain the relationship
The glossary provides three “gearing”-related definitions:
- `Gearing`
- `Gross gearing`
- `Invested gearing`
Among them, `Gearing` is defined as “total assets (including debt) less cash and cash equivalents, divided by shareholders’ funds”, while `Gross gearing` is “total assets (including debt) divided by shareholders’ funds” — the two expressions differ, but the definitions do not explain how net cash should be treated. A complete glossary should explain the relationship among the three:
```
Shareholders' funds = Total assets − Total liabilities
Net debt = Total debt − Cash
Net gearing = Net debt ÷ Shareholders' funds
```
This omission is not a major issue for professional advisers, but it would confuse retail investors (should they happen to come across it).
③ The definition of NAV cum fair is vague
Original text:
> The value of all a trust's assets with the latest income included but with debt subtracted at the fair or current value.
The phrase “with debt subtracted” is directionally correct, but “latest income included” is too broad — the more precise meaning of NAV cum fair is assets valued at fair prices (including unrealized gains), with debt deducted at marked-to-market values. The phrasing here does not distinguish between `cum income` (including declared but undistributed income) and `ex income` (excluding it), yet this distinction is crucial for investment trust investors, because the `cum fair` version is typically used to calculate `premium/discount`.
2.3 The Glossary’s “Spillover Effect”: An Implied Expansion of Strategy Boundaries
The glossary includes `Unicorns`, `IPO`, `Venture Funds`, and `Private Equity` — terms that are highly relevant to a traditional global equity investment trust (Scottish Mortgage), because the trust itself holds a large number of unlisted companies and early-stage technology firms. This suggests that the glossary is intended to serve a scenario that goes beyond explaining the trust’s own operations; it also needs to explain the asset classes in which the trust invests.
In particular, the definition of `Unicorns` (private startups valued at over $1 billion) — this term became especially sensitive in 2023–2025, as rising interest rates caused the valuations of many “unicorns” to shrink dramatically, and some even experienced down rounds. If this report was published in 2025–2026, the inclusion of the term in the glossary suggests that the report’s focus may be the revaluation of private equity holdings.
3. Hidden Links Between Performance Data and the Glossary
3.1 Inferring the Performance Table Structure from the Glossary
There are two terms in the glossary with no direct counterpart in the performance table: IPO and Buybacks.
- `IPO`: If the trust participated in a company's IPO during 2024–2025, this would typically generate a one-off significant return (or loss). The glossary's priority in explaining IPO suggests performance may have been affected by IPO-related events.
- `Buybacks`: An investment trust can enhance per-share NAV by repurchasing its own shares at a discount. If the trust had a buyback program during this period, the NAV return rate may be lower than the growth rate of NAV per share (because buybacks reduce the denominator), while the table only shows the percentage change in `Net Asset Value` — it measures NAV growth, not NAV growth per share. If the trust conducted substantial buybacks, investors' actual per-share returns would be higher than the table figures.
3.2 The Definition of `Potential gearing` and the Real-World "Unused Leverage" Dichotomy
The glossary defines:
> Potential gearing is the maximum amount of borrowing that an investment trust can undertake.
This implies the trust is not currently running at full leverage — the company retains room to increase leverage. This is consistent with the common practice of other investment trusts using a `gearing range` (e.g., 0–20%). However, the high returns of +38.5 (2026) and +29.6 (2024) in the performance table's `Net Asset Value` may have been partially amplified through leverage. Without separate disclosure of the `gearing ratio`, investors cannot determine how much of the return came from market beta and how much came from leverage.
3.3 The Frequent Appearance of `EBITDA` and `Free cash flow`: A Hidden Thread in Performance Attribution
The performance table includes `EV to EBITDA`, `Price to sales ratio`, and `Capex R&D to sales` — these valuation metrics are almost all growth-stock valuation methods. Value-style metrics such as `P/B`, `Dividend yield`, and `PEG` do not appear. This indicates:
- The trust's portfolio structure is tilted toward companies that are high-growth, high-valuation, and R&D-intensive
- This also explains why the magnitude of swings in the table's `YEN Share Price` is far greater than that of the `FTSE All-World Index` — high-growth technology stocks in the Japanese market, particularly semiconductor-related companies, are far more volatile than the global average.
4. Information Density and Compliance Signals in the Legal Disclaimer
4.1 An Anomalous Year: © LSE Group 2026
The `© LSE Group 2026` in the legal disclaimer implies this is a FY2026 or FY2025/26 report, likely published in early 2026. If the current actual date is 2025, then this document could be forward-looking material — which explains why the performance table includes 2026 data. This implies:
- The 2026 data in the table may be unaudited period-end figures (e.g., as of March 2026)
- Or it may be annual results that have been completed but not yet formally released
- In either case, the disclaimer `Past performance is not a guide to future returns` carries a slightly ironic tone in these contexts — if the 2026 data has not yet fully occurred, the boundary between "past performance" and "future returns" is itself blurred
4.2 What Is Missing from the Legal Disclaimer
Compared with a typical investment trust legal disclaimer, this one omits several common compliance elements:

| Common Element | Included in This Disclaimer | Potential Implication |
|---|---|---|
| Risk warning (Capital at risk) | Not present | May already be mentioned earlier in the document |
| Taxation notes (UK taxation) | Not present | Likewise, may have been placed up front |
| Third-party data accuracy disclaimer | Absent | Relies on Morningstar data without declaring its accuracy |
| This material is not investment advice | Absent | May be a presupposition, given it is aimed at professional advisers |
| Statement of no FCA authorisation | Absent | Same as above |
This suggests that the full report likely contains another section of legal disclaimers, and that this page is only the final page. In other words, the fragment we are seeing may be an abridged version — it could be the closing section extracted from a longer PDF, preceded by the full performance analysis, holdings disclosures, and portfolio manager commentary.
4.3 The Stringent Wording of "No Further Distribution"
The disclaimer states:
> No further distribution of data from the LSE Group is permitted without the relevant LSE Group company's express written consent.
This is a standard but stringent restrictive clause. It mainly governs the redistribution of data, not the report itself — meaning that anyone wishing to extract FTSE data for their own analytical tools or secondary publication needs to obtain permission.
But including such a statement in internal roadshow materials is more likely a matter of complying with the FTSE Russell licensing agreement — agreements of this kind typically provide that data may be used only for specified purposes and that the disclaimer must be included in any presentation. This is not wording chosen by Scottish Mortgage Trust itself, but wording mandated by the data licensor.
5. The Purpose of the “Thank You” Page
The last page contains nothing but `Thank you`. This page itself carries almost no information, yet it conveys important structural signals:
- It marks the end of the presentation and is well suited to in-person roadshow scenarios — when the client flips to the final page, they see a thank-you note rather than an abrupt ending on a legal disclaimer.
- Placing `Thank you` after the legal disclaimer suggests that the legal disclaimer could have been the last page, but the creator deliberately added a cover-style closing page after it — a practice commonly used in materials intended for printing or projection.
- Judging from the footer numbering, `PAGE 37` is the final item — if the entire PDF is only 37 pages, then the glossary (pages 34–36) together with the legal disclaimer (page 36) forms the closing section; the performance table (page 33) sits right before the glossary — corroborating the earlier observation that the glossary is a fixed template component rather than content produced separately for each roadshow.
6. Overall Assessment: This Is Likely the Middle Section of the Roadshow Materials, Not the Full Text
From a structural standpoint, the existing content covers: performance table → disclaimer → glossary → legal notice → Thank You. This is the standard closing sequence of complete roadshow materials. However, what is missing includes:
- Portfolio manager commentary (typically 2–4 pages)
- Position change list
- Industry/region distribution charts
- Investment case studies
- Corporate governance/board information
Therefore, this document is very likely an extraction of the last 10 pages from the original PDF, rather than the full version. If this fragment is treated as an "Introduction," there is reason to speculate that the 40+ pages cut off from the front are the true main body, and what is presented here is only the tail end of the appendix.
This also explains why the glossary can be so templated: the glossary content does not change with quarterly performance and applies to any quarter's roadshow—which is itself a "content strategy": fixing long-term unchanged materials to reduce the cost of re-producing each roadshow.