A Catalyst for the AI Bubble Break
GMO is a Boston asset manager co-founded in 1977 by Jeremy Grantham with Richard Mayo and Eyk Van Otterloo, known for valuation-driven dynamic asset allocation built on long-horizon mean reversion. Grantham is famous for calling historic bubbles, warning publicly ahead of both the 2000 dot-com crash and the 2008 financial crisis. Flagship publications include the GMO Quarterly Letter (now written by Asset Allocation co-heads Ben Inker and John Pease), Grantham's Viewpoints essays and the 7-Year Asset Class Forecast.
In plain words
This report warns that the U.S. stock market may be heading for a crash, not because AI profits are disappointing, but because too many companies are rushing to go public. GMO argues that mega-IPOs from firms like SpaceX and OpenAI could flood the market with new shares, adding roughly 5% to total supply. Historically, every 1% increase in supply drags the market down by about 4%. Worse, most fund managers are now forced to hold only U.S. stocks, making it hard for the market to absorb new shares. The author warns that this supply shock could pop the AI bubble before any earnings disappointment.
At a Glance
One-sentence summary of the author’s current market view: The U.S. stock market is facing a historic equity supply shock driven by AI capital expenditures and an IPO wave, which may trigger a bubble burst before AI demand deteriorates. [Bearish]
- The author warns that mega-IPOs from companies like SpaceX, Anthropic, and OpenAI have a combined valuation approaching 5% of the investable market capitalization of U.S. stocks, constituting a historic supply shock.
- Net equity supply has reversed from a contraction of roughly 1% per year (buybacks > issuance) to an expansion of roughly 5% per year (issuance > buybacks), a dramatic 6-percentage-point swing.
- Based on a 4x multiplier model, a 5% supply increase is expected to drag returns by approximately 20% over the next 12–18 months.
- Passive investing and benchmark constraints have left the market’s absorption capacity fragile: only about 30% of capital is used for opportunistic trading, far below the 75% seen in the 1980s.
- The author argues that the supply shock could depress the market before evidence of disappointing AI revenue becomes clear, mirroring the pattern in 2000 when new issuance crushed the market ahead of the internet bubble burst.
Supply Shock as a Potential Catalyst for the AI Bubble Burst
The author argues that the catalyst for the AI bubble burst is more likely to come from an increase in stock supply rather than weak demand. The nature of a bubble resembles a Ponzi scheme, requiring a continuous influx of new capital to sustain itself; an increase in supply is often the direct cause of a bubble's collapse. The author notes that historically, the British railway bubble burst due to overinvestment leading to a collapse in capital returns, while the 2000 internet bubble was crushed by a flood of new stock issuances before fundamentals deteriorated—"the bubble burst well before that became common knowledge." The author believes that the current market is even more sensitive to stock supply than in 2000, suggesting that a supply shock could trigger a correction before the negative effects of AI overinvestment become apparent.
Historical Data: Every 1% Increase in Supply Leads to an Approximate 4% Drop in Market Value
Data shows that for every 1% increase in IPO supply, the market value falls by an average of about 4% over the following year. Citing a historical regression analysis (controlling for valuation levels) in Exhibit 2, the author points out that IPOs as a percentage of market capitalization peaked at around 5% in 1999-2000, and "it doesn’t take much new supply to overwhelm the market." This relationship remains significant even after controlling for forward one-year earnings yields.
SpaceX Lockup Expiration to Release Approximately $2 Trillion in Supply
On June 12, 2027, the final tranche of approximately $2 trillion in SpaceX shares will be unlocked. The author believes that most non-Musk shareholders will choose to sell: employees need to repay mortgages or SpaceX-backed debt; foundations face cash constraints due to distribution restrictions; and endowments require liquidity. Buyers (such as Nasdaq 100 ETFs) would need to sell other liquid stocks to raise funds, while former SpaceX shareholders using cash for taxes, debt repayment, or new AI venture investments would not repurchase stocks, leading to a net increase in supply.
Passive Investing and Benchmark Constraints Weaken Market Absorption Capacity
Real-world investors are "constrained profit maximizers," not pure arbitrageurs. Even if a US equity fund manager believes European stocks or Argentine bonds are cheap, they cannot buy them if their mandate prohibits it; even if they believe US stocks are overvalued overall, they cannot significantly reduce their holdings. The author states: "She may hate certain benchmark-heavy assets while being forced to own them because of benchmark-relative position limits." This structure leaves the market without enough buyers to absorb new supply, preventing prices from quickly reverting to fundamentals after deviations.
Outlook: Supply Shock May Precede Deterioration in AI Demand
The author predicts that increased supply could depress the market before evidence of disappointing AI revenue becomes clear. The report acknowledges that ultimately, AI demand may fail to keep pace with supply, leading to disappointing returns on investment, but "much less has been written about why the stock market has become ever more sensitive to changes in supply and demand for shares." The author argues that a wave of equity supply over the coming quarters (potential IPOs from SpaceX, Anthropic, OpenAI, and secondary offerings from hyperscalers), combined with fragile market structure, could serve as the catalyst for the bubble's collapse.
New Arguments and Perspectives: Constraint-Driven Market Segmentation and Price Inelasticity
1. Deepening Market Segmentation: From Sectors to Styles
Paragraph 6 of the follow-up notes that even assets with no cash flows (e.g., cryptocurrencies) can accumulate significant value due to their "currency" label, hinting at the irrational basis of market pricing. However, more critically, paragraphs 7-8 reveal how institutional constraints exacerbate market segmentation. Data shows that as investment managers shift from cross-asset-class to intra-asset-class specialization (e.g., "growth tech" sectors), cross-industry comparisons have sharply declined. For instance, the pricing correlation between Microsoft and ExxonMobil has virtually disappeared in the eyes of specialized managers.
Comparative Data: Stock Correlation Divergence (Exhibit 3)
| Stock Similarity | Average Pairwise Correlation (Russell 3000 Proxy) | Explanation |
|---|---|---|
| Most Similar (Top Decile, Same Industry) | Significantly Rising (Clear Trend) | Pricing linkage among similar firms strengthens |
| Least Similar (Bottom Decile, Cross-Industry) | Near Zero (Stable Long-Term) | Pricing decoupling across industries |
This phenomenon indicates that constraint-driven specialization not only segments the market but also makes prices of similar assets more prone to synchronous movement, while price deviations across different assets become harder to correct. This contradicts the Efficient Market Hypothesis (EMH), which predicts that all information should be rapidly reflected in prices—in reality, information transmission is blocked by professional barriers.
2. Excessive Importance of Benchmarks: The Shrinking of Active Management Capital
Paragraphs 9-10 of the follow-up reveal the "irrational" influence of benchmarks. In the 1980s, about 80% of capital in US active equity funds was allocated to off-benchmark positions, but by 2025, this had fallen to 60%. More critically, passive investing's share surged from under 10% in 1980 to over 50% in 2025, leaving only about 30% of total market capital (i.e., "active capital") for opportunistic trading.
Comparative Data: Evolution of Active Capital Share
| Year | Active Fund Off-Benchmark Position Share | Passive Investment Share | Overall Market Opportunistic Capital Share |
|---|---|---|---|
| 1980 | ~80% | <10% | ~75% |
| 2025 | 60% | >50% | ~30% |
This shift means that even with significant price volatility, most holdings (held by passive funds and benchmark-constrained active funds) are not traded. Paragraph 11 further notes that academic research confirms this price inelasticity: exogenous demand shocks (e.g., index inclusions or forced fund liquidations) cause stock prices to change by an average of about 1% (corresponding to a 1% change in demand). While this seems comparable to the demand elasticity of ordinary goods (e.g., cars), stocks have hundreds of substitutes and should theoretically have much higher elasticity—actual data shows the market is far from the ideal state of "pure profit maximizers."
3. Amplification Effects of Cross-Asset-Class Flows
Paragraphs 12-17 of the follow-up shift to a broader perspective: the sensitivity of the entire US stock market to capital flows. As of May 2026, about 83% of funds (approximately $30 trillion) trade only US stocks, and only 3% of funds can adjust across asset classes. Meanwhile, asset allocation by ultimate asset owners (e.g., 401(k) accounts and sovereign wealth funds) is highly rigid: only about 10% of retirement accounts change their allocation annually, and the world's largest sovereign wealth fund (Norway's GPFG) has adjusted its equity target ratio only twice in the past 20 years (most recently in 2017, from 60% to 70%).
Key Estimate: Price Elasticity of the Stock Market to Flows
| Flow Direction | Price Impact (Within 12 Months) | Data Source |
|---|---|---|
| 1% Increase in Stock Supply | 4% Decline in Total Market Value | GMO Analysis Based on Predictable Non-Information Flows |
This elasticity (-4) is much higher than the -1 for individual stocks, reflecting the scarcity of cross-asset-class substitutes. Since very few investors are willing to increase equity allocations when prices fall (and US investor equity allocations are already at historical highs), flow shocks are amplified. This starkly contrasts with the assumption of "infinite supply elasticity" in traditional asset pricing models like CAPM.
4. Challenges to Traditional Theory
The empirical findings of the follow-up directly challenge the Efficient Market Hypothesis (EMH) and Rational Expectations Theory:
- EMH Failure: If markets were efficient, prices should be driven only by information, not non-informational flows. However, Exhibits 3 and 5 show that flow shocks (e.g., index inclusions) can significantly alter prices, with effects lasting over 12 months.
- Limits to Rational Arbitrage: Even when arbitrage opportunities exist, professional managers' benchmark constraints and style restrictions (e.g., a "growth tech" manager cannot trade energy stocks) prevent cross-industry arbitrage, allowing price deviations to persist.
- Behavioral Finance Supplement: The cryptocurrency mania mentioned in paragraph 6, and the phenomenon of "stable holdings but volatile prices" in paragraph 11, suggest that investor behavior (e.g., herding, anchoring) is amplified within a constrained framework.
5. Policy and Investment Implications
- For Regulators: The SEC's naming rules (e.g., "US stock funds" must hold 80% US stocks), while intended to protect investors, inadvertently exacerbate market segmentation. Future policies must balance transparency with market efficiency.
- For Investors: The shrinking of active management capital means "smart money" has less influence. Passive investors should be wary of benchmark concentration risk (e.g., the top 10 stocks in the S&P 500 account for over 30%). Flexibility in cross-asset allocation (as practiced by GMO) could become a scarce advantage.
- For Academia: The "frictionless" assumption in asset pricing models needs re-examination, incorporating constraint-driven price inelasticity as a key variable.
Summary
Through empirical data (Exhibits 3-5) and logical deduction, the follow-up systematically argues how institutional constraints lead to market segmentation, excessive benchmark importance, and price inelasticity. These findings not only challenge traditional financial theory but also offer new perspectives for understanding contemporary market anomalies (e.g., low volatility, high correlations). The next section will explore the long-term consequences of these constraints and potential mitigation paths.
This is an analysis of the follow-up to the "Introduction," continuing the previous style, supplementing new arguments, data, and perspectives without repeating previously analyzed content.
Core Thesis: Structural Reversal of Equity Supply and the Amplification Effect of Market Sensitivity
The core thesis of the follow-up is that the US stock market is undergoing a structural shift in equity supply, moving from a two-decade era of "net contraction" (buybacks > issuance) to an era of "net expansion" (issuance > buybacks). The scale of this reversal (nearly 5% annual net increase) and its speed, combined with the market's extremely high sensitivity to supply shocks (a 4x multiplier), form the core logic behind an approximate 20% downside pressure on returns over the next 12-18 months. This is not a simple cyclical fluctuation but a potential starting point for a "Ponzi feedback loop" that could trigger a bubble burst.
New Arguments and Data Support
1. Quantified Scale of Supply Shock:
- Mega IPO Cases: The article explicitly states that the potential total valuation of IPOs for SpaceX (non-Musk holdings), Anthropic, and OpenAI is close to 5% of the total investable market capitalization of the US stock market (OpenAI ~$1.5 trillion, Anthropic ~$2 trillion). This is an extraordinarily large single supply shock, far exceeding historical averages.
- Confirmation of Net Dilution: The article confirms that, except for a brief period during the Global Financial Crisis (GFC), the US stock market is experiencing net dilution for the first time in two decades. The core driver is the sustained capital expenditure frenzy by "hyperscalers" (e.g., Microsoft, Google, Amazon), leading to stock issuance exceeding buybacks.
- Reversal of Supply Growth Rate: From a historical annual supply contraction of about 1% (buybacks > issuance), the market is shifting to an annual supply growth of nearly 5% or more. This is a dramatic 6-percentage-point flip, representing a historic shock to market supply-demand balance.
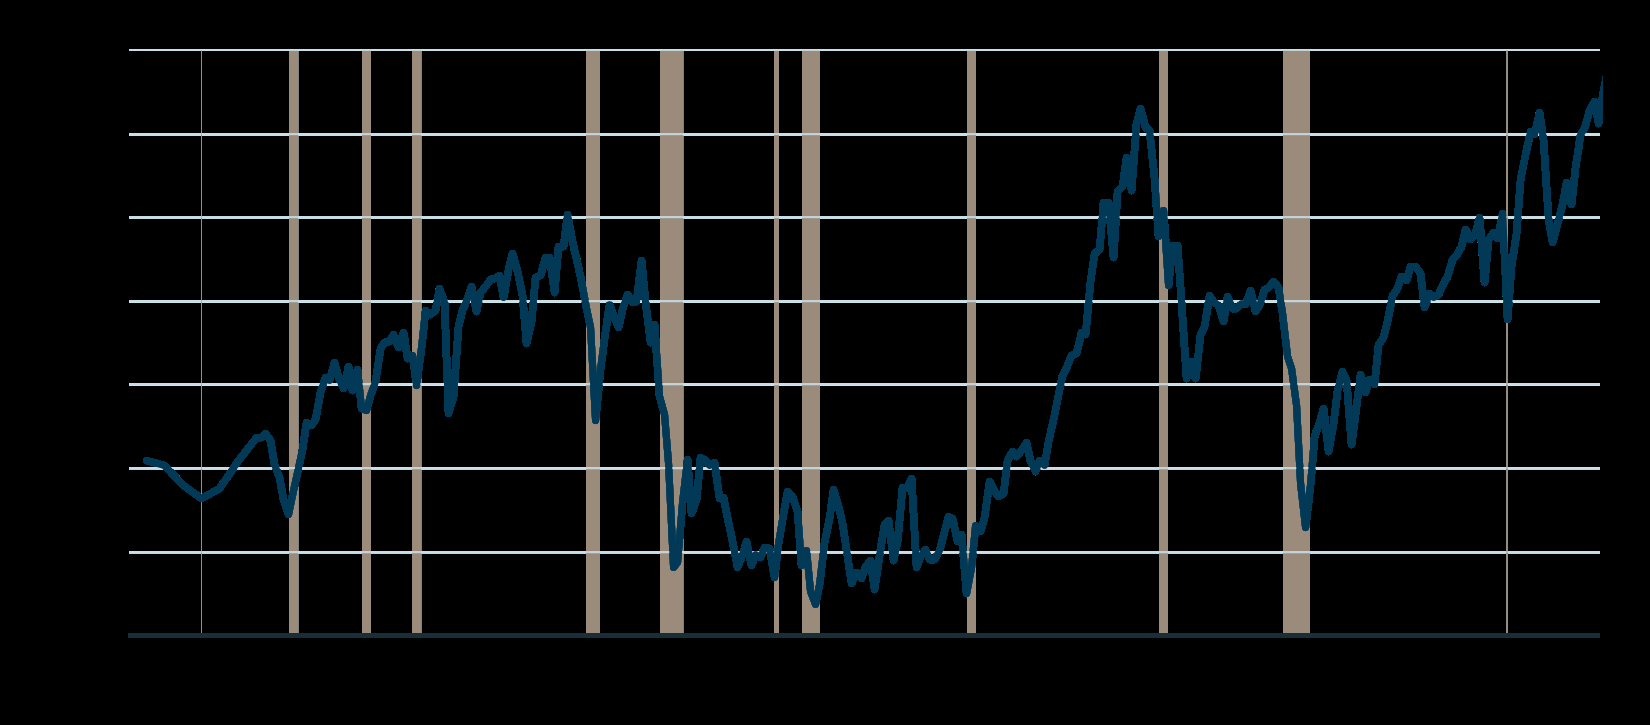
2. Empirical Evidence of Market Sensitivity and the Multiplier Effect:
- Multiplier Model: The article cites academic research by Gabaix and Koijen (2020), which sets the flow multiplier at approximately 5x. The author, based on their own mixed estimates of various quasi-exogenous flows, adopts a more conservative 4x multiplier.
- Return Impact Calculation: Based on the 4x multiplier, a 5% increase in supply implies a drag on returns of about 20% (5% * 4 = 20%). This means that even without considering valuation and earnings expectations, the supply shock alone is sufficient to reduce expected returns over the next 12-18 months (approximately 6% real return) by about 20%.
3. Historical Analogy and Risk Transmission Mechanism:
- Internet Bubble Analogy: The article draws a parallel to the internet bubble, noting that issuance (IPOs) also triggered the initial phase of the bear market then. However, the subsequent market crash (halving) was driven by high valuations and declining profit margins due to overinvestment. The author implies that the current market faces similar risks of high valuations and potential AI overinvestment, so a repeat of this scenario cannot be ruled out.
- Ponzi Feedback Loop: The article proposes a key risk transmission mechanism: if the market successfully absorbs the current supply (e.g., AI-themed IPOs are enthusiastically received), this will encourage more companies to list and raise capital (a "Ponzi feedback loop"). This new capital will primarily flow into AI infrastructure, ultimately leading to a decline in the return on investment (ROI) for the AI sector. When ROI disappoints, the bubble bursts. Because the market is highly sensitive to supply, prices may begin to fall before the market truly realizes the deterioration in ROI.
Comparative Data and Table Presentation
| Indicator | Historical/Baseline Scenario | Current/Predicted Scenario | Change Magnitude | Key Drivers |
|---|---|---|---|---|
| Annualized Change in Net Equity Supply | -1% (Net Contraction, Buybacks > Issuance) | +5% (Net Expansion, Issuance > Buybacks) | +6 percentage points | Hyperscaler CapEx, AI Company IPOs |
| Return Drag from Supply Shock | None (Contraction Provides Support) | -20% (Based on 4x Multiplier) | -20% | Supply Magnitude & Market Sensitivity |
| Market Sensitivity (Flow Multiplier) | ~1-2x (Historical Average) | ~4-5x (Current Academic & Empirical) | +2-3x | Leveraged ETFs, High-Leverage Hedge Funds, etc. |
| AI-Related IPO Total Valuation as % of Market Cap | None (or Very Low) | ~5% (OpenAI + Anthropic + SpaceX) | Significant Increase | Acceleration of AI Industry Capitalization |
New Perspectives and Conclusions
- Fundamental Shift in Risk/Reward Trade-off: The author emphasizes that this is not an arbitrage opportunity but a structural shift in the entire market's risk/reward trade-off. The supply shock is no longer a marginal factor but a core variable influencing future returns.
- Implications for Professional Investors: The article suggests that some professional investors (e.g., institutions using leveraged single-stock ETFs or high-leverage AI hedge funds) may have already recognized and exploited this high sensitivity, but they have no incentive to publicly explain their strategies. This explains why the topic has received "much less ink than it deserves" in public discussions.
- Limitations of the Conclusion: The author acknowledges that the above prediction is not inevitable. If demand can grow in tandem, the market might avoid a decline in the coming quarters. However, the logic of the "Ponzi feedback loop" implies that even if absorbed in the short term, long-term risks are accumulating and will eventually erupt more violently.
- Importance of Disclaimer: The disclaimer at the end of the article emphasizes the cut-off date for the views (September 2026) and potential market changes, reminding readers that this is not investment advice.
Summary
By introducing specific mega-IPO cases, quantifying the scale of the supply reversal, citing academic multiplier models for return impact calculations, and constructing the "Ponzi feedback loop" risk transmission mechanism, the follow-up elevates the theme of "equity supply" from a macro backdrop to the most central risk pricing factor in the current market. Its core conclusion is that the US stock market is facing a historic equity supply shock driven by AI capital expenditure and an IPO wave. Combined with the market's extremely high sensitivity to supply, this will impose a significant drag of approximately 20% on returns over the next 12-18 months and could serve as the trigger for a bubble burst.
Position Moves
| Ticker | Direction | Author's One-Sentence View | Key Data |
|---|---|---|---|
| SpaceX | Hold & Watch | The 2027 lock-up expiration will release approximately $2 trillion in supply, with most non-Musk shareholders expected to sell | Non-Musk stake valued at approximately $2 trillion |
| OpenAI | Hold & Watch | Potential IPO valuation is enormous, constituting one of the core sources of supply shock | Valuation approximately $1.5 trillion |
| Anthropic | Hold & Watch | Potential IPO valuation is enormous, constituting one of the core sources of supply shock | Valuation approximately $2 trillion |
| Microsoft | Hold & Watch | As one of the hyperscalers, sustained capital expenditure frenzy leads to share issuance exceeding buybacks | Belongs to the "hyperscaler" group |
| Hold & Watch | Same as above, capital expenditure drives net dilution | Belongs to the "hyperscaler" group | |
| Amazon | Hold & Watch | Same as above, capital expenditure drives net dilution | Belongs to the "hyperscaler" group |