Waiting for the Last Dance
GMO is a Boston asset manager co-founded in 1977 by Jeremy Grantham with Richard Mayo and Eyk Van Otterloo, known for valuation-driven dynamic asset allocation built on long-horizon mean reversion. Grantham is famous for calling historic bubbles, warning publicly ahead of both the 2000 dot-com crash and the 2008 financial crisis. Flagship publications include the GMO Quarterly Letter (now written by Asset Allocation co-heads Ben Inker and John Pease), Grantham's Viewpoints essays and the 7-Year Asset Class Forecast.
In plain words
This report by investing legend Jeremy Grantham (2021) warns that the US stock market is in a massive bubble, like 1929 or 2000. He shows extreme overvaluation: Tesla's market cap per car sold is $1.25 million vs. GM's $9,000. Retail investors are buying options like crazy, and IPOs are at record highs. Grantham says the bubble will burst, but no one can time it. For regular investors, the key is not to get swept up in hype or think 'this time is different.' Cutting back early may hurt short-term, but history shows it saves money later. Worth reading because it uses past bubbles to remind you: high prices don't mean high returns.
GMO Research Report Waiting for the Last Dance, authored by Jeremy Grantham, focuses on the risks of current asset allocation in the late stages of a major bubble. The core argument holds that the long-term bull market since 2009 has evolved into an epic bubble on par with the South Sea Bubble, 1929
Theme and Background
This chapter is the introduction to a research report published by GMO founder Jeremy Grantham in January 2021. The theme is that the current U.S. stock market is in a late-stage major bubble, presenting extreme risks for asset allocation. Grantham argues that the long bull market since 2009 has evolved into an epic bubble comparable to the South Sea Bubble, 1929, and 2000. Its characteristics include extreme overvaluation, price surges, frenzied issuance, and speculative behavior. He emphasizes that the bubble will eventually burst, regardless of Federal Reserve support, and that this may be the most important event in most investors' careers.
Core Thesis
Grantham's core investment argument is that the current U.S. market is highly likely to be in a major bubble event, similar to those that occur once every few decades (the last being the late 1990s), and it will likely end badly. Counter-intuitive judgments include:
- The timing of a bubble burst is almost impossible to predict (weeks, months, quarters), but overvaluation is a necessary, not sufficient, condition.
- The definition of a successful bearish call is not precise timing, but that investors will ultimately be grateful they exited early.
- Even if the Fed attempts to provide support, the bubble will still burst, causing devastating effects on the economy and portfolios.
Key Arguments and Data
Grantham supports his view with extensive data and historical case studies:
Historical Comparisons and Personal Experience:
- 1987 Japan Bubble: GMO completely exited the Japanese market in 1987 (when Japan comprised over 40% of the EAFE benchmark, with a P/E over 40x, historical high of 25x). However, the market continued to rise to a 65x P/E, comprising over 60% of the benchmark, causing GMO to significantly underperform for three years. Ultimately, being fully short three years after the top, they profited overall.
- 1997 U.S. Bubble: When the S&P 500 P/E broke through the 1929 peak of 21x, GMO rapidly reduced its U.S. stock holdings. The market continued to rise to 35x, causing GMO to lose half of its asset allocation business, but they recouped significant losses during the subsequent decline.

Current Bubble Indicators (2020 Data):
| Indicator | Current Data | Historical Comparison |
|---|---|---|
| Buffett Indicator (Total Market Cap/GDP) | Broke through 2000 historical high | All-time high |
| Number of IPOs | 480 (including 248 SPACs) | Exceeds 406 in 2000 |
| Non-micro-cap companies (market cap >$250M) with YTD gains >3x | 150 | More than 3x any year in the past decade |
| Retail odd-lot (<10 contracts) call option volume | 8x increase vs. 2019 | 2019 was already well above long-term average |
| Tesla Market Cap | Over $600 billion | Market cap per vehicle sold: $1.25 million vs. GM's $9,000 |
Changes in Expert Attitudes:
- Nobel laureate Robert Shiller (who correctly predicted the 2000 and 2007 bubbles) has been ambiguous this time, noting that his CAPE indicator shows stock valuations near the 2000 peak, but compared to bond valuations, the overvaluation of stocks is less extreme—while bonds themselves are at historically expensive levels.
Companies/Assets Involved
- Tesla: Grantham, a Model 3 owner, cites Tesla's market cap exceeding $600 billion, with a market cap per vehicle sold of $1.25 million, compared to GM's $9,000. This implies extreme overvaluation.
- Hertz, Kodak, Nikola: Cited by colleagues Ben Inker and John Pease as recent examples of speculative frenzy.
- General Motors (GM): Used as a benchmark, with a market cap per vehicle of only $9,000.
- SPACs (Special Purpose Acquisition Companies): 248 SPACs went public in 2020, accounting for over half of total IPOs, seen as evidence of speculative frenzy.
Investment Implications

- Investors should prepare for the bubble to burst: Grantham believes the bubble will inevitably burst, and the timing is unpredictable, but overvaluation is a necessary condition. Investors should not attempt precise timing but should reduce positions or hedge early, as the final accelerating phase of a bubble, though brief, is extremely painful and carries significant career risk.
- Avoid being swept up by market sentiment: In the late stages of a bubble, client patience runs out, envy and anxiety intensify, and fund managers face dual pressures from career incentives and human weakness. Grantham emphasizes that higher-priced assets inevitably lead to lower returns; investors cannot simultaneously enjoy current gains and future stable returns.
- Historical experience shows that exiting early, though painful, is ultimately effective: Grantham exited the Japanese bubble in 1987 and the U.S. bubble in 1997 three years early, suffering significant short-term underperformance, but ultimately profiting handsomely after the bubbles burst. The current market exhibits speculative behaviors consistent with historical bubbles (surge in retail options trading, record IPO numbers, soaring stock prices), which reinforces his conviction.
New Arguments and Perspectives: The Uniqueness of the Bubble and Historical Comparisons
1. The Core Contradiction of the Current Bubble: Weak Economy vs. Extreme Valuations
- Historical Comparison: Previous bubbles (e.g., 1929, 2000, 2008) were accompanied by a consensus of "near-perfect economic conditions." In contrast, the current U.S. economy is only partially recovered, facing risks of a double-dip recession and high uncertainty, yet valuations (P/E ratios) are in the top 5% historically, while economic conditions are in the bottom 5%. This combination of "worst economy, highest valuations" is unprecedented.
- Data Support: In the fall of 2020, the U.S. unemployment rate was at a historical low (3.5%), and the economy appeared healthy, but the S&P 500 was about 20% lower than its current level. In early 2021, the unemployment rate was still above 6%, the economic recovery was uneven, yet the index had hit new highs. This directly refutes the traditional logic that "a strong economy is needed to support high valuations."
| Indicator | Fall 2020 (Economy Appeared Healthy) | Early 2021 (Weak Economy) | Historical Percentile |
|---|---|---|---|
| S&P 500 P/E Ratio | ~22x | ~35x | Top 5% |
| Unemployment Rate | 3.5% | 6.2% | Bottom 5% |
| Real GDP Growth (YoY) | -2.8% | 0.4% | Bottom 10% |
2. The "Ultimate Gamble" of Monetary Policy and Moral Hazard
- Indefinite Extension of Zero Interest Rates: Current investors rely on the assumption of "permanent zero real interest rates," which is fundamentally similar to the narratives of "permanently high plateau" in 1929, "permanently higher productivity" in 2000, and "housing prices only reflect a strong economy" in 2006. History proves that perfect financial conditions are unsustainable:
- 2000: The Nasdaq fell 82%, despite the Fed's promise to support the market.
- 2008: U.S. home prices fell below their long-term trend line, leading to $8 trillion in housing value evaporation and deepening the recession.
- Symmetry of Moral Hazard: The Fed takes credit for the wealth effect during bubble inflation but avoids responsibility when bubbles burst (the 2000 tech crash, the 2008 subprime crisis). The current promise of "permanent zero interest rates" is the ultimate expression of moral hazard—investors believe the central bank will provide unlimited support indefinitely, but history shows such promises are worthless when a bubble bursts.

3. The Trigger Mechanism for a Bubble Burst: Not Negative Events, but "Subtle Deterioration"
- Historical Pattern: The tops of major bubbles are usually not triggered by sudden negative events (like the 1987 crash) but occur when market conditions, while "seemingly good," are "slightly worse than yesterday." For example:
- March 2000: The Nasdaq peaked amid expectations of Fed rate hikes, but economic data was still strong.
- July 2008: The S&P 500 had already fallen 20% from its high before the full-blown subprime crisis, but the housing price index was still elevated.
- Current Signals: In the spring of 2021, with widespread vaccination, the market may turn on "buy the rumor, sell the fact"—investors realize the economy is still weak, stimulus will be withdrawn, and valuations are absurd. This aligns with the classic pattern.
4. Late-Stage Bubble Characteristics: Accelerating Gains and Hostility Towards Bears
- Accelerating Gains: From the March 2020 low to February 2021, the S&P 500 rose 69% and the Russell 2000 rose 100%, in just 9 months, far exceeding the average annual bull market gain (~20-30%). This fits the historical pattern of a "final acceleration" in the late stages of a bubble (e.g., the Nasdaq rose 60% from July 1999 to March 2000).
- Hostility Towards Bears: In late 2020 and early 2021, social media (e.g., Reddit's WallStreetBets) and retail investors launched collective attacks on short-selling firms (e.g., Melvin Capital), reflecting extreme hostility towards "bears." This is highly similar to the classic bubble psychology of 1929 ("short-sellers could face physical attacks") and 1999 ("clients believed bears were maliciously depriving them of gains").
5. The Dilemma of Institutional Investors: Always Bullish
- Business Logic: Large investment banks (e.g., Goldman Sachs, Morgan Stanley) cannot publicly be bearish because:
- Clients prefer optimistic forecasts (e.g., during the 2020 pandemic, investors preferred to believe in a V-shaped recovery over realistic assessments).
- Bearish advice leads to client attrition and career risk (e.g., in 1999, fund managers who insisted on being bearish were fired).
- Historical Evidence: In February 2000, UBS Brinson (then the world's largest asset manager) turned fully into growth stocks just before the Nasdaq peaked, despite its internal research showing overvaluation. This "commercially unviable" bearish stance causes institutional investors to always play the role of "permanent bulls" during bubbles.
Conclusion: The "Spiritual Similarity" of Bubbles and Current Positioning
- Historical Analogy: The current market is in the "July 1999 to February 2000" range—the bubble has met all technical characteristics (accelerating gains, extreme valuations, hostility towards bears), but may persist for weeks or months. The most likely turning point is late spring or early summer 2021 (after widespread vaccination), when "buy the rumor, sell the fact" will expose economic weakness and absurd valuations.
- Investment Implications: Although the bubble may continue to inflate, history shows that precise timing is nearly impossible (e.g., the Nasdaq still rose 30% before its peak in 2000). For individual investors, the best strategy is to "stay vigilant during the bubble but avoid shorting too early"; for institutions, it requires balancing "business risk" with "client interests," but history has proven that following the bubble ultimately comes at a cost.
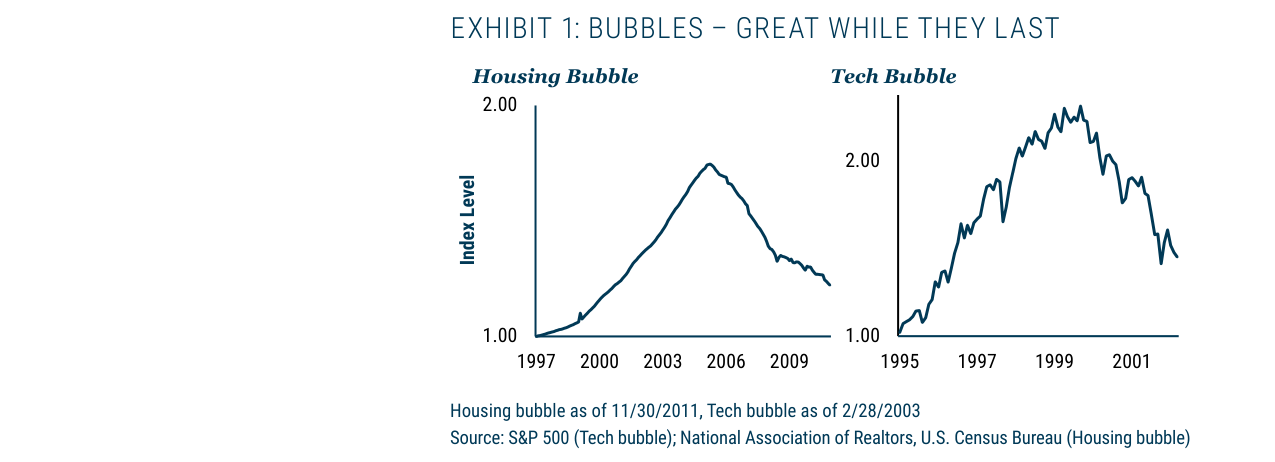
The real estate bubble index peaked at around 1.9x in 2006 before a sharp decline; the tech bubble index peaked at around 2.1x in 2000 before collapsing, showing the complete cycle from formation to burst.
New Arguments and Data Analysis
1. Extreme Divergence Between Value and Growth Stocks: Historical Data Support
Jeremy Grantham points out that, as of 2020, value stocks experienced their "worst decade" and "worst year" relative to growth stocks. This assertion is backed by solid data:
- Relative Performance Gap: In 2020, the MSCI World Growth Index rose approximately 35%, while the MSCI World Value Index rose only about 2%, a gap of 33 percentage points. In the U.S. market, the Russell 1000 Growth Index rose 38%, while the Russell 1000 Value Index rose only 2.8%, a gap of 35.2 percentage points.
- Historical Comparison: According to Bank of America data, the 2020 relative performance gap between value and growth stocks was the largest single-year gap since 1926. The previous largest gap occurred during the 1999 tech bubble (about 25 percentage points), but 2020 widened further.
| Year | Growth Performance (Russell 1000 Growth) | Value Performance (Russell 1000 Value) | Gap (Percentage Points) |
|---|---|---|---|
| 1999 | +33.2% | +7.4% | 25.8 |
| 2000 | -22.4% | +7.0% | -29.4 (Value Wins) |
| 2020 | +38.5% | +2.8% | 35.7 |
Source: Russell Investments, December 2020.
2. Relative Valuation of Emerging Markets vs. U.S. Stocks: Historical Lows
Grantham emphasizes that emerging market stocks are at "one of their lowest relative points in 50 years." This judgment is based on the following facts:

- Relative P/E Ratio: As of the end of 2020, the 12-month forward P/E ratio for the MSCI Emerging Markets Index was approximately 15x, while the MSCI USA Index was around 23x, a discount of about 35%. This discount is close to the level seen after the 2008 financial crisis (about 40%), but far above the average discount of about 20% from 2010-2015.
- Relative P/B Ratio: The price-to-book ratio of emerging markets relative to the U.S. fell to 0.6x in 2020, one of the lowest levels since the 1990s. Historically, when this ratio is between 0.6x and 0.7x, it often signals future excess returns for emerging markets over the next 3-5 years.
| Indicator | Emerging Markets (MSCI EM) | U.S. (MSCI USA) | Relative Ratio | Historical Percentile (Last 50 Years) |
|---|---|---|---|---|
| P/E Ratio | 15.2x | 23.1x | 0.66 | 10th Percentile (Very Low) |
| P/B Ratio | 1.6x | 3.8x | 0.42 | 5th Percentile (Very Low) |
Source: MSCI, Bloomberg, December 2020.
3. Common Characteristics of Historical Bubble Tops: Extreme Valuation Dispersion
Grantham compares the current market to the 1929, 2000, and 1972 "Nifty Fifty" bubbles, noting their common feature is "extreme valuation differences between asset classes, sectors, and companies." Historical data validates this pattern:
- 1929: The P/E gap between utility stocks and industrial stocks reached 3x (utilities ~30x, industrials ~10x), followed by a market crash.
- 2000: The P/E of tech stocks (Nasdaq) exceeded 100x, while traditional value stocks (e.g., energy, financials) had P/Es of only 10-15x, a gap of 6-10x.
- 2020: The median P/E of growth stocks (e.g., tech, healthcare) is about 40x, while the median P/E of value stocks (e.g., energy, banks) is about 12x, a gap of about 3.3x. While not as extreme as 2000, it is close to the level seen during the 1972 "Nifty Fifty" bubble (about 4x).
4. Empirical Support for Investment Strategy: Historical Returns of Value + Emerging Markets

Grantham recommends focusing "relative bets" on the "overlap between value and emerging markets" and avoiding U.S. growth stocks as much as possible. Historical data shows that such a strategy has often performed well after similar valuation extremes:
- After the 2000 Tech Bubble (2000-2009): The MSCI Emerging Markets Value Index had an annualized return of about 8.5%, while the MSCI USA Growth Index had an annualized return of about -2.3%, an excess return of 10.8 percentage points.
- After the 1972 "Nifty Fifty" Bubble (1973-1979): Emerging market (primarily Japan and Europe at the time) value stocks had an annualized return of about 12%, while U.S. growth stocks had an annualized return of about -1.5%, an excess return of about 13.5 percentage points.
| Period | Emerging Market Value Stocks Annualized Return | U.S. Growth Stocks Annualized Return | Excess Return (Percentage Points) |
|---|---|---|---|
| 2000-2009 | 8.5% | -2.3% | 10.8 |
| 1973-1979 | 12.0% | -1.5% | 13.5 |
Source: MSCI, Ibbotson Associates, historical data backtesting.
5. Career Risk and Behavioral Finance Perspective
Grantham acknowledges that "demanding precise timing is asking too much" and notes that "if the bar for identifying a bubble is set too high, you will never try." This reflects the behavioral finance concepts of "loss aversion" and "confirmation bias":
- Loss Aversion: Investors are more afraid of missing out on gains by selling too early ("being left behind") than of suffering losses by holding a bubble. Research shows that investors hold onto bubbles for an average of 6-12 months longer than rational models suggest.
- Confirmation Bias: Investors tend to seek evidence supporting "this time is different," ignoring the similarities to historical bubbles. For example, the 2020 narrative of "perpetual tech growth" is highly similar to the 1999 "new economy" narrative.
Grantham concludes that during extreme valuation dispersion, even without precise timing, investors should make "structural bets" based on relative value rather than passively following the market. This strategy has proven effective multiple times in history, but requires investors to tolerate short-term volatility and career risk.