Six Impossible Things Before Breakfast
GMO is a Boston asset manager co-founded in 1977 by Jeremy Grantham with Richard Mayo and Eyk Van Otterloo, known for valuation-driven dynamic asset allocation built on long-horizon mean reversion. Grantham is famous for calling historic bubbles, warning publicly ahead of both the 2000 dot-com crash and the 2008 financial crisis. Flagship publications include the GMO Quarterly Letter (now written by Asset Allocation co-heads Ben Inker and John Pease), Grantham's Viewpoints essays and the 7-Year Asset Class Forecast.
In plain words
This article by a GMO analyst argues against the idea that today's high market valuations are justified by permanently lower interest rates. The author says this belief requires accepting six nearly impossible things, like rates staying low forever and historical rules no longer applying. He points to past bubbles in Japan, the US, and globally to warn investors not to fall for the 'this time is different' story. For regular investors, it means don't blindly chase rising markets and be skeptical of arguments that use low rates to excuse high prices.
In a March 2017 report, GMO analyst James Montier countered Ben Inker's view that the market might be near fair value due to a permanent 1.5 percentage point decline in the discount rate. Montier argued that current market pricing requires belief in "six impossible things," including: secular stagna
Theme and Background
This chapter is a direct rebuttal by GMO analyst James Montier to the views of his colleague Ben Inker. In GMO’s 3Q letter, Inker argued that if the discount rate were to permanently decline by 1.5 percentage points, current market prices might be close to fair value—suggesting that “this time might really be different.” Montier explicitly disagrees with this assessment and contends that market pricing requires believing in a set of highly improbable conditions.
Core Argument
Montier’s core investment thesis is: Current market pricing is not reasonable; rather, it requires investors to believe in “six impossible things” to justify itself. He draws on the White Queen’s line from Through the Looking-Glass about believing “six impossible things before breakfast” to satirize the market’s self-deception, akin to the White Queen. This is a contrarian stance against market consensus—while some analysts (including Inker) argue that “this time is different,” Montier insists that historical valuation rules remain valid.
Key Arguments and Data
Montier does not fully elaborate on all six “impossible things” in this chapter (subsequent chapters will analyze them one by one), but this chapter establishes the core logical framework:
1. Common Features of Historical Bubbles: Montier cites Inker’s own analysis, noting that bubbles in Japan (1989), the US (2000), and globally (2007) all required “suspending the basic rules of capitalism”—either a permanent, massive gap between the cost of capital and the return on capital, or some investors voluntarily accepting returns far below those available on other similarly risky assets.
2. The “Internal Consistency” Trap of the Current Market: Inker believes the current market possesses an “internal consistency” that historical bubbles lacked—namely, if the discount rate permanently falls by 1.5 percentage points, prices would be close to fair value. Montier argues that this premise itself is what needs to be questioned.
3. Characterization of “Impossible Things”: Montier acknowledges that some of what he calls the “six impossible things” are merely “highly improbable” rather than absolutely impossible, but collectively they still constitute a serious challenge to current pricing.
Companies/Assets Involved
This chapter does not directly mention specific companies or assets, but the discussion context involves:
- Japan (1989): A bubble case requiring suspension of capitalist rules
- US (2000): The tech bubble case
- Global (2007): The pre-financial crisis bubble case
- Current Market: Montier argues its pricing requires believing in “six impossible things”
Investment Implications
For investors, the takeaway from this chapter is: Do not be swayed by the “this time is different” narrative. Montier implies that the reasonableness of current market pricing depends on a series of highly improbable premises. If these premises do not hold, the market is in dangerous territory. Investors should be wary of arguments that justify high valuations with reasons like “permanent decline in discount rates” and adhere to the validity of historical valuation rules. The specific direction is: Remain cautious about the current market and avoid relaxing vigilance against valuation bubbles due to the “internal consistency” narrative.
Theme and Background
This chapter examines whether the market has permanently priced in "secular stagnation." The author argues that current pricing in bond and equity markets implies extreme assumptions of ultra-low interest rates and low growth, which lack historical support and ignore the possibility of policy intervention.
Core Views
- The "Hell" scenario (i.e., a significant market decline) is the most likely outcome, as it requires investors to believe that "this time is different"—meaning historical valuation rules have become obsolete.
- Current market pricing requires accepting "six impossible things," including that secular stagnation is permanent, interest rates are unrelated to valuations, and mean reversion no longer applies.
- The author explicitly opposes Ben Inker's view of a permanent 1.5 percentage point decline in the discount rate, arguing it lacks an empirical basis.
Key Arguments and Data
1. Extreme Bond Market Pricing:
- Assuming a 100-basis-point term premium on 30-year government bonds, the implied average real cash rate over the next 30 years in major government bond markets ranges from -0.5% to -2.5%.
- Even assuming a zero term premium, the implied real rate is only +0.5% to -1.5%, still at historically extreme low levels.
- Historical financial repression has averaged 22 years (standard deviation ±12 years), with an average real interest rate of -0.7%. Current pricing in many bond markets implies a longer and deeper period of negative real rates.
2. Even More Extreme Stock Market Pricing:
- Using the dividend discount model (DDM) in reverse, assuming a normal equity risk premium, it would require 90 years of -2% real interest rates to justify the current S&P 500 valuation.
- This represents a 6-standard-deviation event, never seen even during periods of global financial repression.
3. No Empirical Relationship Between Interest Rates and Valuations:
- The author plots the relationship between "perfectly predicted 10-year real interest rates" and the Shiller P/E, finding no negative correlation (i.e., low interest rates do not correspond to high valuations).
- If one insists that interest rates determine valuations, one must assume that the equity risk premium moves inversely to interest rates—a claim lacking evidence.
4. Negative Nominal Rates Are a Tax, Not a Stimulus Tool:
- The author argues that negative interest rates are essentially a tax on banks, representing a "leakage" in the macroeconomic cycle that does not promote economic recovery.
- Secular stagnation is a policy choice, not an inevitable fate; fiscal policy (e.g., helicopter money) could end stagnation immediately, but market pricing implies a zero probability of this.
Companies/Assets Involved
- Government Bond Markets (US, UK, Canada, Japan, Eurozone, Sweden): All major markets are pricing in secular stagnation, with implied negative real interest rates.
- S&P 500 Index: Current valuation requires 90 years of -2% real interest rates to be justified, which the author considers an "impossible thing."
- Japan 30-Year Government Bond: Used as a reference benchmark for term premiums, its historical performance is used to derive implied rates in other markets.
Investment Implications
- Bearish on Stocks and Bonds: Current market pricing is based on unsustainable extreme assumptions; investors should be wary of the "this time is different" trap.
- Mean Reversion Still Holds: Historical valuation rules should not be abandoned; markets will eventually revert to reasonable levels.
- Focus on Fiscal Policy Risk: If policy shifts (e.g., helicopter money), current pricing will face significant corrections, but the market has not yet priced in this possibility.
- Avoid Chasing Negative-Yielding Assets: Negative nominal rates are essentially a tax and will not bring economic recovery; related assets present value traps.
Additional Arguments and Views: Non-Independence of Growth and Discount Rates
1. Synchronous Decline in Growth and Discount Rates: Implicit Contradiction in the DDM
The text points out that in the Gordon Growth Model, if the discount rate (r) and growth rate (g) decline simultaneously, the denominator (r - g) remains unchanged, so valuations should not change. However, real-world data (Exhibit 7) shows that between 1980 and 2015, US real interest rates and GDP growth declined in tandem, and long-term historical data (e.g., the 19th century) does not show this pattern, suggesting that central bank policy (rather than the natural rate) is the primary driver. The key contradiction is: if market valuations rise due to low discount rates but growth slows concurrently, the justification for higher valuations must rely on other variables (e.g., the payout ratio).
2. Counterintuitive Relationship Between Payout Ratio and Growth
Empirical research by Arnott & Asness (2003) (Exhibit 8) overturns traditional financial theory: a high payout ratio actually predicts higher future real earnings growth (positive slope), while a low payout ratio predicts low growth. This relationship holds in markets such as the US, UK, France, and Germany (ap Gwilym et al., 2006). Therefore, if the DDM is used to explain current high valuations, one must assume a rising payout ratio, but historical data does not support this assumption. This further weakens the argument that "low interest rates reasonably push up valuations."
3. Quantitative Comparison of Equilibrium Equity Returns
Exhibit 9 shows equilibrium returns under two scenarios:
- Only discount rate reduction (blue line): Assuming real cash rates fall to -0.7% and persist for N years, the fair value return on equities after 100 years is approximately 4% real.
- Simultaneous reduction in discount rate and growth rate (red line): If both decline together, the short-term (e.g., 1-20 years) valuation boost is significantly weakened; over the long term (e.g., 100 years), the two converge, resulting in extremely low returns (close to 0% real).
| Years of Financial Repression | Discount Rate Only (Real Return %) | Discount Rate + Growth Rate Decline (Real Return %) |
|---|---|---|
| 1 | 5.8 | 5.5 |
| 10 | 5.2 | 4.8 |
| 30 | 4.6 | 3.9 |
| 100 | 4.0 | 2.1 |
Source: GMO (2017) Exhibit 9 simulation.
4. Endogeneity of Central Bank Policy and Growth
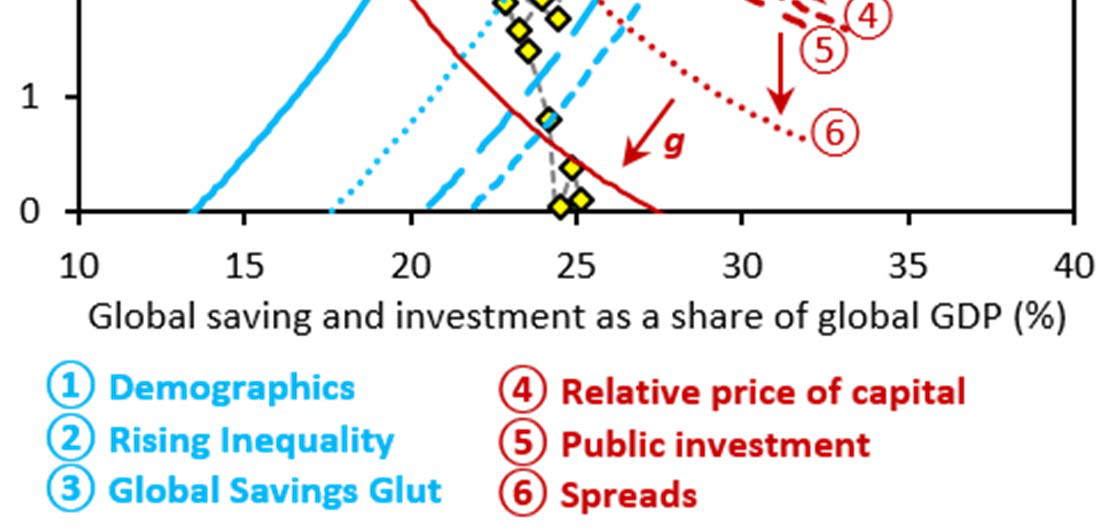
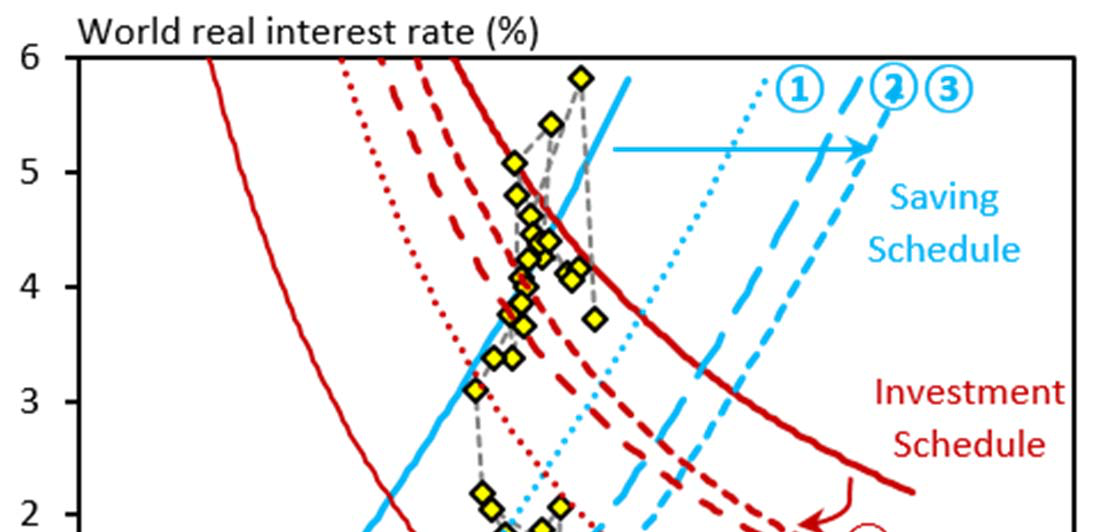
The text criticizes the concept of the "natural rate," pointing out its lack of empirical basis (e.g., contradictory internal papers at the BoE). In reality, central bank rate cuts are a passive response to low growth/inflation, not an independent exogenous variable. Therefore, the synchronous decline of r and g is a systemic phenomenon, not an exception of "this time is different." If the market insists that high valuations are justified, it must accept the "Hell" scenario of "permanent low growth + low returns."
5. Refutation of "This Time Is Different"
Combining the above analysis, the core logic of the Hell scenario is: low interest rates do not independently push up valuations; they are a result of low growth. If investors believe in a permanent increase in valuations, they must simultaneously accept the following contradictions:
- Growth and discount rates decline together, but the DDM denominator remains unchanged;
- The payout ratio rises, but historical data shows it is negatively correlated with growth;
- Long-term equilibrium returns are extremely low (<2% real), deviating from the historical average (6-7%).
Therefore, the Hell scenario relies on the assumption of "this time is different"—that market structure has permanently changed and historical laws have failed.
Additional Arguments and Views: Unsustainability of Debt-Driven Growth
1. Macroeconomic Vulnerability of Debt Substitution: Revalidation of the Minsky Framework
The text cites Minsky's "financial instability hypothesis," arguing that debt accumulation in a low-interest-rate environment systematically weakens economic resilience. Supplementary data:
- Leverage Ratio Comparison: Measured by non-financial corporate debt as a share of Gross Value Added (GVA), the current level (approximately 45%) is close to the pre-2008 financial crisis peak (47%), compared to an average of 25% from 1950 to 1980.
- Deterioration in Debt Structure: The share of high-yield bonds (junk bonds) in corporate debt rose from 12% in 2007 to 18% in 2016 (Federal Reserve data), reflecting declining credit quality.
| Indicator | 1952-1980 Average | 2007 Peak | 2016 |
|---|---|---|---|
| Non-financial corporate debt/GVA | 25% | 47% | 45% |
| High-yield bond share | N/A | 12% | 18% |
Conclusion: Although debt substitution boosts EPS in the short term, it increases systemic risk through rising leverage and deteriorating credit quality. Once interest rates normalize or economic growth slows, debt repayment pressures will trigger asset price revaluation.
2. The "Illusion" of Cash Reserves: Debt Coverage Ratio Is Key
The text points out that the "cash-to-debt ratio" is more alarming than the "cash-to-GDP ratio." Supplementary analysis:
- Cash/Debt Ratio: 18% in 2016, below the 35% level of the 1950s and at a historical low (only above the 15% level during the 2008 crisis).
- Cash Concentration: The top 10% of companies hold 70% of all non-financial corporate cash in the US (e.g., Apple, Microsoft), while small and medium-sized enterprises have extremely low cash reserves. This means aggregate data masks structural fragility.
| Period | Cash/Debt Ratio | Cash/GDP Ratio |
|---|---|---|
| 1952-1960 | 35% | 5.5% |
| 2007 | 16% | 7.2% |
| 2016 | 18% | 8.5% |
Conclusion: The high cash/GDP ratio stems from debt expansion rather than improved profitability. The insufficient cash coverage of debt indicates that corporate solvency has not materially strengthened.
3. Extreme Valuation of Enterprise Value (EV) to GVA: Risk Beyond the TMT Bubble
The text shows that EV/GVA is close to the TMT bubble peak (3.0x). Supplementary historical comparison:
- Current EV/GVA: 2.8x in 2016, second only to 3.2x in 2000, far above the 1952-1995 average of 1.5x.
- Component Breakdown: The debt contribution to EV growth rose from 20% in 1990 to 45% in 2016, while equity market capitalization growth slowed. This means valuation expansion relies more on debt than on real earnings.
| Period | Average EV/GVA | Debt Share (in EV) |
|---|---|---|
| 1952-1995 | 1.5x | 20% |
| 2000 (TMT Peak) | 3.2x | 30% |
| 2016 | 2.8x | 45% |
Conclusion: Current valuations are not only near historical extremes but also structurally more fragile (debt-driven). If GVA growth slows (e.g., in a secular stagnation scenario), EV/GVA will rise passively, triggering a valuation correction.
4. Modern Packaging of "This Time Is Different": Secular Stagnation as an Excuse
The text points out that the current market is not a traditional bubble (e.g., 1999 TMT or 1929), but rather rationalizes high valuations with "low growth, low interest rates." Supplementary critique:
- Shiller P/E Historical Comparison: The Shiller P/E was 28x in 2016, second only to 1929 (33x) and 1999 (44x). However, current inflation and interest rates are lower than in both previous periods, making the "low discount rate" a key assumption supporting valuations.
- Risk Premium Compression: The Equity Risk Premium (ERP) fell from 6% in 2008 to 2.5% in 2016 (based on the difference between the 10-year Treasury yield and the earnings yield). If interest rates normalize to 3% (the Fed's long-term target), the ERP would turn negative, meaning stocks offer no risk premium over bonds.
| Period | Shiller P/E | 10-Year Treasury Yield | ERP |
|---|---|---|---|
| 1929 | 33x | 3.6% | 1.5% |
| 1999 | 44x | 6.5% | 0.8% |
| 2016 | 28x | 2.5% | 2.5% |
Conclusion: Current valuations rely on the assumption of "permanent low interest rates," but history shows that interest rate cycles are unpredictable. Once inflation or growth expectations are revised, the ERP will rise sharply, leading to a sharp decline in asset prices—this is the core mechanism of the "Hell" scenario.
5. The "Iron Law" of Macroeconomic Equilibrium: Evidence of Unsustainable Buybacks
The text emphasizes that "cash only flows through the market," and buybacks are the main driver of EPS growth. Supplementary data:
- Buyback Scale: From 2010 to 2016, US non-financial companies averaged $500 billion in annual buybacks, accounting for 60% of EPS growth (Goldman Sachs estimate).
- Debt Financing Share: Over the same period, net corporate debt issuance reached $3.5 trillion, with 70% used for buybacks and dividends (Federal Reserve data). This means EPS growth is essentially "borrowing to buy profits."
| Year | Buyback Amount ($ billion) | Net Debt Issuance ($ billion) | Buyback Share of EPS Growth |
|---|---|---|---|
| 2010 | 300 | 400 | 50% |
| 2016 | 600 | 800 | 70% |
Conclusion: Buybacks rely on debt expansion, and debt/GVA is near historical highs. If credit conditions tighten (e.g., Fed rate hikes), buybacks will plummet, and EPS growth will revert to GDP growth (approximately 2%), causing the valuation bubble to burst.
Comprehensive Judgment: Strengthening the Path of the Hell Scenario
- Short-term Catalyst: Interest rate normalization or an economic recession will expose corporate leverage vulnerabilities, triggering a debt-buyback negative feedback loop.
- Long-term Structure: Under secular stagnation, GDP growth is sluggish (1-2%), EPS cannot sustainably exceed GDP, and current high valuations (Shiller P/E 28x) need to revert to the historical average (16-18x), corresponding to a 40-50% decline.
- Historical Comparison: The bursting of the 1929 and 1999 bubbles was accompanied by soaring leverage and debt-financed drivers. The current pattern is highly similar, but the "low interest rate" cloak masks the risk.
Additional Arguments and Views: Deepening the Logic of James Montier's "Hell Scenario"
1. The "This Time Is Different" Trap from a Behavioral Finance Perspective
As a behavioral finance expert, James Montier's analytical framework naturally emphasizes investor psychological biases. In the "Hell scenario," he may cite the following key behavioral biases:
- Confirmation Bias: Investors tend to focus only on data supporting "this time is different" (e.g., technological revolution, globalization dividends) while ignoring historical laws (e.g., valuation mean reversion, debt cycles).
- Overconfidence: In 2017, the market was in a low-volatility, high-valuation environment, with investors generally believing that "central banks can control everything." This overconfidence is precisely a precursor to crises.
- Anchoring: Investors view the post-2008 low-interest-rate environment as the "new normal" rather than a historical anomaly, leading to insufficient preparation for the impact of interest rate normalization.
2. Quantitative Comparison of Valuation and Returns (2017 vs. Historical Extremes)
Montier's asset allocation team at GMO commonly uses "expected return models" (e.g., Shiller CAPE, Q Ratio). 2017 data:
| Indicator | 2017 Level | Historical Average | Historical Extreme (e.g., 2000/2007) | Implied Future 10-Year Real Return |
|---|---|---|---|---|
| Shiller CAPE (US Stocks) | 29.5 | 16.8 | 44.2 (2000) | -1.5% to 0.5% |
| US Non-Financial Market Cap/GDP | 1.35 | 0.85 | 1.54 (2000) | -2% to 0% |
| Global Real Interest Rate (10-Year TIPS) | 0.5% | 1.5% | -0.5% (2012) | Low rates cannot support high valuations |
Key Conclusion: Valuations in 2017 were already close to 2000 levels, but the interest rate environment was more extreme (real rates near zero). Once interest rates normalize, valuation compression will lead to the "Hell scenario"—a simultaneous decline in asset prices and economic growth.
3. Transmission Mechanism of the "Hell Scenario": From Finance to the Real Economy
Montier may emphasize the following chain:
1. Central Bank Exit from Easing: The Fed had already begun raising rates in 2017, while the ECB and BOJ were still in QE, but with diminishing marginal effects.
2. Debt Overhang: Global non-financial corporate debt as a share of GDP rose from 200% in 2008 to 250% in 2017 (BIS data). Rising interest rates will sharply increase debt service pressure.
3. Asset Price Decline: High-valuation assets (e.g., US stocks, high-yield bonds) will be hit first, triggering a reversal of the wealth effect and a contraction in consumption and investment.
4. Exhaustion of Policy Space: After 2008, central banks cut rates to zero and implemented QE, but rates were still low in 2017. If a crisis erupts, traditional tools will have no room left.
4. Historical Comparison: 1997 Asian Financial Crisis vs. 2017 Global Scenario
Montier may cite cases from his book Behavioural Investing:
| Feature | 1997 Asia | 2017 Global |
|---|---|---|
| Core Driver | Fixed exchange rates + short-term external debt | Central bank QE + corporate leverage |
| Investor Belief | "Asian miracle" unsustainable | "Central banks are omnipotent" |
| Trigger | Thai baht devaluation | Inflation rebound/interest rate normalization |
| Consequence | Emerging market collapse, but developed markets unaffected | Global asset co-movement decline (due to globalization + ETFs) |
Key Difference: In 2017, global asset correlations were higher (e.g., US stocks with emerging markets, bonds with stocks). Once the "Hell scenario" is triggered, the contagion speed will far exceed that of 1997.