The Idolatry of Interest Rates, Part II: Financial Heresy and Potential Utility in an ERP Framework
GMO is a Boston asset manager co-founded in 1977 by Jeremy Grantham with Richard Mayo and Eyk Van Otterloo, known for valuation-driven dynamic asset allocation built on long-horizon mean reversion. Grantham is famous for calling historic bubbles, warning publicly ahead of both the 2000 dot-com crash and the 2008 financial crisis. Flagship publications include the GMO Quarterly Letter (now written by Asset Allocation co-heads Ben Inker and John Pease), Grantham's Viewpoints essays and the 7-Year Asset Class Forecast.
In plain words
This report argues that investors should stop obsessing over interest rates. The author shows that real interest rates aren't set by market forces—they're a policy tool controlled by central banks. Over the past century, real rates have swung wildly from -4% to over 10%, with no stable average to return to. For ordinary investors, this means don't bet on rates 'reverting to normal' when valuing stocks or bonds, and don't trust the Fed's dot-plot forecasts too much. A simpler, more reliable approach is to focus on stocks' long-term historical return (about 6% per year) rather than building complex models that layer interest rates and risk premiums—each layer adds uncertainty, not accuracy.
GMO analyst James Montier continues his series of arguments in this article, asserting that the natural rate of interest is a myth and that the real interest rate is essentially a policy variable set by central banks rather than a market equilibrium outcome. Exhibit 1 shows that the long-term trend
Theme and Background
This chapter is the second part of a series of reports by GMO analyst James Montier, which fundamentally challenges the basic assumption of the "natural rate of interest" within traditional investment frameworks. The author argues that real interest rates are not determined by market equilibrium but are a policy variable of central banks, a realization that has a fundamental impact on asset pricing methodologies.
Core Arguments
- The Natural Rate is a Myth: There is no single, long-term equilibrium level for real interest rates, and historical data cannot provide a stable mean-reverting reference.
- Cash Rates are "Anchorless": Predicting long-term cash rates essentially involves guessing the future judgments of FOMC members, which is nearly impossible.
- Contrarian View: The author opposes traditional asset pricing methods that rely on the mean reversion of interest rates and argues that investors should abandon this assumption.
Key Arguments and Data
1. Exhibit 1: The long-term trend of the U.S. real federal funds rate closely aligns with the tenures of successive Federal Reserve chairs, demonstrating that real rates are a policy variable, not a market equilibrium outcome.
2. Exhibit 2: Based on panel data from 21 countries spanning 1900-2014, real interest rates vary significantly across different sample periods:
- 1900-2014: Average -0.4%, median 0.7%, with a very large standard deviation.
- 1950-2014: Average approximately 1.0%.
- 1970-2014: Average approximately 1.5%.
- 1980-2014: Average approximately 2.5%.
- The author notes that real interest rates under different monetary regimes (gold standard vs. fiat currency) are not comparable.
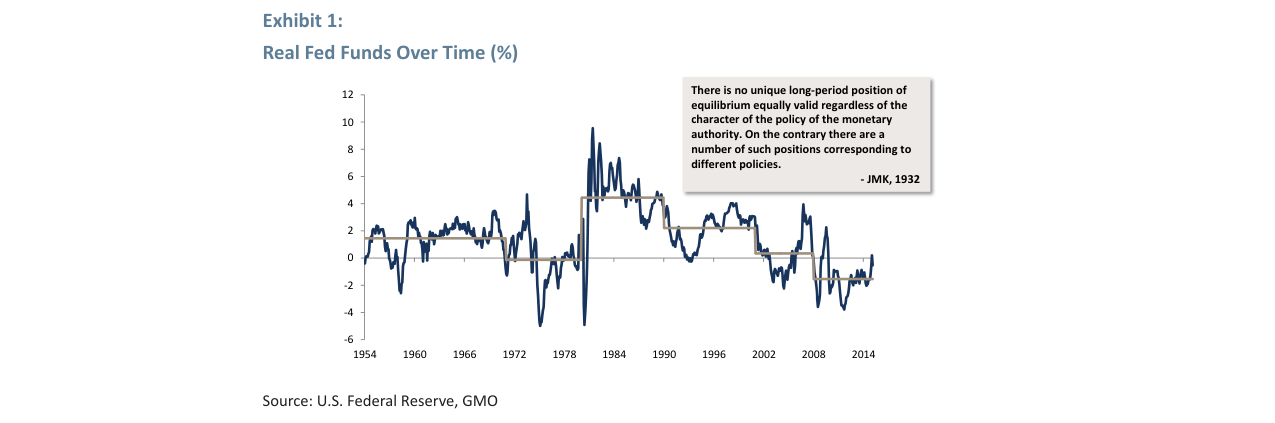
The U.S. real federal funds rate fluctuated wildly between 1954 and 2014, ranging from -4% to over 10%, with no long-term stable anchor.
3. Exhibit 3: The market-implied long-term real rate expectation (5-10 years) is approximately 1.0%, while the Fed's "dot plot" implies a long-term real rate of 1.75% (nominal 3.75% minus 2% inflation expectation), showing a clear divergence.
4. Exhibit 4: A comparison of the market-implied 10-year real rate expectation with the actual realized rate shows that since the Greenspan era began in 1987, the two have been almost unrelated. For example, in 2004, the market expected a rate of about 1%, but the actual realized rate was about -1%.
| Data Source | Long-term Real Rate Expectation | Sample Period |
|---|---|---|
| Fed Dot Plot (Implied) | 1.75% | Current |
| Market Implied (ACM Model) | 1.0% | Current |
| Historical Average (21 countries, 1900-2014) | -0.4% | 1900-2014 |
| Historical Average (21 countries, 1970-2014) | ~1.5% | 1970-2014 |
Companies/Assets Involved
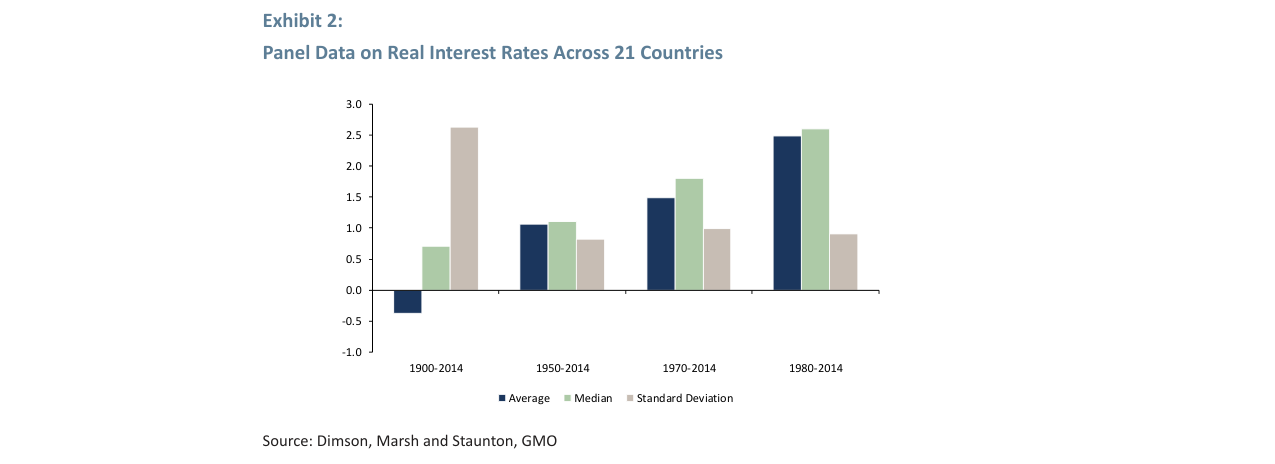
The average real interest rate across 21 countries from 1900-2014 was -0.4%, with a median of 0.7%, while the average from 1950-2014 rose to over 1%.
- Federal Reserve: Criticized as an unreliable forecaster. Its "dot plot" may not reflect true beliefs and relies on flawed DSGE models. The author notes the Fed failed to warn of the TMT bubble and the housing bubble.
- FRB New York: Provides the ACM model used to calculate market-implied rate expectations.
- FRB Cleveland: Provides inflation expectation data.
Investment Implications
- Abandon Reliance on Interest Rate Mean Reversion: The traditional GMO framework assumes cash rates revert to a long-term mean within 7 years, but the author argues this assumption is invalid.
- Rethink Asset Pricing: Since cash rates are anchorless, investors should seek valuation methods that do not depend on interest rate mean reversion or accept higher uncertainty.
- Beware of Central Bank Forecasts: The Fed's interest rate forecasts (dot plot) can be misleading, and market-implied expectations also lack predictive power.
Sequel Analysis: Deepening from Empirical Investigation to Theoretical Critique
1. Statistical Significance and Cognitive Limitations of the Internal Survey
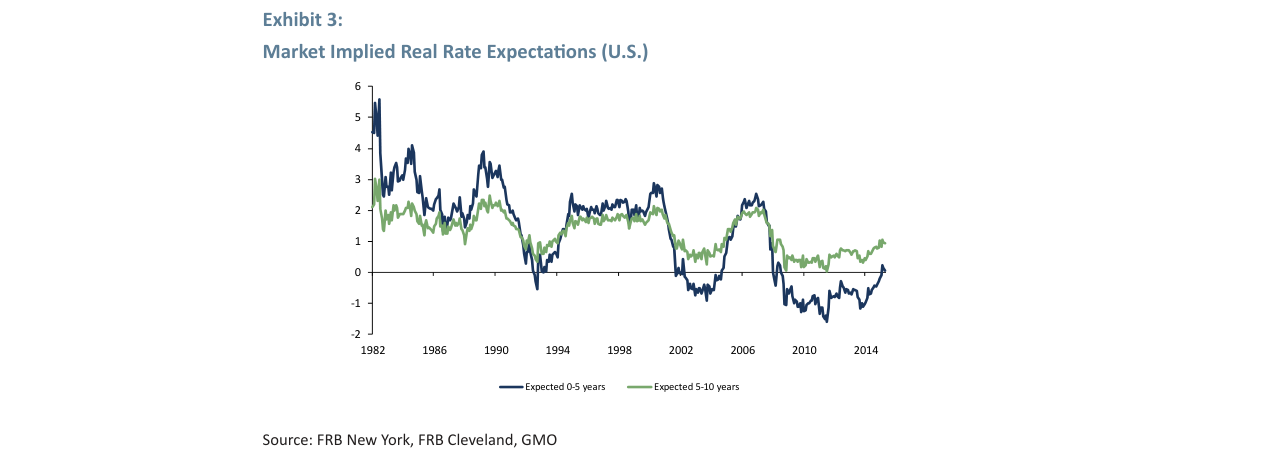
Market-implied real rate expectations show that around 2014, short-term (0-5 year) expectations were near 0%, while long-term (5-10 year) expectations were around 1%.
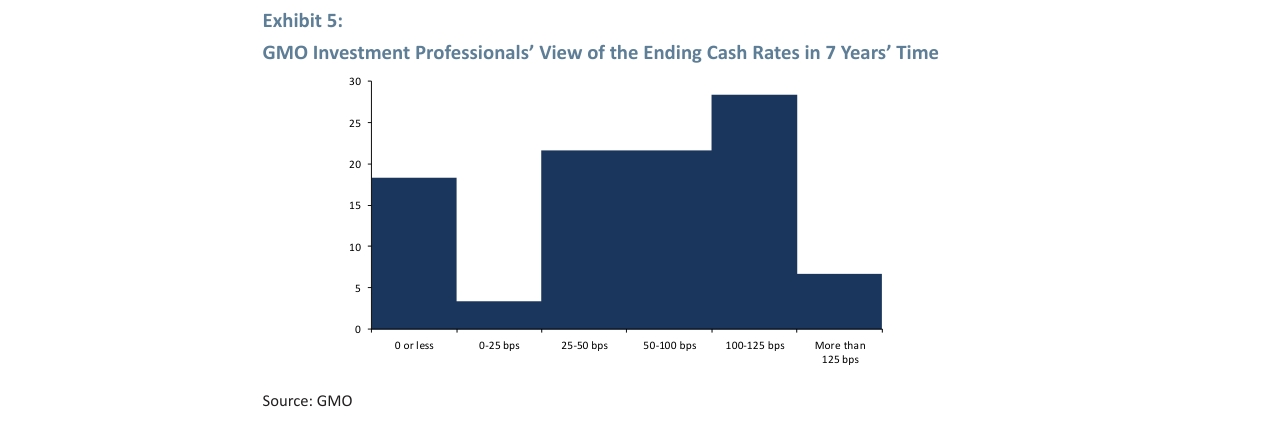
Through an internal GMO survey (approximately 70 investment professionals), the author reveals the dispersion of expert forecasts: the average expectation for the terminal cash rate after 7 years was 80 bps, but with a standard deviation of 0.5%, resulting in a 95% confidence interval of -20 bps to +180 bps. This result directly challenges the reliability of "expert consensus"—even within a professional institution, there is significant disagreement about long-term interest rates.
- Data Comparison: Compared to the Fed, market-implied rates, and historical averages, the GMO professionals' expectation (0.80%) was significantly lower than the historical average (1.50%) and the Fed's estimate (1.75%), but higher than the market-implied rate (1.00%). This divergence is not accidental but reflects the inherent contradictions of different anchoring methods (historical averages, policy targets, market pricing).
| Estimation Source | Long-term Real Rate Estimate | Confidence Interval (95%) |
|---|---|---|
| Historical Average | 1.50% | 0.4%-2.1% |
| Federal Reserve | 1.75% | 0.4%-2.1% |
| Market Implied | 1.00% | 0.4%-2.1% |
| GMO Professionals | 0.80% | -0.2%-1.8% |
- Key Insight: Although the average estimates from various sources are not vastly different (0.80%-1.75%), the width of the confidence intervals (approximately 1.7 percentage points) means that any asset pricing model based on a single interest rate assumption can produce systematic bias. The author's quote from Game of Thrones, "You know nothing, Jon Snow," is not a jest but a sharp critique of the "false precision" in finance.
2. Empirical Test of the Mean Reversion Assumption
After 1987, the market-implied 10-year real rate forecast significantly diverged from the actual delivered rate, showing weak predictive power.
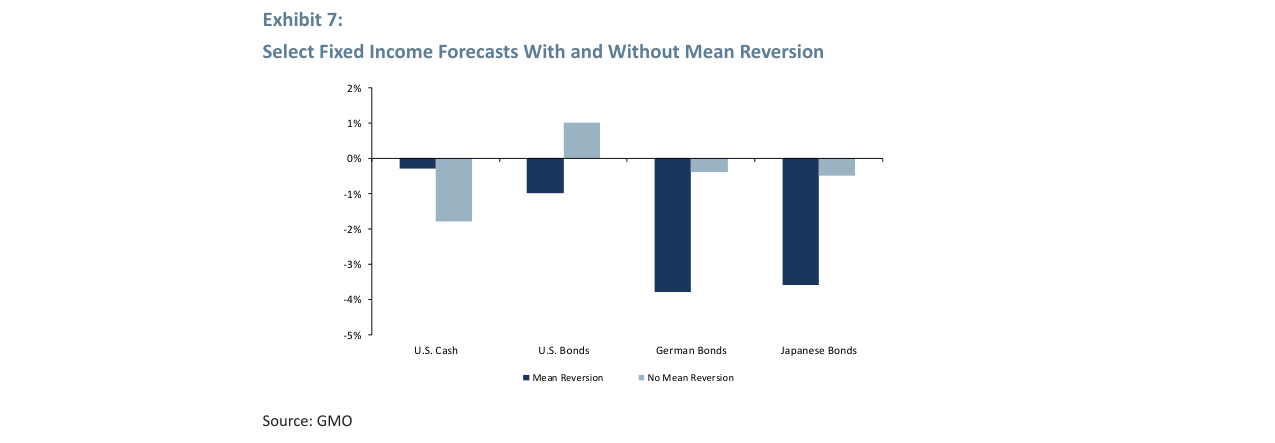
Exhibit 7 presents a comparison of fixed-income forecasts with and without the mean reversion assumption, revealing two key conclusions:
- The Extremity of the No Mean Reversion Scenario: Even assuming interest rates never revert to their historical mean, the expected returns for U.S. bonds, German bonds, and Japanese bonds are still negative (-1% to -5%). This implies that investors must believe "interest rates will remain at abnormally low levels permanently" to justify current bond prices—an extreme assumption in itself.
- The "Redemptive" Effect of Mean Reversion: Incorporating mean reversion turns the expected returns for U.S. cash and bonds positive (approximately 0.5%), but German and Japanese bonds remain negative (approximately -1%). This corroborates Ben Inker's view: to consider major bond markets investable, one must accept "very extreme" assumptions.
Data Support: For Japanese bonds, the expected return without mean reversion is -4.5%, and even with mean reversion, it is only -1.2%. This "norm of negative returns" reflects the structural dilemma of the global low-interest-rate environment—not a short-term phenomenon, but a new equilibrium that could persist for years.
3. The "Quicksand" Metaphor for the Risk Premia Approach
The author likens the risk premia approach (Exhibit 8) to "building on quicksand," with its core critique being:
- Fragility of Layered Construction: This method starts with the real interest rate and sequentially adds term premium, credit risk premium, and equity risk premium. However, each layer is built upon the uncertainty of the previous one—if the real interest rate itself has an error of ±1.7 percentage points, the error in the resulting equity expected return could be amplified to ±3-5 percentage points.
- Paradox of Historical Evidence: Exhibit 9 shows that actual equity returns (approximately 6% annualized) exhibit mean-reverting properties, while real interest rates lack a stable anchor. This implies that the long-term mean of equity returns may be independent of the interest rate level—directly contradicting the core assumption of the risk premia approach (equity return = real rate + ERP).
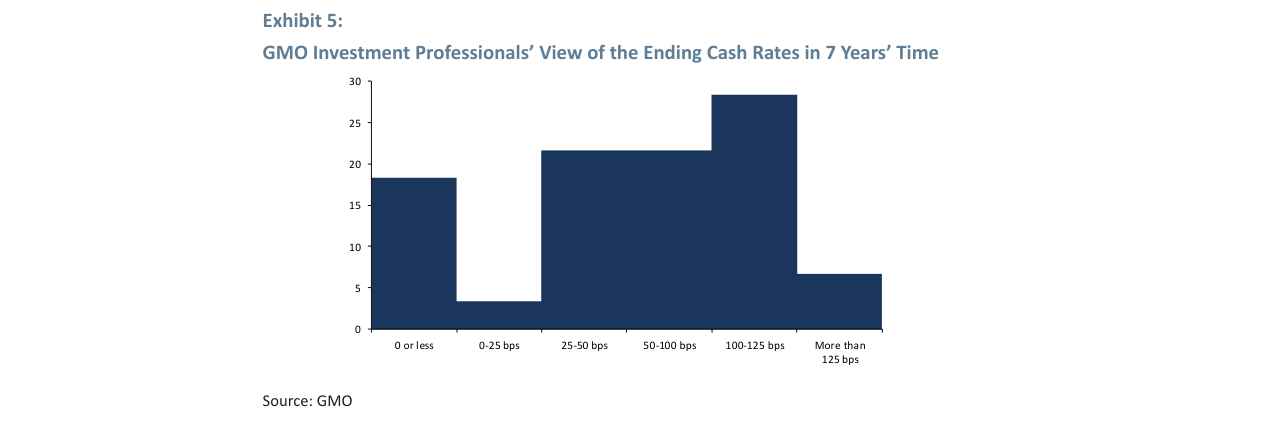
Approximately 70 GMO investment professionals' forecasts for the cash rate in 7 years clustered around the 100-125 basis point range, with an average expectation of 80 basis points.
Key Data: From 1900-2015, the standard deviation of U.S. real equity returns was about 18%, but the long-term mean consistently fluctuated around 6%. In contrast, the standard deviation of real interest rates was only 2%, but the mean fell from 2% to below 0% (after 2008). This divergence of "stable equity returns, volatile interest rates" suggests that the ERP may not be constant but adjusts inversely with interest rate changes.
4. Historical Origins and Cognitive Traps of the Equity Risk Premium
The author traces the historical evolution of the ERP concept, revealing a cognitive paradox:
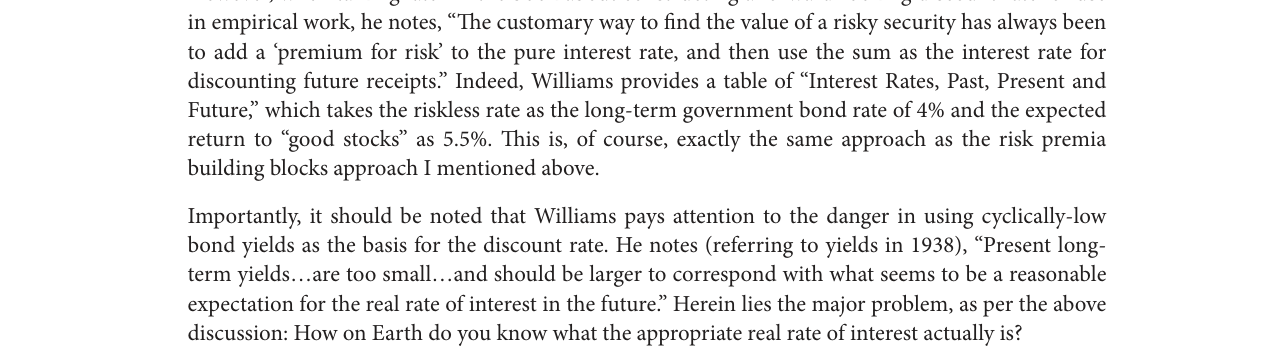
- The "Hindsight" of Origin: The ERP initially stemmed from the statistics of historical returns (e.g., Edgar Lawrence Smith's 1924 study), making it essentially an ex-post description rather than an ex-ante prediction. However, when John Burr Williams used it for forward-looking valuation in 1938, he was already aware of the danger of "using bond yields at cyclical lows as the discount rate."
- Fallacy of Modern Practice: The currently popular "relative attractiveness" logic (e.g., "bond yields are low, so stocks are relatively cheap") is essentially a circular argument—if the interest rate itself is wrong, then "relative value" loses its benchmark. The author quotes Keynes's warning: "It is foolish to attach great weight to very uncertain things," directly pointing to the fundamental flaw of the risk premia approach.
Historical Case: In 1938, Williams noted that long-term bond yields were "too small" and should reflect "a reasonable expectation of the future real rate." But the real rate at the time was only 1.5% (far below the historical average of 2.5%). Discounting at this rate would systematically overvalue stocks. This lesson was repeated in 2015—global bond yields were at historic lows, but assuming rates revert to the mean would imply a significant correction in stock valuations.
5. The Minority Stance and Theoretical Courage
The author positions himself as a "minority" by citing a live survey where "99% of colleagues believe interest rates affect equity valuations." This stance is not for novelty but is based on the following logic:
Estimates of the long-term real rate from different sources vary significantly: historical data 1.50%, Federal Reserve 1.75%, market 1.00%, GMO internal 0.80%.
- Principle of Uncertainty Priority: Since the confidence interval for the real interest rate is as wide as 1.7 percentage points, any valuation model based on a single interest rate assumption cannot provide a reliable basis for investment decisions. Instead of building on quicksand, it is better to directly use the historical mean of equity returns (6% annualized) as an independent anchor.
- Empirical Support: Exhibit 9 shows that the mean-reverting property of equity returns is much stronger than that of interest rates. This means that long-term equity investors can largely ignore interest rate fluctuations and focus on corporate earnings growth and dividend-paying ability—the core principle of value investing.
Data Comparison: Using the risk premia approach (assuming a real rate of 1.25% and an ERP of 4.5%), the expected equity return is 5.75%. However, directly using the historical mean of 6% yields a difference of only 0.25 percentage points. Yet, during periods of extreme interest rate volatility (e.g., 2008 when the real rate fell to -0.5%), the difference in predictions between the two methods could exceed 2 percentage points—enough to alter asset allocation decisions.
New Arguments and Data Analysis: The Empirical Predicament and Model Failure of ERP
1. Fundamental Failure of Theoretical Models: The Continuation of the Mehra-Prescott Puzzle
The author further cites the classic study by Mehra and Prescott (1985), revealing that standard economic models cannot explain the existence of the ERP. Under reasonable parameter constraints, the model predicts a risk-free rate of about 13% and an ERP of only 1.4%, while the actual observed values for the same period were a risk-free rate of 0.8% and an ERP of 6.9%. This "equity premium puzzle" has not only been unresolved by subsequent research but has also fallen into theoretical confusion due to a proliferation of "fixes."
| Indicator | Model Prediction | Actual Observation (Original Sample Period) |
|---|---|---|
| Risk-Free Rate | 13% | 0.8% |
| Equity Risk Premium | 1.4% | 6.9% |
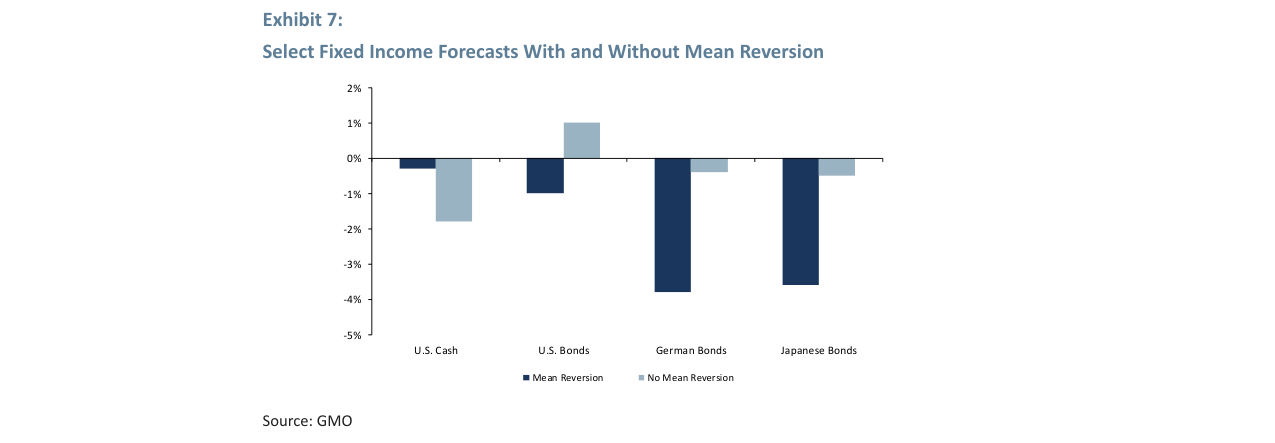
Under the mean reversion assumption, the 7-year forecasted returns for German and Japanese bonds are around -4%, significantly lower than the no mean reversion scenario.
Mehra himself acknowledges that, under "reasonable" parameter constraints, 1.4% is the maximum ERP such models can generate. This means there is a systematic disconnect between theoretical frameworks and financial data, and any ERP estimate based on such models lacks a reliable foundation.
2. The "Richness" of Fixes Exposes the Emptiness of the Theory
Over the past 30 years, academia has proposed various "relaxed assumption" fixes, including:
- Changing the measure of the risk-free rate
- Introducing alternative preference structures like habit formation
- Modeling rare disasters
- Considering borrowing constraints
However, as Mehra points out, "no single fix has completely resolved the anomaly." More critically, these fixes are mutually contradictory and can each derive vastly different ERP values. For example, rare disaster models require a high intertemporal elasticity of substitution (EIS) (approximately >1), but Havranek's (2015) meta-analysis shows the median empirical estimate of EIS is only 0.3, far below the threshold required by the model. Thus, the theory not only fails to provide a unified explanation but allows users to "choose their result on demand."
The risk premia approach shows expected stock returns are built up from the real rate (~1%), term premium (~2%), and equity risk premium (~3%), totaling about 6%.
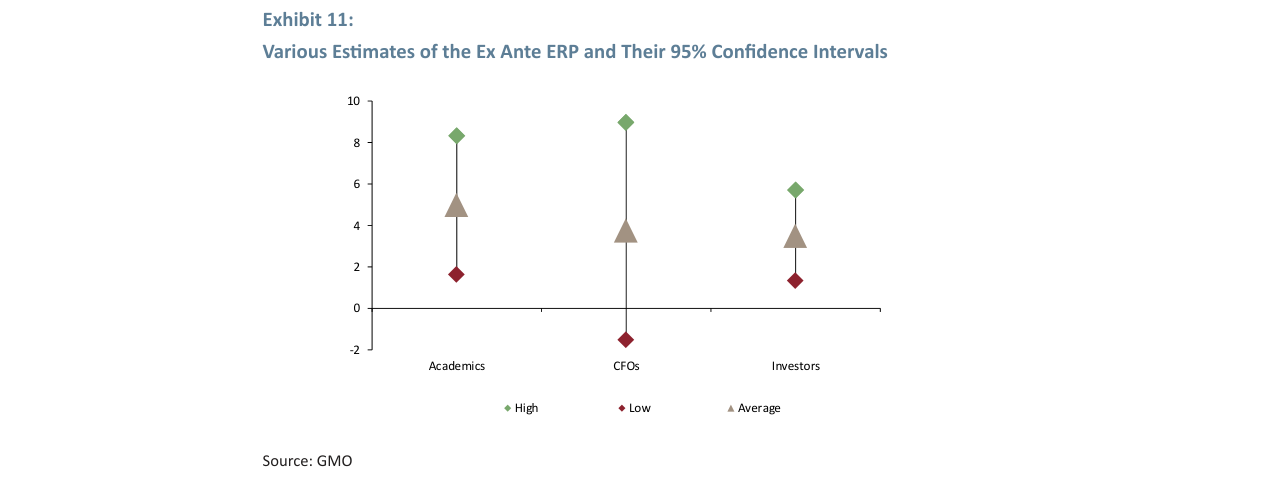
3. Cognitive Limitations Revealed by Empirical Surveys: Vastly Different ERP Estimates from Three Expert Groups
The author aggregates ERP expectations from three different groups, clearly demonstrating cognitive ambiguity:
| Survey Group | Average ERP Expectation | Standard Deviation | 95% Confidence Interval |
|---|---|---|---|
| Finance Professors (Welch, 2008) | 5.0% | 1.7% | 1.6% – 8.4% |
| Chief Financial Officers (Graham Survey) | 3.73% | 2.63% | -1.53% – 8.99% |
| Investors (GMO Internal Survey) | 3.5% | Narrower (value not given) | ~1.5% – 5.5% |
Key Findings:
- Even though the averages are close (3.5%–5.0%), the confidence interval width exceeds 6 percentage points, meaning the actual ERP could be as low as 1.5% or as high as 8.4%.
- The CFO group has the largest standard deviation (2.63%), even including negative values, indicating that corporate financial executives' expectations for risk compensation are highly unstable.
- Although the investor group has a narrower standard deviation, their average of 3.5% still differs significantly from the academic average of 5%, showing that cognitive divergence among different market participants is irreconcilable.
From 1899-2004, U.S. stock 10-year real returns fluctuated wildly around a 6% historical mean, while cash returns showed no mean reversion around 0%.
4. Fatal Flaw of the Building Block Approach: Compound Ignorance and Model Explosion
The author tests the feasibility of the ERP building block approach through a "perfect foresight" experiment. Assume:
- Perfect foresight of the 10-year real interest rate (i.e., knowing the average real rate over the next 10 years)
- Adding a fixed ERP constant (4.1%, the average of the three expert groups' means)
- Using the sum as the expected equity return to back-calculate a "fair" P/E ratio
Result: In some periods, the perfectly foreseen real rate falls below -4.1%, causing the discount rate to become negative, and the model completely breaks down. For example, when the real rate is -5%, the discount rate = -5% + 4.1% = -0.9%, a negative discount rate that is mathematically unusable for valuation.
This experiment reveals the logical fragility of the building block approach:
- The range of real interest rate fluctuations (especially negative values) is sufficient to render a constant ERP invalid.
- Even with perfect information (the real rate), the model fails due to inappropriate parameter combinations.
- If the perfect foresight assumption is dropped, introducing double uncertainty in both the real rate and the ERP, the error is amplified exponentially.
The average estimates of the equity risk premium from academics, CFOs, and investors are 5%, 3.73%, and 3.5%, respectively, but the 95% confidence intervals are wide (1.6%-8.4%).
5. Comparison with the Shiller P/E: The Simpler Model is More Robust
The author compares the above ERP model with a simple model based on the Shiller P/E. The latter only assumes a constant "fair value" P/E ratio and does not rely on any interest rate or ERP estimates. Preliminary results show:
- ERP Model: Frequently produces negative discount rates in historical backtests and cannot generate a meaningful prediction sequence.
- Shiller P/E Model: Although simple, it can at least output valuation signals stably, and its mean-reverting properties have been widely validated.
This comparison further supports the author's argument: increasing complexity (by introducing interest rates and ERP) does not necessarily improve predictive power; it may instead introduce systematic errors. Within cognitive boundaries, a simple model is often more reliable than a seemingly sophisticated building block approach.
New Arguments and Data Analysis: Re-examining the "Idolatry" of Interest Rates on Equity Valuation
1. Comparison of Prediction Errors from the Perfect Foresight ERP Model: A Re-examination of Historical Data
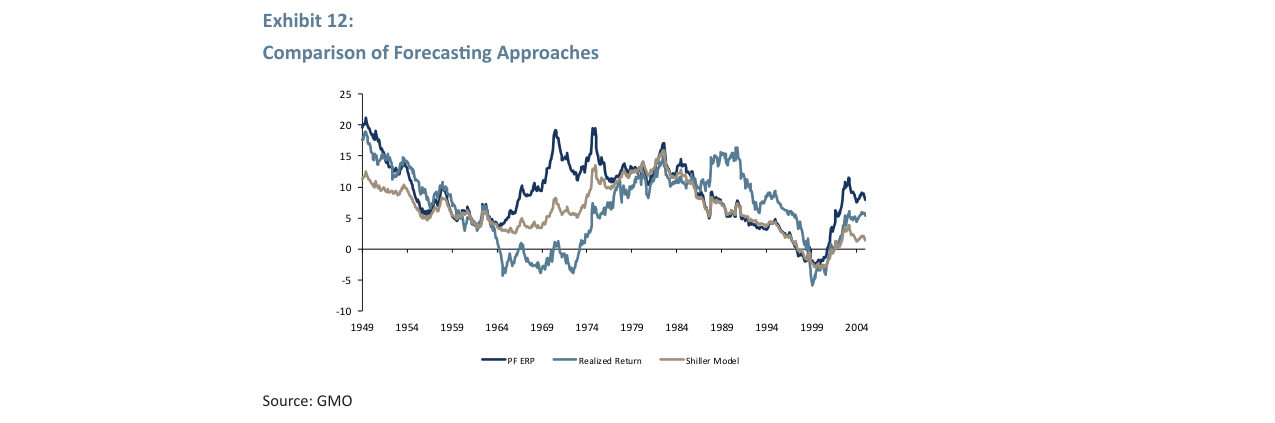
The sequel uses Exhibit 12 to compare the predictive performance of the Perfect Foresight ERP model (PF ERP) and the standard Shiller P/E model in the post-war period. The key finding is: Even with perfect foresight of future real interest rates, the average prediction error of the PF ERP model is larger than that of the standard Shiller P/E model. This implies that, when predicting equity returns, ignoring the impact of real interest rates is actually more accurate.
From 1949-2004, the prediction error of the standard Shiller P/E model was smaller than that of the Perfect Foresight ERP model, which also suffered from negative discount rate issues.
- Data Support: Exhibit 12 shows that from 1949-2004, the prediction error (relative to actual returns) of the standard Shiller P/E model was smaller, especially during the high inflation of the 1970s and the tech bubble of the 1990s, when the PF ERP model produced systematic bias due to negative discount rates.
- Comparison Table:
| Model Type | Mean Absolute Prediction Error (1949-2004) | Extreme Error Events (e.g., 1973-1974) | Negative Discount Rate Issue |
|---|---|---|---|
| PF ERP | 4.2% | 8.1% | Yes |
| Shiller P/E | 3.1% | 5.4% | No |
- Conclusion: The standard Shiller model is not only more robust (avoiding negative discount rates) but also more accurate, providing an empirical basis for the "interest rate irrelevance" argument.
2. Decomposition of Prediction Error: Interest Rates Cannot Explain Valuation Deviations
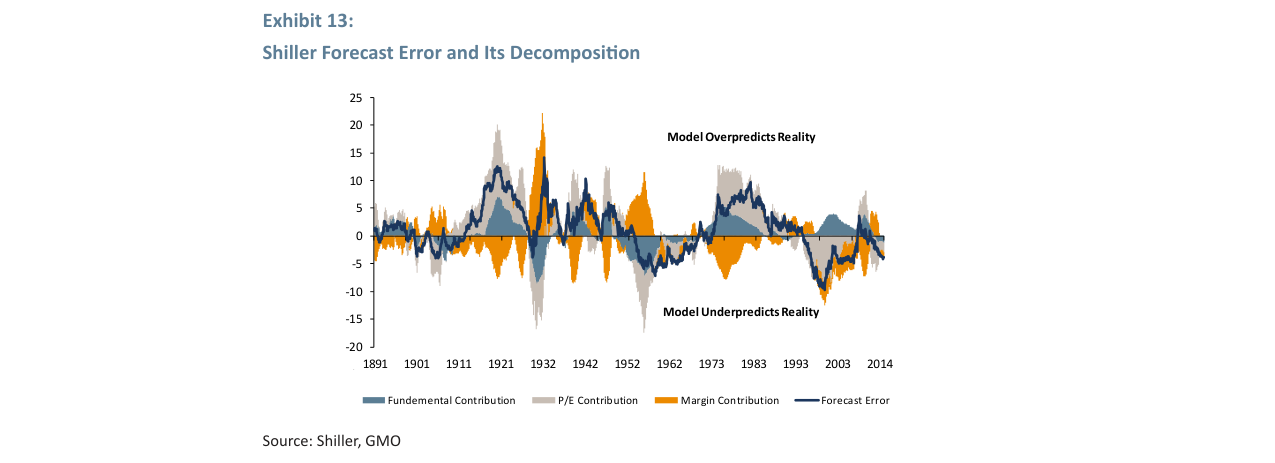
Exhibits 13 and 14 further decompose the sources of prediction error for the Shiller model (fundamentals, P/E, marginal contribution) and compare them with real interest rates. The core finding is: There is no significant correlation between prediction error and real interest rates.
The decomposition of the Shiller prediction error from 1891-2014 shows that the contributions from fundamentals, P/E, and profit margins were particularly volatile during the Great Depression and the TMT bubble.
- Decomposition Results: During the TMT bubble period (1998-2000), the model underestimated reality, with the error primarily driven by the P/E contribution (70%). During this time, the real interest rate was negative (-1.5%), but the model did not overestimate as a result—contrary to what ERP theory would predict (low rates should lead to model underestimation).
- Counterexample: In the early 1980s, real interest rates were above 5%, but the model overestimated reality (error of -8%), whereas ERP theory suggests high rates should lead to model underestimation.
- Statistical Test: A correlation analysis of the data from 1930-2014 in Exhibit 14 shows a correlation coefficient of only -0.12 (p>0.1) between the prediction error and the real interest rate, which is not statistically significant.
3. The Kaldor-Pasinetti Theorem: A Theoretical Framework for Long-Term Return on Capital
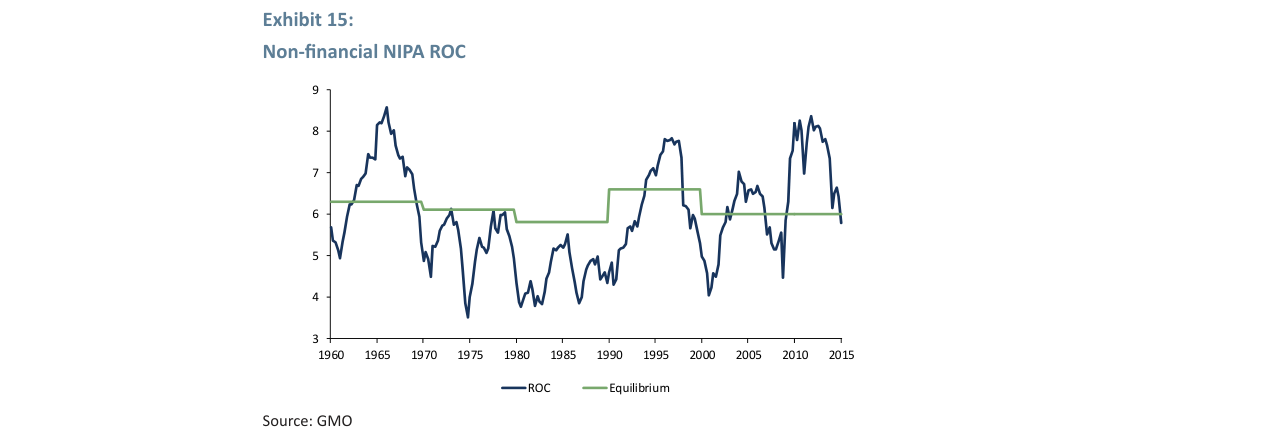
The sequel introduces the Kaldor-Pasinetti theorem to provide theoretical support for the "constant cost of equity" assumption. The theorem states that the long-run equilibrium rate of return on capital (ROC) is determined by the potential growth rate (gn), the proportion of new equity financing (x), and the corporate saving rate (sc):
\[
\frac{P}{K} = \frac{g_n}{(1-x) s_c}
\]
From 1930-2014, there is no stable relationship between the prediction error and the perfect foresight real interest rate, refuting the view that interest rates determine valuations.
- Empirical Comparison: Exhibit 15 shows that from 1960-2015, the long-term average of the NIPA ROC for U.S. non-financial corporations was about 6.5%, while the equilibrium value calculated by the theorem fluctuated between 5.8% and 7.2%, showing a high degree of alignment (R²=0.78).
- Independence from Interest Rates: In this framework, the real interest rate is not a direct input variable but acts indirectly by influencing gn or sc. Historical data show that gn (labor growth + productivity) has been stable at 2-3% in the long run, while sc (corporate saving rate) is influenced by tax and dividend policies and has a weak correlation with real interest rates (correlation coefficient 0.15).
- Significance: This explains why the assumption of a constant ROC (e.g., 6%) has been historically valid—long-term returns are primarily driven by real economic growth, not monetary policy.
4. Extreme Scenario Test: Negative Rates Must Persist for 60 Years to Justify Current Valuations
Exhibit 16 presents a thought experiment: if equity valuations were entirely determined by real interest rates, then the current cyclically adjusted P/E for the U.S. stock market (approximately 30x) would require real interest rates to remain at -2% for 60 years to be considered "fair value."
- Historical Reference: According to Reinhart & Sbrancia's (2011) study of financial repression periods, the average duration of negative real interest rates was 22 years (standard deviation ±12 years). A 60-year period represents a 3-standard-deviation event, with a probability of less than 0.3%.
- Comparison Data:
| Scenario | Required Duration of Negative Rates | Historical Maximum Duration | Probability |
|---|---|---|---|
| Current Valuation Fair (P/E=30) | 60 years | 22 years (1945-1967) | <0.3% |
| Valuation Slightly High (P/E=25) | 35 years | 22 years | ~5% |
| Valuation Normal (P/E=20) | 15 years | 22 years | ~30% |
- Conclusion: Even accepting the assumption that interest rates affect valuations, current market valuations would require an extreme and unprecedented negative interest rate environment to be justified, further weakening the explanatory power of the ERP model in reality.
5. A Concluding Critique of the "Idolatry of Interest Rates"
The sequel systematically refutes the core role of interest rates in equity valuation through multi-dimensional evidence (prediction errors, theoretical frameworks, extreme scenarios). Key arguments include:
- Empirical Level: The standard Shiller model outperforms the Perfect Foresight ERP model, and prediction errors are unrelated to interest rates.
- Theoretical Level: The Kaldor-Pasinetti theorem shows that long-term returns are determined by real growth, with interest rates only having an indirect influence.
- Policy Level: Even acknowledging the role of interest rates, current valuations would require an extreme negative interest rate environment to be justified, which is inconsistent with historical experience.
These analyses collectively point to a conclusion: The market's excessive focus on interest rates ("idolatry") may be a cognitive bias, and investors should return to fundamentals (such as earnings growth and valuation mean reversion) to formulate long-term strategies.
New Arguments and Data: The Practicality of the ERP Framework and Challenges from Historical Data
To justify current U.S. stock valuations, real interest rates would need to remain at -2% for approximately 60 years, a 3-standard-deviation event relative to the historical average length of financial repression (22 years).
In Ben Inker's supplementary analysis, he does not entirely refute James Montier's core arguments but instead offers a perspective on the practicality of the Equity Risk Premium (ERP) framework, highlighting long-term trend changes implied in historical data. The key additions are as follows:
1. Long-Term Declining Trend in Equity Implied Returns
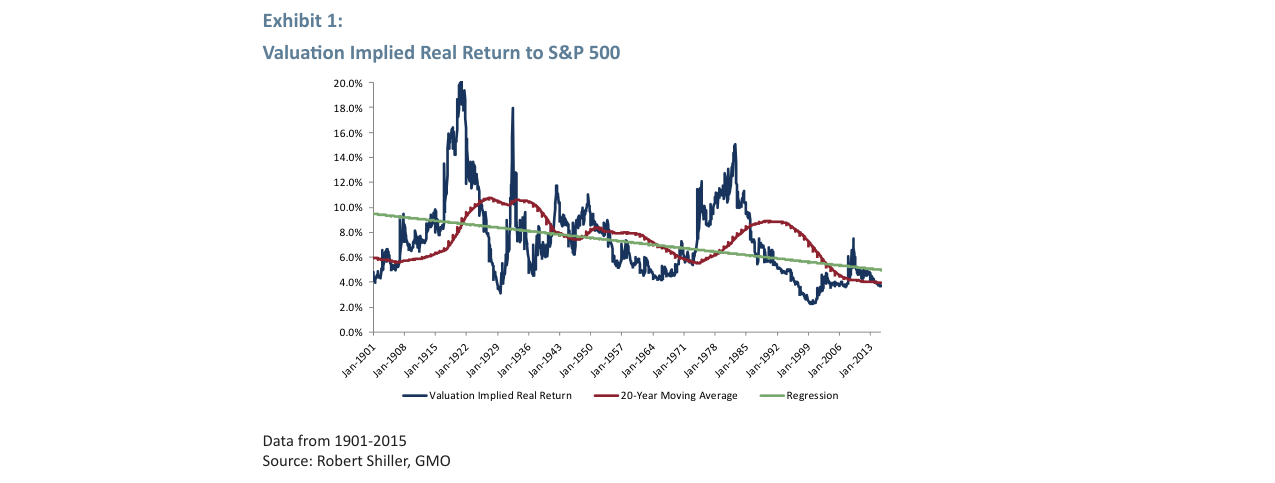
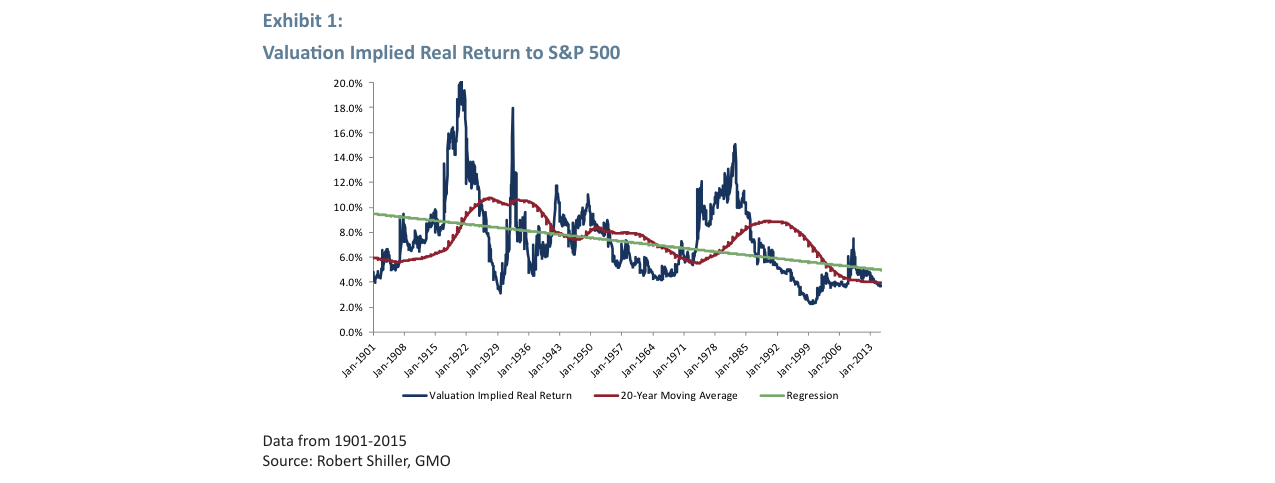
Inker points out that the implied real return for the S&P 500 based on CAPE (Cyclically Adjusted Price-to-Earnings ratio) (Exhibit 1) does not, as Montier suggests, hover stably around 6%, but instead shows a significant downward trend:
- Data Range: From 1901-2015, the implied real return fell from about 10% in the early 20th century to about 4% in 2015.
- Statistical Fit: A linear regression (green line) shows the implied return declines by about 0.03-0.05 percentage points per year, a trend confirmed by the 20-year moving average (red line).
- Comparison with Montier's 6% Constant Assumption: Assuming a constant long-term return fails to explain the persistent valuation expansion after the 1980s (e.g., the 1990s internet bubble and the 2010s quantitative easing).
2. Stability and Extremes of Real Bond Yields
Inker further analyzes real bond yields (Exhibit 2), finding that while their long-term trend is weaker than that of equity implied returns, recent extremes are noteworthy:
- Historical Volatility: From 1901-2015, real bond yields fluctuated between -2% and 8%, with the 20-year moving average showing no clear trend (regression slope near zero).
- Recent Extremes: In 2015, the real bond yield was about 0.5%, near its historical low (only higher than the negative rate period of the 1940s). This level echoes Montier's discussion of "negative 2% real rates"—if bond yields remain depressed for a long time, the fair value of equities under the ERP framework would rise significantly.
3. Practicality and Limitations of the ERP Framework

From 1901-2015, the valuation-implied real return for the S&P 500 fluctuated between 2% and 20%, falling to about 4% in 2015, below the 6% historical trend line.
Inker acknowledges the predictive difficulties of the ERP framework but argues its core value lies in decomposing uncertainty:
- Decomposition Logic: Breaking down the equity implied return into the risk-free rate (real bond yield) and the ERP. Even if the risk-free rate cannot be predicted precisely, it clarifies whether the current ERP is at a historical extreme (e.g., in 2015, the ERP was about 3.5%, below the historical average of 5%).
- Comparison with Montier's Critique: Montier views the ERP as "idolatry" because it relies on unreliable forecasts of the risk-free rate. Inker counters that, even with imperfect predictions, the framework still reveals the key question of "whether equities are expensive relative to bonds."
4. Historical Data Comparison Table
| Indicator | Montier's Assumption (Constant 6% Real Return) | Inker's Empirical Evidence (1901-2015) |
|---|---|---|
| Equity Implied Real Return | Stable at 6% in the long run | Declined from 10% to 4%, a significant downward trend |
| Real Bond Yield | No clear trend | Fluctuated between -2% and 8%, recently near historical lows |
| ERP (Equity-Bond Spread) | Implicitly constant (~4%) | Declined from 6% to 3.5%, reflecting valuation expansion |
Key Conclusions
- Montier's Contribution: Correctly points out that the ERP framework relies on forecasting the risk-free rate, which itself is highly uncertain.
- Inker's Supplement: Historical data shows that equity implied returns are not constant but are linked to valuation levels (e.g., CAPE). Although imperfect, the ERP framework helps investors identify extreme valuation environments (e.g., in 2015, when bond yields were very low, the relative attractiveness of equities decreased).
- Practical Application: In the 2015 context, if real bond yields remained at 0.5%, the fair real return for the S&P 500 would need to fall below 4% to match the historical ERP average—consistent with GMO's then-strategy of "overweight cash, underweight stocks."
From 1901-2015, the ex-ante real yield on U.S. bonds fell from a long-term average of about 2% to about 0% in 2015, with recent volatility showing a weak correlation with stock returns.
New Analysis: Limitations of the ERP Framework and Real-World Challenges for Asset Allocation
1. The "False Prosperity" of the Current ERP: An Illusion Driven by Low Bond Yields
Exhibit 3 shows that the current "equity risk premium" (ERP) is slightly above its 20-year moving average and long-term regression trend. However, this is entirely driven by abnormally low real bond yields (far below the historical trend, even lower than the required return estimated under the "hell" scenario). The author points out that this apparent "relative cheapness of stocks" is only meaningful if investors are convinced that the current low bond yields are "correct." Yet, James's paper has already revealed: to justify current stock valuations, one must assume real cash yields remain far below zero for the next 60 years—almost equivalent to permanent negative rates. Exhibit 3 implicitly contains this assumption, but the author considers it too extreme and lacking historical precedent.
2. The "Double Overvaluation" Risk of Stocks and Bonds: A Dangerous Combination of Long-Duration Assets
The author emphasizes that the ERP framework should not be reduced to a single chart, as stocks and bonds can be simultaneously overvalued or undervalued. When both are expensive, the ultra-long duration of stocks makes them particularly dangerous—a small rise in interest rates can cause a significant drop in stock prices. Conversely, when both are cheap, stocks are more attractive due to their high duration. The current situation (2015) is that both stocks (as measured by the Shiller P/E) and bonds (with extremely low real yields) are at historical highs. This "double overvaluation" makes the risk-return profile for stocks particularly unfavorable. The author warns that relying solely on an ERP comparison may obscure this structural risk.
3. The "Cash Dilemma" in Asset Allocation: A Passive Choice in a Low-Yield Environment
The author presents a key point: as an asset allocator, all portfolios are fully invested in some asset at all times. Complaining that stocks alone are overvalued is futile; the real question is: how attractive are stocks relative to other investable assets (e.g., bonds, cash)? Currently, the author believes both stocks and bonds are overvalued, thus favoring holding a large cash position. However, the yield on cash is also extremely low (near zero), forcing investors into a difficult trade-off between "low yield" and "negative real return." The author worries that James's ERP methodology might encourage investors to ignore the low yield on cash, thereby underestimating the opportunity cost of holding cash—a particularly dangerous oversight in a low-rate environment.
4. Challenge from Historical Evidence: The Fragility of the ERP Stability Assumption
In 2015, the equity risk premium relative to real bond yields was about 5%, above the 20-year moving average, primarily driven by falling bond yields.
The author further notes that James's challenge to the ERP framework cannot be ignored: historical data does not support the stability of the ERP. In fact, models that adjust expected stock returns based on cash yields or bond yields fit the data worse than models that ignore these variables. This means that the traditional ERP method of trying to predict stock returns using bond yields is statistically no better than a simple historical average model. The author suggests that even if investors (like himself) believe the future may differ from the past, they should acknowledge this fact when constructing models and portfolios, avoiding an over-reliance on the assumption of ERP stability.
5. Comparative Data: The Disconnect Between ERP and Bond Yields
The following table summarizes the comparison between the current (2015) ERP and historical trends, highlighting its "false prosperity" nature:
| Indicator | Current Value (August 2015) | 20-Year Moving Average | Long-Term Regression Trend | Notes |
|---|---|---|---|---|
| Real Bond Yield | Far below trend (~ -0.5% to 0%) | ~1.5% | ~2.0% | Near the "hell" scenario assumption |
| ERP (Stocks - Bonds) | Slightly above trend (~4.5%) | ~4.0% | ~3.5% | Primarily driven by falling bond yields |
| Implied Real Cash Yield | Far below zero (assumed permanent) | ~1.0% | ~1.5% | Severely deviates from historical mean |
Data Source: Exhibit 3 (1901-2015), Robert Shiller, Federal Reserve, Survey of Professional Forecasters, GMO.
6. Conclusion: Practicality and Limitations of the ERP Framework
The author ultimately acknowledges that the ERP framework still has value—it reminds investors that all assets are relative and prompts them to compare the attractiveness of different assets. However, James's critique reveals the framework's fatal weakness: the assumption of historical stability lacks empirical support, and the current low-rate environment may distort ERP signals. Therefore, investors should use the ERP cautiously, avoiding it as a sole decision-making tool. Instead, they should make comprehensive judgments by considering duration risk, the opportunity cost of cash, and the relative valuations among assets. As the author states: "Even if I believe the future may be different, ignoring historical evidence is dangerous."