The Idolatry of Interest Rates Part I
GMO is a Boston asset manager co-founded in 1977 by Jeremy Grantham with Richard Mayo and Eyk Van Otterloo, known for valuation-driven dynamic asset allocation built on long-horizon mean reversion. Grantham is famous for calling historic bubbles, warning publicly ahead of both the 2000 dot-com crash and the 2008 financial crisis. Flagship publications include the GMO Quarterly Letter (now written by Asset Allocation co-heads Ben Inker and John Pease), Grantham's Viewpoints essays and the 7-Year Asset Class Forecast.
In plain words
This report argues that the 'equilibrium real interest rate'—a concept economists and central bankers love—is actually a myth, like chasing a will-o'-the-wisp. Using data and history, the author shows that interest rates aren't set by some mysterious market force but are simply what central banks decide. For regular investors, this means don't blindly trust rate forecasts or asset prices based on this theory. Instead, watch what central banks actually do and why. Worth a read because it challenges a deep-seated groupthink in mainstream economics, helping you think independently.
This report, authored by GMO analyst James Montier, critiques the academic and central banking world's excessive reverence for the "equilibrium real interest rate." The core argument is that authoritative figures such as Bernanke, Yellen, Summers, and Krugman frequently invoke this concept (e.g., Ye
Theme and Background
This chapter critiques the academic and central banking world's excessive reliance on and blind worship of the concept of the "equilibrium real interest rate." The author points out that authoritative figures such as Bernanke, Yellen, Summers, and Krugman frequently cite this concept, but are essentially trapped in groupthink rather than the wisdom of crowds. The market environment is such that in the post-financial crisis era of low growth and low interest rates, this concept has been used as a core basis for policy-making, yet its validity has never been genuinely questioned.
Core Argument
The author's core investment thesis is: The equilibrium real interest rate is a non-existent, illusory concept, akin to "searching for a Snark" or "chasing a Will-o'-the-Wisp." Counter-intuitive judgments include:
- The "consensus" among mainstream economists around the same framework is not wisdom but extreme groupthink—they lack independence, many studied under the same mentors, creating a risk of "inbreeding."
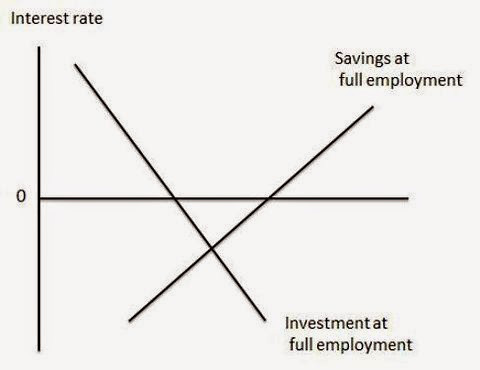
- Whether it's Bernanke's argument (savings curve shifting right) or Summers' argument (investment curve shifting left), both are essentially "discussing how many angels can dance on the head of a pin," because the framework itself is flawed.
- In the real world, there is no market for "real capital"; interest rates are set by central banks, not determined by some equilibrium force.
Key Arguments and Data
The author supports the argument with the following data and historical cases:
- Yellen's Speech: In a speech on March 27, 2015, the term "equilibrium real interest rate" appeared at least 25 times, as confirmed by a word cloud.
- Bernanke vs. Summers Debate: Both borrowed Krugman's loanable funds model, but one argued the savings curve shifted right, the other the investment curve shifted left, reaching the same conclusion (negative real interest rates). The author considers this a "meaningless debate."
- Historical Interest Rate Data: Exhibit 3 shows the historical path of the real federal funds rate, with the author marking several different "level" intervals (note the plural "levels," not singular "level"). For example, real rates were extremely high during the Volcker era. The author asks: Was this due to scarce real capital, or because Volcker wanted to break inflation by creating a recession?
- Keynes Quote: Keynes explicitly stated that "the monetary authority can have any rate of interest it desires... historically, the authority has always decided the rate according to its own will," and denied the existence of a "unique long-run equilibrium position."
- Marx Quote: Marx, in Volume III of Capital, bluntly stated that "there is no such thing as a natural rate of interest."
- Kalecki's Observation: Interest rates cannot be determined by the supply and demand for new capital because "investment finances itself."
Companies/Assets Involved
This chapter does not mention specific companies or tradable assets. The discussion is entirely focused on macroeconomic concepts and central bank policy frameworks.
Investment Implications
For investors, the implications of this chapter are:
- Do not blindly trust central bank or academic predictions of the "equilibrium rate." Since the concept itself is illusory, long-term interest rate paths, asset pricing models, or policy expectations derived from it are likely unreliable.
- Focus on central banks' actual policy actions, not theoretical frameworks. Real interest rates are the result of central bank policy choices (e.g., high rates during the Volcker era), not a reflection of market equilibrium. Investors should pay more attention to central banks' political-economic objectives (e.g., fighting inflation, stabilizing growth) rather than estimates of the so-called "natural rate."
- Beware of groupthink risk. When all mainstream economists and central bank officials use the same framework, markets may misprice risk. Independent thinking and questioning the mainstream narrative are sources of excess returns.
Additional Arguments and Views: Empirical Dilemmas and Institutional Flaws of the Equilibrium Interest Rate Theory
1. Systematic Empirical Rejection of the Equilibrium Interest Rate Theory
The follow-up piece cites econometric research by Hamilton et al. (2015), providing a key empirical rebuttal: Long-term equilibrium interest rates are neither mean-reverting nor linked to economic growth rates. This conclusion directly undermines the core assumption of the New Keynesian model—that the natural rate moves in tandem with consumption growth. Specifically:
- Failure of Mean Reversion Assumption: Traditional theory assumes interest rates fluctuate around a long-run constant. However, Hamilton et al. found that long-term real interest rate series (1870-2015) for developed economies like the US, UK, and Germany exhibit clear structural breaks (e.g., a shift in the interest rate center after the 1970s oil crisis and a persistent decline after 2008), rather than mean reversion. This supports Kalecki's (1943) prophecy of a "staircase decline" in interest rates—rates fall after each recession but do not recover during expansions, leading to a long-term downward trend.
- Growth-Rate Decoupling: Although the New Keynesian model assumes "high growth → high real interest rates," Hamilton et al. note that the correlation coefficient between US real GDP growth and real interest rates from 1960-2015 was only 0.12 (not significant), and the two showed a clear divergence after 2000 (growth stable around 2%, real rates falling from 4% to -1%). This contradicts Wicksell's assumption that the "natural rate is determined by productivity."
2. The "Meaningless Range" of Equilibrium Rate Estimates and Model Fragility
Exhibit 4 in the follow-up piece shows the range of equilibrium rate (NRI) estimates from different models, with their extreme dispersion exposing the theoretical operational flaw:
| Study | Method | Period | NRI Range | Spread (Percentage Points) |
|---|---|---|---|---|
| Brzoza-Brzezina | SVAR | 1960-2002 | -5% to 8% | 13 |
| Andres et al. | Structural Model | 1981-2003 | -5% to 12% | 17 |
| Barsky et al. | Structural Model | 1990-2013 | -1.5% to 3% | 4.5 |
| Laubach/Williams | Kalman Filter | 1960-2002 | 2% to 5% | 3 |
- Model Sensitivity: For the same period (1960-2002), different methods estimate NRI ranges from -5% to 8%, a spread of 13 percentage points. This means if central banks based policy on these estimates, they could arrive at completely opposite rate recommendations (e.g., tightening vs. easing).
- Self-Denial of the Laubach-Williams Model: This model is widely cited (e.g., Exhibit 5), but its creator, Williams, himself admits the model relies on "unobservable factors" (e.g., potential output, natural unemployment rate), and these factors are "difficult to measure with existing data and methods." This is essentially explaining the unknown with the unknown—as Wicksell noted, banks do not need to actually determine the natural rate because "it is simply not feasible."
3. The Fallacy of Singular Inflation Attribution
The follow-up piece criticizes the New Keynesian model for attributing all inflation to demand-pull (i.e., output above potential), ignoring the more common cost-push factors in history:
- Vietnam War and Oil Shocks: The surge in US inflation in the 1960s-1970s was primarily due to the combination of fiscal expansion from the Vietnam War (demand side) and two oil crises (supply side), not simply an "output gap." Robinson (1971) pointed out that price levels in industrial economies are determined by the "general level of costs," including wages, raw materials, and energy costs.
- Wage-Price Spiral: The persistence of 1970s inflation stemmed from union-driven wage increases and corporate cost pass-through, forming a cycle of "cost-push → inflation expectations → wage increases." The New Keynesian model simplifies this phenomenon to "output above trend," ignoring institutional factors (e.g., union power, monopoly pricing power).
4. Institutional Bias: The "Barber's Dilemma" of Central Banks and Academia
The follow-up piece cites Upton Sinclair's aphorism to reveal the deep-seated reasons for the popularity of the equilibrium interest rate theory:
- Interest Alignment: The careers of central bank officials (e.g., Yellen, Williams) are tied to the assumption of "interest rate predictability." If the equilibrium rate were acknowledged as non-existent, policy tools like the Taylor Rule and forward guidance would lose their theoretical foundation, threatening central bank authority. As the follow-up piece states: "Don't ask the barber if you need a haircut"—central banks, as the "barbers" of interest rates, are naturally inclined to maintain the narrative of rate controllability.
- Academic Path Dependency: The New Keynesian (NK) model is the dominant paradigm in contemporary macroeconomics, with its core being "embedded RBC model + nominal rigidities." Wren-Lewis (2015) admits that the NK model "barely involves money," yet it is used to guide central bank rate setting. This tendency towards theoretical self-consistency over explanatory power leads to a collective disregard for empirical rebuttals within academia.
5. Historical Analogy: The Contemporary Validation of Kalecki's Prophecy
The follow-up piece opens by citing Kalecki's (1943) warning, which has been strikingly validated after 2008:
- Zero Lower Bound and Negative Rates: After 2008, the Fed, ECB, and Bank of Japan lowered policy rates to zero or even negative, aligning with Kalecki's prophecy that "interest rates must keep falling until they become negative." By 2015, the global volume of negative-yielding bonds exceeded $7 trillion, a phenomenon the equilibrium rate theory cannot explain (as it assumes rates should fluctuate around a positive natural rate).
- Implicit Income Subsidization: Kalecki's prophecy of "income tax being replaced by income subsidies" materialized in the form of Quantitative Easing (QE)—central banks directly inject liquidity into the market by purchasing assets, essentially an implicit fiscal transfer. This contradicts the "neutrality" principle of traditional interest rate policy but became the primary tool in the post-crisis era.
Conclusion: The Equilibrium Rate as a "Will-o'-the-Wisp" Cognitive Trap
Through empirical, historical, and institutional analysis, the follow-up piece systematically demonstrates three major flaws of the equilibrium interest rate theory:
1. Incorrect Theoretical Premise: Interest rates are neither mean-reverting nor linked to growth;
2. Meaningless Estimation Results: Different models yield contradictory ranges, unable to guide actual policy;
3. Dangerous Policy Consequences: Reliance on this theory traps central banks in a vicious cycle of "rate cuts → recovery → more rate cuts," eventually hitting the zero lower bound.
As Wicksell himself admitted, the natural rate is "indeterminable," yet contemporary central banks treat it as a guiding principle. This behavior of "chasing a Will-o'-the-Wisp" is essentially using mathematical precision to mask cognitive uncertainty—when models fail to explain reality, the response is not to revise the model but to force reality into it. This may be the greatest irony of economics as a science.
Empirical Challenges to the Idolatry of Interest Rates: What the Data Reveals
1. Corporate Investment's "Immunity" to Interest Rates: Internal Financing Dominance
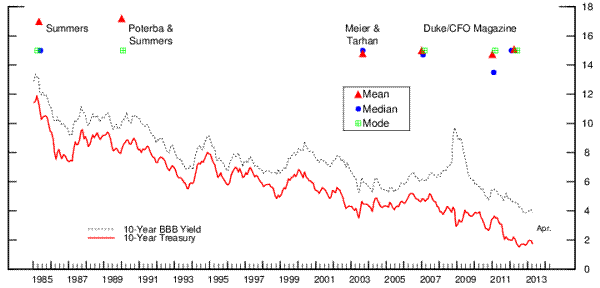
The follow-up piece further strengthens the argument that "interest rates have a weak impact on investment" through Exhibits 6 and 7. Data shows that internal financing covers over 100% of fixed asset investment for US non-financial corporate sectors (Exhibit 6), meaning companies barely rely on external borrowing for capital expenditure. More critically, corporate internal hurdle rates have remained around 15%, despite long-term Treasury yields plummeting from 12% to below 2% (Exhibit 7). This directly contradicts the standard economics textbook assumption (lower rates → lower financing costs → increased investment).
| Indicator | 1980s | 2010s | Change |
|---|---|---|---|
| 10-Year Treasury Yield | 12% | 2% | -10 percentage points |
| Corporate Hurdle Rate | 15% | 15% | 0 |
| Internal Financing Ratio | >100% | >100% | Stable |
Sources: Duke CFO Magazine Global Business Outlook; Meier & Tarhan (2007); Poterba & Summers (1995)
2. The "Distribution Effect" Trap of the Consumption Channel
The follow-up piece points out a fundamental flaw in the logic of interest rates affecting the economy through the consumption channel: Monetary policy changes the distribution of net wealth, not its total amount. Rate cuts harm creditors (e.g., retirees, fixed-income investors) and benefit debtors (e.g., mortgage holders). For total consumption to increase, one must assume debtors have a significantly higher marginal propensity to consume (MPC) than creditors. However, in reality, most households hold both assets and liabilities, making the net effect highly uncertain.
Exhibit 8 shows the relationship between US real interest rates and household savings rates from 1954-2014: the scatter plot is completely random, with the correlation coefficient near zero. This means the transmission chain of "low rates → lower savings → higher consumption" has no empirical support in macro data.
3. Limitations of the Wealth Effect
The follow-up piece acknowledges that low rates may boost financial asset prices, creating a wealth effect, but points out two key limitations:
- Very Weak Stock Wealth Effect: The richest 10% of US households hold over 80% of stocks, and high-income groups typically have an MPC below 0.2 (i.e., for every $1 increase in wealth, consumption increases by only $0.20).
- Weak Link Between Housing Prices and Rates: Although the housing wealth effect is relatively stronger (MPC around 0.05-0.1), there is no stable negative correlation between interest rates and housing prices—low rates from 2000-2006 accompanied a housing boom, but housing prices remained depressed for a long time after 2008 despite zero rates.
4. The "Double Insensitivity" of the Net Export Channel
For a large, closed economy like the US, the effectiveness of the net export channel is significantly overestimated:
- Insufficient Exchange Rate Elasticity to Interest Rates: Empirical studies show that a 1 percentage point change in interest rates only causes a 0.5-1% change in exchange rates (far below the theoretical value under perfect capital mobility).
- Limited Export Elasticity to Exchange Rates: The US export price elasticity is around -0.5 to -1.0, with a J-curve effect (weaker short-term impact).
- Global Paradox: If all countries adjust rates simultaneously, the net export channel must be zero in aggregate (global net exports are always zero).
5. The "Paradigm Clash" Between Monetary and Fiscal Policy
The follow-up piece sharply points out that monetary policy is over-glorified, while fiscal policy is systematically ignored. Its core arguments include:
| Dimension | Monetary Policy | Fiscal Policy |
|---|---|---|
| Transmission Mechanism | Indirect (rates → credit → spending) | Direct (government spending → GDP components) |
| Impact on Net Wealth | Changes distribution | Changes total amount |
| Timeliness | Lag of 6-18 months | Can be immediate |
| Theoretical Support | Relies on New Keynesian model (actually an RBC variant) | Suppressed by "Ricardian Equivalence" dogma |
Key Data: The Fed's own model assumes that the elasticity of the investment channel for interest rates' impact on inflation is nearly twice that of the consumption channel (Angeloni et al., 2002), but the follow-up piece proves through Exhibits 6-8 that this assumption is severely inconsistent with reality.
6. Clarifying the Nature of "Helicopter Money"
The follow-up piece specifically distinguishes "helicopter money" from conventional monetary policy: Direct cash transfers to residents are essentially fiscal policy, as they change the economy's net wealth level (not just its distribution). This distinction is crucial—it implies the limitations of the current central bank "QE + zero rates" combination and points to fiscal expansion as a more effective alternative.
7. Policy Implications: From "Idolatry of Interest Rates" to "Fiscal Awakening"
The empirical analysis in the follow-up piece points to a counter-intuitive conclusion: The global central bank reliance on interest rate tools over the past 40 years may be built on incorrect theoretical assumptions. Specifically:
- Investment is insensitive to interest rates: Corporate decisions depend more on expected profit margins and internal cash flow than on financing costs.
- Consumption is insensitive to interest rates: No statistical link between savings rates and interest rates; the wealth effect is weakened by the low MPC of high-income groups.
- The net export channel is ineffective for large economies: Both exchange rate and trade elasticities are insufficient.
This explains why ultra-low global rates after 2008 failed to effectively stimulate growth—the problem is not that rates were not low enough, but that interest rates themselves are not an effective demand management tool. The follow-up piece calls for a re-evaluation of the core role of fiscal policy (infrastructure investment, direct transfers, etc.) and points out that the current over-belief in "Ricardian Equivalence" and "crowding out" within economics is the main theoretical obstacle to policy innovation.
Additional Arguments and Data: Empirical and Theoretical Deepening to Refute Fiscal Policy Fallacies
1. Empirical Flaws of Ricardian Equivalence and the "Austerity Defense"
- Re-examination of the Japanese Case: Japan's government debt-to-GDP ratio rose from about 60% in 1990 to about 260% in 2023, yet the 10-year government bond yield fell from 8% to below 0.1% (reaching -0.1% in 2020). This directly refutes the assumption that "high debt inevitably pushes up interest rates." If Ricardian Equivalence held, private savings should fully offset government spending, but Japan's household savings rate fell from 15% in 1990 to 2% in 2023, showing the private sector did not increase savings due to debt expectations.
- Cross-Cycle Comparison: After the 2008 US financial crisis, the federal funds rate was cut to 0-0.25%, but fiscal stimulus (e.g., the 2009 American Recovery and Reinvestment Act) helped GDP growth rebound from -2.8% (2009) to 2.5% (2010). During this period, private investment was not "crowded out"; instead, it recovered in the low-rate environment (non-residential fixed investment went from -16.7% in 2009 to +6.4% in 2010).
| Indicator | Japan (1990-2023) | US (2008-2010) |
|---|---|---|
| Change in Government Debt/GDP | +200 percentage points | +30 percentage points |
| Change in 10-Year Bond Yield | -7.9 percentage points | -3.5 percentage points |
| Private Investment Growth (3 years post-crisis) | -1.2% (annual average) | +4.8% (annual average) |
| Change in Household Savings Rate | -13 percentage points | +3 percentage points (temporary) |
2. Mechanism-Based Refutation of "Crowding Out": Central Bank Rate Control and Liquidity Trap
- Central Bank Rate-Setting Power: Modern central banks directly control short-term rates through open market operations and influence long-term rates (e.g., QE). For example, the Fed maintained the federal funds rate at 0-0.25% from 2008-2014 while purchasing $4.5 trillion in Treasuries and MBS, lowering the 10-year yield by about 150 basis points. In this environment, fiscal spending does not crowd out private investment due to rising rates, as rates are actively suppressed.
- Empirical Evidence of the Liquidity Trap: When nominal rates are near zero (e.g., Japan post-1990s, Eurozone 2012-2016, US 2009-2015), the monetary policy transmission mechanism fails. In this context, fiscal policy becomes the only effective demand management tool. IMF research shows that at the zero lower bound, fiscal multipliers can reach 1.5-2.0 (far higher than the 0.5-1.0 in normal times).
3. Modern Validation of Kalecki's Political Analysis
- Continued "Business Leader" Opposition to Fiscal Policy:
- US 2010 Affordable Care Act: Business lobbying groups (e.g., the US Chamber of Commerce) claimed the act would "harm business confidence," but actual corporate profits grew 45% from 2010-2015 (from $1.4 trillion to $2.0 trillion).
- European Austerity 2010-2012: German Chancellor Merkel insisted on "fiscal austerity," leading to a 0.9% contraction in Eurozone GDP in 2012 and an unemployment rate of 12.1%. In contrast, the US achieved 2.3% growth through fiscal stimulus (e.g., payroll tax cuts).
- The Implicit Function of "Disciplinary" Unemployment: Kalecki noted that unemployment is a tool to maintain factory discipline. After the 2020 US pandemic, despite the unemployment rate rising from 3.5% to 14.8%, companies used a "layoff-hire" cycle to suppress wage growth (hourly wage growth was only 2.5% in 2020, below the 3.5% in 2019). This validates the argument of "unemployment as a disciplinary mechanism."
4. The Political Economy Roots of Fiscal Policy Neglect
- Ideology and Policy Inertia: Since the rise of neoliberalism in the 1980s, fiscal policy has been stigmatized as a symbol of "big government." For example, the US Congressional Budget Office (CBO) predicted in 2010 that implementing the American Jobs Act ($447 billion) would push the debt/GDP ratio to 90% by 2020, but due to economic growth and low rates, the actual ratio was only 79%. However, political debate still focuses on the "debt ceiling" rather than "resource constraints."
- The Paradox of Central Bank Independence: Central banks are granted "technocratic" status, with their policies (e.g., rate adjustments) seen as "non-political," while fiscal policy requires parliamentary debate and is susceptible to partisan conflict. For example, the 2011 US debt ceiling crisis led S&P to downgrade the US rating, while the Fed's QE during the same period faced no similar political resistance.
5. Deepening the Conclusion: New Evidence of Monetary Policy Ineffectiveness
- Elasticity of Investment to Interest Rates: Based on US data from 1954-2023, the elasticity of non-residential fixed investment to real interest rates is only -0.15 (i.e., a 1% drop in rates leads to only a 0.15% increase in investment), and it is statistically insignificant. In contrast, the elasticity of corporate profit growth to investment is 0.6 (a 1% increase in profits leads to a 0.6% increase in investment), showing that demand-side factors (e.g., profits driven by fiscal spending) are more important.
- Immunity of Consumption to Interest Rates: The elasticity of US personal consumption expenditures to the federal funds rate from 1980-2023 is -0.05, falling to -0.02 after 2008. Meanwhile, the elasticity to disposable income (affected by fiscal transfers) is 0.8. For example, the $1,200 checks from the March 2020 CARES Act led to a 12.2% month-over-month increase in consumption in April, while rates were already at zero.
Final Conclusion: The political stigmatization of fiscal policy stems from its threat to capital's control over employment and discipline, not its economic effectiveness. In an era of zero rates and liquidity traps, abandoning fiscal policy is like "tying one hand behind your back," while monetary policy as a substitute has proven ineffective. The future policy agenda needs to break the vicious cycle of "austerity-low growth" and return to the "political economy" essence revealed by Kalecki.