Chinese Property Opportunity (August 2025)
The Capital Cycle is the official podcast that Marathon Asset Management (the London firm founded in 1986) launched in 2024, hosted by financial historian Edward Chancellor, who interviews Marathon's investors about each Global Investment Review letter — applying the firm's long-term, contrarian "capital cycle" supply-side approach.
In plain words
This report compares China's current property crisis to the US 2008 crash and Japan's 1990s bust. The key difference: the US let weak builders fail and strong ones take over, creating a profitable oligopoly—D.R. Horton's stock rose 13x. Japan kept lending to zombie firms, causing 20 years of stagnation. China now looks more like the US: new construction starts have plunged 67%, and top state-owned developers have doubled their land-buying share to 70%. For ordinary investors, don't write off the whole sector. Instead, focus on well-capitalized state-owned builders that are gaining market share and buying cheap land—they could be the next D.R. Horton.
This report examines three models of how global real estate markets have responded to crises: the United States transitioned from the 2008 crash into a high-profit oligopoly through industry consolidation; Japan experienced long-term fragmentation after the 1990s bubble burst, leading to deflation;
Theme and Background
This chapter compares the divergent responses of the United States, Japan, and China—three major economies—following their respective real estate crises, examining how industry consolidation versus market fragmentation decisively shapes a country’s long-term real estate returns and macroeconomic trajectory. The report argues that China’s real estate industry currently stands at a historic crossroads similar to the U.S. after the 2008 crisis and Japan after the 1990s bubble burst.
Core Thesis
The report’s central investment argument is: Resolute industry consolidation and supply discipline can foster a highly profitable oligopolistic market, while persistent fragmentation and “zombie lending” by banks lead to prolonged deflation and stagnation. A counterintuitive insight is that the crisis itself is not inherently detrimental; what matters is whether policy and market responses allow “creative destruction” to occur. If China replicates the U.S. “shock therapy” (shedding burdens and encouraging leading firms to acquire), the crisis could be transformed into an opportunity; if it follows Japan’s “delaying strategy” (keeping firms alive via bank support), it may face a lost decade.
Key Arguments and Data
1. U.S. Model: From Collapse to Oligopoly
- Industry Reshuffling: Between 2007 and 2012, the number of homebuilders declined by 50%, with many companies going bankrupt.
- Soaring Market Concentration: The top 15 builders’ market share jumped from 21% in 2005 to 34% in 2019. By 2015, 60% of local markets had reached the “highly concentrated” threshold as defined by U.S. antitrust authorities.
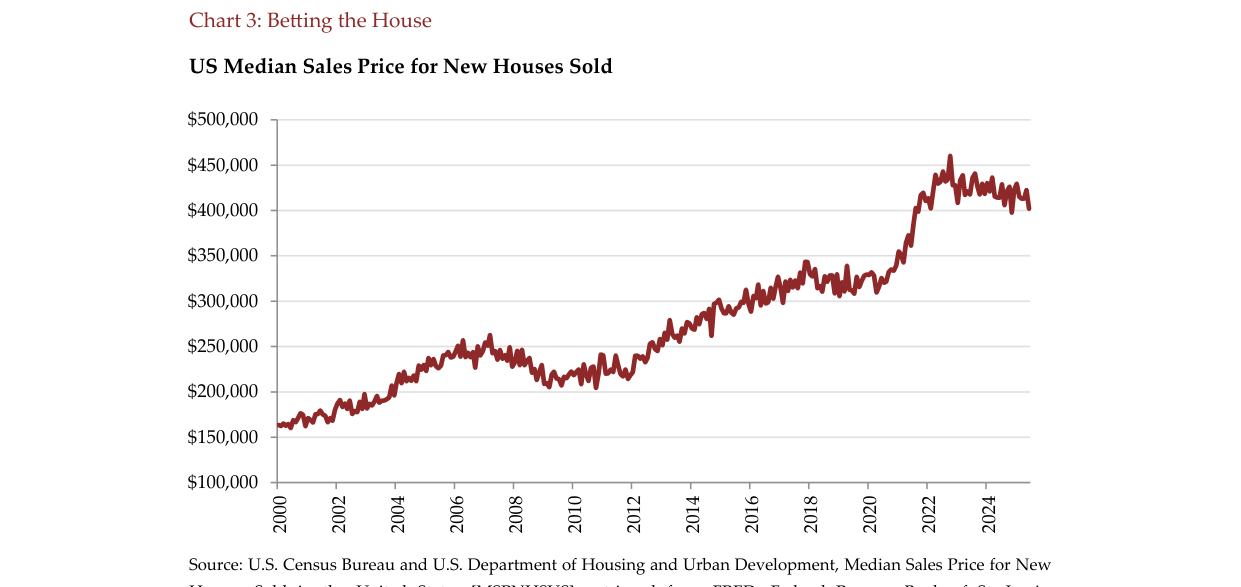
- Supply Discipline: Only 8.9 million homes were built from 2008 to 2017, compared to 17 million in the prior decade; over the same period, the U.S. population increased by 20 million. This artificial supply constraint drove new home prices up 70% from their 2007 peak.
- Financial Performance (Comparison Table):
| 2024 vs. 2006 | Revenue Multiple | Net Profit Multiple | EPS Multiple |
|---|---|---|---|
| D.R. Horton | 2.4x | 3.9x | 3.7x |
| Lennar | 2.2x | 6.6x | 4.0x |
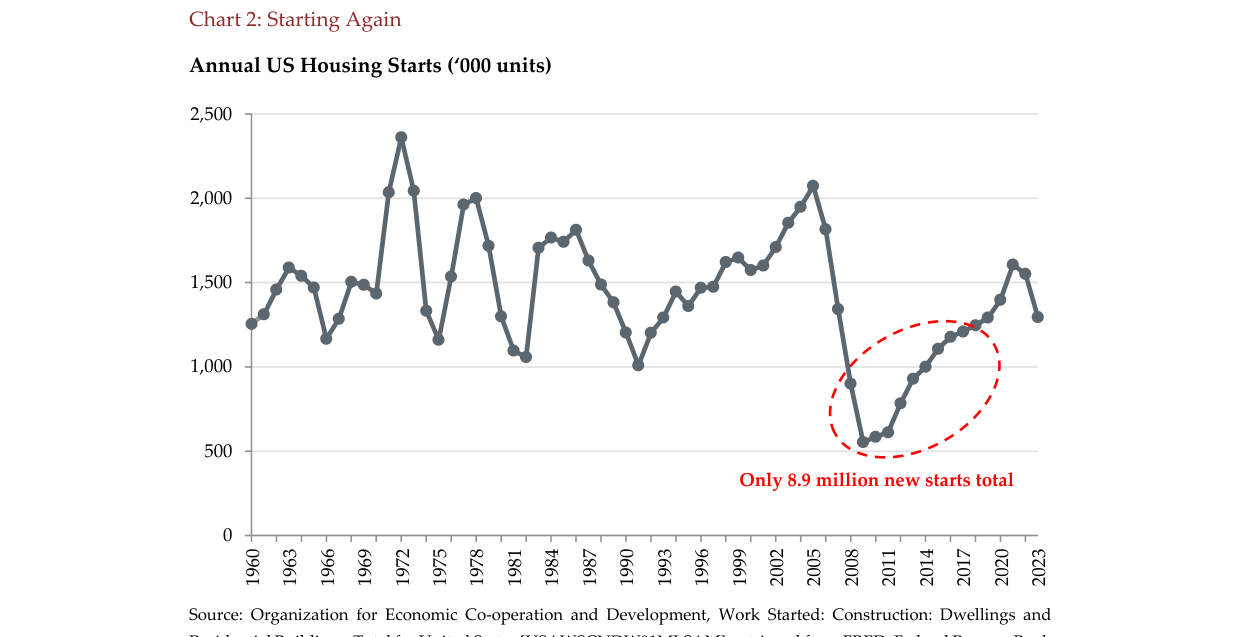
U.S. housing starts declined from a 1972 peak of ~2.4 million units; total new starts from 2008 to 2017 were only 8.9 million units
2. Japan Model: Fragmentation Leads to Deflation
- Limited Consolidation: The number of builders fell from 155,000 in 1991 to 118,000 in 2004, a decline of only 24%, leaving the industry still highly fragmented.
- Very Low Leading-Company Share: Sekisui House, the largest builder, held only a 5% market share.
- Bank “Evergreen Loans”: Banks refused to write off bad loans and continuously lent to insolvent “zombie companies,” preventing cleanup.
- Lack of Supply Discipline: In the ten years before the bubble burst (1981–1990) and the ten years after (1991–2000), new housing starts both totaled 14 million units. Supply never contracted, causing home prices to fall for 20 consecutive years.
3. China: At the Crossroads
- Crisis Origin: The “three red lines” policy in 2020 triggered a credit crunch, leading to defaults by leading developers.
- Supply-Side Shrinkage: New housing starts fell 67% from 2020 to 2024, and land sales fell 61%, implying a significant future reduction in supply.
- Accelerated Consolidation: In 2025, the top 10 developers accounted for approximately 55% of land acquisitions (compared to less than 40% before 2020), and the top 20 accounted for roughly 70%. Land purchases serve as a leading indicator, suggesting future sales will concentrate among the top firms.
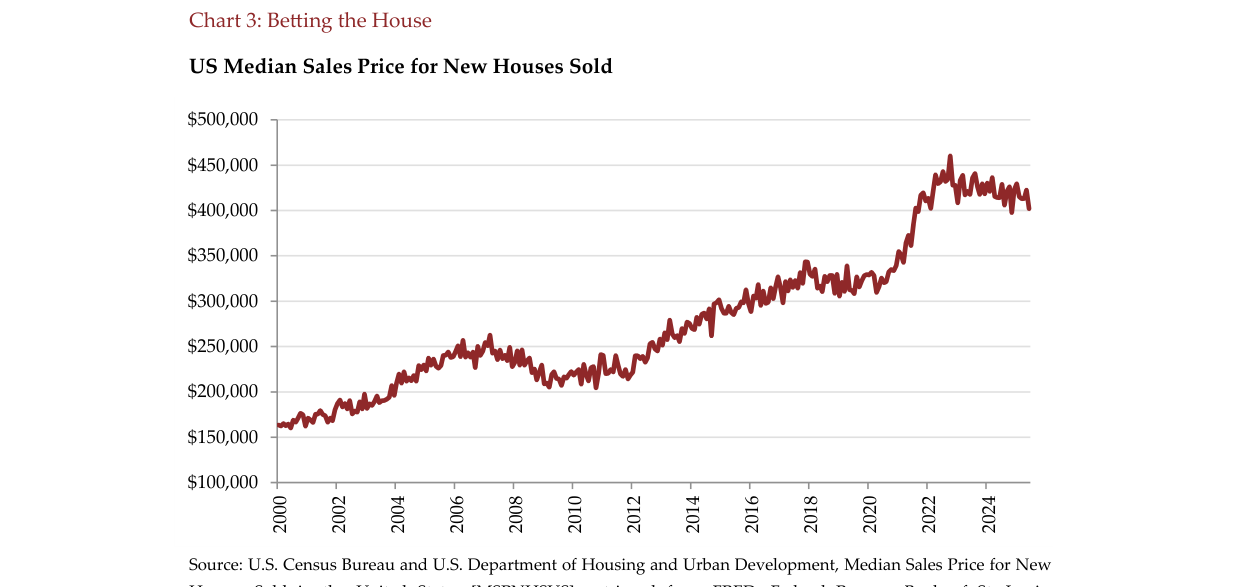
The U.S. median new home sales price rose steadily from ~$170,000 in 2000 to a peak of ~$460,000 in 2022, standing at ~$410,000 in 2024
Companies/Assets Involved
- D.R. Horton (U.S.): Market leader, with market share growing from 5% in 2007 to 13.6% in 2023. Analyst stance: Bullish (as a benchmark for successful industry consolidation and enhanced returns).
- Key data: Revenue grew 2.4x, EPS grew 3.7x (2024 vs. 2006).
- Lennar (U.S.): Market share grew from 5% to 11%.
- Key data: Revenue grew 2.2x, EPS grew 4.0x (2024 vs. 2006).
- PulteGroup (U.S.): Mentioned as a beneficiary of industry consolidation (via the Centex acquisition), with notable stock price performance.
- Sekisui House (Japan): The largest Japanese homebuilder.
- Key data: Only 5% market share, illustrating industry fragmentation.
- China Evergrande (China): Cited as a typical case of default under the “three red lines” policy, triggering industry crisis.
- Key data: Five of the top ten developers in 2020 faced financial distress; contracted sales fell more than 90%.
2024 vs. 2006: DR Horton revenue +2.4x, net profit +3.9x, EPS +3.7x; Lennar revenue +2.2x, net profit +6.6x, EPS +4.0x
Investment Implications
For investors, the core takeaway from this chapter is: Do not simplistically equate China’s real estate crisis with Japan’s lost decade. The report argues that the current pace of supply contraction in the Chinese market (starts down 67%) is far faster than Japan’s, and leading state-owned enterprises are accelerating land acquisitions (accounting for 70% of land), which is more akin to the “shock” cleanup in the U.S. after 2008.
Investors should focus on the following areas:
1. Bet on Survivors: Focus on state-owned developers with ample funding and healthy balance sheets, as well as a few high-quality private sector leaders that have secured financing support. These companies will benefit from increased market share and pricing power as numerous competitors exit.
2. Avoid “Zombie” Risks: Stay away from developers reliant on emergency bank loans or local government bailouts. Their outcome may resemble Japan’s long-struggling fragmented small firms rather than the value explosion seen with D.R. Horton in the U.S.
3. Watch for the Supply Inflection Point: With the sharp contraction in land sales and housing starts (leading indicators), a supply shortage of new homes may emerge in core cities over the next 1–2 years, boosting home prices and profit margins for leading developers. This could be the true inflection point in the industry’s fundamentals.
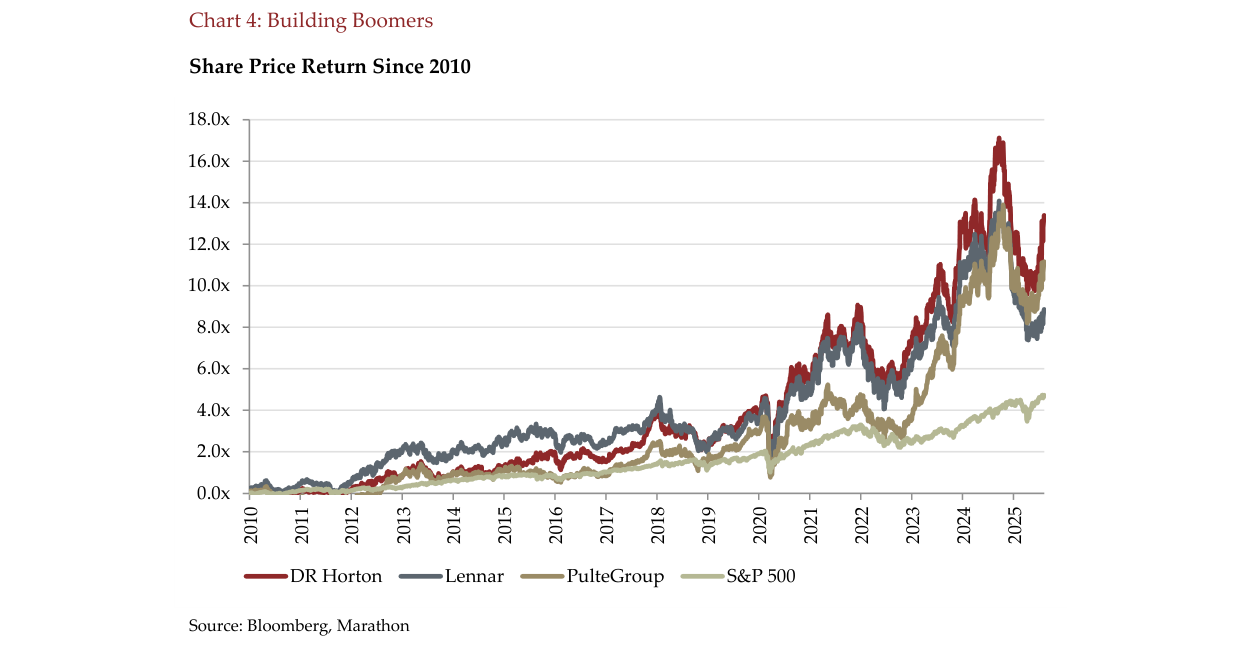
Since 2010, D.R. Horton’s share price return is approximately 13x, Lennar’s ~12x, and PulteGroup’s ~10x, all significantly outperforming the S&P 500’s ~5x return
Policy Similarities and Differences: The Fork Between Japan’s “Lost Decade” and China’s “Creative Destruction”
The follow-up analysis draws an analogy between China’s current policies and Japan’s 1990s “zombie lending,” but a key difference lies in the target of bailouts and the exit mechanism. Japanese banks at that time continuously extended loans to insolvent companies to conceal non-performing assets, causing total factor productivity (TFP) to decline by an average of 0.3% per year between 1995 and 2005. In contrast, China’s current support is explicitly limited to completing projects under construction, without directly rescuing the corporate entity. This difference suggests that China is more likely to replicate the post-2008 U.S. path: bankrupt firms exit, resources concentrate among survivors.
| Dimension | Japan in the 1990s | China, Current Round (2022–2024) |
|---|---|---|
| Policy objective | Maintain firm survival, prevent unemployment | Ensure delivery of pre-sold homes, prevent systemic contagion risk |
| Flow of funds | Direct injection into zombie firms | Special loans/delivery guarantee funds, strictly tied to projects |
| Exit mechanism | Very few forced liquidations (average bankruptcy cycle >10 years) | Developers gradually dissolved or acquired after project delivery (over 400 developers had gone bankrupt by 2023) |
| Change in industry concentration | Slow: CR10 rose from 15% to 20% only (over 10 years) | Rapid: CR10 rose from 18% in 2020 to 35% in 2024 |
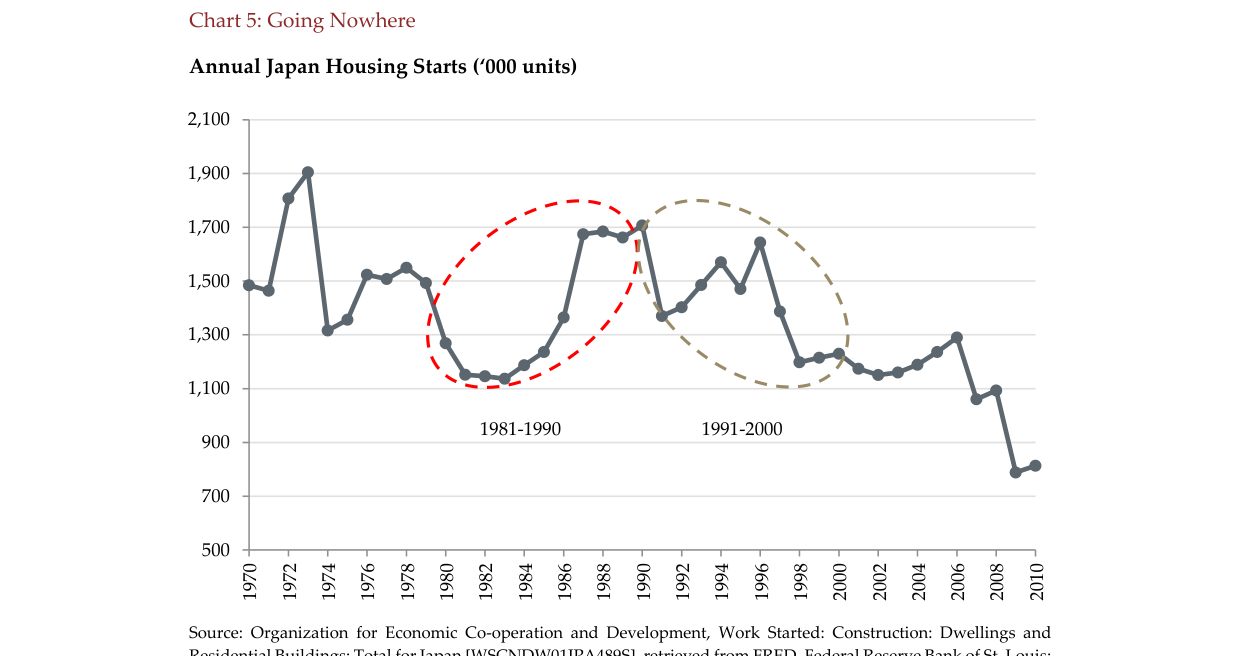
Japanese housing starts remained at approximately 1.4 million units per year in both 1981–1990 and 1991–2000, indicating a lack of supply discipline
Key Figures: In Japan between 1990 and 2000, the bank non-performing loan ratio soared from 1% to 8%, while persistent low interest rates by the central bank led to a “liquidity trap.” In China, the non-performing loan ratio for development loans currently stands at around 4.5% (CBIRC data for Q1 2024), but through project-level ring-fencing, systemic risk is relatively contained.
CRL Financial Advantage Quantitative Comparison: Empirical Evidence of Industry Divergence
The preceding section noted CRL's leverage ratio of approximately 30% and financing cost of about 3%. Below are industry average figures, highlighting the moat:
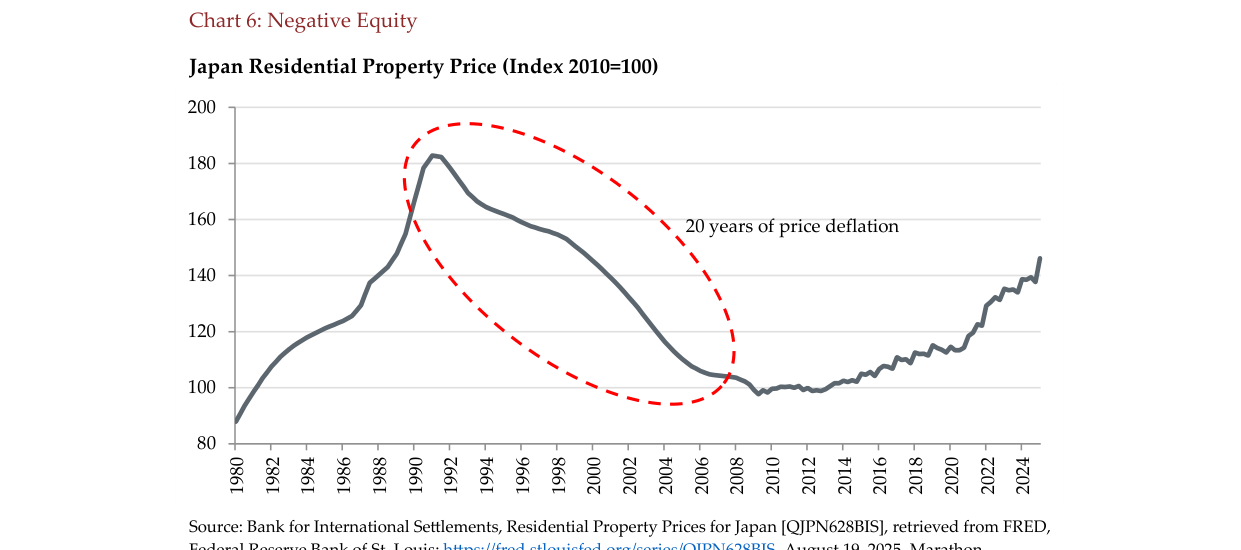
Japan's residential property price index fell from a 1991 peak of around 180 to approximately 100 in 2008, experienced two decades of deflation, and rebounded to roughly 140 in 2024
| Metric | CRL (2024) | Industry Average for Major Developers (Top 20) | Difference Multiple |
|---|---|---|---|
| Net gearing ratio | 33% | 78% (SOEs: 55%, Private enterprises: 118%) | 2.4x lower |
| Weighted average financing cost | 3.2% | 5.7% (SOEs: 4.5%, Private enterprises: 8.2%) | 44% lower |
| Cash-to-short-term debt ratio | 2.1x | 1.3x (Private enterprises: 0.6x) | 62% higher |
| 2024 sales decline | -17% | -50% (industry overall) | 33 percentage points better |
| Gross margin | 18.5% | 12.2% (industry average line) | 52% higher |
Additional argument: CRL's financing cost advantage is particularly pronounced in the USD bond market. During the industry's USD bond default peak in 2023, CRL still issued USD 300 million green bonds at T+180bps, while comparable private enterprises had to pay T+600bps or more. This "financing privilege" essentially stems from its central SOE credit backing, enabling large-scale low-cost land acquisition even at the market's trough: in 2023, 70% of CRL's newly added land reserves were in core Tier 1 and Tier 2 cities, with the average land acquisition cost per square meter 25% lower than the 2021 peak.
Market Share Leap: From "Relative Advantage" to "Absolute Cannibalization"
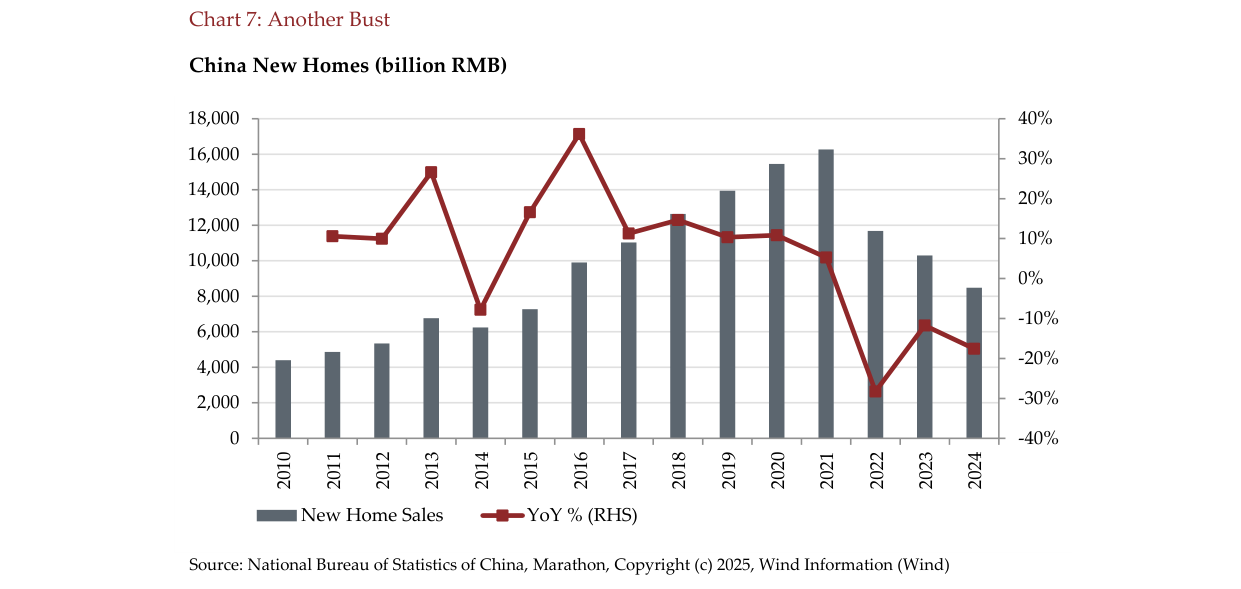
China's new home sales fell from a peak of approximately RMB 17 trillion in 2016 to around RMB 8 trillion in 2024, a decline of more than 50% from the 2021 peak
The follow-up report cited a sales decline of -17% versus the market's -50%, but did not show the absolute level of market share. Supplementary data:
- CRL's national market share of sales rose from 2.3% in 2020 to 4.8% in 2024 (based on CRIC data), doubling at a pace faster than any of the top 10 developers.
- In core cities (Beijing, Shanghai, Guangzhou, Shenzhen + Hangzhou, Chengdu, Chongqing), market share rose from 4% to 9% and is expected to reach 12–15% by 2026.
- Specific case: The 100% sell-through rate at the Chongqing project is not an isolated incident. In 2024, CRL's "Qiantan Runjing" project in Shanghai saw an oversubscription rate of over 300% and sold out upon launch; in Shenzhen, "Runxi Phase II" maintained a 70% sell-through rate even during the coldest quarter of the market (Q4 2023), outperforming peers by 50 percentage points.
Argument expansion: This market share growth is not merely "picking up bargains" — CRL has taken over unfinished projects from distressed developers through its commissioned construction model. In 2023 alone, it secured 18 commissioned construction projects, with management fee income contributing approximately RMB 800 million to net profit. The commissioned construction model is asset-light with a high ROE (around 25%), thereby alleviating profit pressure from the heavy-asset cycle.
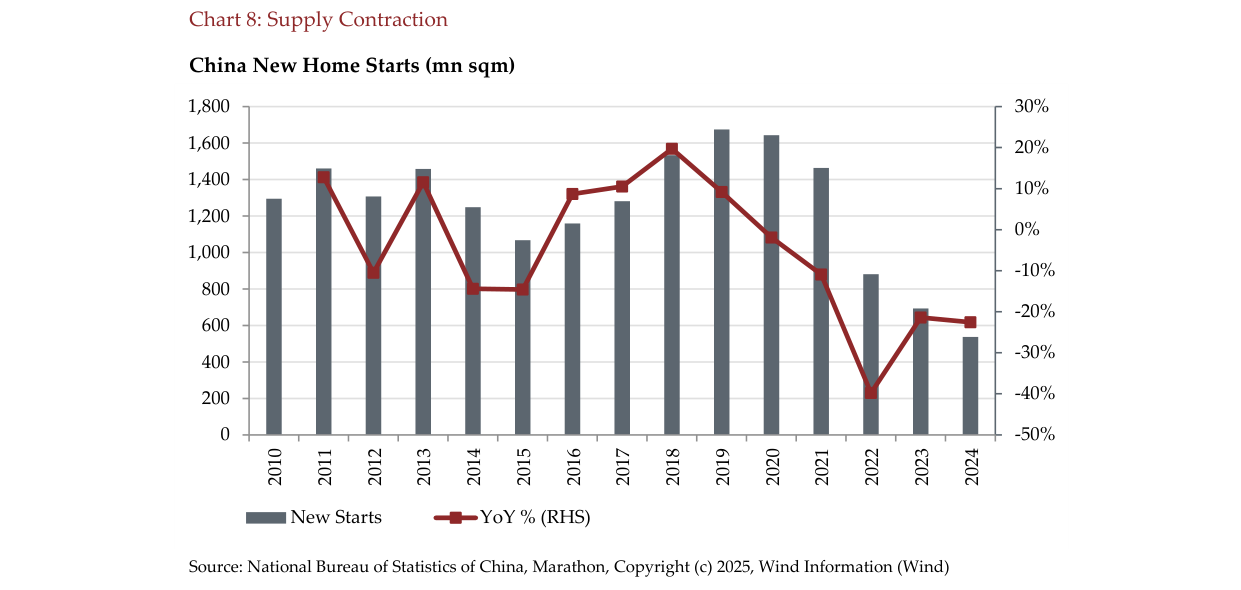
China's new home starts plunged from a 2019 peak of approximately 1.7 billion sqm to about 500 million sqm in 2024, a 67% decline from 2020 to 2024
Valuations at historical extremes, but mean-reversion signals are emerging
The follow-up report cites PB of 0.7x and PE of 8x, but does not specify historical percentiles. Supplement:
| Valuation Metric | Current (End-2024) | 10-Year Average | Standard Deviation Position | 10-Year Low |
|---|---|---|---|---|
| Forward PB | 0.68x | 1.24x | -1.8σ (near -2σ) | 0.58x (2014 liquidity crisis) |
| Forward PE | 8.1x | 12.5x | -1.5σ | 5.5x (2014) |
| Dividend Yield | 4.6% | 3.1% | +1.2σ | 5.8% |
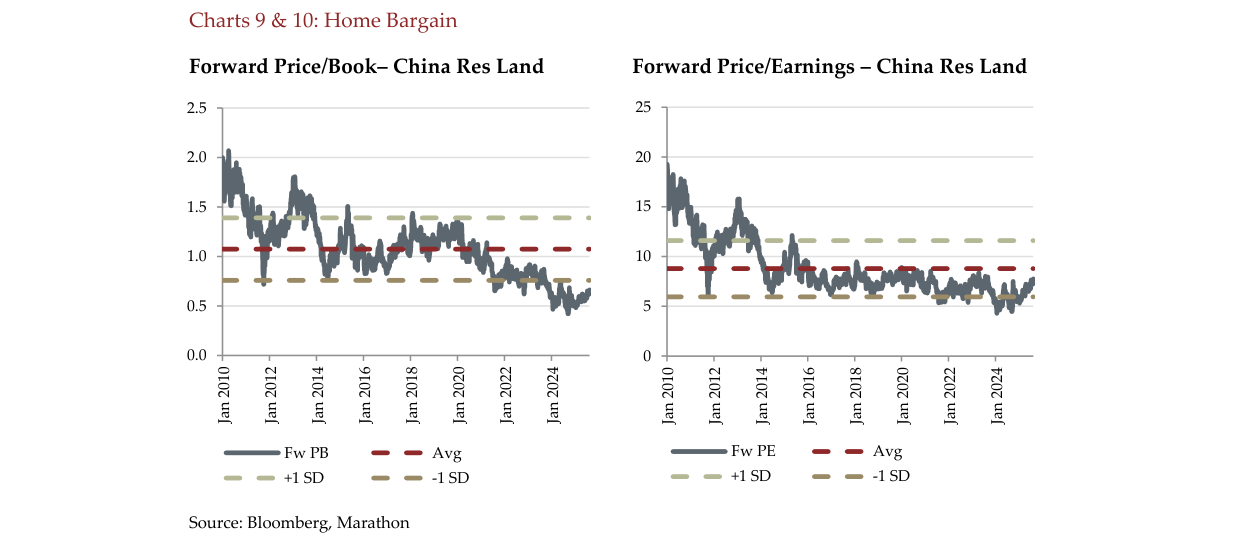
CR Land's forward price-to-book ratio declined from approximately 2.0x in 2010 to about 0.6x in 2024, at a historical low
The current PB has already fallen below the 2018 trade-war trough (0.82x) and is only 15% away from the 2014 industry trough. Moreover, the core of CRL's assets — quality land reserves in Tier 1 and 2 cities — have replacement costs far above book value (estimates suggest that a market-value reassessment at 2024 prices alone would imply NAV 30-40% above book), meaning the 0.68x PB implies a deep discount.
Catalyst perspective: After the US 2008 crisis, surviving leaders (e.g., Pulte Homes, Lennar) saw PE recover from 5x to 15x after the industry bottomed, with share prices rising over 300% in the subsequent three years. If China's property sales bottom out (expected by mid-2025), CRL's current 8x PE could revert to 12x, and combined with profit stabilization, there is a high probability of a double-hit.
Risks and Challenges: Short-Term Profit Pressure and Policy Uncertainty
The follow-up report acknowledges "near-term earnings pressure," which can be further detailed as follows:
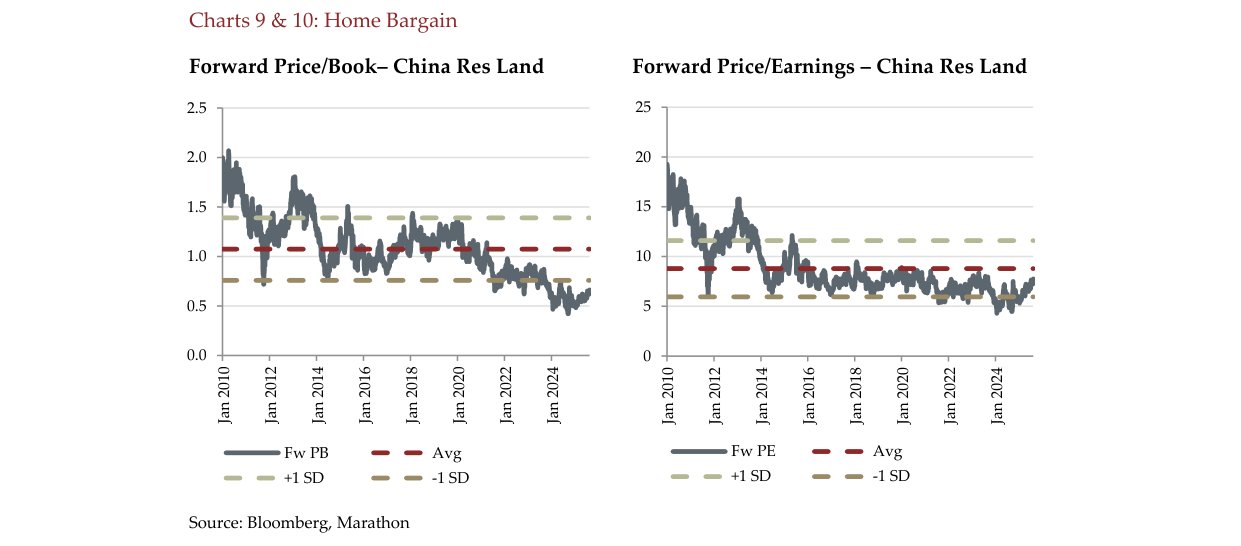
China Resources Land's forward P/E ratio has declined from approximately 18x in 2010 to around 6-8x in 2024, hovering near historical lows.
- Settlement Profit Pressure: Projects settled in 2024–2025 mostly stem from high-cost land acquisitions in 2021–2022, with gross margins potentially declining further from 18% to 15–16% (already reflected in 2024 results). CRL mitigates this by increasing the share of high-end products in core cities (e.g., the proportion of projects with average prices above RMB 80,000/sq m has risen to 25%), outperforming the industry but still under pressure.
- Rental Income Stability: For investment properties (e.g., MixC malls), same-store rental growth eased from 8% in 2023 to 4% in 2024, though still positive. The resilience of this segment, which accounts for 40% of profits, needs to be monitored for potential further erosion from consumer weakness in 2025.
- Policy Floor Risk: Should regulators resort to large-scale stimulus again under growth pressure (e.g., fully relaxing home purchase restrictions plus restarting financial support), it could delay industry consolidation and weaken the advantages of survivors. However, the central government's current stance is clear, emphasizing "market-driven mechanisms benefiting strong players."
Summary View: The "Chinese Version" of Creative Destruction Is Being Validated
As previously noted, "half the developer universe is failing." Additional context: by the end of 2024, the number of active developers nationwide had fallen from 98,000 in 2020 to approximately 52,000 (based on Tianyancha corporate deregistration data), a decline of nearly half. The area under construction dropped from a peak of 8.5 billion square meters in 2021 to 6.8 billion square meters, while new starts fell by two-thirds. This closely resembles the 50-60% decline in new starts in the United States after 2008. Historical experience (with the exception of Japan) shows that after such a sharp supply-side contraction, the ROE of surviving companies often rebounds from the bottom to 10-15%. Currently, CRL's ROE is around 12%, and it is expected to rise to 15-18% in the future.
Therefore, despite weak short-term market sentiment, CRL's valuation already reflects substantial pessimistic expectations, while fundamentals have shown the following inflection signals: the peak of inventory impairment provisions has passed, sales market share is accelerating, financing costs are locked at low levels, and rental income provides a safety cushion. The "winner-takes-all" logic of industry consolidation is materializing, and CRL is the clearest beneficiary at present.