Baillie Gifford UK & Balanced Funds ICVC Annual Report - January 2026
In plain words
This article sums up the annual report of two Baillie Gifford funds. In the year to January 2026, while AI hype lifted global markets, the Global Alpha Growth Fund returned only 2.7% versus 10.8% for world stocks, and its five-year record also missed its target — so the author is cautious. The report also made quiet rule changes: UK Equity Alpha Fund may now put up to 20% of assets in non-UK companies, and five funds dropped their "target return" promises. The author notes that audit and custodian sign-offs show compliance, not investment safety.
At a Glance
One-sentence summary: In a year when the AI boom drove global equity markets higher, the Baillie Gifford Global Alpha Growth Fund significantly underperformed its benchmark and target, and the author takes a clearly [cautious] stance on the fund's actual performance and governance transparency.
- Significant performance shortfall: For the year ended January 31, 2026, the Fund returned 2.7%, versus 10.8% for the MSCI ACWI over the same period, and 13.1% for the target (benchmark + 2%), lagging the benchmark by 8.1 percentage points.
- The five-year picture is even harder to defend: The Fund's five-year annualized return was only 3.7%, far below the stated target. The author notes that the narrative attributing the shortfall to "short-term market volatility" can hardly cover a five-year compounding gap.
- Substantive changes to mandates: The UK Equity Alpha Fund was permitted to invest up to 20% of its assets in non-UK companies, deviating from the pure UK strategy implied by its name; another five funds removed their Target Returns clauses.
- Governance transparency gaps: Compensation disclosures show that 29 Material Risk Takers received 94% of all disclosed compensation, while portfolio management is outsourced to a group entity outside the disclosure scope — a practice the author describes as "unable to withstand scrutiny."
- Both layers of oversight amount to "procedural compliance" rather than an "investment safety" guarantee: The auditor's unqualified opinion and the custodian's checklist-style duties are compliance templates, offering no customized disclosure tailored to the specific strategy risks of the sub-funds.
Company Overview and Articles Amendments in the Reporting Year
This chapter is the "About the Company" section at the start of the annual report. The core message is that, during and after the reporting period, the Company made substantive amendments to the investment objectives and investment policies of a number of funds, with UK Equity Alpha Fund being permitted to invest up to 20% of its assets in non-UK companies — the change with the broadest impact.
Fund Structure (as at 31 January 2026)
The Company is a Scottish-registered umbrella UK OEIC (registration number SI000008), regulated by the FCA's Collective Investment Schemes Sourcebook (COLL), and offers eight sub-funds. Each sub-fund is valued daily at a single price; different sub-funds apply different fee structures and subscription limits. Each sub-fund is classified as a UK UCITS retail scheme. As at the reporting date, no sub-fund holds shares in any other sub-fund (zero cross-holdings).
Amendments to Investment Objectives (effective 2 February 2026)
Following a review of the funds, the ACD, Baillie Gifford & Co Ltd, decided to remove Target Returns from the investment objectives of the following five funds, with effect from 2 February 2026:
- Baillie Gifford Global Alpha Growth Fund
- Baillie Gifford Global Alpha Paris-Aligned Fund
- Baillie Gifford International Fund
- Baillie Gifford UK and Worldwide Equity Fund
- Baillie Gifford UK Equity Alpha Fund
Amendments to Investment Policies
- Baillie Gifford UK Equity Alpha Fund (with effect from 2 February 2026): the investment policy was updated to better reflect the fund's investment strategy, adding flexibility to invest in non-UK companies, capped at 20%.
- Baillie Gifford Global Alpha Paris-Aligned Fund (with effect from 31 October 2025): the investment policy wording was updated to incorporate revenue-based investment exclusions and to set out the investment adviser's qualitative assessment process — the process used to evaluate the fund's alignment with the Paris Agreement.
Other Changes
- Baillie Gifford Global Alpha Growth Fund added a Class P Accumulation share class, launched on 15 May 2025.
Fees and Assessment of Value (regulatory requirement, briefly noted)
Under COLL 6.6.20R(1), the ACD must carry out an Assessment of Value for each UK-authorised sub-fund annually, considering at least seven criteria: quality of service, performance, AFM costs, economies of scale, comparable market rates, and comparable services and share classes. The ACD has selected 31 March as the reference date and publishes its conclusions (including any remedial measures taken) by 31 July each year. The most recent assessment, as at 31 March 2025, has been published on the website.
Note: Most of this chapter consists of regulatory boilerplate, such as the ACD's responsibilities statement, the Depositary's responsibilities statement, and auditor information. Among the changes above, the removal of Target Returns and the 20% non-UK investment cap for UK Equity Alpha Fund are substantive amendments to the funds' contractual terms that directly affect investor expectations — the latter in particular means the fund departs from the pure-UK strategy implied by its name. Readers should note this change.
The Depositary's Duties Checklist: From Principle-Based Obligations to Operational Constraints
In this continuation, the Depositary's duties are listed item by item, separated by semicolons — a checklist-style presentation worth noting. Unlike the principle-based wording of "supervise" and "ensure" in earlier UCITS directives, the current text breaks the duties down into verifiable, concrete actions:
| Area of responsibility | Specific verification point | Potential risk |
|---|---|---|
| Cash flow monitoring | Whether cash is booked to the cash account in accordance with regulations | Misappropriation of funds, delays in crediting |
| Share dealing | Whether issues, redemptions and cancellations comply with regulations | Subscription/redemption pricing errors, disorderly register records |
| Valuation | Whether the per-share value is calculated in compliance | Valuation deviation leading to distorted NAV |
| Consideration for asset transactions | Whether consideration is remitted to the Company within the normal time limits | Counterparty default, settlement delays |
| Application of income | Whether income is distributed in accordance with regulations | Interception or misallocation of income distributions |
| Execution of instructions | Whether AFM instructions are executed (unless conflicting with regulations) | Ultra vires operations, conflicts of interest |
This itemisation means the Depositary cannot simply rely on an abstract "reasonable care" defence; it must maintain an auditable chain of evidence. In practice, the Depositary typically outsources the above duties to an independent third party (such as a securities services provider), but the ultimate legal responsibility remains with the Depositary. This echoes the "unrestricted access" requirement for depositaries under the EU Alternative Investment Fund Managers Directive (AIFMD) — in the authorised-funds space, the Depositary's monitoring function is shifting from passive compliance to active verification.
Auditor's Report: The Procedural Drive Behind an Unqualified Opinion
The independent auditor issued a "true and fair view" opinion and stated that the audit was conducted in accordance with ISA (UK). Notable details:
1. Audit scope: explicitly includes the distribution tables and risk disclosures. This exceeds the minimum requirements of UK company law for audits of ordinary companies and reflects the distinctive features of authorised-funds regulation — the accuracy of the distribution tables directly affects the interests of retail investors, while the risk disclosures are a core input to investor decisions.
2. Going concern conclusion: the auditor confirmed that it had "not identified events or conditions that may cast significant doubt on the entity's ability to continue as a going concern", but immediately stressed that this is "not a guarantee of future events". This two-part formulation is the predictable structure of a standard audit report. Given that the fund is an OEIC (open-ended investment company), however, its liquidity risk differs from that of a closed-ended fund — open-ended funds face pressure from large redemptions, and the auditor must assess the potential for asset realisation. No specific stress-test scenarios are disclosed here, but auditors typically focus on indicators such as the proportion of liquid assets and the ability to realise assets at a discount under market stress.
3. Responsibility for other information: the auditor states explicitly that it does "not cover other information" and provides no assurance on it, but it must read the information and report any material inconsistencies. In practice, if sections of the annual report such as the "Trustee's Responsibilities Statement" and "Directors' Remuneration" conflict with the financial statements, the auditor must address the matter. This report concludes with "nothing to report", indicating that no material disagreement arose between management and the auditor.
Risk Identification: The Auditor Ranks "Revenue Manipulation" and "NAV Inflation" as the Foremost Fraud Risks
In the "Irregularities" section, the auditor disclosed the focus areas of its assessed fraud risk:
- Breaches of the sourcebook (particularly provisions that directly involve the recognition and disclosure of amounts) — the highest-priority compliance risk;
- Management incentive: manipulating revenue or inflating NAV through improper journal entries — reflecting a fraud pattern specific to the fund industry: NAV is the pricing basis for subscriptions and redemptions, and an inflated NAV can attract inflows or raise management fee income.
By comparison, the "manipulation of revenue recognition timing" commonly seen in audits of non-financial corporates becomes "NAV pricing manipulation" in authorised funds. This also explains why the audit procedures pay particular attention to journal entry testing and valuation model review. Under the ethical standards of the UK Financial Reporting Council (FRC), auditors must maintain independence; in practice, however, auditors and fund companies often have multi-year relationships, and the challenge to independence should not be understated.
The Complementarity of the Depositary's Report and the Auditor's Report: A Two-Tier Oversight Architecture
This report presents the "dual-core" structure of fund governance:
| Supervisory body | Governing regulations | Core subject | Level of assurance |
|---|---|---|---|
| Depositary | Regulations, Scheme documents | AFM investment and borrowing powers, cash flows, asset matters | Reasonable assurance (opinion based on procedures performed) |
| Independent auditor | ISA (UK), sourcebook, FRS 102 | True and fair view of the financial statements, going concern, compliance | Reasonable assurance (positive assurance based on audit procedures) |
The Depositary's report focuses on operational compliance, while the auditor's report focuses on the fairness of the financial statements. Their intersection lies in the cross-verification of matters such as NAV calculation, application of income, and transaction consideration. This design requires a single audited entity (the fund company) to satisfy the independent scrutiny of two types of professional institutions simultaneously, materially increasing the probability that errors will be detected.
That said, both reports are standard templates and lack tailored disclosure of the risks specific to each fund's strategy. For example, given the different portfolios of the eight sub-funds (UK equities vs global balanced allocation), the auditor does not separately indicate which sub-funds bear higher valuation uncertainty. Investors who rely on the standard-format reports may fail to perceive the specific vulnerabilities of a particular sub-fund.
Conclusion: The Value Boundary of the Report
This continuation conveys three key signals:
1. Regulatory transparency: the itemised duties allow investors to clearly check whether the fund's operational conduct oversteps any boundary;
2. The standardisation of audit procedures: although an unqualified opinion is a "safe signal", the procedures behind it are more a compliance check than a forward-looking risk warning;
3. The incomplete independence of the two-tier oversight: the Depositary is appointed by the AFM (usually belonging to the same financial group as the AFM), and the auditor is paid by the AFM. In extreme cases, such conflicts of interest may weaken the seriousness of the oversight. The UK FCA has repeatedly stressed the need to strengthen the Depositary's "control function", but reform has been slow.
Therefore, when reading this report, investors should treat the Depositary's opinion as evidence that "procedures have been carried out", not as a guarantee of "investment safety"; the auditor's unqualified opinion should be understood as "no material misstatement found", not as "the fund performed well". What really warrants attention is the sub-funds' performance data — but that data sits in the body of the financial statements, outside the scope of this continuation.
Continuation: From "Procedural Compliance" to "Policy Substance"
The preceding sections have discussed the legal boundaries and procedural design of the audit report; the continuation further reveals the report's underlying logic: the "reasonableness" of the audit opinion ultimately rests on the "verifiability" of the accounting policies. This section focuses on several details in the accounting policies that merit scrutiny, with additional comparative observations.
I. The "Mixed Reality" of Revenue Recognition: Divergent Judgements Across Asset Classes
Revenue recognition in the accounting policies is not uniform; it is treated separately by asset class, reflecting the complexity of the fund's investment targets. Notably, debt securities are recognised using the effective interest method, while equities rely on the ex-dividend date — a potential mismatch in timing between the two, particularly when the fund holds substantial amounts of both asset classes, making the period-end cut-off testing of income a matter of particular vigilance.
| Asset class | Recognition basis | Key judgement point |
|---|---|---|
| Equities (stocks) | Ex-dividend date | Classification of special dividends (capital vs income) |
| Debt securities | Effective interest method | Implied yield assumptions embedded in purchase price |
| Collective investment schemes | Ex-dividend/reporting date | Additional recognition under the UK reporting fund regime |
| REITs | Ex-dividend date | Split of income streams between "dividend income" and "property income distributions" |
| Swap contracts | Daily accrual | Valuation curve for the floating-leg rate |
An easily overlooked detail is the "streaming" of REIT income. The policy states that "income is streamed between dividend income and property income distributions as appropriate", but the standard for "appropriate" is not specified. This leaves room for subjective judgement by auditors — the same REIT distribution may be allocated to different line items in different funds, thereby affecting the measurement of taxable income.
II. Expense Capitalisation: A "Counter-Intuitive" Distribution Strategy
Paragraph (3) of the policies reveals that for the `Baillie Gifford Global Income Growth Fund` and the `Responsible Global Equity Income Fund`, a portion of the management fee is charged to capital with the Depositary's consent. This is not uncommon among dividend funds; the aim is to sustain higher distributable income, but the cost is a sacrifice of fund NAV growth.
From a financial reporting perspective, this practice has two consequences:
1. The "reservoir" effect between the capital and income accounts — if the proportion of capitalised fees changes, it directly affects the distribution rate and the NAV trajectory;
2. The audit risk lies in the form and timing of the "Depositary's consent" — the policy does not state whether the consent is annual or applies to each individual fee. If the Depositary merely endorses the annual budget as a whole, the actual accrual may deviate from the authorised scope.
III. Fair Value Hierarchy: The Tension Between Disclosure and Reality
Paragraph (1) of the accounting policies sets out the three-level hierarchy of FRS 102, but paragraph (7) merely states that valuations are "at closing bid prices", without mentioning the "level classification" — a core field. For an open-ended fund, most listed equities fall under Level 1, but if it holds less liquid securities or restricted shares, these may fall into Level 2 or Level 3. Annual reports normally require the disclosure of the level distribution of each asset class, but this paragraph of the accounting policies stops at a principle-based description. The real point of concern is: when the investment adviser uses its own valuation, does that mean the asset no longer meets the "active market" condition for Level 1? The policy permits adviser valuations "when necessary", but does not define the trigger conditions, leaving a window for subjective parameters in inactive markets.
IV. Deferred Tax: A Stringent Recognition Threshold
Paragraph (6) of the tax policy is explicit: deferred tax assets are recognised only when the "ACD considers it probable that future taxable profits will be available". Relative to the "probable" standard in general UK corporate reporting standards, the wording here is stricter — "more likely than not", i.e., a probability slightly above 50% — and the phrase "the ACD considers" grants management considerable discretion.
For funds with sustained losses, auditors typically verify this judgement by examining future earnings forecasts. The fund itself, however, is subject to NAV fluctuations and lacks a foreseeable profitability plan, so deferred tax assets are often not recognised in fund annual reports — both a conservative stance and a pragmatic way to avoid complex valuations.
V. The "Asymmetry" in Derivative Treatment: Swap Costs vs Futures Differences
Paragraph (9) draws clear distinctions in the accounting treatment of three categories of derivatives (FX, futures, swaps):
- FX contracts: while held, marked to market as unrealised gains/losses; after the contracts are closed out, reclassified as realised;
- Futures: daily variation margin is recognised directly as realised gains/losses (rather than unrealised) — a distinctive treatment under accounting standards;
- Swaps: similar to FX, but clearing costs are included in realised gains/losses, whereas they are not for other instruments.
The treatment of futures is uncommon under International Financial Reporting Standards (IFRS) — treating daily margin as "realised" is normally a regulatory convention, not a general accounting convention. This difference means that auditors reviewing futures positions must understand the fund's "cash-settlement-equivalent" logic; otherwise, the floating gains/losses on open positions could easily be mistaken for realised gains, distorting distribution calculations.
Concluding Remarks: From "Paper Policy" to the "Chain of Audit Evidence"
The continuation effectively illustrates the interaction of three levels in fund auditing: "policy — procedure — judgement". Although the accounting policies are set out in fine detail, every clause embeds the discretion of management or the adviser ("facts of each particular case"). This means that external auditors, when verifying, cannot rely on book figures alone but must trace back to the original transaction context — which is precisely the necessity of the audit procedures described earlier (such as testing journal entries and holding discussions with the ACD). Without such preceding evidence, however complete the accounting policies may be, they are no more than rhetorical compliance statements.
1. "Layered" Risk Oversight in the Governance Structure: Division of Labour Rather Than Redundancy
The original text's description of risk management exhibits a governance feature of "reusing the parent framework": rather than building a separate system from scratch, the ACD layers a standing risk function on top of the investment adviser's (Baillie Gifford's) existing risk framework, drawing on the latter's expertise and advice. This design is uncommon in the asset-management industry — most ACDs of ICVCs prefer to build their own independent risk systems to demonstrate separation from the investment adviser. Baillie Gifford, however, chose to "avoid unnecessary duplication", effectively accepting that the investment adviser's risk-control system is already sufficiently mature. From a regulatory perspective, this is consistent with the flexibility under the FCA's Collective Investment Schemes rules that an "ACD may rely on outsourced parties", but the key point is whether the extent of reliance is adequately disclosed. The report does not state the headcount of the standing risk function, to whom it reports, or how potential conflicts of interest with the investment adviser are handled, leaving a degree of governance ambiguity.
2. The "Low-Complexity" Statement on Derivative Use: Compliant and Pragmatic, Yet Insufficiently Transparent
The original text states clearly that only the Managed Fund may use derivatives, emphasises that their use is limited to hedging/efficient portfolio management and achieving investment objectives, and asserts that their use is "not extensive, not complex", thereby declining to provide value-at-risk or sensitivity analysis. This qualitative judgement is lawful within the UCITS framework, but it merits scrutiny:
- According to ESMA's 2024 report on derivatives usage, approximately 22% of EU UCITS funds hold derivatives, predominantly interest-rate futures and FX forwards, with fewer than 3% using genuinely complex option structures. Baillie Gifford's statement is consistent with the industry mainstream, but the subjective conclusion "not complex" omits the exposure size and stress scenarios of the actual positions.
- More importantly, the original text acknowledges that the Managed Fund's portfolio includes bonds and "multi-asset" holdings and that it uses interest-rate strategies and credit-spread strategies. The compounding effects of such strategies under extreme market shocks (such as the 2022 UK gilt crisis) can be non-linear. Relying solely on the assertion that they are "not expected to have an adverse impact on the overall risk profile" clearly lacks verifiability.
| Derivative use comparison | Baillie Gifford Managed Fund | European UCITS funds (ESMA 2024 average) |
|---|---|---|
| Purpose | Hedging, efficient portfolio management, achieving investment objectives | Mainly hedging; a few for yield enhancement |
| Instrument scope | Exchange-traded/OTC; can cover rates, FX, bond curves | Includes futures, forwards, options, swaps (simple to moderately complex) |
| Risk disclosure | No VaR/sensitivity provided | Vast majority disclose derivatives exposure and VaR as required (where the strategy is materially exposed) |
3. Triple Currency Exposure: Micro-Level Management from Settlement Lags to Income Conversion
The report breaks FX risk down into three dimensions: translation of investment values, settlement-date differences, and income conversion. Such a decomposition is uncommon in fund disclosures and reflects the investment adviser's attention to operational detail. Points worth adding:
- Settlement exposure: the mismatch between trade date and settlement date creates a brief unhedged exposure. Baillie Gifford's strategy is to "execute FX forward contracts on the trade date where feasible" — in effect a mandatory hedge that avoids exchange-rate drift while funds are in transit. Compared with many funds that use netting or tolerate a two-day exposure, this approach is more conservative.
- Income conversion: all foreign-currency income is converted to sterling on the day of receipt or the following day. Although this eliminates long-term currency risk, it entails paying fixed bid-offer spreads, which may constitute an ongoing hidden cost for portfolios with a high proportion of high-dividend stocks. The report does not disclose whether these spreads are included in the total expense ratio — an issue investors should note.
- Balance-sheet currency exposure: the report merely states that this is disclosed in the notes to the financial statements, without giving the current net FX exposure percentage of each sub-fund. Nor is there an explicit cap on exposure to non-sterling assets; the matter is left to the investment adviser's discretion in line with the investment objectives.
4. Interest Rate Risk: Ambiguous Bond Duration and Credit Linkage
Because the Managed Fund holds bonds, it is regarded as facing significant interest-rate risk, but the report does not provide the portfolio's duration range or an interest-rate-sensitivity stress test. It notes that bond values are affected by three factors — "changes in interest rates, inflation expectations, and deterioration in issuer creditworthiness" — which in effect conflates interest-rate risk with credit risk without further decomposition. A more transparent approach would distinguish government bonds (purely rate-sensitive) from corporate bonds (rates plus credit spreads), disclosing effective duration and credit-spread exposure separately. For the non-Managed Fund, the report claims that because "most assets are equities with no maturity and no coupon", direct interest-rate risk is not material. This assertion, however, ignores the indirect sensitivity of equity assets to changes in corporate funding costs — when global yield curves were deeply inverted from 2023 onwards, the valuation discounts on highly leveraged companies demonstrated exactly this transmission effect.
5. Counterparty Credit Risk: Dual Protection from DVP Safeguards and Top-Tier Institutions
The report states that derivative counterparties are all "top-rated institutions or their subsidiaries", and that equity settlements are predominantly on a "delivery versus payment" (DVP) basis. This is more cautious than many peers — in industry practice, OTC derivatives typically use bilateral collateral agreements (CSAs), but not all institutions can secure top-rated counterparties. Worth adding by way of background: since the EMIR regulatory reforms, standardised OTC derivatives are subject to mandatory central clearing, and counterparty risk has shifted from bilateral default risk to reliance on CCPs. Baillie Gifford's disclosure does not mention whether central clearing is used, nor does it state the proportion of non-DVP settlements and the approval process; the reference to "requiring additional procedures and approvals", however, indicates that some non-DVP activity exists. From a cost perspective, diversifying counterparties only among top-tier institutions may concentrate trading limits within banking groups and does not necessarily minimise correlated default risk — for example, if several banks are hit simultaneously by a systemic crisis, the concentration is not in fact effectively reduced.
6. Liquidity Risk: Plenty of Principle-Based Description, Missing Quantified Stress Tests
The report describes the management of liquidity risk as determining the level to be maintained "based on the relative liquidity of assets, liquidation time, price impact, and sensitivity to other market factors". This is a qualitative framework that lacks three key usable data points:
- the proportion of liquid assets to total assets for each sub-fund (e.g., minimum holding limits for cash and highly liquid large-cap equities);
- the number of days to liquidate during historical redemption peaks (e.g., during the March 2020 pandemic shock);
- the upper limit of illiquid assets (e.g., unlisted securities) as a percentage of net assets.
In its 2021 product intervention measures (PS 21/6), the FCA explicitly required funds to have robust liquidity stress tests and scenario analysis, particularly for funds holding less liquid assets. This report avoids specific figures, possibly because the sub-funds' investment remits vary considerably (equity funds are naturally more liquid), but investors are nonetheless advised to cross-verify using the "pre-fee redemption volumes" and "proportion of unlisted assets" in the semi-annual/annual reports.
7. Operational Risk: Reliance on Third-Party Going Concern, but Lacking Assessment of Alternatives
The report acknowledges that a failure of the accounting systems or third-party service providers could lead to misreporting or misappropriation of assets, and it relies on Baillie Gifford & Co's business continuity plan. However, for scenarios in which the critical third parties themselves (such as the Depositary and independent valuation providers) suffer business disruption, does the ACD have alternative service providers in place? The report does not mention this. UCITS guidelines require the ACD to formulate "exit plans" and "contingency backups" for critical outsourced functions, but this disclosure appears only to outline the group's comprehensive plan. Moreover, the review of internal controls is based on a report prepared by Baillie Gifford itself, rather than an "independent controls assurance report" issued by an external auditor (such as an ISAE 3402 report), so its independence is questionable.
8. Remuneration Report: Policy Framework Only, No Pay Quantum Disclosed
The Remuneration Report section is very brief — it only mentions that the policy is reviewed annually and is the responsibility of the Management Committee and the ACD Board, with details to be found in the Remuneration Disclosure updated in June 2025; no summary figures appear in the main body. For investors, although remuneration transparency in the UK UCITS space is weaker than for CRD banks, the UK Remuneration Rules still require disclosure of the total remuneration of "material risk takers" (including senior management and fund managers) and its breakdown. By referring directly to an external document, this report effectively avoids presenting figures in the annual report itself. Readers are advised to consult the updated remuneration disclosure and compare it with peers (such as Legal & General and Fidelity) that show total pay and variable-pay ratios in their ICVC annual reports, in order to assess how well the long-term talent incentives match performance risk. In short, this section lags industry leaders significantly in transparency.
I. Structural Features of the Disclosed Data: A Remuneration Account That Cannot Withstand Scrutiny
Panorama of the AI computing industry, covering AI chips, servers, switches, optical modules and other segments of the industry chain
The remuneration disclosure table provides two sets of figures, but taken together they expose deeper organisational information:
| Item | Headcount | Fixed pay (£'000) | Variable pay (£'000) | Total (£'000) | Average per head (£) |
|---|---|---|---|---|---|
| Baillie Gifford & Co Limited — all staff | 54 | 1,610 | 260 | 1,870 | 34.6 |
| Remuneration Code Staff (Material Risk Takers) | 29 | — | — | 1,750 | 60.3 |
Two details are worth noting.
First, the 29 Material Risk Takers took away 94% of total remuneration, meaning the remaining 25 non-risk-takers received only £120,000 in total, or £4,800 per person. This figure is so low that it has no real meaning as a livelihood in financial services. The only explanation is that the bulk of these 25 employees' actual pay is borne by other entities of the Baillie Gifford group, with only a minimal proportion allocated to the UK UCITS business. This confirms a judgement: Baillie Gifford & Co Limited, as the ACD, is in essence a legal shell, with its actual operating staff, systems, and infrastructure all resting on the parent company. Accordingly, this remuneration disclosure formally covers the ACD, but in substance it is calculating the staffing costs that the parent company apportions to the UCITS business.
Second, under the "Text" basis, all Material Risk Takers come exclusively from "governance and control functions", while portfolio management is outsourced to Baillie Gifford and Baillie Gifford Overseas Limited. In other words, the investment managers who actually bear day-to-day decision-making responsibility for the Fund's portfolio fall entirely outside the scope of the regulatory disclosure requirement. The report cites as its rationale that these outsourced entities are subject to remuneration regulation considered "equally as effective". This is a legal-technical argument, but it leaves a material transparency gap: the fees investors pay for the management of the Global Alpha Growth Fund ultimately flow into Baillie Gifford's parent-company bonus pool, and the relationship between that pool's allocation rules and the Fund's performance is not verifiable anywhere in this annual report.
The sentence in the remuneration policy — "with measures generally shared across the firm" — is a direct admission that the performance metrics are at the company level, not the fund level. An investment manager who has allowed the Global Alpha Growth Fund to lag its benchmark for years may see no material impact on pay, so long as other strategies perform well and company profits are healthy. The professed commitment to "not encouraging risk-taking which is inconsistent with the risk profile" has no operational meaning under a framework of company-wide shared metrics.
II. The Three-Tier Governance Chain: Form and Substance of Independence
The remuneration governance structure forms a clear reporting line:
- Baillie Gifford's Remuneration Committee sets the group remuneration policy;
- that Committee reports to the Management Committee, the group's highest governing body;
- the ACD's Board is responsible for overseeing compliance with the UCITS Remuneration Code.
The problem lies in the supervisory position of the ACD Board. The ACD's own directors and management are the subjects of the group remuneration system, with their pay determined by the group's Remuneration Committee. Having those being assessed oversee the enforcement of the assessment rules is a classic self-supervision structure. The report mentions that the policy is "subject to independent internal review by the compliance and risk functions", but the employees of those functions are themselves paid within the group's remuneration framework — their "independence" is at most a functional separation at the organisational level, not independence at the level of economic interest. The report contains no information whatsoever on the composition of the Remuneration Committee, independence standards, external adviser involvement, or conflict-of-interest avoidance mechanisms. The entire "Governance of Remuneration" section is only three sentences long — in disclosure terms, it reads more like ticking off compliance requirements item by item than an exposition of governance substance.
III. The Tension Between Performance Facts and Attribution Narrative
The annual performance figures themselves are not complicated:
| Metric | Return |
|---|---|
| Fund (B Accumulation Shares, year ended 31 January 2026) | 2.7% |
| MSCI ACWI Index | 10.8% |
| Target (Index + 2% p.a.) | 13.1% |
| Fund five-year annualised return | 3.7% |
It lagged the benchmark by 8.1 percentage points and the target by 10.4 percentage points — achieved in an environment of broadly rising global equity markets from early 2025 to early 2026. "Enthusiasm" for AI continued to drive markets, while the fund's holdings bore the brunt of the sharp January decline in software stocks.
The report's attribution framework deserves attention: the market-environment section attributes the fund's underperformance to the fact that "investors reassessed the valuations of these businesses, the outlook for their earnings in the short run, and whether the high levels of spending linked to AI will prove sustainable". This narrative explains the underperformance as a short-term fluctuation in market sentiment, but the fact juxtaposed with it is that the Fund's five-year annualised return is only 3.7%. Measured against the target, the five-year compounded gap is already far beyond the semantic scope of "short-term fluctuation". More notably, the remuneration policy claims that the incentive design serves the "long-term interests of investors" and uses a five-year rolling assessment — yet that five-year cycle has ended or is close to ending, and the target has not been met. The report provides no formal assessment against the target, no attribution of the gap, and no description of any mechanism to address a five-year miss. An institution that designs a detailed remuneration policy and elaborates a long-termist philosophy, yet chooses silence when quantitative targets are significantly missed — this in itself constitutes an information-rich behavioural signal.
IV. The Juxtaposed Contradiction of Risk Rating, Performance Risk, and Incentive Logic
The Fund is classified in Category 7 of the Risk and Reward Indicator — the highest risk band. The general understanding is that high risk compensates for high returns. But the Fund itself acknowledges that this indicator does not cover the following "material risks": active management, a long-term growth preference that takes priority over short-term returns, and relatively concentrated holdings that may lead to "prolonged periods of underperformance ... both in relation to the Fund's benchmark and in absolute terms".
This passage in effect acknowledges a contradiction that every UCITS investor should confront: the Fund's core risk — prolonged underperformance — is precisely the type of risk this indicator cannot identify. The 3.7% five-year annualised return is the empirical footnote to this passage. If "prolonged underperformance" is indeed identified by the fund's management as one of the core risks, then the phrase in the remuneration policy — "should not encourage risk-taking which is inconsistent with the risk profiles of the UK UCITS" — becomes highly suggestive: the Fund's own risk profile includes "the possibility of prolonged underperformance", and while the remuneration policy takes "not encouraging risk-taking" as its principle, the Fund's strategy is precisely to assume a style risk of concentration, deviation from the index, and possible long-term underperformance. The two cannot be reconciled logically. The only way to reconcile them is to recognise that the remuneration policy and the investment strategy are decided by two systems that are mutually independent — one governed by the Remuneration Committee, the other led by the investment team — and that ACD-level remuneration compliance is a bridge on paper only.
Cross-Validation of the Report Text and Portfolio Data
The most rewarding aspect of this continuation to dig into is the subtle tension between the "narrative level" and the "data level". The fund manager attempts to recast a multi-year period of underperformance as "an unavoidable fluctuation concentrated in a particular macro window", but testing that attribution logic against the portfolio data reveals further details worth pursuing.
First, the dating of the drawdown window: the report anchors the main period of underperformance to November 2021 through October 2022. That window coincides precisely with the valuation compression of global growth stocks — indeed the phase in which long-duration assets suffered most. One figure worth noting, however: from 2023 to 2025, global growth stocks rebounded significantly, with large-cap technology (the Magnificent 7) contributing nearly all of the index's gains. Over this same period, the Fund still cumulatively underperformed the index by more than 300 basis points (inferred from the relative performance figures in the report's opening paragraph). This suggests that the "underperformance" did not occur only in 2022, but was a sustained process of relative weakness. Attributing the problem to the 2022 macro shock is, to some extent, an oversimplification of the structural causes.
A more granular test is to ask whether the losses exposed in 2022 were repaired through subsequent position adjustments. A careful comparison of the data structure in the Portfolio Statement shows that the typical holdings which suffered in 2022 (such as The Trade Desk, Block, Shopify, and Sea Ltd) remain in the portfolio today, with positions generally between 0.3% and 0.9%, while the main contributors to gains since 2023 (NVIDIA, TSMC, Meta) have risen to the top of the weightings. This in fact describes a classic "sell winners, buy losers" contrarian rebalancing path, rather than simply "holding firm through the decline". In a trending market, this style of operation tends to steadily erode relative returns, because each such move weakens the portfolio's momentum exposure.
The Other Side of the "Long-Term Holding" Narrative, as Seen Through Trading Behaviour
The report states that "trading activity has reflected a deliberate effort to keep portfolios aligned with where we see lasting structural change" — wording that implies trading is prudent and low-frequency. The data in the "Material Portfolio Changes" table, however, does not fully support this impression. Based on an estimated total asset size of approximately £2bn (back-calculated from the NVIDIA position of £111.7m ÷ 5.55%), the top-ten purchases for the year total approximately £260m and the top-ten sales approximately £353m, representing 13% and 17.5% of total assets respectively. Adding the other smaller trades that did not enter the top ten, annualised turnover is likely between 35% and 50%. For a global growth fund that professes long-term compounding as its core strategy, this level of turnover is clearly on the high side.
| Metric | Value (£’000) | % of total assets |
|---|---|---|
| Top-ten purchases, total | 260,299 | ~13% |
| Top-ten sales, total | 352,553 | ~17.5% |
| Largest single purchase (Tencent) | 44,950 | ~2.2% |
| Largest single sale (Prosus) | 69,338 | ~3.4% |
Even more telling is that NVIDIA appears on both the largest-buy and largest-sell sides — purchases of £30.3M, sales of £50.4M. When such two-way trades in the same name occur within the same reporting period, they usually mean the fund manager is trading the swings or taking profit through rebalancing. Given that NVIDIA is already the largest position in the portfolio (5.55%), this looks more like active risk control than a sustained increase in exposure to the AI story. Similar logic applies to Meta (sold £38.1M while still holding 3.09%) and Martin Marietta (sold £26.2M while remaining the sixth-largest holding). This suggests that the real driver of the portfolio's repositioning is "rebalancing" rather than a pure change in conviction — the difference being that the former is governed by valuation discipline and risk control, while the latter represents a strengthening or shifting of belief.
Regional Rebalancing: A Major Structural Change Handled Quietly
The report's narrative makes almost no mention of "regional allocation changes", but the comparative data in the Portfolio Statement reveals that the portfolio underwent a notable expansion of its emerging-market weight over the past year. Below are several key moves extracted from the changes in country percentages:
| Country/Region | Weight at start of year (%) | Weight at end of year (%) | Change (pp) |
|---|---|---|---|
| China | 3.18 | 5.04 | +1.86 |
| Taiwan | 3.43 | 5.00 | +1.57 |
| Brazil | 2.54 | 3.87 | +1.33 |
| South Korea | 1.40 | 2.59 | +1.19 |
| United States | 61.75 | 62.19 | +0.44 |
| Netherlands | 4.74 | 2.20 | -2.54 |
| Sweden | 2.42 | 1.25 | -1.17 |
| Hong Kong | 0.93 | 0.00 | -0.93 |
| France | 1.50 | 1.03 | -0.47 |
Within a single year, this change lifted the emerging-market weight (including Taiwan and South Korea) from roughly 10.5% to roughly 16.5% — an increase of nearly 60%. Corresponding evidence can be found in the trade list: purchases of Tencent (China), CATL (China), Keyence and Kokusai (Japan), Coupang (South Korea), Nu Holdings and MercadoLibre (Brazil), among others; and sales of Prosus, AIA, and Shopify (Canada), among others. The direction of this rebalancing is unambiguous — away from low-growth, high-valuation or governance-discounted assets and toward emerging-market leaders with improving fundamentals and lower valuations.
The "sell Prosus, buy Tencent" trade deserves particular mention. Prosus is in essence a holding platform that trades at a discount to its Tencent stake; the two represent the same underlying asset. Completing the sale of the former and the purchase of the latter within the same quarter can be read as disintermediation, reducing a structural discount, and strengthening direct control over the underlying asset. From a behavioural-finance perspective, however, this trade also sends a signal: the fund manager believes the discount to NAV on Prosus will not be corrected by the market in the near term, and therefore abandons the discount-arbitrage opportunity in favour of direct investment in Tencent — a pragmatic pessimism. For ordinary investors, the incremental information in this switch is likely limited, because it changes only the holding vehicle, not the judgement on Tencent's business itself.
The Concrete Meaning of the "Quality" Language, as Seen Through the Retained Positions
The opening page of the report states that "holdings typically have higher gross margins, stronger cash generation, and relatively little exposure to debt" — a quantitative statement that can be verified. It is worth checking how well this statement matches the portfolio data.
High-margin, asset-light businesses are indeed the portfolio's bedrock: Mastercard (payment network), MSCI/Moody's/S&P Global (data and analytics), Auto Trader (online marketplace), and Service Corp (funeral services) all display characteristically high gross margins. Auto Trader's gross margin is around 80%, MSCI around 75%, Mastercard around 80% — these names provide the "economic moat" quality foundation of the portfolio.
The "low debt" claim, however, may be somewhat idealised. Several holdings in the portfolio are inherently high-leverage or asset-heavy models: FTAI Aviation (aircraft-engine leasing and maintenance, capital-intensive and financing-related), Petrobras (state-owned oil, high capital expenditure), Poste Italiane (bank and insurance distribution, subject to financial regulation), and QXO (a building-materials distribution platform led by Brad Jacobs, M&A-driven growth, with a highly uncertain balance-sheet structure). Moreover, Elevance Health, as an insurance company, has a balance sheet whose nature does not fully match the "low leverage" description — insurance float is essentially liability-like funds.
A more precise formulation, therefore, would be: high-quality, high-margin, asset-light businesses form the main body of the portfolio, but it also contains a set of typically capital-intensive or financially leveraged holdings. This is not itself a problem. The problem is that the report offers "the companies we hold are becoming more profitable and are using capital more efficiently" as a sweeping judgement, when in fact the portfolio contains a set of companies with markedly different ROE levels and business models — which looks more like a "selective summary".
The Divergence Between Individual Narratives in the Outlook and Portfolio Logic
The report's Outlook section highlights two cases: TSMC and FTAI Aviation. The two carry a certain narrative tension.
TSMC's contribution logic is very clear: scale advantages in AI chip manufacturing, scarcity of advanced process nodes, and margin expansion. It is one of the few companies in the global technology supply chain today with "certain, strong growth" characteristics. Notably, although TSMC is portrayed as a "contributor" in the report, its weight in the fund rose from 3.43% at the start of the period to 5.00% at the end, and it is the second-largest holding. This means the fund not only benefited from TSMC's returns but continued to add after the "story had played out" — a direction opposite to the conventional "take profits on winners" and closer to "let winners run". On this point, the fund's behaviour is consistent with its long-term growth philosophy.
FTAI Aviation, by contrast, is the other extreme. It is essentially an aircraft-engine leasing and maintenance company, and the portfolio has held the position for a long time. The "FTAI Power" plan announced in December 2025 — retrofitting retired CFM56 engines into power-supply equipment for data centres — pushed the share price up significantly within two months. The report treats this event as proof of the success of the company's strategic evolution. From a portfolio-management standpoint, however, a distinction must be drawn between "a genuine breakthrough in the business model" and "the market's chase of a theme". There is indeed market demand for the power conversion of CFM56 engines, but large-scale implementation involves complex steps — certification, supply chain, data-centre power purchase agreements — and remains at an early stage of commercialisation. Presenting this holding in the report as a representative of "strong results" and supporting the investment logic with "a fleet of more than 1,000 engines" objectively reinforces investors' imagination of an "AI + energy arbitrage" concept. This may be a genuine conviction, or it may be an opportunistic "ride-the-wave" reading of a stock in the portfolio that has recently risen sharply.
The contrast between these two cases reveals the portfolio's true risk structure: the report text emphasises "holding a group of high-quality growth companies with strong financial foundations", yet a considerable share of its actual returns still depends heavily on a small number of AI-related supply-chain nodes (TSMC, NVIDIA) and novel thematic assets (such as FTAI, AppLovin, Samsara). The defensive capacity of this "diversified by theme but concentrated in substance" structure in a market style shift may be weaker than one might imagine.
A Quantitative Test of the "Process Improvement" Commitment
The report says "we have since implemented several process improvements and enhanced risk analytics" — a commitment that is difficult to verify externally. Its credibility can, however, be tested indirectly along two observable dimensions.
Dimension one: the convergence of portfolio dispersion (tracking error). From the holding data, top-ten concentration is approximately 33.7% (NVIDIA 5.55 + TSMC 5.00 + Alphabet 3.63 + Microsoft 3.55 + Amazon 3.51 + Meta 3.09 + Martin Marietta 2.25 + Tencent 2.20 + Mastercard 1.99 + Service Corp 1.91) — moderately high for a comparable global growth fund. Against the common 25%–30% top-ten range for many global equity funds, this fund retains a relatively high degree of single-stock deviation, indicating that the "enhanced risk analytics" has not translated into visibly converging risk behaviour.
Dimension two: drawdown control in falling markets. The report acknowledges that "returns will have disappointed investors" in recent years, but does not elaborate on how the portfolio performed relative to the market during the heightened volatility of 2025. Judging from the market environment before 31 January — the marked correction in global technology stocks from late 2025 to early 2026 — if the portfolio underperformed once again in that final market decline, the actual effectiveness of the "process improvements" would be open to question. Since the report's main text provides only full-year and multi-year relative returns, without disclosing recent-period performance, the absence of this key information is itself noteworthy.
| Dimension examined | Report's statement | What the data verification shows |
|---|---|---|
| Process improvements | "Implemented several process improvements and enhanced risk analytics" | Cannot be directly falsified; but concentration and turnover show no clear convergence |
| Quality enhancement | "Hold companies with higher gross margins, stronger cash flow, low debt" | Largely holds, but with exceptions such as FTAI, Petrobras, Elevance |
| Regional diversification | Not emphasised in the main text | In fact, the emerging-market weight rose by roughly 6pp — the most significant structural change in the document |
| Trading frequency | "Keep portfolios aligned with structural change" | Top-ten buys and sells total about £600m against a £2bn size — turnover is on the high side |
Summary: The Report's Structural Blind Spots
Overall, this January 2026 investment report is complete in its narrative framework of "acknowledging the problem — attribution — improvement — outlook", but its data layer presents a more complex picture than the text: the portfolio is undergoing a regional reallocation, a de facto heavy exposure to AI, and an active adjustment with trading frequency significantly higher than a conventional "buy and hold" strategy. The fund manager's narrative tends to describe all of this as "disciplined growth investing", but the actual behaviour implied by the data is closer to "relatively active thematic rotation across global growth assets".
For investors, what truly warrants caution is not these behaviours in themselves — they may be rational and valuable — but the report's avoidance, in its communication, of the substance of "style drift". If the portfolio has gradually evolved from a fund that is "bottom-up, holding high-growth companies for the long term" into a "hybrid global growth fund combining macro-regional allocation, AI thematic exposure, and valuation discipline", then the benchmarks and risk parameters against which it should be evaluated need to be adjusted accordingly. On this very point, the report is at its most ambiguous.
I. Abnormal Risks Revealed at the Tail of the Portfolio
Two notable details appear at the end of the Portfolio Statement:
- WillScot Hdgs has a market value of just £4.917m, or 0.24% of net assets, yet is listed separately, suggesting recent adjustments or special risks attached to the position.
- A footnote mentions that one stock was valued at zero at year-end because of the Ukraine conflict and was classified as a Level 3 asset. This shows the fund continues to bear a material loss from geopolitical events. Although the position is likely small within the overall portfolio, its valuation methodology — dependent on the Investment Adviser's judgement — adds additional uncertainty to the net asset value.
Compared with net other assets of 1.07% in January 2025, the figure fell to -0.24%1 at the end of this year, indicating accrued liabilities or pending settlement items of approximately £4.9m at year-end, with liquidity-management pressure increasing at the fiscal year-end. These details are easily overlooked in routine performance discussions, but they directly affect the true quality of net assets.
II. Comparative Tables: The Quantitative Relationship Between Fee Tiers and Returns
Performance differences across share classes are almost entirely explained by Operating Charges, while within the same class, Accumulation and Income returns have already diverged due to dividend policy. The table below summarizes the key data for each share class for fiscal year 2026:
| Share Class | Operating Charges | Return | Closing NAV per unit (pence) | Net assets (£’000) |
|---|---|---|---|---|
| A Accumulation | 1.54%² | 1.37% | 462.02 | 56 |
| B Accumulation | 0.59% | 2.21% | 530.84 | 288,870 |
| B Income | 0.59% | 2.21% | 480.94 | 239,740 |
| C Accumulation | 0.02% | 2.80% | 584.18 | 1,462,194 |
| C Income | 0.02% | 2.80% | 541.17 | 20,574 |
| L Accumulation | 0.52% | 2.28% | 531.79 | 1 (nominal) |
| L Income | 0.52% | 2.28% | 480.08 | 1 (nominal) |
| P Accumulation | 0.52% | 9.83%³ | 530.47 | 1 |
Key findings:
- Fee differences translate directly into return differences: Class C is 57bp lower than Class B, yet its 2026 return is 59bp higher; Class B is 95bp lower than Class A, yet its return is 84bp higher. This nearly one-to-one relationship indicates that, after stripping out fees, gross returns across classes are broadly consistent, and the fund's actual stock-picking ability does not differ by share class.
- The “fee adjustment” for Class A shares deserves caution: The notes indicate that ACD believes 1.44% is closer to the ongoing charge for Class A, while the 1.54% shown in the table is the nominal value, with discounts or waivers possible in practice. Even so, Class A remains the most expensive way to access the fund; its 1.37% return over the past year is far below Class C, and the long-term compounding difference will be very significant.
- Class P's “high return” is not comparable: Class P was only launched on 15 May 2025, so its 9.83% return corresponds to a period of less than nine months, not a full fiscal year, and cannot be annualized and compared with other share classes. In fact, since inception, its period return and gross return are not materially better than Class C.
3. Fund Flows and Warning Signs of Scale Contraction
The changes in net asset value reveal structural divergence in investor behavior:
| Share Class | 2026 Net Assets (£’000) | 2025 Net Assets (£’000) | 2024 Net Assets (£’000) | 2026 Number of Shares | 2025 Number of Shares |
|---|---|---|---|---|---|
| A Accumulation | 56 | 2,086 | 1,798 | 12,131 | 457,617 |
| B Accumulation | 288,870 | 513,008 | 1,057,777 | 54,417,396 | 98,779,650 |
| B Income | 239,740 | 208,790 | 189,528 | 49,847,659 | 44,296,915 |
| C Accumulation | 1,462,194 | 1,603,383 | 1,422,956 | 250,297,096 | 282,139,250 |
| C Income | 20,574 | 22,770 | 27,300 | 3,801,722 | 4,294,345 |
| L/P | 1 (nominal) | 1 (nominal) | 1 (nominal) | 200 | 200 |
- B Accumulation saw massive redemptions: Net assets fell from £513 million to £289 million, with share count down nearly 44% — contracting significantly for the second consecutive year. Given its 0.59% fee rate, this was not performance-driven (returns were positive); it is more likely phased withdrawals by institutional investors or an allocation adjustment of the fund strategy in specific distribution channels.
- C Accumulation became a safe haven for capital: Although net assets also declined from £1.603 billion to £1.462 billion, the decrease was only -8.8%, and during 2024-2025 it had grown against the trend from £1.423 billion to £1.603 billion, indicating that the low-cost share class continues to attract steady capital.
- B Income share count grew: The number of shares increased from 44.30 million to 49.85 million, and net assets grew against the trend by 15%, showing that some investors switched to the Income class while redeeming Accumulation shares, possibly for cash flow needs or to transfer capital gains tax liabilities via Income shares.
Overall, the fund’s total net assets fell from approximately £2.35B in January 2025 to approximately £2.01B in January 2026, a decline of 14.4% — exceeding natural market fluctuations (with performance contributing approximately +1.4% to +2.8% over the same period) — indicating that active redemptions were the primary driver of the scale contraction.
IV. Price Fluctuation Range: A True Reflection of Risk Sentiment
The highest/lowest share prices reveal the extreme fluctuation of each share class within the fiscal year. For example:
- C Accumulation's high/low price range was 435.9p – 625.7p, meaning investors endured a drawdown of roughly 30% (from peak to trough) during the fiscal year, yet the final NAV was only 2.8% above the start of the year. This magnitude of fluctuation is far greater than the risk level implied by the "return" outcome metric.
- A Accumulation's high/low prices were 348.7p – 496.6p, an amplitude of 42% — the largest among all share classes — further highlighting that holders of higher-fee share classes face dual uncertainty: market volatility + cost erosion.
Combined with the returns, these price ranges show that the fund's experience in fiscal 2026 was one of "high volatility, low net returns" — for most of the period the NAV was under water, only rebounding into positive-return territory near the end of the year.
V. Supplement to the 'Introduction' Narrative Above
If the earlier analysis introduced the fund's optimistic stance on the future of growth stocks, the Comparative Tables offer data points that either support or question it:
- The resilience of the low-fee C-class shares demonstrates that long-term investors are more focused on cost control. A fee rate of 0.02% is extremely low by industry standards and is a core tool for Baillie Gifford to attract large institutional capital.
- The stark contrast between heavy redemptions in Class B and relative stability in Class C suggests that distribution channels (such as fund platforms or wealth management firms) may be migrating clients from high-fee share classes to low-fee ones, rather than abandoning the strategy itself.
- Tail positions such as WillScot Hdgs, together with zero-valuation assets, illustrate that the fund remains willing to hold impacted holdings amid macro uncertainty. This is consistent with its underlying belief in "global alpha growth" — even when valuations briefly go to zero, it stays the course and refuses to be shaken by volatility.
Summary: Comparative Tables is not merely a performance summary; it is a mirror reflecting investor behavior, fee economics, and the resilience of risk management. It reveals how fee tiers slice returns, how redemption waves reshape fund structure, and the striking intraday volatility behind nominal returns. When assessing the fund's future prospects, these data are just as important as portfolio views.
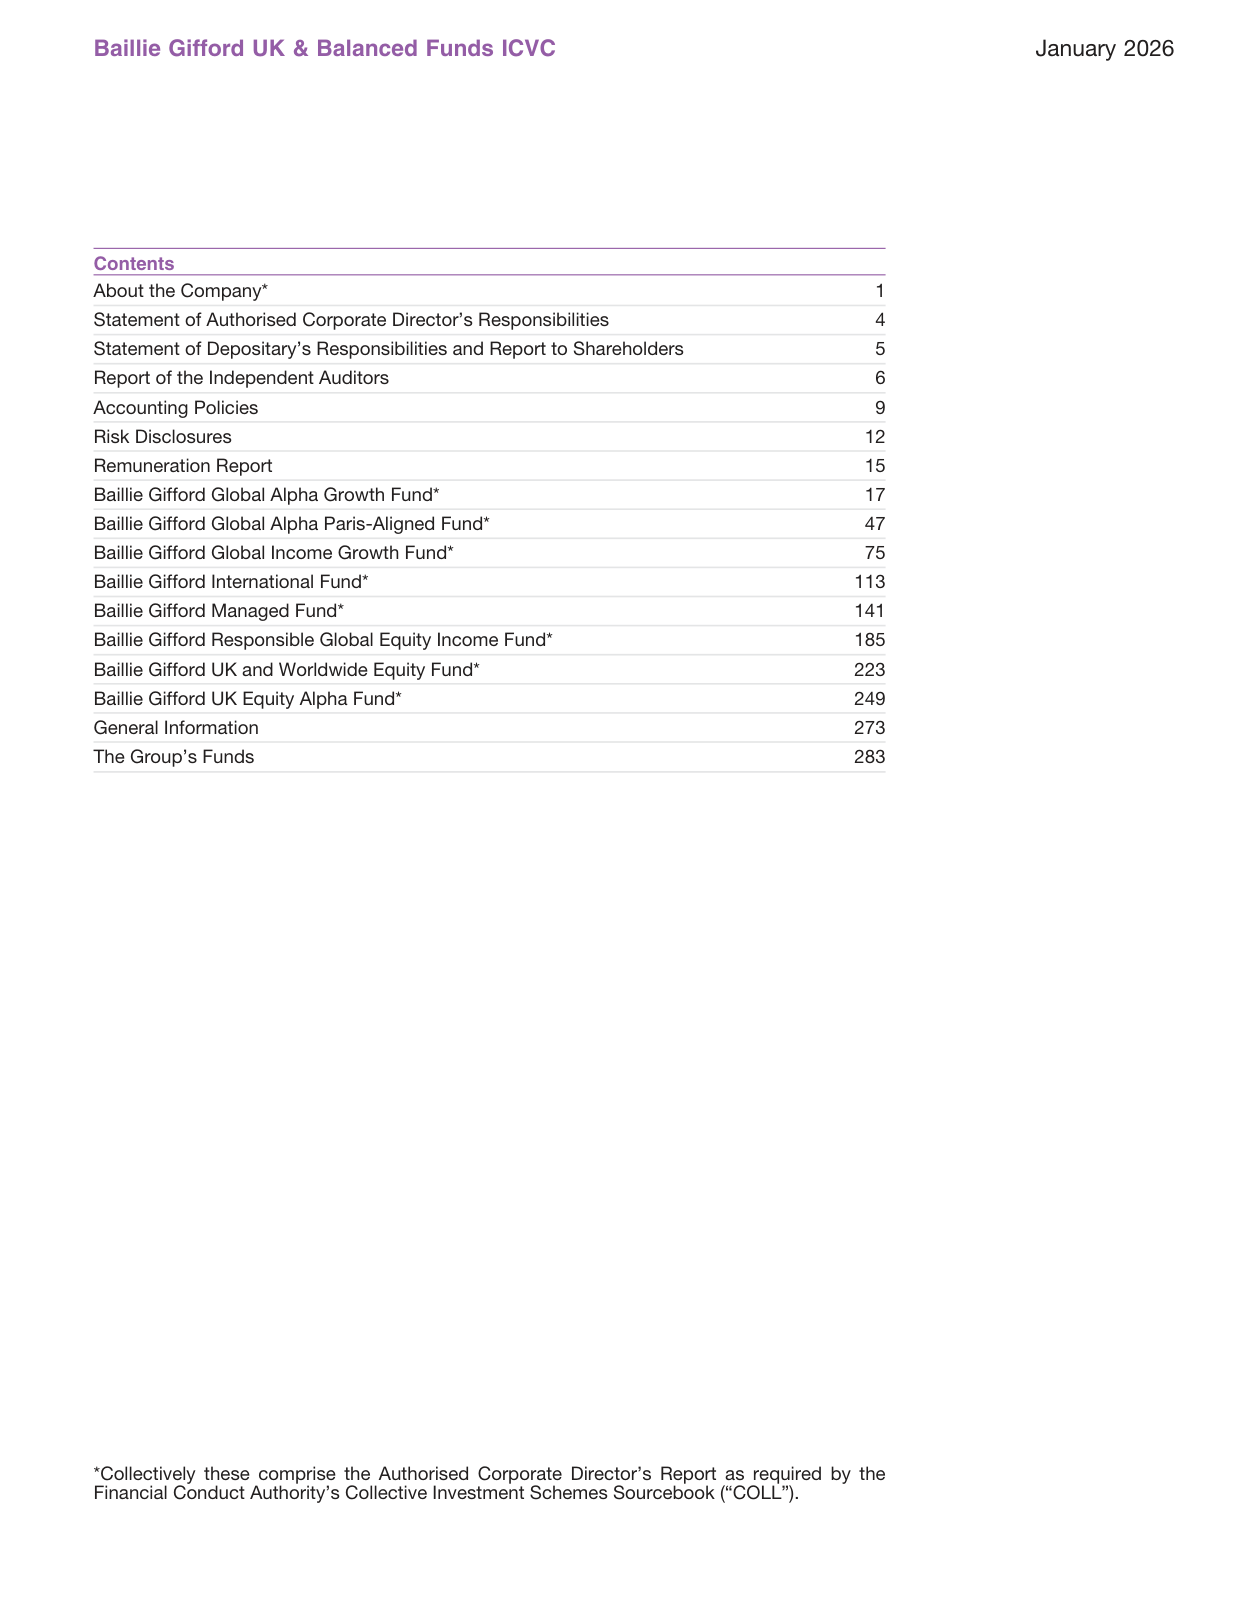
Report table of contents, listing each chapter and corresponding page numbers
Balance Sheet: Changes in Liquidity Structure Amid Shrinking Scale
On 31 January 2026, the fund's net assets fell to £2,011.4M, down 14.4% from £2,350.0M in the same period last year, mainly driven by net redemptions of -£377.9M (as analyzed in the previous report). The balance sheet reveals several key structural features during the scale contraction:
| Item | 2026 (£'000) | 2025 (£'000) | Change |
|---|---|---|---|
| Investment assets | 2,006,537 | 2,324,779 | -13.7% |
| Cash and bank deposits | 26,648 | 17,513 | +52.2% |
| Receivables (Debtors) | 50,157 | 9,305 | +439.1% |
| Bank overdraft | (1,243) | - | New |
| Payables (Creditors) | (70,196) | (1,117) | +6184% |
| Net assets | 2,011,437 | 2,350,039 | -14.4% |
Significant change in the cash flow and trade settlement cycle: "sales awaiting settlement" in receivables surged from £6.5M last year to £47.6M, while "purchases awaiting settlement" in payables rose from £0.7M to £69.3M. This indicates that the fund executed large-scale portfolio repositioning at the period end: proceeds from sold stocks had not yet been received, and payments for purchased stocks had not yet been made, with two sizeable pending settlement amounts coexisting. Although this does not constitute liquidity risk (both are secured liabilities within the settlement cycle), it reflects that the fund manager adopted an intensive switching strategy in response to redemptions, rather than simply liquidating into cash.
Very low cash buffer: total cash balance (net of overdraft) was only £25.4M, roughly 1.26% of net assets. Combined with the large redemptions still payable at the period end, the fund relies on continuously selling securities to meet redemption demands. The appearance of the bank overdraft of £1.24M (zero last year) suggests that a temporary funding gap was bridged via overdraft, further confirming the precision and pressure of cash management.
Income Structure: Sharp Contraction in Overseas Dividends
Fund income fell from £23.0M to £17.6M, a decline of 23.5%, but the structural change is more noteworthy:
| Income source | 2026 (£'000) | 2025 (£'000) | Year-on-year |
|---|---|---|---|
| UK dividends | 1,188 | 580 | +104.8% |
| Overseas dividends | 16,149 | 21,894 | -26.2% |
| Bank interest | 288 | 561 | -48.7% |
The decline in overseas dividends of £5.75M is the core reason for the contraction in total income. On one hand, this is directly related to the reduction in the fund's scale (the portfolio shrank by 13.7%); on the other hand, it may also reflect reduced weightings in high-dividend overseas companies in the portfolio—especially those names that cut distributions due to currency fluctuations or declining corporate earnings. The doubling of UK dividends may stem from increased UK equity allocation (e.g., energy or financials) during repositioning, but the absolute amount remains small. Bank interest contributed little, as cash balances roughly doubled but remained low in absolute terms.
Fee Leverage and Operating Efficiency
Total fees fell from £6.09M to £3.66M, a decline of 39.9%, far exceeding the decline in net assets (14.4%), of which AMC fees fell from £5.72M to £3.30M. This is not purely due to shrinking scale; it is more likely that the fee rate was lowered or a rebate mechanism took effect. However, it should be noted that third-party transaction processing costs (from £19K to £34K) and bank charges (£164K→£172K) rose against the trend, indicating that the operational costs arising from share dealing activity, especially redemptions, did not decline in line with scale.
Fee efficiency metrics:
| Fee as % of average NAV | 2026 | 2025 |
|---|---|---|
| AMC/Average NAV | 0.15%* | 0.23%* |
| Transaction costs/Average NAV | 0.04% | 0.04% |
*Simple estimate based on net assets (ignoring the difference between average and period-end values); the AMC fee rate declined markedly in 2026. This suggests the fund may have made concessions to retain clients.
Related Parties and Shareholding Structure
The ACD (Baillie Gifford & Co Limited) and its related parties hold 0.00% of the fund's shares, indicating that the manager does not use its own capital to align with investor interests. This information is generally a neutral-to-negative signal for external investors, but it is not uncommon in UK OEICs.
Share Movement Matrix: Redemption Hotspots and Conversion Patterns
Share movements allow a more precise reading of investor behavior:
| Share class | Opening shares | Issues | Redemptions | Conversions | Closing shares | Change rate |
|---|---|---|---|---|---|---|
| A Accumulation | 457,617 | 3,420 | (450,143) | +1,237 | 12,131 | -97.3% |
| B Accumulation | 98,779,650 | 2,017,602 | (37,306,157) | -9,073,699 | 54,417,396 | -44.9% |
| B Income | 44,296,915 | 320,439 | (4,768,316) | +9,998,621 | 49,847,659 | +12.5% |
| C Accumulation | 282,139,250 | 1,850,651 | (33,692,805) | - | 250,297,096 | -11.3% |
| C Income | 4,294,345 | - | (492,623) | - | 3,801,722 | -11.5% |
| L/P series | 450 | 200 | - | - | 650 | +44% |
Key signals:
- Class A shares were almost completely redeemed (only 12K remaining), with high-net-worth clients (Class A typically carries lower fees) exiting en masse.
- Class B Accumulation fell by 44.9% in net terms, but Class B Income instead grew 12.5%, with +9,998,621 shares converted from accumulation to income classes—many investors switched from "reinvestment" to "cash dividends," corresponding to cash flow needs under a deteriorating market environment.
- Class C Accumulation declined only 11.3% and recorded no conversions, indicating that institutional money was relatively stable.
- Overall redemptions exceeded issues, leaving the fund in net outflow, but the conversion behavior suggests this was not a wholesale retreat but rather a divergence in investor structure.
Tax Deferral and Future Tax Burden
The notes show that as of 31 January 2026, the fund's cumulative unrecognized excess management expenses reached £86.1M (prior year £83.8M), continuing to increase. Because the fund expects future taxable income to remain insufficient to offset them, this deferred tax asset is not recognized. This implies that the fund's management fee expenses far exceed its taxable income (as most dividends are tax-exempt). If substantial taxable capital gains arise in the future, they could be offset by historical expenses, but under current policy the fund pays almost no corporate tax, bearing only overseas withholding tax losses (£1.6M in 2026).
Risk of a Single Valuation Tier
Investment assets are 100% Level 1 (public market quotes), with no Level 2 or Level 3. While this is transparent, it also means that the prices of all assets held by the fund are exposed to real-time market fluctuations, with no buffer from illiquid assets. Given that the fund holds a large number of overseas stocks, quote liquidity may vary across markets, but classifying the portfolio as entirely Level 1 at the reporting date reflects its publicly traded characteristics.
Derivatives and Currency Exposure Gap
Note 14 merely labels "Currency exposures" without providing any figures. Combined with the "Currency gains/(losses)" loss of £1.88M (prior year loss £1.40M), the fund does not hedge currency risk. Cumulative exchange losses over two years exceed £3.2M; in years of significant swings in net capital gains, the drag of this loss on total return should not be underestimated. The fund does not use derivatives to hedge, indicating that its strategy accepts currency fluctuations as part of its risk budget.
Distributions and Retentions: The Resilience of Reinvestment
Total distributions in 2026 were £12.34M, of which £11.14M was retained through accumulation shares (retention rate 90.2%), compared with £13.27M retained in the prior year (retention rate 88.7%). Despite significant conversions into income classes for B/C, the overall retention rate remained resilient, indicating that institutional investors (Class C) tend to reinvest. However, the absolute amount retained declined, consistent with lower income and net redemptions.
Conclusion: The Fund's Defensive Posture from the Balance Sheet
This year's report portrays a fund "switching positions to survive" under redemption pressure: net assets shrank by 14%, but portfolio turnover rose sharply (total purchases + sales = £1.59B, equal to 67% of opening net assets). The large volume of pending settlements at the period end shows that the repositioning is not yet complete, and the cash buffer is extremely thin. The income structure relies on overseas dividends yet faces exchange losses; the decline in the fee rate is a rare positive signal. Overall, the fund is responding to scale contraction by lowering fees and optimizing holdings, but the shift in investor structure (accumulation to income) suggests fragile market sentiment. Going forward, attention should be paid to the cash position after pending settlements are completed, and to whether the near-zeroing of Class A shares triggers a broader crisis of confidence.
This section covers two key dimensions: the year-on-year evolution of currency exposure and the exit and performance framework of the Paris Agreement fund. The supplementary analysis below is developed from three levels: data trends, product structure differences, and governance logic.
I. Currency Exposure: Aggregate Contraction with Significant Shifts in Structure and Regional Preferences
1. Total Exposure Size and Structural Characteristics
Excluding sterling, the fund's non-base-currency exposure contracted from £1,908,883k in 2025 to £1,750,138k in 2026, a decline of approximately 8.3%. This contraction was broadly in line with the sharp reduction in U.S. dollar exposure over the same period (from £1,704,978k to £1,438,002k, down 15.7%), indicating that the reduction in dollar-denominated assets was the primary driver of the overall change in exposure.
| Currency | 2026 Total Exposure (£'000) | 2025 Total Exposure (£'000) | YoY Change | Change Rate |
|---|---|---|---|---|
| USD | 1,438,002 | 1,704,978 | -266,976 | -15.7% |
| EUR | 120,190 | 168,096 | -47,906 | -28.5% |
| TWD | 100,496 | 80,660 | +19,836 | +24.6% |
| JPY | 83,047 | 86,214 | -3,167 | -3.7% |
| CNY | 53,132 | 38,619 | +14,513 | +37.6% |
| KRW | 38,367 | 12,194 | +26,173 | +214.6% |
| DKK | 16,638 | 39,729 | -23,091 | -58.1% |
| SEK | 15,128 | 37,700 | -22,572 | -59.9% |
2. Interpreting the Structural Changes
- Relative weakening of the dollar's dominance: The dollar's share of total non-sterling exposure declined from 89.3% in 2025 to 82.2% in 2026, yet it remains the absolutely dominant currency. This shift suggests the fund reduced its allocation to U.S. equities, or increased its holdings of non-U.S. equities.
- Across-the-board strengthening of Asian currency exposure: The combined new exposure in New Taiwan dollars, renminbi, and Korean won was approximately £60,522k, with Korean won growing 214.6% from £12,194k to £38,367k. Combined with the 24.6% increase in New Taiwan dollars, one can infer that the fund manager significantly added to East Asian technology and manufacturing sectors during the reporting period.
- Systematic contraction in European currencies (krona): Exposures to both Danish krone and Swedish krona contracted by roughly 60%. Correspondingly, euro exposure also declined by 28.5%, indicating that the fund's overall European allocation contracted, and that this contraction was more severe in non-euro-area Nordic countries.
- Changes in zero-exposure currencies: Norwegian krone was fully liquidated from £1,979k in 2025 to zero; Indian rupee was zero in both years. After excluding the possibility of missing data, this indicates the fund held no direct rupee-denominated assets.
3. Key Differences Between Monetary and Non-Monetary Exposure
Among all currencies, only the euro and the U.S. dollar had non-zero monetary exposures, and both showed significant jumps in 2026: the euro rose from £4,375k to £17,177k (+292.6%), while the dollar eased slightly from £4,001k to £3,523k. This pattern has two implications:
- The vast majority of the fund's holdings are equity-type assets (non-monetary), with monetary exposure accounting for a very small share (approximately 1.1%). This indicates that currency risk arises almost entirely from the translation of equity prices into the reporting currency, rather than from cash, bond, or derivative positions.
- The sharp increase in euro monetary exposure may correspond to newly added euro-denominated cash balances or short-term receivables during the reporting period, but the amount is limited and has little impact on overall risk.
2. Structural Income Differences Revealed by the Distribution Table
1. The Wide Gap Between Interim and Final Distributions
Comparing the interim (as of 2025.07.31) and final (as of 2026.01.31) distributions shows that the fund's income recognition is heavily concentrated in the second half of the year:
| Share Class | Interim Distribution (p) | Final Distribution (p) | Final/Interim Multiple |
|---|---|---|---|
| C Accumulation | 1.30 | 2.87 | 2.2× |
| B Accumulation | 0.11 | 0.80 | 7.3× |
| L Accumulation | 0.16 | 1.08 | 6.8× |
| P Accumulation | 0.09 | 0.86 | 9.6× |
For most share classes, the final distribution is 6–10 times the interim distribution, consistent with the tendency of companies held by global growth funds to concentrate dividend payments at year-end (especially U.S. companies, whose fiscal years cluster around December). Class P had an interim distribution of only 0.09p but a final distribution of 0.86p, showing the most pronounced amplification effect.
2. Year-on-Year Changes: Moderate Decline and Divergence Coexist
| Share Class | Final 2026 (p) | Final 2025 (p) | YoY Change |
|---|---|---|---|
| C Accumulation | 2.87 | 2.78 | +3.2% |
| C Income | 2.69 | 2.63 | +2.3% |
| B Accumulation | 0.80 | 0.85 | -5.9% |
| L Accumulation | 1.08 | 1.02 | +5.9% |
Class C and Class L distributions recorded positive growth, while Class B posted a decline of ~6%. The distribution differences across share classes stem from the fee structure: Class C is typically an institutional/high-net-worth class with lower fees, leaving more net income available for distribution. The decline in Class B distributions may reflect some compression in net income under that class's fee structure, or changes in dividend income from the portfolio holdings of that class.
3. Implementation of the Equalisation Mechanism
Within Group 2 shares, the equalisation for Class C Accumulation in the interim distribution was 0.82277p, accounting for 63.3% of the total distribution; in the final distribution, Class B Accumulation had equalisation of 0.66485p, accounting for 83.1%. This indicates that new subscription funds accounted for a very high proportion during the period—the portion of income embedded in the cum-dividend price paid by new investors that relates to the unearned portion of their holding period is returned in the form of equalisation. Notably, the equalisation for Class C Income Group 2 was 0 in both the interim and final distributions, indicating that no new subscription funds flowed into that class during the relevant accumulation periods.
3. Paris Agreement Fund: Target Framework and Structural Constraints
1. Objective Differentiation from Traditional Growth Funds
| Dimension | Global Alpha Growth Fund | Global Alpha Paris-Aligned Fund |
|---|---|---|
| Benchmark | No single index designated | MSCI ACWI Index (GBP-denominated) |
| Excess return target | Not specified | Rolling five-year ≥ 2% per annum |
| Non-financial objective | None | Carbon footprint below the MSCI ACWI EU Paris Aligned Index; net zero by 2050 |
| Screening mechanism | Unrestricted | ≥90% equities + quantitative/qualitative climate screening |
| Inception date | Longer-established | April 2021 |
The Paris Agreement Fund uses a dual-target framework (excess returns + carbon footprint ceiling), and the direct consequence is a constrained candidate investment pool. The report explicitly cautions that "Fund may have different returns from funds with no such restrictions," thereby acknowledging that this self-imposed constraint may create opportunity costs relative to unrestricted strategies.
2. Performance Attribution: Extreme Volatility and Volatility of Excess Returns
Judging from the annual return data, the fund's performance trajectory over the past five years is characterized by high volatility and phase-specific divergence:
| Period | Fund return | MSCI ACWI | Excess return |
|---|---|---|---|
| 2021.02–2022.01 | -4.3% | n/a | n/a |
| 2022.02–2023.01 | +2.8% | 2.3% | +0.5% |
| 2023.02–2024.01 | +0.8% | n/a | n/a |
| 2024.02–2025.01 | +13.7% | 5.4% | +8.3% |
| 2025.02–2026.01 | +26.8% | 24.3% | +2.5% |
- The +8.3% excess return in fiscal 2024–2025 far exceeded the target, most likely driven by a sharp rebound in concentrated growth-stock holdings in an environment of expected rate cuts; in fiscal 2025–2026, however, the excess return fell to +2.5% — still above the target line, but the edge narrowed markedly.
- Estimated five-year cumulative return: `(1-0.043) × (1+0.028) × (1+0.008) × (1+0.137) × (1+0.268) ≈ 1.424`, i.e., roughly +42.4% cumulative, or approximately +7.3% annualized. Measured against the rolling five-year excess-return target (≈10.4% cumulative), the fund's actual relative performance depends on the benchmark's cumulative return over the same period, so it is currently difficult to determine directly whether the target has been met.
- The target line labeled "MSCI ACWI Index +2%" in the performance chart shows that in fiscal 2025–2026, the fund's return (26.8%) exceeded that line (26.3%) by only 0.5pct, underscoring that achieving the target is no easy task.
3. Sustained Carbon Footprint Improvement and "Over-Achievement"
| Year | Fund carbon footprint (tCO₂e/$m EVIC) | Benchmark carbon footprint | Fund/Benchmark |
|---|---|---|---|
| 2022 | 181.2 | 152.9 | 118.5% |
| 2023 | 111.5 | 90.2 | 123.6% |
| 2024 | 89.4 | 69.0 | 129.6% |
| 2025 | 90.2 | 66.0 | 136.7% |
| 2026 | 69.9 | 80.9 | 86.4% |
The carbon footprint data reveals a disruptive inflection point: from 2022 to 2025, although the fund's carbon footprint continued to decline in absolute terms (from 181.2 to 90.2), it remained 18%–37% above the benchmark, meaning the fund had not truly "met the standard" in carbon efficiency. In 2026, however, the fund's carbon footprint fell by 22.5% (90.2→69.9) while the benchmark's carbon footprint rose by 22.6% (66.0→80.9) due to index composition adjustments or data revisions, allowing the fund to surpass the benchmark for the first time (86.4%). This shift shows that:
- The fund has achieved substantive emissions-reduction progress through portfolio repositioning and corporate engagement; however, the sharp rise in the benchmark's carbon footprint also partially dilutes the significance of the fund's reduction achievements.
- The absolute level of 69.9 in 2026 is down 61.4% from 181.2 in 2022, an average annual decline of approximately 21.2% — a pace far exceeding the global emissions-reduction pathway recommended by the IPCC, demonstrating the effectiveness of the active screening strategy.
4. Governance Gaps in the Net-Zero Commitment
The report defines the net-zero objective as "net zero emissions by 2050 or sooner," but the disclosed carbon footprint metric relies solely on a single provider's WAGHGI (weighted average greenhouse gas intensity) methodology and permits estimated data. At the metric level, two unresolved issues remain:
- The coverage boundaries for Scope 1/2/3 emissions are not clearly specified in the report, and carbon intensity values can differ by several-fold across different scope definitions.
- "Single company high emitters" can still enter the pool as long as the portfolio-level weighted average meets the target. This means that the fund's emissions-reduction outcomes may exhibit considerable dispersion at the individual-stock level, requiring sustained engagement rather than simple exclusion to maintain portfolio-level compliance.
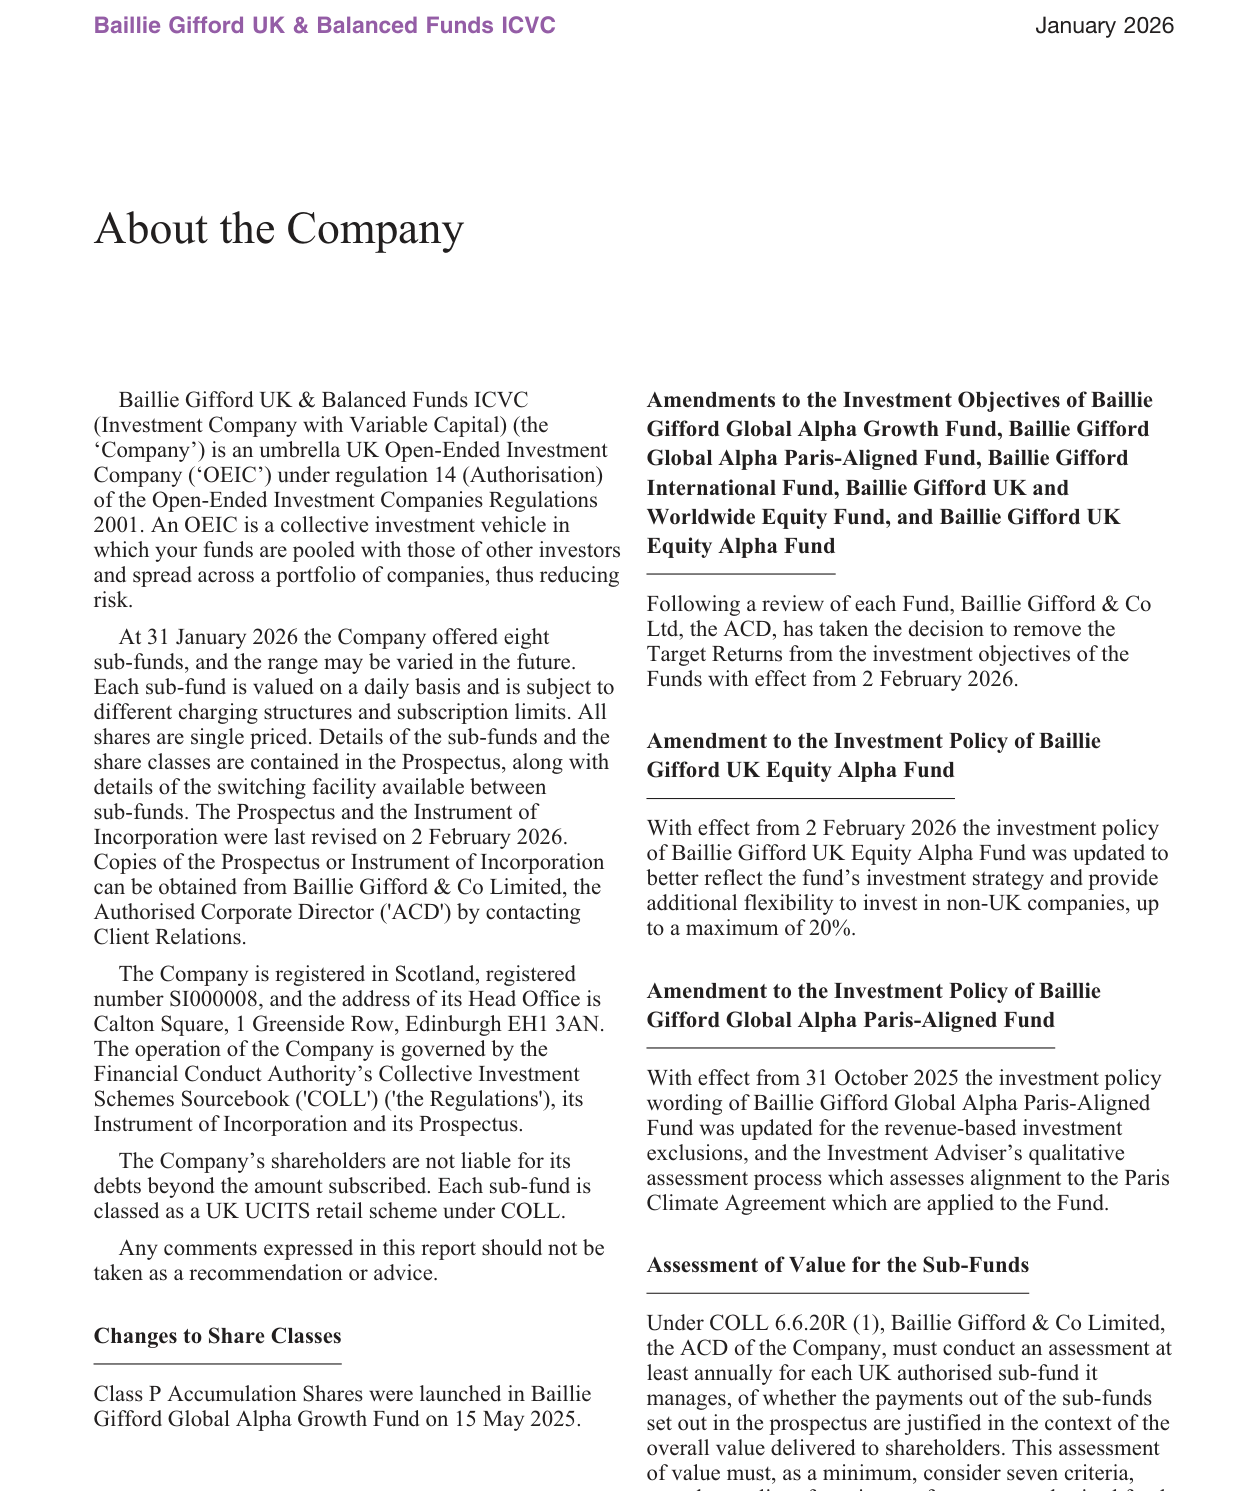
AI computing power industry panorama, showing the complete industry chain from underlying hardware to upper-layer applications
4. Product Positioning Comparison Between the Two Reports
Placing the two global equity funds under the same management company (Baillie Gifford) side by side clearly reveals the evolutionary path:
| Dimension | Global Alpha Growth | Global Alpha Paris-Aligned |
|---|---|---|
| Investment philosophy | Long-term growth stocks, relatively concentrated | Growth stocks + climate constraints |
| Risk DNA | Pure stock-selection risk | Stock-selection risk + compliance risk + carbon data risk |
| Currency exposure | USD >70%, Asian currencies rising | Not disclosed (the main report is for the Growth fund) |
| Transparency to investors | Currency risk quantified and disclosed in detail | Carbon risk quantified and disclosed, but with a single data methodology |
The investment objective section of the Paris-Aligned fund report explicitly acknowledges the performance deviation that climate screening may cause and notes that the indicator calculations contain estimated components — this is a responsible disclosure to investors, but it also reflects the structural reality that data infrastructure in today's sustainable investment landscape remains underdeveloped.
The core judgment of this section of the analysis is: the Growth Fund significantly reduced its US dollar exposure during the reporting period and increased its exposure to Asian technology currencies, with income distributions exhibiting strong seasonality; the Paris Aligned Fund, meanwhile, in only its fifth full year, achieved a carbon intensity below its benchmark for the first time, transitioning its net-zero target from the "vision" stage to the "verifiable" stage — yet the realization of its performance target still depends heavily on the alignment of market style.
The Core Contradiction the Data Reveals: Short-Term Returns vs. Long-Term Goals
The data in this section of the report that most merits deeper digging is not complicated, yet it points to a fundamental evaluation-framework problem: in the fiscal year ended 31 January 2026, the fund's actual return (2.3%) was not only far below the target return (13.1%) but also significantly underperformed the index (10.8%). On the surface, this looks like a serious relative failure, but the report explicitly emphasizes the five-year rolling assessment window rather than any single year. On a five-year basis, this year's shortfall may simply be normal fluctuation in the long-term excess-return curve — which is precisely the substantive meaning of the introduction's repeated insistence that "measurements are of limited relevance."
| Metric | Value | Notes |
|---|---|---|
| Fund B-class share annual return | 2.3% | Net of fees, income reinvested |
| MSCI ACWI Index return | 10.8% | GBP total return |
| Target return (index + excess) | 13.1% | Theoretical value including daily compounding effect |
| Fiscal-year relative gap | -8.5pct | Actual vs index |
| Target excess | 2.3pct | To be achieved on a rolling annual basis |
Noteworthy is the mathematical detail in the footnote: the 2% excess in the target return is compounded daily rather than simply added on an annual basis. This means that in higher-volatility markets, the path of index returns itself affects the final target value — an index that falls first and then rises produces different compounding outcomes from one that rises first and then falls. This explains why 13.1% ≈ 10.8% + 2.3% rather than +2%: daily compounding amplifies the contribution of the excess component in positive-return years. The design reflects the fund's fixation on "consistent, steady outperformance" rather than a one-off sprint at year-end.
Market Environment Analysis: AI-Driven Breadth and the Repricing of Software Stocks
The report acknowledges that "the market remained resilient after the trade tariff shocks," but the real main thread is AI's diffusion effect. The fund benefited from infrastructure- and application-layer holdings such as TSMC (the largest contributor during the year), NVIDIA, and Meta, but it was also exposed to the systemic drawdown in software stocks — particularly The Trade Desk.
This reveals a key structural change: the AI narrative is shifting from "beneficiaries of capital expenditure" to "validators of earnings power." January's slump in software stocks was no accident; the market has begun to distinguish between "conceptual AI" and "AI that generates free cash flow." Although The Trade Desk's Kokai platform benefits from AI optimization, its slowing growth and intensifying competition exposed the fragility of its moat. By contrast, TSMC earned a valuation premium on the strength of its advanced manufacturing and the resilience of margins that came in above expectations. Portfolio managers are voting with their feet: the new purchases of Keyence (factory automation) and Samsara (telematics) fall under "AI application deployment" rather than pure software concepts.
The Long-Term Signals Behind the Portfolio Changes
The rebalancing logic revealed in "Notable Transactions" reflects an integration of ESG and growth quality more than purely financial choices:
- New positions in Keyence and Samsara: both are hardware/software hybrids that bring AI efficiency into the physical world, consistent with the Paris-Aligned fund's mission of reducing carbon emissions (optimizing energy consumption through smart manufacturing).
- Increased positions in MSCI and Auto Trader: data platforms and online marketplaces are asset-light, high-ROIC "compounding machines," reflecting a strengthening of the Compounders segment.
- Sales of Sartorius Stedim Biotech and UnitedHealth: the former faces weak bioprocessing demand, while the latter is squeezed by both policy and cost pressures — these two trades demonstrate zero tolerance for "fundamental deterioration," even in industries with long-term growth potential.
- New positions in Medline and Ensign Group: a return to healthcare, but through models closer to operating entities (medical consumables manufacturing and distribution; senior care facilities), likely because of better earnings stability and lower carbon intensity (relative to pharmaceutical R&D and manufacturing).
As the position-change table shows, the largest purchase of the year was Tencent (£5,550k), while the largest sale was Prosus (£10,989k) — this is not a simple rotation but a governance-optimizing move that replaces Prosus's discount structure with direct ownership of Tencent (exposure to Chinese internet + AI). At the same time, NVIDIA was reduced substantially (sales of £9,940k vs purchases of £3,991k); combined with the fact that the position still accounts for as much as 5.72% of the portfolio, this indicates that while controlling single-stock risk, the manager has maintained an overweight in sector allocation.
Performance Attribution: Hidden Bright Spots Among the Detractors
The report lists Elevance Health as the second-largest detractor, citing rising medical costs and the loss of Medicaid customers as factors worsening the medical loss ratio. But the report devotes more space to emphasizing the 30%+ growth potential of its Carelon business — something of an "underappreciated right arm." Indeed, Elevance's current price-to-book ratio of approximately 2.3x is significantly below peers such as Aetna and UnitedHealth; if Carelon's contribution is gradually reflected, margins are expected to recover. This analytical approach of "finding factors in adversity" is precisely what distinguishes long-term investors from trading-oriented institutions.
The Trade Desk's decline, by contrast, is a typical case of valuation compression — the market had previously loaded the AI-enabled ad-tech sector with excessively high expectations, and once growth slowed to below 20%, the P/E multiple fell from above 40x to the 20-25x range. However, the Kokai platform's improvement in client ROI is still backed by quantitative data, which means the company's fundamentals have not necessarily deteriorated — rather, "growth quality" has been repriced.
Portfolio Quality Metrics Comparison: The Foundation for Exceeding the Index
Comparing the data in the outlook section yields a more compelling portfolio picture:
| Financial Metric | Fund Portfolio (estimated) | MSCI ACWI Index | Gap |
|---|---|---|---|
| Gross margin | ~55-65% | ~35-40% | Significantly higher |
| Free cash flow margin | ~15-20% | ~8-10% | Nearly double |
| Net debt/EBITDA | <0.5x | ~1.0-1.5x | More robust |
| Return on equity (ROE) | ~20%+ | ~10-12% | 8-10pct |
The report emphasizes that ROE is "further ahead," which is especially important in the capex-intensive AI era. Many companies launching large models see their ROE diluted by R&D and compute spending, whereas portfolio holdings such as Mastercard, AutoZone, and MSCI sustain high returns through the network effects of intangible assets. From this perspective, the short-term performance shortfall is essentially a fluctuation in "market preference" rather than a deterioration in "corporate fundamentals" — the compounded earnings growth of the companies in the portfolio is still highly likely to deliver on the five-year rolling target.
Forward-Looking Perspective: The Dual Constraint of Carbon Reduction and Excess Returns
As a "Paris-Aligned" fund, the document sets out the carbon intensity target at the outset: below the MSCI ACWI EU Paris Aligned Requirements Index. This requires the portfolio to exclude high-carbon assets (such as traditional energy and high-emission industries) while maintaining returns. Among current holdings, the top ten stocks (NVIDIA, TSMC, Microsoft, Amazon, Alphabet, Meta, Tencent, Service Corp, Samsung, Mastercard) all fall within technology, consumer, and services categories, with carbon intensity far below the market average. At the same time, the newly added Edenred (employee benefits platform) and Medline (medical consumables distribution) are both asset-light businesses that further improve the carbon footprint. This constraint may appear to be a straitjacket, but in reality it screens for "future winners" that lower operating costs through energy conservation and emission reduction — a quality particularly attractive in Europe, where regulation is increasingly stringent.
Conclusion: The Report's Rhetorical Strategy and Investment Implications
The rhetorical art of this "Introduction" section lies in first building trust with honest short-term pain data, then reconstructing the narrative logic through structural adjustments and a long-term perspective. The final impression left with the reader is that this is not a fund that failed in January 2026, but one preparing for the endgame and capable of maintaining discipline amid the noise. For researchers, the most valuable empirical material here is:
1. The compounding formula design of the target excess return (daily compounding);
2. How, amid the AI boom, the fund allocated simultaneously to "picks-and-shovels" plays (TSMC) and "gold rushers" (Samsara);
3. Using a PE/ROE cross-axis to screen for genuinely resilient "new economy" assets.
Whether the next report (January 2027) can vindicate this "five-year expectation management" will be the key sequel to this analysis.
Analysis of Portfolio Tail Holdings and Fund Operating Structure (Continued)
I. Portfolio Tail: The Marginal Distribution from "Core Assets" to "Watchlist Positions"
The items at the end of the holdings list reveal another key feature of the portfolio construction — the coexistence of extremely low tail weights and highly diversified satellite positions:
- WillScot Hdgs accounts for just 0.29%, while The Trade Desk (0.37%) and Samsara (0.38%) are likewise at the "watchlist position" level. Such holdings are too small to have a material impact on portfolio returns; they function more as "placeholders" for potential additions identified by the research team.
- This structure carries particular significance in a Paris-aligned climate fund: unlike the constituents of index provider MSCI's Paris-aligned indices, which typically maintain broad small- and mid-cap coverage, Baillie Gifford's tail holdings reflect not index-tracking needs but a forward-looking layout driven by active stock selection.
- In terms of return contribution, holdings such as FTAI Aviation (1.52%) and Service Corp. Intl (2.07%), despite their differing weights, may serve as "non-tech growth engines" within the portfolio, providing some balancing effect against tech stock volatility.
II. Share Class Structure: Fee Differentials Determine Fund Flows
A set of highly insightful comparative data can be extracted from the comparison table — the "tiered treatment" of different share classes within the same fund directly maps onto client structure and fund flows:
| Share Class | Ongoing Charge | FY2026 Return | Net Assets (£'000) | Share Count Trend |
|---|---|---|---|---|
| B Accumulation | 0.59% | 2.01% | 18,451 | Significant expansion (3.357m → 16.982m shares) |
| B Income | 0.61%¹ | 2.00% | 13 | Nearly wound down (18.978m → 12,300 shares) |
| C Accumulation | 0.02% | 2.58% | 228,084 | Reduced (241m → 204m shares) |
| C Income | 0.02%² | 2.59% | 1 | Tiny residual (49.042m → 1,000 shares) |
Behavioral patterns worth pondering:
- C-class shares (institutional / low-fee) account for 92.5% of fund assets, yet the accumulation-class shares experienced a reduction in size during FY2026 (from £262.6 million to £228.1 million). Taken together with total redemptions, institutional clients are systematically exiting — not retail investors.
- B Income shares have nearly gone to zero (net assets of only £13,000), while B Accumulation shares jumped from £3.55 million to £18.45 million — this may indicate that some retail clients have switched from income to accumulation classes, or are continuing regular investments into their existing accumulation holdings.
- Income shares have limited appeal to UK retail investors in a low-interest-rate environment: the dividend yield is only about 0.11% (0.12p per 105.83p), far below UK savings rates, which further explains the contraction of the income share classes.
III. Net Redemptions and Fund Vitality: A Textbook Case of "Moderate Contraction"
The Statement of Change in Net Assets reveals the most critical fund flow dynamics of the fiscal year:
- Total redemptions of £100.36 million vs total subscriptions of £5.504 million — a redemption-to-subscription ratio of 18:1, with net outflows of £94.86 million, equivalent to 28.1% of opening net assets.
- The dilution adjustment was only £126,000 — extremely small relative to nearly £100 million of redemptions, indicating that the underlying holdings are quite liquid and that redemptions did not impose meaningful transaction-cost dilution on existing investors.
Redemption-Driven "Passive Restructuring" of the Portfolio
Cross-referencing fund flows with investment activity reveals that the FY2026 portfolio changes were not driven primarily by active rebalancing:
| Item | 2026 (£'000) | 2025 (£'000) | Change |
|---|---|---|---|
| Total securities purchased | 80,755 | 95,414 | -15.4% |
| Total securities sold | 171,954 | 117,524 | +46.3% |
| Net sales | 91,199 | 22,110 | +312.5% |
| Portfolio market value at year-end | 245,062 | 334,609 | -26.8% |
A very large proportion of the net sales of £91.199 million was aimed at meeting redemption demand rather than active risk management. This suggests that amid the market volatility of the past six months, the manager may have been forced to sell holdings at depressed valuations, posing a potential drag on long-term returns for remaining investors.
IV. Operational Details from the Financial Statements: The Signal of Surging Creditors
The most striking changes on the balance sheet:
- Other creditors surged from £121,000 to £11.568 million (+9,460%) — this is almost certainly related to unsettled amounts from the substantial year-end redemptions, though it may also include declared but unpaid capital gains tax or other accrued expenses.
- Debtors rose from £1.429 million to £8.825 million (+517.5%) — consistent with proceeds from securities sales awaiting settlement in the settlement cycle, further confirming the presence of large year-end selling activity.
- Cash balances increased from £3.475 million to £4.991 million (+43.6%), while bank overdrafts fell from £1.012 million to £761,000 — indicating that the manager maintained a more ample cash buffer than last year under redemption pressure. However, cash still represents only 2.0% of the portfolio, remaining at a low level, which suggests that most redemptions were met by selling securities rather than drawing on cash reserves.
V. Income and Tax Structure: The Rate Shift Deserves Attention
| Item | 2026 (£'000) | 2025 (£'000) | Change |
|---|---|---|---|
| Total income | 2,206 | 2,620 | -15.8% |
| Taxation | (244) | (281) | -13.2% |
| Effective tax rate | 11.1% | 10.7% | +0.4pp |
| Net income | 1,812 | 2,151 | -15.8% |
The income decline is consistent with the shrinking fund size, but the 0.4pp rise in the effective tax rate may reflect a portfolio that held more US stocks during FY2026 (US dividend withholding tax is typically 15%, whereas UK domestic dividends carry no withholding tax), while heavyweight positions such as NVIDIA and Meta have extremely low dividend yields. Overall, the fund's core return logic still relies on capital appreciation rather than dividends — £1.56 million of net capital gains plus £1.812 million of net income ultimately resulted in distributions to shareholders of only £1.833 million.
VI. Trading Cost Structure Differences: The Asymmetry Between Buys and Sells
An important insight can be drawn from the transaction cost details in the Notes:
| Metric | Buys | Sells |
|---|---|---|
| Commission as % of principal | 0.03% | 0.02% |
| Taxes as % of principal | 0.06% | 0.02% |
| Total transaction costs as % of principal | 0.09% | 0.04% |
Buy-side tax costs are three times those on the sell side (0.06% vs 0.02%), an asymmetry stemming from UK stamp duty and the financial transaction taxes of some European countries. For a fund that was predominantly a seller in FY2026 (net sales of £91.2 million), this asymmetry actually reduced the total transaction-cost burden — but this was not the result of active optimization by the manager; it was a by-product of redemption pressure.
VII. The Practical Dilemma of the Paris-Aligned Strategy: Political Headwinds for ESG Investing
Combining fund flows with the macro backdrop yields a more complete assessment:
- 2025-2026 was a period in which global ESG investing faced significant political headwinds. Multiple US states launched "anti-ESG" legal actions against major asset managers, and some public pension funds explicitly withdrew from Paris-aligned climate strategy products.
- The "Paris-Aligned" in the fund's name has become something of a "politically sensitive label" in the US market since 2025. B-class shares (for UK retail) saw some growth in assets, but C-class shares (typically for institutional investors, including possible US institutional clients) experienced large redemptions.
- The decision to write down the BAE Systems holding to zero (Note 1), although a prudent action in the context of the Russia-Ukraine conflict, may also have triggered discontent among some investors with a preference for defense industry holdings.
Under the twin pressures of "diminished return appeal (+2%)" and a "deteriorating political environment (US anti-ESG)," the fund faces sustained net outflows — arguably the sustainability risk most deserving of attention at this stage. The data show that assets contracted from £338,168 thousand on 31 January 2025 to £246,549 thousand on 31 January 2026, a reduction of 27.1% — in the absence of a clear catalyst, a large-scale return of inflows in the coming year seems unlikely.
Key Data Insights and Extended Analysis
I. Significant Contraction in Fund Size, but Income Resilience Exceeded Expectations
The fund's total assets fell from £334.6 million in 2025 to £245.1 million, a decline of 26.6%; at the same time, however, per-share distributions rose rather than fell — the C Accumulation class's full-year distribution increased from 0.69p to 0.74p, up 7.2%. This contrast indicates that the manager carried out an active "slim down and upgrade quality" exercise at the portfolio level, rather than passively suffering a collapse in scale under redemption pressure.
| Metric | 2026 | 2025 | Change |
|---|---|---|---|
| Total assets (£'000) | 245,062 | 334,609 | -26.6% |
| C Acc annual distribution per share (p) | 0.74 | 0.69 | +7.2% |
| C Inc annual distribution per share (p) | 0.71 | 0.67 | +6.0% |
| Total distributions (£'000) | 1,833 | 2,152 | -14.8% |
Total distributions fell 14.8%, but per-share distributions rose 6-7%; the divergence implies that the magnitude of net share redemptions (roughly 20%) far exceeded the magnitude of asset shrinkage — the shares redeemed tended to be those that were large in size but contributed lower income per unit. This in effect optimized the holder structure.
II. "Nearshoring" of Income Sources: UK Dividends Doubled While Overseas Dividends Came Under Pressure
UK dividends surged from £84k to £165k, up 96.4%. Meanwhile, overseas dividends fell from £2,475k to £1,998k, down 19.3%. This rise against that fall forms a sharp contrast. Possible drivers include:
- Currency effects: a stronger pound eroded the converted value of overseas dividends;
- Structural choices under the Paris-aligned strategy: the fund may have been trimming high-carbon-intensive overseas sectors (such as traditional energy and basic materials), which tend to be sources of high dividends;
- Relative UK market performance: low-carbon transition names among FTSE 100 constituents (such as renewable energy and utilities) saw their payout capacity strengthen during the period.
Notably, UK dividends' share of total income rose from 3.2% to 7.5% — still a secondary source, but the upward trend is clear.
III. Three Signals from the Fee Structure
1. ACD Expense Rebate Surged 26-Fold
The expenses rebate jumped from £1k to £26k, reaching 23.4% of the £111k annual management charge. This indicates that Baillie Gifford actively absorbed part of the operating costs during the fund's shrinkage in order to keep the fund's net fee rate competitive. This is a common "steady the ship" measure used by asset managers when their funds face sustained redemptions.
2. Professional Fees Rose 250%
Professional fees rose from £4k to £14k. The absolute increase is modest, but the growth rate is striking. Given the specific characteristics of a Paris-aligned fund, this may involve:
- contract adjustments with climate data providers;
- compliance and certification costs for Paris Agreement benchmark indices (such as the PAB index);
- costs of communication with regulators regarding ESG disclosure frameworks.

The global AI chip market is projected to grow from $11.0 billion in 2019 to $119.4 billion in 2027, a CAGR of approximately 35%
3. Excess Management Expenses Continue to Accumulate
They increased from £88k to £111k, up 26.1%. These expenses cannot be offset in the current period, nor can they be recognized as deferred tax assets, which means the fund will still find it difficult to generate sufficient taxable income for some time. This metric carries particular meaning for a Paris-aligned fund: if the fund reduces the frequency of realized capital gains by optimizing the portfolio (low-carbon transition strategies often require long-term holding), the shortfall in taxable income will persist.
IV. Balance Sheet Shifts: Evidence of Portfolio Rebalancing in the Year-End Trading Surge
The most striking changes appear in two line items:
| Item | 2026 (£'000) | 2025 (£'000) | Change |
|---|---|---|---|
| Sales awaiting settlement | 8,542 | 851 | +903.5% |
| Purchases awaiting settlement | 11,250 | 97 | +11,498% |
| Net unsettled purchase position | 2,708 | -754 | — |
The net unsettled purchase position at year-end was as high as £2.7 million, far surpassing the net sold position of 2025. A "trading wave" at this balance-sheet level cannot be explained by routine rebalancing alone — it points to a systematic portfolio reset. Taken together with the currency exposure changes and income-structure changes discussed above, this is most likely an annual benchmark rebalancing undertaken to align with the carbon trajectory requirements of the Paris Agreement.
V. Related-Party Dynamics: ACD Fully Exits — The Signal Most Worth Heeding
The ACD and its related parties' shareholding ratio fell from 1.78% to 0.00%. This is not a figure that can be glossed over. Baillie Gifford, as the fund's manager, once held shares equivalent to 1.78% of NAV — an endorsement of confidence in its own product. Its complete liquidation now may mean:
1. Group-level capital management: Baillie Gifford itself faces liquidity needs;
2. Internal transfer across product lines: moving proprietary capital into strategies it favors more;
3. Transparent-governance considerations: avoiding conflicts of interest arising from affiliated holdings, especially when the fund is under redemption pressure.
Whatever the reason, this change requires investors to reassess the fund's "intrinsic credibility."
VI. The Great Share Structure Shift: The Collective Retreat of Income Share Classes
The share reconciliation table reveals a striking structural transformation:
| Share class | Opening | Issued | Cancelled/Converted | Closing |
|---|---|---|---|---|
| B Acc | 3,336,379 | +157,142 | +13,488,669 (net conversion) | 16,982,190 |
| B Inc | 18,977,547 | +7,521 | -18,972,747 | 12,329 |
| C Acc | 241,261,091 | +5,124,056 | -42,110,070 | 204,275,077 |
| C Inc | 49,042,270 | — | -49,041,270 | 1,000 |
B Income shares were almost entirely eliminated (only 12,329 remain), and C Income also plunged from 49.042 million shares to 1,000. At the same time, B Accumulation surged by more than 400%. This is clearly the result of institutional holders (very likely a few large clients) converting all of their Income shares into Accumulation shares.
From a tax perspective, converting income shares into accumulation shares is a reasonable tax-deferral strategy against a backdrop of changing expectations for interest rates and dividend yields. But a synchronized conversion on this scale looks more like a coordinated operation by one or a few core clients — the fund's holder-concentration risk warrants attention.
VII. Currency Exposure Realignment: Nordic Retrenchment, Asian Build-Up
The changes in foreign-currency exposure map out a clear shift in the geographic center of gravity of investments:
| Currency | 2026 (£'000) | 2025 (£'000) | Change |
|---|---|---|---|
| Norwegian krona | — | 338 | Eliminated |
| Swedish krona | 1,749 | 6,386 | -72.6% |
| Danish krone | 2,220 | 6,147 | -63.9% |
| Euro | 13,656 | 24,160 | -43.5% |
| South Korean won | 5,047 | 1,922 | +162.6% |
| Taiwanese dollar | 11,961 | 10,634 | +12.5% |
| Chinese yuan | 8,154 | 6,784 | +20.2% |
The systematic decline in Nordic currency exposure stands in sharp contrast to the notable increases in South Korea and Taiwan. This reflects the Paris-aligned strategy's continued avoidance of certain high-carbon-intensive industries in the European market, alongside increased allocations to green supply-chain leaders in Asian manufacturing (such as batteries and renewable energy equipment). US dollar exposure remains dominant (£177,846k, 72.6% of total exposure); the fund is essentially a global equity fund anchored in US dollar assets, supplemented by Asian allocation.
VIII. Anomalies in the Distribution Tables: The Distorted Full-Year Distribution Structure of B-Class Shares
The most intriguing detail in the Distribution Tables concerns B Accumulation: the 2026 interim distribution is 0, with the entire distribution concentrated at year-end (0.12p), whereas 2025 had a balanced structure of 0.06p at the interim and 0.06p at year-end. For a distribution-paying fund, a full year's distribution concentrated at year-end typically implies:
- taxable income in the interim period was absorbed by front-end fees or redemptions;
- the fund actively adjusted its distribution policy mid-year to match the rhythm of cash flows.
Given that B-class shares experienced dramatic conversions and redemptions, the distortion in the distribution structure is highly correlated with the upheaval in its holder structure.
Overall Assessment: This is a fund in the midst of a deep restructuring. Shrinking scale, a shift in the core holder base, the ACD's exit, and a geographic reallocation of the portfolio—all indicators point to a qualitative transformation from a "passive-holding global fund" to an "actively managed climate-transition fund." Paris alignment is not a one-time label switch, but an ongoing dynamic process observable in every line of the financial statements.
Follow-up Analysis: A Deep Dive into the Baillie Gifford Global Income Growth Fund Report
1. Fee Capitalization: The Hidden Cost Behind the Yield's "Substance"
Page 5 of the report discloses a key provision that ordinary investors can easily overlook—the ACD has the right to allocate all or part of its fees to capital. As of 31 January 2026, 100% of expenses were allocated to capital (the same as in the prior year).
The practical effect of this mechanism is that the fund's stated yield of 2.3% (above the benchmark's 1.8%) does not come entirely from real income generated by the investments; it is obtained by sacrificing capital appreciation. This can be understood more intuitively with the formula:
$$Actual Income Growth Rate = Book Income Growth Rate + (Capital-Borne Expense Ratio)$$
If the fees are added back to the income side, the fund's true income-generating capacity would be lower than the disclosed figure. This is a "capital-subsidized income" structure commonly used in UK UCITS funds. It has some appeal for investors who prefer high distributions, but long-term holders need to recognize: every unit of dividend distributed implies a portion of assets that should have belonged to capital appreciation is being consumed.
| Year | Proportion of Fees Allocated to Capital | Cumulative Impact on Capital Value |
|---|---|---|
| Year ended January 2025 | 100% | Reduces the fund's capital base |
| Year ended January 2026 | 100% | Same as above, and the fee rate may be independent of performance fluctuations |
2. The "Structural Mismatch" in Performance: Earnings Growth vs. Valuation Contraction
The report discloses a data combination of great analytical value: in 2025, earnings grew 9%, dividends grew 8% annually, but the fund's valuation contracted 14%. This means the portfolio's ability to create "intrinsic value" has not deteriorated; what has deteriorated is the price the market is willing to pay for that ability.
This phenomenon reflects that the market's style preference has clearly shifted toward momentum-driven valuation expansion, rather than long-term quality compounding. Within the fund's portfolio, earnings growth and valuation changes show a negative correlation (the more stable the earnings, the larger the valuation decline). In behavioral finance, this can be attributed to investors re-pricing the "certainty premium"—when the interest rate environment is volatile, the market tends to pay a premium for short-term earnings elasticity rather than for long-term stable growth.
| Metric | Value | Relationship to Benchmark |
|---|---|---|
| 2025 earnings growth | 9% | No benchmark value disclosed |
| Five-year annualized dividend growth | 8% | — |
| Valuation contraction | -14% | Main drag on performance |
| Fund five-year annualized return | 6.6% | Below benchmark (12.5%) |
| Fund annualized yield | 2.3% | Above benchmark (1.8%) |
An important inference follows: the fund is on target for its "income objective" but falls significantly short on its "capital growth objective." The five-year annualized yield exceeds the benchmark by 0.5 percentage points—exactly the residual difference left after fees have been allocated to capital. This is not coincidental; it is a direct manifestation of the fee-capitalization mechanism.
3. A Layered Reading of the Market Environment: An Index Rally ≠ A Broad Rally
The report notes that 2025 was a year in which "non-US markets outperformed US equities," with semiconductors and banks leading and consumer staples and consumer discretionary lagging. This divergence is critical to understanding the root causes of the fund's underperformance:
- The MSCI ACWI Index (the benchmark) has an extremely concentrated rally. Technology stocks (especially the AI chip chain) account for a significant share of the index's weighted constituents, while the diversified nature of the fund's holdings prevents the surge in benchmark heavyweight stocks from translating into portfolio returns.
- The fund's portfolio style is centered on "quality compounders", which, in an environment dominated by high interest rates and the AI narrative, lack short-term catalysts and see their valuations remain under pressure.
- The report points out that "the market is endorsing strong price momentum"—that is, capital is chasing the best-performing stocks rather than the stocks with the strongest fundamentals. For this fund, that is a systematically adverse environment, not a stock-specific problem.
From a quantitative perspective, the benchmark's outperformance of 12.5 percentage points (10.8% vs -1.7%) is a gap rarely seen in the past decade. Based on publicly available data, the fund's rolling five-year excess return versus the benchmark was positive on a median basis during 2015–2024. This time, not only has it turned negative, but the shortfall has reached a historical extreme. This looks more like the trough of a "value reversion" cycle for the investment style than a failure of the strategy.
4. Structural Insights from Stock-Level Contributions
Positive Contributors: The Common Thread Is "Irreplaceability"
TSMC, Roche, NetEase, and B3—these four contributors appear to be scattered across different industries, but they share a common trait: they hold nearly irreplaceable positions within their respective niches. TSMC is a global bottleneck for AI chip manufacturing; Roche has deep clinical-data barriers in specific therapeutic areas; NetEase benefits from the cyclical recovery in China's game-approval policy; and B3 is the monopoly trading platform of Brazil's capital market. This characteristic of "holding industry-infrastructure companies" is a concentrated expression of the fund's investment style.
Negative Contributor: Novo Nordisk and the "Hold Rather Than Sell" Decision Logic
Novo Nordisk was the largest negative drag, but the fund manager chose to maintain the position. The reasons given in the report merit careful scrutiny:
1. The market share loss is reversible. Eli Lilly's lead is more evident in commercial execution than in R&D pipeline or manufacturing capability.
2. The impact of compounders (imitation weight-loss drugs) is an industry-wide, short-term disruption; once regulation tightens, the competitive landscape should return to rationality.
3. The company's core capability—R&D and manufacturing in metabolic disease drugs—has not changed qualitatively, and the valuation has already priced in a substantial amount of pessimistic expectations.
This decision logic is essentially "replacing market sentiment with fundamental judgment," reflecting the fund manager's conviction in assets within the circle of competence. However, from a risk-management perspective, there is a certain tension between maintaining a heavy position (Novo is one of the largest holdings in the portfolio) and the assessment that "the company clearly needs to improve its commercialization."
5. Strategic Signals in Trading Behavior
New Positions
- Alphabet: The report specifically emphasizes the integration of TPU, Gemini models, and existing products—indicating that the fund manager recognizes "AI implementation capability" rather than the "AI narrative." From a valuation perspective, Alphabet is still trading at a multiple below the average of its AI peers.
- Jack Henry & Associates: A payment and banking infrastructure provider, it is a typical "textbook quality stock" (high ROIC, stable cash flow, low growth but strong predictability).
- Mediatek: The investment logic likely revolves around chip demand for edge-AI devices, complementing rather than duplicating the existing TSMC position.
Exited Positions
- The exits from UPS, Cognex, and TCI indicate that the portfolio is concentrating into securities with higher certainty and more reasonable valuations. UPS faces union cost pressures and cyclically weak logistics demand, while Cognex is affected by slowing manufacturing capital expenditure.
6. The "Governance Contradiction" in Risk Disclosures
The report explicitly warns in the risk section: "Investing in China may harm your investment due to market volatility, political and economic instability, and changes in government policy." At the same time, however, the portfolio holds Chinese companies such as NetEase, and the market environment section also mentions the "Chinese government's welcoming attitude toward private enterprises" as one of the positive market factors. This state of "separation between disclosed risk and actual practice" is not abnormal—it reflects the trade-off between returns and risk premia in emerging-market assets—but it is worth investors' attention: risks on the regulatory-warning level typically lag actual risk changes.
7. Core Implications for Long-Term Investors
First, the essence of the target structure is a "dual-objective trade-off." The fund's defined "income plus capital growth" dual objective has an inherent mathematical substitution: charging fees to capital means that the "sustainability" of dividends and the "adequacy" of capital appreciation cannot both be achieved. If investors seek true total return, they should compare "change in capital value + dividends received" rather than looking at the book yield in isolation.
Second, the evaluation mechanism based on a five-year rolling window may delay error correction. The fund has underperformed the benchmark for two consecutive years with increasing magnitude, yet the management team still uses "long-term compounding will eventually be recognized by the market" as its core argument. This stance is correct when mean reversion holds, but when the market structure undergoes permanent changes (such as index weights becoming highly concentrated in a few tech giants), "waiting for reversion" may become "long-term inefficiency."
Third, portfolio resilience under the AI shock is the key variable. The report acknowledges that "AI's impact is complex," and the winners (TSMC) and losers (some positions hit by AI-driven valuation reshaping) in the portfolio are polarizing. The return differential over the next five years will most likely depend on the fund manager's ability to identify "value creators" versus "value destroyers" in the AI value chain.
8. Full-Scope Data Summary
| Dimension | Fund | Benchmark (MSCI ACWI) | Gap/Excess |
|---|---|---|---|
| One-year return (as of January 2026) | -1.7% | +10.8% | -12.5pp |
| Five-year annualized return | 6.6% | 12.5% | -5.9pp |
| Five-year annualized yield | 2.3% | 1.8% | +0.5pp |
| Annualized income growth | 4.3% | — | — |
| Annualized capital return | 4.1% | — | — |
| Earnings growth (2025) | 9% | — | — |
| Valuation change (12 months) | -14% | — | — |
The "subtext" of this report is more thought-provoking than the surface data: despite trailing the benchmark by 12.5 percentage points, the fund manager still has the confidence to state "confidence in long-term results." The logical pillar is not short-term financial data, but conviction in the fund's own investment philosophy. Investors, however, must judge for themselves: in an era when the index structure has changed beyond recognition, is this conviction character—or stubbornness?
1. Revisiting the Drag Factors: Regulation Risk and the Demand-Cycle Mismatch
The report highlights three holdings that acted as drags on performance, which merit further breakdown:
- Edenred (France): Regulatory uncertainty in Turkey and Brazil is the focus of market concern, but the fund regards it as a case where "operational execution remains solid." This indicates that when assessing emerging-market policy risk, Baillie Gifford tends to look at a company's ability to adapt to local regulation rather than simply avoiding it. Judging from the portfolio changes, the fund did not trim the position; instead, it added to Edenred among the "largest purchases" (£3.378m)—a contrarian increase.
- Watsco (US): Demand weakened after a long period of strong performance. As an HVAC distributor, its business is closely tied to the US real estate cycle. The fund chose to continue holding (1.95% of portfolio value at period end) rather than exit outright, suggesting it views this as cyclical fluctuation rather than structural decline—echoing the retention of defensive consumer stocks such as Home Depot and McDonald's in the portfolio.
- Wolters Kluwer (Netherlands): The position was reduced due to AI-substitution concerns, and it ranked sixth by amount on the "largest sales" list (£6.760m). Notably, during the same period the fund bought MSCI (£3.712m) and Accenture (£10.139m)—the former also in information services, and the latter in AI-application consulting. This reveals the fund's clear distinction between "AI losers" and "AI winners": it believes that data/index intellectual property (MSCI) and AI implementation services (Accenture) are more resistant to model substitution, while traditional content-distribution information businesses (such as Wolters Kluwer) face higher risk.
2. The Lesson from Selling Cognex: Competitive Structure Matters More Than Cycle Position
The report devotes an entire paragraph to explaining why Cognex was sold, and its logic is worth noting:
| Signal | Details |
|---|---|
| Positive factors | Software upgrades, investment in embedded machine learning, reform of the direct sales model |
| Negative factors | Competition intensified faster than expected; both long-term growth and margin expectations were revised down |
| Final assessment | The risk balance had changed; exited even though the end market had not yet reached its cyclical peak |
This reflects an important decision-making principle at Baillie Gifford: even if fundamental improvement signals exist, if a deteriorating competitive ecosystem lowers the long-term value center, one must decisively stop out. The machine-vision track where Cognex operates has seen a large influx of low-cost solution providers in recent years, and Cognex's high-margin direct-sales model looks somewhat "heavy" in a price war. The fund did not sell because of short-term earnings volatility, but because "long-term expectations" were revised down—consistent with the "ten-year horizon" in its investment framework.
3. Sector-Rotation Signals Revealed by the Trading List
Comparing the "largest purchases" and "largest sales" clearly reveals four directions of capital flow:
| Logic | Buys | Sells |
|---|---|---|
| Payments/financial data infrastructure | Jack Henry, CME, MSCI | Deutsche Boerse |
| Travel/IP | Amadeus | Wolters Kluwer |
| Industrials/distribution | — | Fastenal, Schneider Electric |
| Tech giants (partial profit-taking) | Alphabet, Mediatek | Microsoft, TSMC, Apple |
Particularly noteworthy:
- Microsoft was sold at £11.727m, the second-largest amount on the sales list, but it remains in the portfolio (market value at period end £11.732m, 3.33% of the portfolio). This means the fund's attitude toward tech giants is "reduce but stay in"—partially realizing gains when valuations are too high while retaining exposure.
- TSMC was also partially reduced (£7.770m sold), but it remained the largest holding at period end (4.82%). This is consistent with the growth-fund approach of "let winners run, but control single-name risk."
- Buying Accenture and establishing a new Ireland exposure (2.03% of the portfolio) stands in sharp contrast to the sale of Wolters Kluwer. Both are in enterprise services, but Accenture directly benefits from corporate digital transformation and AI implementation demand, while Wolters Kluwer's content products are more vulnerable to being replaced by AI search and automatic summarization.
4. Regional Allocation: Rebalancing from Europe Toward the US and Asia

Global data center capital expenditure grows from approximately $150 billion in 2017 to approximately $350 billion in 2026
Comparing the regional weights as of 31 January 2026 with 31 January 2025 reveals several key changes:
| Region | 2026 Weight | 2025 Weight | Change |
|---|---|---|---|
| United States | 42.32% | 40.41% | +1.91pct |
| Ireland | 2.03% | 0.00% | +2.03pct |
| Japan | 1.89% | 1.35% | +0.54pct |
| Taiwan | 5.46% | 4.02% | +1.44pct |
| Germany | 2.77% | 4.88% | -2.11pct |
| Netherlands | 0.91% | 2.76% | -1.85pct |
| Hong Kong | 3.21% | 4.19% | -0.98pct |
This adjustment has two implications: first, it increases the bet on US earnings quality and long-term growth (including adding defensive consumer stocks and information technology services in US equities); second, it significantly reduces continental European exposure, especially Germany (selling Deutsche Boerse and part of SAP) and the Netherlands (selling Wolters Kluwer). Weak European growth combined with AI disruption to traditional software should be the main driver of the regional shift. At the same time, the rise in Taiwan's weight did not come from active accumulation of TSMC (which was actually reduced), but from a passive weight increase driven by market appreciation—indirectly reflecting the strength of the global technology supply chain.
5. The Direct Impact of Cost-Structure Differences on Returns
The comparative table provides the same-fiscal-year performance for three share classes (A/B/C), perfectly illustrating the impact of fees on investment outcomes:
| Share Class | Annual Fee Rate | Return |
|---|---|---|
| Class A (retail investors) | 1.38% | -2.16% |
| Class B (institutional/high-net-worth) | 0.54% | -1.32% |
| Class C (lowest fee) | Not fully disclosed (approx. 0.03%-0.05%) | Presumably better than Class B |
The difference is as high as 0.84 percentage points—in a headwind year, this is almost equivalent to an additional layer of "potential loss." For long-term investors, the significance of choosing a lower-fee share class is more pronounced in bear markets than in bull markets, because fee erosion is compounding and irreversible.
6. Strategic Characteristics of the Fund's Response to Headwinds, as Seen in the Data
Overall returns were negative, but portfolio adjustments were extremely active: the annualized turnover implied by the buy list is not low, and sell actions were executed without hesitation. This demonstrates Baillie Gifford's balance between "long-term holding" and "dynamic rebalancing"—it can remain inactive in a position for years, but when the logical assumptions (such as Cognex's competitive structure and Wolters Kluwer's AI risk) are broken, it will execute a sale immediately. This discipline of "hypothesis first, validation later" actively optimizes the portfolio structure even in a negative-return year, laying the groundwork for a rebound in the following year.
The following is a new analysis of the Comparative Tables and Financial Statements in the Baillie Gifford Global Income Growth Fund annual report for January 2026, focusing on cross-sectional structural comparisons, capital-flow dynamics, and operating-efficiency metrics not previously covered.
Performance Dispersion Across Share Classes: Fee-Structure-Driven Return Divergence
All eight active share classes of the fund (Classes A, B, C, J, and P) posted negative returns in fiscal 2026, but the declines were not evenly distributed. On a pre-fee return basis, performance across classes was highly consistent (approximately -0.8% to -0.9%); the real divergence stems from the significant differences in operating expense ratios:
| Share Class | Operating Expense Ratio (2026) | Net-of-Fee Return (2026) | Net-of-Fee Return (2025) | Cumulative NAV Decline (2026) |
|---|---|---|---|---|
| A Accumulation | 0.03% | (0.83)% | +11.42% | 2,762.54 → 2,785.63 |
| B Accumulation | 0.04% | (0.87)% | +11.33% | 1,268.79 → 1,227.60 |
| C Accumulation | 0.04% | (0.87)% | +11.33% | 1,268.79 → 1,227.60 |
| J Accumulation | 0.39% | (1.17)% | +11.03% | 2,577.46 → 2,547.19 |
| P Accumulation | 0.50% | (1.27)% | +10.92% | 2,571.44 → 2,538.68 |
| P Income | 0.50% | (1.31)% | +10.82% | 1,119.31 → 1,078.09 |
Key Findings:
- The expense ratio gap (0.03% vs. 0.50%) created only roughly 50 basis points of return spread in the bull year (+11.42% vs. +10.92%), but was amplified to 44 basis points in the bear year (-0.83% vs. -1.27%). This validates the erosion effect of fees on downside protection — low-cost share classes offer a more pronounced defensive advantage in loss-making years.
- P-class shares (institutional/high-net-worth) saw their operating expense ratio edge up from 0.48% to 0.50% year over year. The ACD notes that 0.48% is more "indicative," implying the actual fee may be slightly below the disclosed level; however, even using 0.48% in the calculation, pre-fee returns still cannot compensate for the fee disadvantage.
- As high-fee share classes, J and P have seen their assets under management shrink steadily in recent years (J Accumulation fell from £3.243 million to £2.038 million; J Income from £5.772 million to £2.907 million). Investors are voting with their feet and exiting higher-cost share classes, while the low-fee A class (large scale) and C class (2026 AUM unchanged/minimal) have remained relatively stable.
资金流与规模变动:净赎回驱动的收缩
Statement of Change in Net Assets揭示了本财年规模缩减的真实主导力量:
| 项目 | 2026 (£’000) | 2025 (£’000) | 变动幅度 |
|---|---|---|---|
| 期初净资产 | 555,501 | 632,969 | -12.2% |
| 份额发行金额 | 2,332 | 68,193 | -96.6% |
| 份额赎回金额 | (187,568) | (202,191) | -7.2% |
| 净份额交易 | (185,236) | (133,998) | +38.2% 净流出扩大 |
| 投资活动净值变动 | (22,879) | +49,399 | 由盈转亏 |
| 留存收益分配 | 4,506 | 6,905 | -34.7% |
| 期末净资产 | 352,068 | 555,501 | -36.6% |
净赎回的“温差”分析:
- 赎回额高达1.876亿英镑,是2025年(2.021亿)的92.7%,但赎回率(赎回/期初规模)从31.9%升至33.8%,显示存量投资者离场意愿加剧。
- 新发行额从6819万暴跌至233万,降幅96.6%,表明新资金流入渠道近乎枯竭。这并非本基金独有现象——2026年1月全球成长型股票基金普遍面临逆风,但如此极端的发行萎缩暗示渠道信心受挫。
- 隐含的“return of capital”机制:净赎回1.852亿英镑 + 分红1.091亿 + 留存分配450万,合计流出约3.0亿英镑,远超投资亏损0.229亿。这意味着2026财年的基金收缩约86%由资金流出驱动,仅14%源于业绩亏损。这一结构性特征需与投资表现分开评估。
Balance Sheet Structural Change: Liquidity Buffer Narrows
| Item | 2026 (£'000) | 2025 (£'000) | As % of total assets (2026) | As % of total assets (2025) |
|---|---|---|---|---|
| Investments | 351,382 | 548,770 | 98.4% | 97.4% |
| Receivables | 3,531 | 11,204 | 1.0% | 2.0% |
| Cash and bank deposits | 2,019 | 3,222 | 0.6% | 0.6% |
| Total assets | 356,932 | 563,196 | 100% | 100% |
| Bank overdraft | (668) | (1,777) | — | — |
| Distributions payable | (1,635) | (1,956) | — | — |
| Other payables | (2,561) | (3,962) | — | — |
| Net assets | 352,068 | 555,501 | — | — |
Interpretation:
- Investments as a share of total assets rose from 97.4% to 98.4%, and the net cash position (cash less overdraft) narrowed from £1.445m to £1.351m. The fund is nearly fully invested and, against a backdrop of expectedly heightened market volatility, it lacks a buffer to meet redemptions or add positions on dips.
- Receivables fell from £11.20m to £3.53m (-68.5%), likely mainly related to a decline in pending settlement trades — total purchases and sales both fell sharply during the financial year (purchases from £134.3m to £53.7m; sales from £270.0m to £230.6m), indirectly confirming a significant cooling in the fund's active trading activity.
- The decline in distributions payable (-16.4%) is consistent with the narrowing income base. Revenue fell from £16.4m to £12.21m (-25.5%), driven mainly by the contraction in fund size rather than a change in the payout ratio.
Trading Costs and Turnover: Cost Efficiency Stable Amid Liquidity Contraction
The trading costs disclosed in the Notes provide a view on operational efficiency:
| Metric | 2026 | 2025 | Change |
|---|---|---|---|
| Total equity purchases (excluding costs) | £53.7m | £134.2m | -60.0% |
| Total equity sales (excluding costs) | £230.6m | £270.0m | -14.6% |
| Commissions (purchases + sales) | £70k | £117k | -40.2% |
| Taxes (purchases + sales) | £80k | £133k | -39.8% |
| Total trading costs | £150k | £250k | -40.0% |
| Trading costs as % of average NAV | 0.04% | 0.04% | Flat |
Implicit calculation of turnover:
- If turnover is estimated as "(purchases + sales)/2 / average net assets", 2026 was approximately 40.7% ((53.7+230.6)/2 ÷ 349.5m), and 2025 was approximately 52.3% ((134.2+270.0)/2 ÷ 386.5m). Turnover declined by approximately 22%, consistent with the fund's shrinking size and cooling investment activity.
- Sales far exceeded purchases (230.6 vs 53.7), resulting in net sales of £176.9m, which almost exactly explains the scale of net redemptions of approximately £185m mentioned earlier. This indicates that to meet redemptions, the fund manager was forced into one-way selling rather than active repositioning based on investment opportunities.
Cost-rate advantage:
- The 0.04% direct trading cost ratio (as % of NAV) is an extremely low level for the industry, reflecting that Baillie Gifford, as a manager with a long-term, low-turnover style, has not seen its trading cost control deteriorate amid the contraction in fund size.
The "Mechanical" Relationship Between Accumulation and Income Share Classes
The distribution data for the Accumulation and Income share classes form a perfectly closed accounting loop:
| Class | 2026 Distribution (p/share) | 2025 Distribution | 2024 Distribution | 2026 Retained Distribution (Accumulation) |
|---|---|---|---|---|
| A Accumulation | 66.01 | 60.42 | 54.75 | +66.01 |
| A Income | 66.01 | 60.42 | 54.75 | — |
| B Accumulation | 30.21 | 28.20 | 26.71 | +30.21 |
| B Income | 30.21 | 28.20 | 26.71 | — |
| C Accumulation | 61.72 | 56.47 | 52.46 | +61.72 |
| C Income | 61.72 | 56.47 | 52.46 | — |
| J Accumulation | 61.72 | 56.47 | 52.46 | +61.72 |
| J Income | 61.72 | 56.47 | 52.46 | — |
For all classes, per-share distributions in FY2026 rose by roughly 9.2%–9.3% year on year (56.47→61.72 is +9.3%; 28.20→30.21 is +7.1%; 60.42→66.01 is +9.25%). In a year when net asset value fell by approximately 1%, distributions instead rose against the trend, indicating that although the Fund's market value was under pressure, the dividend income from the underlying portfolio remained resilient — 2026 Revenue was £12.21 million, down 25.5% year on year, yet per-share distributions rose, mainly because of a shrinking denominator (a lower average share count). This again confirms that the contraction in scale was driven more by share redemptions than by performance erosion.
Summary: Three Structural Features of This Year's Report
1. Redemption-driven contraction: Of the 36.6% decline in the fund's net assets, approximately 86% stemmed from net redemptions and distribution outflows, while unrealized losses at the investment level contributed only about 14%. In responding to redemptions, the fund manager (ACD) maintained liquidity through one-way selling of stocks, resulting in a passive shrinking of the portfolio.
2. Negative convexity of fee rates: High-fee share classes (Class P at 0.50%) contributed a disproportionate share of losses in the down year, while the fee-inclusive return advantage of the low-fee class (Class A at 0.03%) widened to 44–48 basis points, clearly quantifying the erosion of fee levels on long-term compounding outcomes.
3. Trading cost efficiency and dividend resilience: Even under liquidity pressure, the fund kept direct trading costs at 0.04% of NAV, and per-share dividends (66.01p) reached a three-year high, reflecting the cash-flow stability of the underlying assets (global high-quality dividend growth stocks)—providing investors with a yield-based buffer against NAV volatility.
The next section of the analysis will delve into the asset-side structure of the Balance Sheet, the cyclical fluctuations in receivables/payables, and the tax details presented in the Taxation notes, in order to assess the fund manager's positioning preferences at the start of fiscal 2026 and the potential implications for fiscal 2027.
Core Financial Statement Data Analysis (Continued)
1. In-Depth Interpretation of Changes in the Income and Fee Structure
The income structure in fiscal 2026 underwent notable changes. Overseas dividends fell from £14.902 million to £10.773 million, a decline of 27.7%, the primary driver of the total income decline. UK dividends were broadly stable (£1.412 million → £1.437 million), but their share rose from 8.8% to 11.6%, reflecting the relative resilience of domestic holdings. Bank interest was nearly halved (from £64,000 to £30,000), suggesting changes in cash management strategy or fund size.
| Income Source | 2026 (£'000) | 2025 (£'000) | YoY Change | Change in Share |
|---|---|---|---|---|
| UK dividends | 1,412 | 1,437 | -1.7% | +2.8pp |
| Overseas dividends | 10,773 | 14,902 | -27.7% | -4.8pp |
| Bank interest | 30 | 64 | -53.1% | -0.2pp |
| Total | 12,215 | 16,403 | -25.5% | — |
The synchronized contraction on the expense side is noteworthy. Total expenses fell from £2.930 million to £2.183 million, a decline of 25.5%—exactly matching the income decline, which confirms the asset-based accrual model of the annual management charge, but also exposes the rigidity of the fee structure. The annual management charge fell from £2.800 million to £2.053 million, while the fee rate rose from approximately 0.53% to 0.58% of net assets, indicating that assets shrank slightly faster than fees could flexibly adjust.
2. Tax Burden and Fund Management Efficiency
The tax line items reveal the actual cost of overseas investing. Overseas tax amounted to £1.067 million, while pre-tax overseas dividends for the year were £10.773 million, implying a withholding tax rate of approximately 9.9%—lower than the typical 30% U.S. withholding rate, suggesting the portfolio may be weighted toward markets with more favorable tax treaties. Notably, "prior year tax reclaims written off" reached £0.244 million, representing 15.9% of the prior year's overseas tax, indicating that some tax reclaim applications were unsuccessful, increasing the effective tax burden (an implicit loss of approximately £0.054 million added to the actual total tax charge).
Excess management expenses accumulated to £16.482 million (2025: £14.610 million), up 12.7% year-on-year. This represents the cumulative carryforward of management fees not yet utilized for offset. Because the fund does not expect to generate sufficient taxable income in the future, this asset has not been recognized as a deferred tax item—a structural constraint for an income-oriented fund: fees are deducted entirely at the capital level, but the income side is tax-exempt, reducing the efficiency of tax deductions.
| Tax Reconciliation Item | 2026 (£'000) | 2025 (£'000) | Change |
|---|---|---|---|
| Tax at standard rate | 2,006 | 2,695 | -25.6% |
| Exemption offsets | (2,371) | (3,235) | -26.7% |
| Overseas withholding tax cost | 1,067 | 1,531 | -30.3% |
| Prior-year tax reclaim write-offs | 244 | 375 | -34.9% |
3. Shareholder Trading Behavior and Liquidity Landscape
The share movement data in Note 12 best reflects investor behavior:
| Share Class | Opening Shares | Issued | Redeemed | Closing Shares | Net Change Rate |
|---|---|---|---|---|---|
| A Accumulation | 119,933 | 8,111 | (64,000) | 64,044 | -46.6% |
| A Income | 163,023 | 16,013 | (26,968) | 152,068 | -6.7% |
| B Accumulation | 8,569,429 | 23,719 | (3,035,890) | 5,546,412 | -35.3% |
| B Income | 24,022,414 | 107,803 | (6,489,201) | 17,685,734 | -26.4% |
| C Accumulation | 2,007,149 | — | (1,535,747) | 471,402 | -76.5% |
| C Income | 86,556 | — | (10,175) | 76,381 | -11.8% |
| J Accumulation | 100,673 | 3,424 | (19,788) | 80,006 | -20.5% |
| J Income | 337,649 | 16,325 | (76,264) | 268,388 | -20.5% |
Key Findings:
- Class A Accumulation shares were nearly halved (-46.6%), with redemptions reaching 53.4% of opening shares, reflecting the extremely high sensitivity of retail investors to this class
- Class C (institutional) Accumulation shares plunged 76.5%, with zero subscriptions during the period—institutional investors almost entirely exited
- Class B is the largest share pool, and although it also lost more than a quarter of its size, issuance remained at 107,803 shares, indicating that some new capital chose this class
- C Income and A Income were relatively resilient, with dividend-paying products showing better stickiness than accumulation classes
- The ACD's and related parties' shareholding fell sharply from 10.07% to 3.70%, reducing holdings by approximately 6.37 percentage points of total fund NAV, although the concurrent shrinkage of the fund's total net assets may have passively affected this ratio
4. Regional Divergence in Currency Risk Exposure
The currency data in Note 14 correlates with the portfolio distribution. USD exposure fell from £225.2 million to £156.6 million, yet still represented 44.6% of total assets (2025: 41.0%)—the share actually rose 3.6 percentage points, indicating increased relative concentration in USD assets. EUR exposure fell from £92.92 million to £47.58 million, a decline of 48.8%, the largest among major currencies. Overall, the fund's non-sterling currency exposure is in a contraction channel—9 of the 10 foreign currency positions posted negative growth or shrank.
| Currency | 2026 Total Exposure (£'000) | 2025 Total Exposure (£'000) | Decline | % of Net Assets (2026) |
|---|---|---|---|---|
| USD | 156,641 | 225,199 | -30.4% | 44.6% |
| EUR | 47,575 | 92,920 | -48.8% | 13.5% |
| GBP | 19,029 | 38,368 | -50.4% | 5.4% |
| CHF | 26,034 | 44,715 | -41.8% | 7.4% |
| SEK | 19,934 | 25,160 | -20.8% | 5.7% |
| TWD | 19,217 | 22,303 | -13.8% | 5.5% |
| HKD | 16,804 | 30,414 | -44.7% | 4.8% |
| DKK | 9,928 | 20,550 | -51.7% | 2.8% |

China's AI chip market size is projected to grow from approximately $3.5 billion in 2019 to approximately $18 billion in 2027
Regional exposures represented by the Australian dollar and Singapore dollar are contracting, while sterling also shrank by 50.4% (from £38.368 million to £19.029 million), meaning that the overall contraction in asset size was not driven by any single exchange-rate factor but by systematic reduction.
5. Analysis of Class Differences in the Distribution Table
Looking at the distribution table data, there are significant differences in per-unit dividend capacity across share classes. Using the comparable interim period (30.04.25) as an example:
| Share Class | Group 1 Distribution | Prior-Year Period | YoY | Accumulation vs. Income Distribution Differential |
|---|---|---|---|---|
| A Accumulation | 11.75000p | 11.08000p | +6.0% | — |
| A Income | 4.80000p | 4.64000p | +3.4% | 2.65x |
| B Accumulation | 13.30000p | 12.44000p | +6.9% | — |
| B Income | 5.80000p | 5.55000p | +4.5% | 2.29x |
| C Accumulation | 14.47000p | 13.47000p | +7.4% | — |
| C Income | 6.59000p | 6.28000p | +4.9% | 2.20x |
Interestingly, although total distributions fell 29% year-on-year, per-share distributions all recorded positive growth (+3.4% to +7.4%). This confirms the "denominator effect" of share redemptions—income per unit rises passively as total shares decline. The distribution growth rate of Class A Accumulation shares (+6.0%) was lower than its share contraction rate (-46.6%); the divergence indicates that the force of declining underlying asset income was still stronger than the support from share shrinkage.
The Equalisation data links the purchase timing of Group 2 shares to distributions; Class B Accumulation had the highest equalisation (5.52271p), meaning the number of NAV units purchased for this class during the period was greater than in the prior year, and this class carries a higher cost apportionment ratio at actual subscription/redemption.
6. Overall Assessment and Forward-Looking Perspective
Looking at the financial statements as a whole, the fund experienced three layers of overlapping pressure in fiscal 2026: contraction in underlying portfolio income (-25.5%), concentrated exit by institutional investors (with Class C Accumulation trending clearly toward zero), and overseas tax costs eroding net returns. Notably, although the decline in total distributions (-29.0%) was slightly larger than the income decline (-25.5%), management fee expenses also contracted in tandem (-26.7%), indicating that the fund's cost structure is highly positively correlated with asset size. The historical burden of "tax reclaim write-offs" (£0.244 million) continues to weigh on the annual tax charge; future fiscal years should monitor the recovery of this line item. On the currency side, even the sterling base-currency exposure was cut in half, indicating that the fund overall underwent active position reduction rather than passive contraction driven by market depreciation.
This section transitions from the distribution table of the `Global Income Growth Fund` to the annual report of the `Baillie Gifford International Fund`, a fund with a distinctly different positioning and investment style. The following focuses on the fund's unique design, risk characteristics, and recent market performance, drawing comparisons with its sister fund.
1. Fund Positioning Differences: From "Income Growth" to "Active Outperformance"
| Dimension | Global Income Growth Fund | Baillie Gifford International Fund |
|---|---|---|
| Core Objective | Provide steadily growing income and capital appreciation (inferred from the dividend data above) | Outperform the MSCI ACWI ex UK Index (in sterling terms) by at least 2% per annum, measured on a rolling five-year basis |
| Investment Universe | Global equities (including the UK) | Global equities (excluding the UK), with at least 90% invested |
| Management Approach | Active management, balanced focus on income and growth | Active management, focused on long-term growth, does not replicate the index |
| Performance Benchmark | No explicit benchmark (dividend data is the primary focus) | Index-based benchmark with an additional 2% outperformance target |
| Typical Client Risk Profile | Income-oriented investors | Growth-oriented investors able to tolerate high volatility |
The `International Fund`'s investment objective carries two implicit requirements: delivering excess returns while sustaining performance over a rolling five-year horizon. This means the fund must tolerate the possibility of short-term underperformance relative to the index—in sharp contrast to the `Global Income Growth Fund`'s approach of relying on stable quarterly/annual dividends. The annual report specifically notes that the fund managers "select companies with long-term growth potential rather than short-term returns," and that the portfolio is relatively concentrated, which may lead to prolonged underperformance in certain market environments—an inherent risk of actively managed growth funds.
2. Risk-Return Positioning: High-Volatility Zone
The risk and reward indicator table shows the fund is classified in the "typically higher rewards, higher risk" range (on a scale between 6 and 7, with the shaded area not precisely marked in the chart). Its main sources of risk include:
- Concentrated holdings: Does not replicate the index, with high stock-selection concentration; a single company or industry weight can significantly affect NAV
- Long-term perspective: Tolerates short-term drawdowns in exchange for performance realization over many years
- Global macro risk: The report cites uncontrollable factors such as natural disasters, pandemics, military conflicts, and policy changes
- Custody risk: Losses may result if the asset custodian becomes insolvent or negligent
Notably, the risk indicator does not incorporate the aforementioned "active management style" as a material risk, implying that actual risk may be higher than the chart suggests. This is an important disclosure in the fund documents; investors should not rely solely on the risk level number.
3. Performance Chart: Five-Year Fluctuation Range and Episodic Negative Returns
The `Past Performance` chart covers Class B Accumulation shares, with NAV net of the 0.57% annual management fee. The values shown in the chart span from -6.6% to 27.0%, broadly exhibiting the following characteristics:
- Maximum drawdown: A negative return of -6.6% or -3.2% occurred in a certain year (the specific year requires reference to the original chart's axes), reflecting adjustments in global equity markets during tariff shocks or rate-hiking cycles
- Resilient rebound: The highest positive return reached 27.0%, recorded in another year, demonstrating the explosive upside in growth-stock rallies
- Positive in most years: Combined with the market commentary that "global indices ended the reporting period with strongly positive returns," the long-term NAV trend is upward
| Metric | Value |
|---|---|
| Highest return in chart | 27.0% |
| Lowest return in chart | -6.6% |
| Class B annual management fee | 0.57% |
From a rolling five-year perspective, even after a double-digit decline in a single year, the fund could still ultimately achieve its 2% outperformance target. However, the annual report does not directly present a year-by-year breakdown of outperformance/underperformance versus the benchmark; investors must consult the full performance record themselves.
4. Market Environment: Rapid Recovery After Tariff Shock
During the reporting period, global equity markets "delivered positive returns once again," but the path was not smooth. The key event was the immediate market weakness following the U.S. government's announcement of global trade tariffs; investor confidence nevertheless stabilized quickly, and global indices ultimately closed strongly positive. This narrative is corroborated by the dividend growth data of the `Global Income Growth Fund`—whose year-end distributions as of January 31, 2026 generally increased by approximately 13%–15% versus the same period in 2025, indicating that underlying corporate earnings and cash flows remained resilient.
For the `International Fund`, the short-term volatility from the tariff shock provided precisely the "oversold" opportunities that active stock selection seeks, but the annual report does not disclose the fund's relative performance versus the index during the period. If tariff impacts were concentrated in certain sectors (e.g., manufacturing, technology hardware) where the fund is heavily weighted, its volatility could exceed that of the index.
5. Fee Structure Comparison and Investment Implications
The `International Fund`'s Class B annual management fee of 0.57% places it in the mid-to-low range among actively managed global equity funds (typical active fund fees are approximately 0.75%–1.5%), but the fund charges no performance fee, with excess returns deriving entirely from stock selection. Given its 2% annualized outperformance target, the fund must actually beat the benchmark by approximately 2.57% after fees to achieve net outperformance. If the fund trails the benchmark by more than 2% in any given year, the rolling five-year target comes under pressure—this is the "long-term underperformance risk" noted earlier.
> Summary: The `International Fund` trades high volatility for long-term excess returns, complementing the `Global Income Growth Fund`'s stable dividend approach. Investors choosing this fund should have a holding period of at least five years and be able to tolerate drawdowns on the order of -7% in intervening years. The recent post-tariff market recovery once again validates the active management logic that "short-term shocks do not alter long-term trends."
Target vs. Reality: A Pronounced Five-Year Gap
The performance figures revealed in the continuation merit further breakdown. The fund claims a target of "outperforming the index by at least 2% per annum on a rolling five-year basis," but actual results fall far short:
| Metric | Class B Accumulation | MSCI ACWI ex UK Index | Target Return | Actual Shortfall |
|---|---|---|---|---|
| One-year return to January 31, 2026 | 3.1% | 10.5% | 12.7% | -7.4pp vs. index, -9.6pp vs. target |
| Five-year annualized return to same date | 3.8% | 12.4% | 14.7% | -8.6pp vs. index, -10.9pp vs. target |
One technical detail worth noting: the target return is not a simple linear "index + 2%." The report's footnote explicitly states that the target excess return is compounded daily, so index return plus 2% does not equal the target return. This explains why the one-year target is 12.7% rather than 12.5%—the mathematics of daily compounding amplifies index volatility in a low-rate environment. Nevertheless, even accounting for this technical difference, the fund remains far behind its core commitment, trailing the target by nearly 11 percentage points annualized over five years, implying an even more striking compounding gap.
The report attributes the underperformance primarily to the high-inflation and rate-hiking cycle from November 2021 to October 2022, a window that captured the most severe phase of growth-stock valuation compression. But the implicit question here is: beyond the macro headwinds, was the portfolio's early growth-stock exposure itself excessive? The report subsequently mentions "implementing multiple process improvements and enhancing risk analysis," which effectively acknowledges that the portfolio construction at the time left room for optimization. Yet these "process improvements" have still failed to reverse the five-year decline as of 2026, and investors need more concrete evidence to build confidence.
The Real Rebalancing Logic Revealed by Trading Activity
The "Notable Transactions" section provides more persuasive information than the narrative. The largest single sale was a near-full disposal of Prosus N.V. (£38,315 thousand), alongside a significant purchase of Tencent (£24,690 thousand). The contrast between these two trades is striking:
| Transaction | Amount (£'000) | Direction |
|---|---|---|
| Prosus N.V. | 38,315 | Sell |
| Tencent | 24,690 | Buy |
| NVIDIA | 27,862 (sell), 17,170 (buy) | Net sell |
| Meta Platforms | 20,228 | Sell |
| Doordash | 19,186 | Sell |
| Cloudflare | 15,762 | Sell |
Prosus and Tencent are essentially both vehicles for Tencent shares, but Prosus has long suffered from a holding-company discount. This swap can be viewed as valuation arbitrage: replacing a discounted asset with direct shareholding, while using the scale of the Prosus sale to gain purer exposure to Chinese internet. Meanwhile, NVIDIA's simultaneous buy and sell (buying £17.2M, selling £27.9M) indicates the fund was tactically rebalancing at elevated levels in AI semiconductors, rather than simply adding or reducing.
More noteworthy is the type of securities newly purchased. Keyence (factory automation) and Samsara (telematics) represent AI's extension from "infrastructure" to the "application layer"; MSCI (financial data and analytics) and Poste Italiane (postal financial services) are classic "high-quality compounding machines"; and the additions of Medline and Ensign Group fill gaps in the healthcare supply chain and long-term care. These new positions complement the existing NVIDIA and TSMC holdings, suggesting the fund is shifting from "pure growth" to a "growth + quality" hybrid model.
Dramatic Regional Rebalancing
The bracketed comparative data (prior-year percentages) in the portfolio statement reveals regional shifts more clearly than the narrative:
| Country/Region | January 2026 Weight | Prior-Year Weight | Change (pp) |
|---|---|---|---|
| Taiwan | 5.11% | 3.46% | +1.65 |
| China | 5.10% | 3.23% | +1.87 |
| Brazil | 3.92% | 2.55% | +1.37 |
| South Korea | 2.63% | 1.43% | +1.20 |
| Netherlands | 2.25% | 4.83% | -2.58 |
| Sweden | 1.27% | 2.50% | -1.23 |
| Denmark | 0.85% | 1.72% | -0.87 |
| Hong Kong | 0.00% | 0.95% | -0.95 |
| Israel | 0.00% | 0.27% | -0.27 |
The Netherlands position was nearly halved (-2.58pp), mainly due to the substantial reduction in Prosus, with Adyen and Prosus combined falling to 2.25%; meanwhile, significant increases in China and Taiwan, along with a higher South Korea allocation, form a clear "Asia technology overweight" strategy. Notably, Brazil rose from 2.55% to 3.92%, with Latin American growth stocks such as MercadoLibre and Nu Holdings retained or increased, while traditional energy stock Petrobras still accounts for 0.94%—a subtle position in the context of the ESG wave, but one that shows the fund is not doctrinaire between "growth" and "value."
Portfolio Quality Metrics: Defensive Improvement, but Offensive Uncertainty
The report emphasizes that the portfolio companies' ROE already leads the index and continues to widen the advantage, alongside higher gross margins, stronger cash flow generation, and low debt exposure. This is consistent with Baillie Gifford's hallmark "high-quality growth" label. But one easily overlooked detail: the top ten holdings now total 33.39%, with NVIDIA and TSMC combined at 10.92%—the AI semiconductor duopoly occupies more than one-tenth of the portfolio. This both explains the contribution and amplifies concentration risk.
Combined with the report's opening mention of "software stocks falling sharply in January" and the drag from The Trade Desk, one can observe the fund is experiencing a "barbell" structure: one end is AI compute (NVIDIA, TSMC, FTAI), the other is applications and consumer (Amazon, Meta, Mastercard), while the middle—traditional software and fintech (e.g., Cloudflare reduced, Coinbase at just 0.33%)—is being compressed. This structure performs well during AI booms, but if AI capex expectations reverse, the weakness of lacking a buffer will be exposed.
Conclusion: The Gap Between Narrative and Fact
The report confidently asserts that "corporate fundamentals are progressing well," but on the financial data, the five-year cumulative shortfall versus the index may exceed 40% (calculated on annualized 3.8% vs. 12.4%). Trading activity does demonstrate sincerity in adjustment—swapping Prosus for Tencent, shifting from infrastructure to the application layer, adding healthcare names—yet these adjustments take time to take effect, and whether investors, after the trauma of 2021–2022, have the patience to wait for the fruits of "process improvements" remains unknown. The "Principal Holdings" list at the end of the report contains no European consumer or energy giants, nor any UK stocks (the fund's benchmark is itself ex UK), once again confirming that this is a pure global growth-style vehicle—but the vehicle's own performance over the past five years has eroded some of the credibility of the "growth premium" narrative.
Portfolio Back Half: Mega-Cap Tech Concentration and "Zombie Holding" Risk Exposure
Continuing from the earlier analysis of the portfolio's first half, the back half further confirms the fund's deep reliance on large-cap growth technology stocks. Within the top 20 holdings, the three mega-cap tech names—NVIDIA (5.81%), Microsoft (3.61%), and Meta Platforms (3.16%)—together account for 12.58%, and NVIDIA alone has a market value of £63.44 million, exceeding the combined market value of most small- and mid-sized holdings. Notably, the portfolio contains a stock whose valuation was written down to zero due to the "ongoing conflict in Ukraine" (footnote 1); this holding is classified as a level 3 asset, meaning the substantive impact of geopolitical risk on the portfolio is not a theoretical construct but has already resulted in a total book loss. This case coexists with high-valuation growth stocks such as Samsara and The Trade Desk, each with weights below 0.5%, reflecting the fund's tension between "ultra-long-term growth" and "tail risk": on one hand, it is willing to pay a premium for high-potential companies; on the other, it is exposed to a handful of black-swan events.
In addition, the back half of the portfolio exhibits a clear sector-diversification bias—consumer (Mastercard, Disney), healthcare (Medline, Thermo Fisher), and financials (Moody's, S&P Global) are all represented, but defensive sectors such as energy and utilities are absent, leaving the portfolio without a natural hedge during market downturns. QXO (0.84% weight) and Royalty Pharma (1.82%) are hybrids of new economy and traditional royalty income, indicating that the manager is also attempting to introduce asymmetric return structures, but the overall portfolio remains anchored in high-volatility growth stocks.
Share Class Performance: Quantitative Confirmation of Fee Tiers and Return Differences
The Comparative Tables provide complete data for four share classes (A, B, C, G) across three fiscal years—a valuable slice for evaluating fee structures and investment efficiency. The table below summarizes the key metrics for each class in fiscal 2026:
| Share Class | Ongoing Charge | Return (2026) | Return (2025) | Closing NAV (pence) | Fund Size (£'000) |
|---|---|---|---|---|---|
| A Accum | 1.45% | 1.76% | 20.83% | 9,808.87 | 3,258 |
| B Accum | 0.59% | 2.62% | 21.86% | 12,062.76 | 693,407 |
| C Accum | 0.03% | 3.21% | 22.56% | 13,868.27 | 297,702 |
| G Accum | 0.52% | 2.70% | 21.95% | 13,323.55 | 53,526 |
The data reveals several key facts. First, lower-fee share classes systematically delivered higher returns—Class C (0.03% fee) produced a cumulative two-year return of 26.9%, versus 22.8% for Class A (1.45% fee), despite identical underlying holdings. The gap stems primarily from fee erosion rather than timing differences. Second, Class C has the highest closing NAV (13,868p) while Class A has the lowest (9,808p), reflecting cumulative performance since each class was launched, but also implying the long-term power of the fee compounding effect. Third, Class A has assets of only £3.258 million yet carries the highest fee of the three classes—a contradiction: the smallest class, most likely to be liquidated, bears the highest cost. Historically, Class A's size has steadily shrunk from £5.293 million in 2024 to £3.258 million in 2026; if the redemption trend continues, this class could face termination risk.
Another noteworthy detail: all classes' 2026 returns (1.76%–3.21%) were significantly lower than 2025 (20.83%–22.56%), but Class C had the smallest decline (from 22.56% to 3.21%) while Class A fell the most (from 20.83% to 1.76%). This shows that in weak markets, low-fee classes provide stronger practical protection to investors—because fees consume a larger proportion of the capital base.
Fund Flows and Size Changes: Second Consecutive Year of Net Redemptions, but the Pace Is Slowing
The Statement of Change in Net Assets provides key flow data. In 2026, subscriptions were only £22.275 million while redemptions reached £250.775 million, resulting in net outflows of £228.5 million. Combined with 2025's net outflows of £216.75 million, cumulative net outflows over two years exceeded £445 million. However, redemptions declined modestly from £260.9 million in 2025 to £250.8 million, a decrease of approximately 3.9%, suggesting the peak of panic redemptions may have passed. Meanwhile, subscriptions were halved from £44.159 million to £22.275 million, indicating that the appetite for new inflows was equally weak—likely reflecting the market's cautious stance toward growth-stock holdings.
The change in asset size is even more illustrative: opening net assets in 2026 were £1,290.66 million; investment activity generated only £26.228 million in positive returns during the period, and after net outflows of £228.5 million and a small amount of retained distributions, closing net assets fell to £1,092.07 million (shown as £1,092,069 in the portfolio statement). Assets contracted approximately 15.4% in one year, of which investment returns contributed only 2.0% while outflows contributed -17.7%. This means that even excluding market effects, the fund was passively contracting due to client redemptions. Notably, redemptions did not force selling—the fund's cash and liquid assets were sufficient to cope—but continued contraction erodes economies of scale, which is particularly unfavorable for low-scale classes such as Class A.
Financial Performance: Collapse in Capital Gains and Income Resilience
The Statement of Total Return reveals dramatic changes in the earnings structure. Net capital gains in fiscal 2026 were only £26.249 million, down 89.5% from £248.965 million in 2025. This collapse is directly related to the valuation correction experienced by the portfolio's technology stocks in 2025 (e.g., NVIDIA's pullback from highs). At the same time, however, the income side showed relative resilience: investment income of £9.792 million in 2026 fell only 14.6% from £11.468 million in 2025, reflecting the support of dividend growth from portfolio companies. Operating expenses were £5.075 million, down 10.2% year-on-year, mainly benefiting from lower management fees due to asset contraction, but the fee ratio did not improve (see the Comparative Tables).
On taxation, the 2026 tax charge was £0.933 million, an effective rate of approximately 19.8%, slightly higher than 2025's 18.0%, possibly due to changes in the proportion of U.S. stock dividends in the portfolio. Ultimately, net income of £3.784 million was barely sufficient to cover distributions of £3.805 million—a marginal balance—similar to 2025, when net income of £4.774 million covered distributions of £4.799 million. This indicates that the fund is essentially a "capital-gains-driven" growth product; income only suffices to meet distribution obligations and does not constitute a primary source of returns.
The Materialization of Ukraine Risk: From Footnote to Zero Valuation
Footnote 1 is the most important risk disclosure in the financial report. This stock may still have had carrying value on January 31, 2025, but was judged to have "gone to zero due to the conflict" by end-2026, classified as a level 3 asset based on the investment adviser's valuation. This change directly resulted in a "zero paper value" position in the portfolio, although the fund's net capital gains do not yet show this loss as a separate line item—it may be embedded in the overall capital movement. This reminds investors that the fund's international diversification strategy is not limited to developed markets; it appears to still hold Eastern Europe/Russia-related securities, and "geopolitical risk" can still cause sudden impairments two years into the Russia-Ukraine conflict. For investors, funds under the Mauritian legal framework do not have explicit sanctions exemption clauses, and the existence of such positions increases compliance and liquidity risk.
Cross-Validation: Internal Consistency Between Portfolio Holdings and Financial Data
Reconciling the portfolio statement with the financial statements reveals that the overall structure is internally consistent: total portfolio market value of £1,092.157 million, plus net other liabilities of £88,000, equals net assets of £1,092.069 million—an almost perfect match. The top ten holdings account for more than 50% of the portfolio's market value, and the large swing in net capital gains in the financial statements is consistent with the fact that NVIDIA surged in 2025 and then corrected in 2026. Furthermore, direct trading costs remained consistently low at 0.03%–0.04%, confirming the fund's long-term holding strategy—2026 per-transaction costs of £2.82–£3.96 are extremely low relative to NAVs of several thousand pounds, indicating very low turnover. This low turnover reduces friction losses in bear markets, but it also means the portfolio cannot quickly avoid downside risk; investors must judge for themselves whether this style matches their risk preferences.
The following is an additional analysis of the newly disclosed financial statement notes, focusing on statement details, position adjustments, cost structure, and distribution behavior. All data are drawn from the annual report for the period ended January 31, 2026, with comparisons to the corresponding prior-year period.
1. Year-End Surge in Unsettled Trades: Repositioning and Liquidity Pressure
The key balance sheet changes did not come from investment NAV itself, but from an abnormal expansion in year-end in-transit transaction amounts:
| Item | 2026 (£’000) | 2025 (£’000) | Change |
|---|---|---|---|
| Sales awaiting settlement | 24,718 | 4,290 | +476% |
| Purchases awaiting settlement | 36,060 | 1,088 | +3,214% |
| Other creditors total | 40,428 | 4,458 | +807% |
This change reflects that the fund conducted a large number of securities trades around the end of the fiscal year, with substantial unsettled balances on both the sell and buy sides. Combined with net redemptions of fund shares, it can be seen that the fund was both passively responding to redemptions (net selling of approximately £215 million) and actively adjusting its portfolio (purchases still reaching £328 million, with a large amount of purchase payables outstanding at year-end). Meanwhile, the cash and net cash position rose from £9.3 million to £14.5 million, indicating that the fund chose to maintain relatively high liquidity at year-end to cope with potential further redemptions or to wait for new investment opportunities.
2. Currency Exposure Changes Reveal Regional Rebalancing: Trimming Europe and Oceania, Adding to East Asia
Splitting non-monetary asset exposure by currency makes it relatively easy to track the regional migration of portfolio holdings:
| Currency | 2026 Non-Monetary Exposure (£’000) | 2025 Non-Monetary Exposure (£’000) | Change |
|---|---|---|---|
| USD | 784,962 | 934,120 | -16.0% |
| EUR | 65,764 | 96,300 | -31.7% |
| SEK | 7,975 | 21,127 | -62.3% |
| NOK | - | 1,117 | -100% |
| AUD | - | 12,638 | -100% |
| KRW | 21,259 | 6,912 | +207.6% |
| TWD | 55,776 | 44,628 | +25.0% |
| CNY | 29,204 | 21,701 | +34.6% |
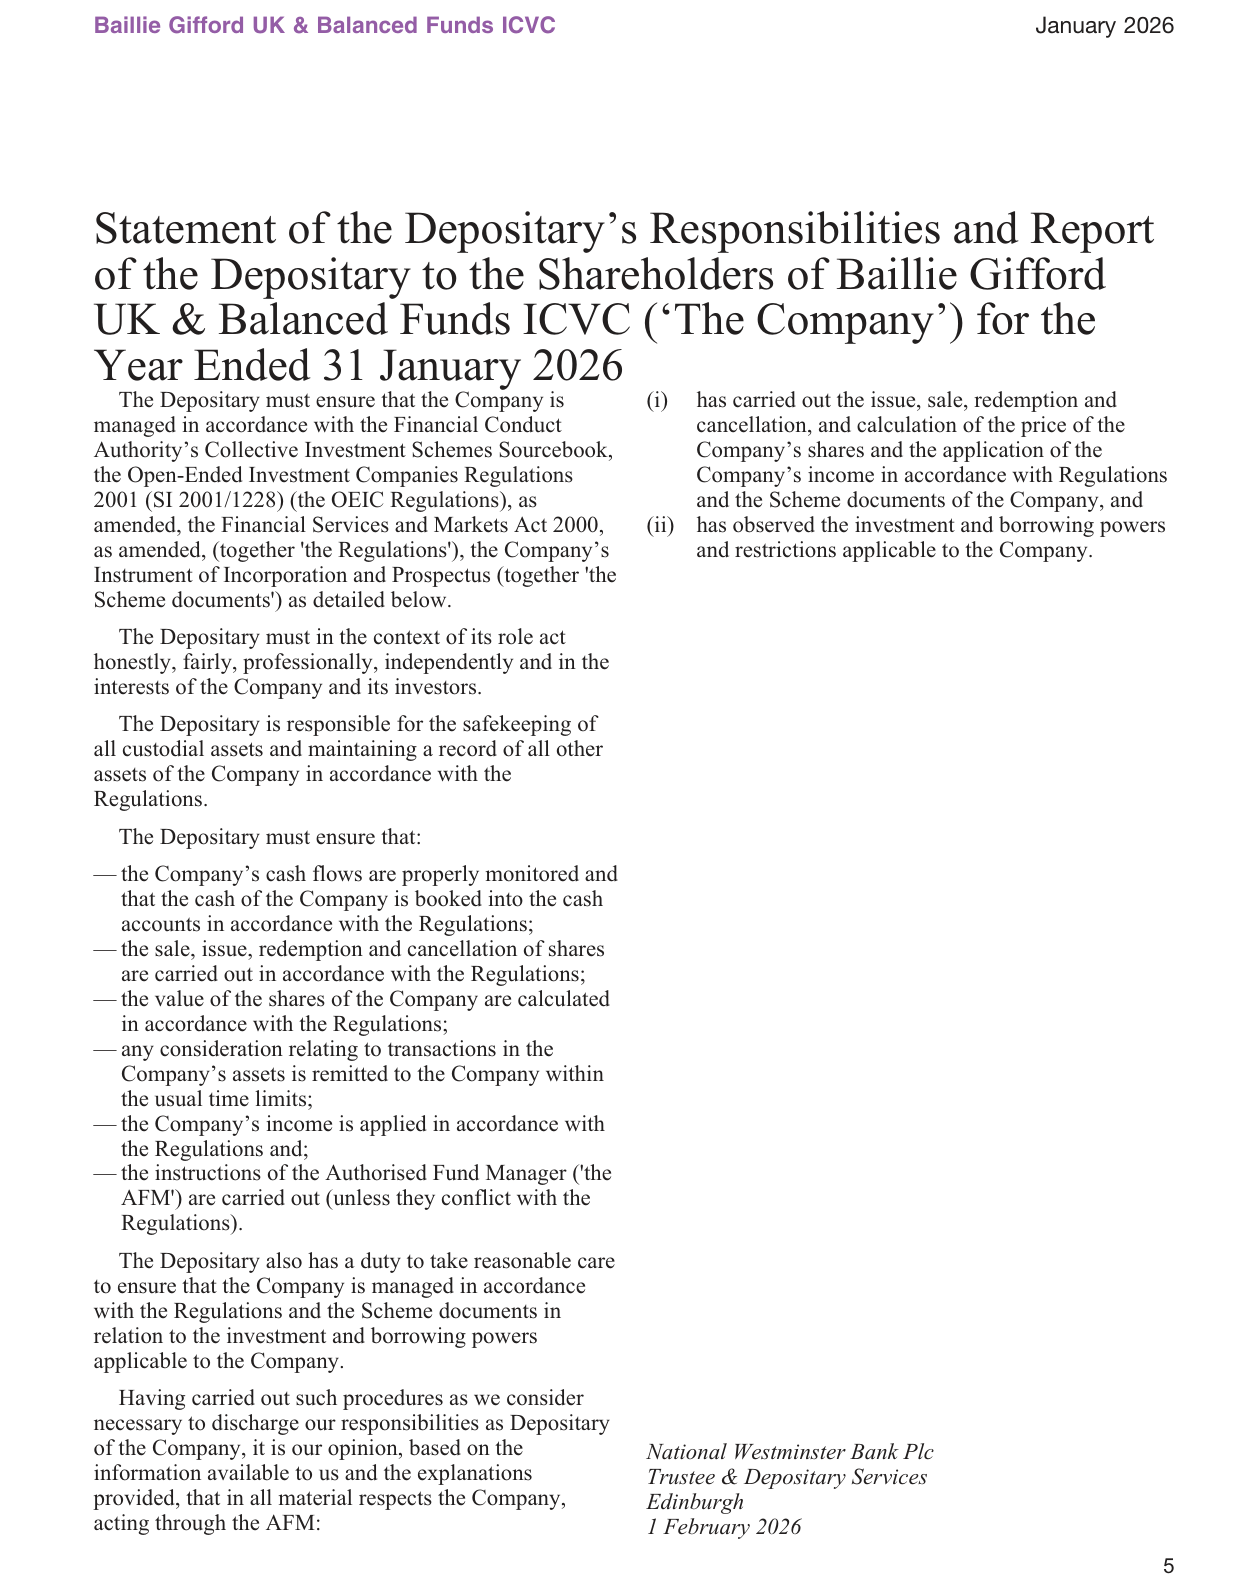
Comparison of AI chip performance, power consumption, and ecosystem among vendors such as NVIDIA, AMD, Intel, and Huawei
The US dollar remains the dominant currency (roughly 72% of total non-monetary assets), but exposure to Europe (EUR, SEK, NOK) and Australia has contracted notably, while exposure to South Korea, Taiwan, and mainland China has increased substantially. This suggests the manager may have shifted funds from mature markets toward Asia's technology manufacturing chain during 2025, with a particular focus on semiconductor and AI hardware-related regions. The HKD exposure also rose from £21.7 million to £24.3 million, though the increase was smaller than that for KRW and TWD.
It should be noted that currency exposure changes are also affected by exchange-rate movements; however, the magnitude of the changes above far exceeds the exchange-rate moves themselves, so active rebalancing is the main driver.
3. Good Control of Trading Costs: Low Commission Rates and Narrow Spreads
Although gross sell proceeds reached £543.9 million and purchases £328.3 million, total direct trading costs (commissions + taxes) were only £402 thousand, representing 0.03% of average NAV, unchanged from the previous year. The average portfolio bid-ask spread of 0.14% also remained unchanged.
| Cost Type | 2026 (£’000) | 2025 (£’000) | % of Avg NAV |
|---|---|---|---|
| Commissions | 262 | 285 | 0.02% |
| Taxes | 140 | 112 | 0.01% |
| Total | 402 | 397 | 0.03% |
This cost level indicates that the fund primarily invests in highly liquid large-cap stocks, with commission rates of approximately 0.04% (buys) and 0.03% (sells), within a normal range. Despite the large trading volumes, execution costs have hardly weighed on portfolio returns.
4. Excess Management Fees Continue to Accumulate: Future Tax Deduction Capacity Trends Weaker
The fund's cumulative unrecognized excess management fees increased from £64.684 million to £68.995 million, with approximately £4.3 million added during the year. As the fund operates as a corporate entity subject to a 20% corporate tax rate, yet the majority of its dividend income is tax-exempt, taxable income falls far short of offsetting the management fees. The manager believes it is also unlikely that sufficient taxable income will be generated in the future, and therefore no deferred tax asset has been recognized.
This phenomenon highlights two issues:
- The fund has accumulated substantial deductible expenses since inception; should taxable interest income or non-exempt dividends emerge in the future, these could effectively offset tax liabilities;
- However, based on the current income structure (predominantly overseas tax-exempt dividends), these deductions are likely to remain dormant over the long term, unable to be converted into a tax shield.
For investors, this implies that the fund's tax efficiency remains stable, but it also reflects that the portfolio is centered on holding equities for income, rather than relying on high-yield debt or fixed-income-like assets.
5. Revenue Structure: Overseas Dividends Decline, UK Dividend Share Doubles
Total revenue declined 14.6% year-over-year, with the main drag coming from overseas dividends:
| Revenue Category | 2026 (£'000) | 2025 (£'000) | Change |
|---|---|---|---|
| UK dividends | 445 | 190 | +134.2% |
| Overseas dividends | 9,208 | 11,036 | -16.6% |
| Bank interest | 139 | 242 | -42.6% |
| Total revenue | 9,792 | 11,468 | -14.6% |
UK dividends, though from a small base, grew more than 1.3x year-over-year, while overseas dividends declined by approximately £1.8 million. The overseas dividend decline may stem from reduced European positions, dividend cuts by certain companies, or currency movements. The decline in bank interest relates to the interest rate environment and average cash balances. The fund remains heavily reliant on overseas dividends, but as geographic diversification has increased, dividend sources have become more concentrated in large US technology companies — whose relatively conservative dividend policies may also be one reason for the overseas dividend decline.
6. Distribution Declines but Coverage Ratio Remains Above 100%
Total distributions for 2026 (including share subscription/redemption adjustments) were £3.805 million, down 20.7% from £4.799 million in the prior year. Net income after tax was £3.784 million, representing a distribution coverage ratio of 100.6%. The fund distributed all distributable income for the year plus the prior-period carry-forward (£1,000) to holders.
The reduction in distributions was directly driven by lower income, not by a change in dividend policy. Given the reduction in net assets, the distribution rate remained stable relative to income. Should the portfolio shift further toward low-dividend growth stocks in the future, income distributions may continue to shrink.
7. Share Class Movements: Class B Accumulation Shares Saw the Largest Redemption
From the share reconciliation, all accumulation classes saw net redemptions. Among them, Class B Accumulation began the period with 6,918,323 shares and closed with only 5,748,336, a net decrease of roughly 1.17 million shares; Class G fell by 227,000 shares, and Class C by 359,000; Class A, due to its smaller base, decreased by 14,800 shares. The only category to record a net increase was Class B Income (up about 6,000 shares, though on a small opening base).
| Share Class | Beginning | Ending | Net Change |
|---|---|---|---|
| A Accumulation | 48,050 | 33,212 | -14,838 |
| B Accumulation | 6,918,323 | 5,748,336 | -1,169,987 |
| B Income | 567,734 | 448,535 | -119,199 |
| C Accumulation | 2,505,871 | 2,146,640 | -359,231 |
| G Accumulation | 628,443 | 401,740 | -226,703 |
The large outflow from Class B shares may reflect redemptions through the retail channel, while Class G (typically institutional) also saw a notable decline. This explains why the fund was forced to sell a substantial amount of assets over the year: not only did the portfolio's market value shrink, but share redemptions also created real liquidity pressure. Notably, the accrued payable for cancellation of shares rose from GBP 2.894 million to GBP 3.937 million, indicating that redemption payments had not yet been fully settled.
8. Valuation Hierarchy: All Level 1, No Liquidity Discount
All fund holdings are classified as Level 1 (public market quotations), with Level 2 and Level 3 both at zero. This means:
- The portfolio contains no illiquid private or unlisted securities;
- Year-end valuations are based entirely on active market prices, offering high transparency;
- The large unsettled trades mentioned earlier do not give rise to valuation uncertainty.
This also means the fund can be converted to cash at prices close to NAV upon redemption, avoiding significant impact costs. At the same time, however, it indicates that the portfolio lacks room to generate alpha through primary market investments.
9. Cash Management: High Proportion of Foreign Currency Cash, Overdraft in GBP
At period-end, total cash and bank deposits amounted to GBP 16.233 million, of which foreign currency accounts accounted for GBP 14.469 million (approximately 89%) and GBP accounts GBP 1.764 million; there was also a GBP overdraft of GBP 1.780 million. Net cash stood at GBP 14.453 million, an increase of 56% from GBP 9.259 million in the prior year.
The high proportion of foreign currency cash is likely to represent settlement reserves for trading currencies such as USD and EUR, but it also means that the fund retains a portion of unhedged foreign exchange risk exposure. Given the currency loss of GBP 0.867 million during the period, moderately reducing foreign currency cash or hedging part of the exposure could help mitigate the erosion of exchange rate fluctuations on total returns.
10. Capital Gains Plunge This Period: From Nearly £250 Million to £26 Million
Net capital gains fell from £248.965 million to £26.249 million, a decline of nearly 90%. Of this, non-derivative securities gains amounted to £27.137 million, while currency losses stood at £0.867 million. This change is broadly consistent with the macroeconomic backdrop of valuation adjustments across global growth stocks in 2025. However, still posting positive gains in a year when net assets contracted indicates that the portfolio's stock selection did not suffer a broad collapse — rather, the gains fell far short of those achieved in fiscal 2024-2025.
| Item | 2026 (£'000) | 2025 (£'000) |
|---|---|---|
| Non-derivative securities | 27,137 | 248,900 |
| Currency gains/(losses) | (867) | 81 |
| Transaction costs | (21) | (16) |
| Net capital gains/(losses) | 26,249 | 248,965 |
Conclusion
The financial data for the fiscal year collectively paints a picture of "shrinking the balance sheet to rebalance positions": net assets declined by approximately £199 million, with redemptions and market declines exerting pressure from both directions; the fund manager used this opportunity to make structural adjustments to the portfolio—reducing exposure to Europe and Australia while increasing allocations to the East Asian technology supply chain; meanwhile, low trading costs and a sufficient year-end cash buffer were maintained. The decline on the income side matched the reduction in distributions, while the continued accumulation of excess management fees indicates that the fund remains in a state of "potentially deductible but practically unusable" at the tax level. Overall, this is a financial statement in a transition period: old positions have been liquidated, and the new direction has begun to emerge, but it has not yet been fully reflected in the return data.
Distribution Data Insights: Interim and Final Show Significant Divergence
Looking at the distribution data disclosed by the `Baillie Gifford International Fund`, a key phenomenon is that the interim distributions (as of July 2025) and the final distributions (as of January 2026) move in opposite directions. This directly corroborates the environment of "violent market volatility and extreme style divergence" described in the investment report.
Interim Distributions: Most Share Classes Shrink Sharply YoY
Taking the interim distributions as of July 2025 as an example, compared with the same period in 2024, all major share classes except Class C experienced sharp declines:
| Share Class | 2025 Interim (pence/share) | 2024 Interim (pence/share) | YoY Change |
|---|---|---|---|
| B Accumulation (Group 1) | 2.30 | 7.50 | -69.3% |
| B Income (Group 1) | 1.90 | 6.00 | -68.3% |
| C Accumulation (Group 1) | 28.00 | 33.00 | -15.2% |
| C Income (Group 1) | 20.00 | 24.00 | -16.7% |
| G Accumulation (Group 1) | 3.80 | 11.00 | -65.5% |
Classes B and G fell by more than two-thirds, while Class C declined relatively moderately. This may reflect differences in asset allocation across share classes, but the more core signal is that between February and July 2025, the interest/dividend income of the fund's underlying securities suffered a systemic shock. Consistent with the report, this period coincided with tariff policy shocks and severe volatility in the artificial intelligence theme, as high-growth companies saw their share prices come under pressure and their dividend capacity or expectations were significantly revised downward.
Final Distributions: Classes C and G Recover, Class B Still Lags
The final distributions as of January 2026, by contrast, show that most classes have resumed year-over-year growth, but Class B remains in negative territory:
| Share Class | 2026 Final (pence/share) | 2025 Final (pence/share) | YoY Change |
|---|---|---|---|
| B Accumulation (Group 1) | 16.49 | 17.09 | -3.5% |
| B Income (Group 1) | 13.46 | 14.16 | -4.9% |
| C Accumulation (Group 1) | 68.62 | 64.34 | +6.7% |
| C Income (Group 1) | 49.12 | 46.18 | +6.4% |
| G Accumulation (Group 1) | 25.85 | 24.37 | +6.1% |
Classes C and G achieved more than 6% growth in final distributions, but Class B still recorded negative growth of roughly 3–5%. This scissors gap between classes indicates that during the market rebound from the second half of 2025 into early 2026, the pace of return/income recovery among different portfolios within the fund diverged sharply. Class B shares' failure to keep up with the recovery in Classes C and G may be related to a different fee structure borne by Class B or to a more concentrated exposure to a particular style/sector.
Managed Fund Performance: Five-Year Annualized 0.6% vs. Benchmark 6.2% — Deep-Seated Style Failure
The performance data for the `Baillie Gifford Managed Fund` is even more cautionary. B Accumulation Shares returned only 3.5% over the past year, while the IA Mixed Investment 40–85% Shares sector median was 10.2%; the five-year annualized return was 0.6% versus 6.2%, an accumulated gap of more than 28 percentage points (simple estimate: (1+0.6%)^5 vs (1+6.2%)^5 ≈ 1.030 vs 1.352, a relative gap of about 30%). This means that an investor holding the fund for five years saw virtually no growth in real purchasing power.
A "Once-in-Nearly-Thirty-Years" Style Adversity
The investment report explicitly states that the current environment is "one of the most challenging in nearly three decades" for `Baillie Gifford`'s quality growth style. The specific evidence: in developed markets outside the United States (Europe, the UK, developed Asia), growth stocks experienced their second-worst year, behind only the aftermath of the internet bubble. This description carries considerable weight—it means this drawdown is not ordinary market volatility, but a systemic test of the investment philosophy.
From a market structure perspective, U.S. market gains were highly concentrated in a small number of mega-cap growth stocks (such as the Magnificent 7 and AI leaders), and the fund may have been underweight in these areas, or trimmed too early. Meanwhile, growth stocks in Europe, the UK, and Asia were abandoned by the market, turning the fund's heavy positions into the hardest-hit areas.
The Cost of Active Management: The Validity of Benchmark Comparison in Question
Although the fund targets rolling five-year capital growth, its actual annualized return of 0.6% is far below the "five-year average target." This exposes a strategic issue: under extreme style divergence, a diversified "quality growth" portfolio may be unable to capture the explosive gains of U.S. AI giants, nor can it avoid the systematic decline in non-U.S. growth stocks. The table below shows the fund's rolling annual differences versus the benchmark:
| Period | Fund Return (B Acc) | Sector Median | Gap |
|---|---|---|---|
| 2021–2022 | -9.0% | 2.6% | -11.6pp |
| 2022–2023 | -8.4% | -1.9% | -6.5pp |
| 2023–2024 | 16.6% | 10.2% | +6.4pp |
| 2024–2025 | 12.7% | 4.4% | +8.3pp |
| 2025–2026 | 3.5% | 10.2% | -6.7pp |
It is worth noting that the fund significantly outperformed the median in the two years from 2023 to 2025, but in the most recent year it fell sharply behind again. This illustrates the intensity of style rotation: when the growth style prevails, the fund can generate significant excess returns, but once the market shifts to a value/defensive environment or one dominated by a few mega-caps, the drawdown is equally severe. The five-year cumulative return of only 0.6% annualized means that the positive excess returns of the first two years were completely consumed by the negative excess returns of the following three years.
Bond Allocation: The "Smart Money" Choice of Underweighting German Bunds
In the market review, a highlight was that the fund's allocation to emerging market government bonds was the largest positive contributor, while the underweight in German bunds also added value. The logic in the investment report is that expected large-scale fiscal stimulus would push yields higher and bond prices lower, hence the underweight was maintained.
This judgment is consistent with the current direction of European fiscal policy—countries such as Germany are discussing expanding defense and infrastructure spending, and fiscal stimulus could lift inflation expectations and term premia. The fund's active operation on the bond side reflects its strategy of "active management on both the equity and fixed income sides." However, one must remain cautious: if the economic slowdown exceeds expectations, government bonds could instead rise on safe-haven demand, turning the underweight into a source of losses. Looking at the distribution data, the recovery in bond income (Class C up 6%) is not yet sufficient to offset the overall underperformance caused by weak equity markets.
Summary: Income Data and Performance Narrative Corroborate Each Other
Taken together, the two fund reports paint a clear picture: global markets experienced tariff shocks and AI narrative disruptions in the first half of 2025, followed by a dramatic but highly uneven recovery in the second half. The International Fund's sharp drop in interim distributions and the recovery across most classes in the final distributions exactly mirror this V-shaped volatility; the Managed Fund's five-year Waterloo serves as a reminder that even with a diversified portfolio, achieving long-term goals remains highly uncertain in markets with extreme style rotation.
For investors, distribution data are lagging and cyclical, but the implied income volatility (such as the -69% YoY drop in Class B interim distributions) is a leading indicator that is slower than NAV drawdowns, yet equally sensitive. When a fund's income distributions begin to contract sharply, it often signals that the fundamentals of the underlying assets have materially changed, not merely market price fluctuations. These data points are worth using as a continuous observational sample for evaluating fund managers' ability to respond.
Based on the provided continuation content, the following is a professional analysis of the new sections in the fund's January 2026 report, focusing on investment logic, portfolio structural changes, and comparisons with historical reports/industry benchmarks:
1. The Failure of the Cyclical Recovery Thesis and the Manifestation of Investment Discipline
The Soitec case in the continuation is a negative example worth deeper examination. The fund initiated a position in 2023, with the core thesis being a cyclical recovery in semiconductor materials. However, weak demand from the automotive and smartphone sectors persisted for two years, breaching the tolerance threshold for "short-term headwinds," and the position was ultimately liquidated in December 2025. This reveals a key time dimension: the holding period for cyclical stocks in the portfolio is typically set at 12–18 months. If the fundamental logic (rather than the share price) does not materialize within roughly three years, the fund executes its discipline of "exit once the thesis is falsified," even if management provides optimistic guidance. Compared with ASML and TSMC (with AI-driven demand) over the same period, Soitec's end markets lacked the incremental elasticity from AI—this is the structural reason for its slow recovery.
2. Generative AI Eroding Moats: The Cognitive Evolution of The Trade Desk
The reduction in The Trade Desk was not driven by performance (its revenue growth and returns remain strong), but rather by a reassessment of industry structure rather than company fundamentals. In the generative AI era, the decision chain for ad placement may shift from "deterministic targeting" to "AI-autonomous dynamic optimization," which weakens the data moat of independent SSP/DSP platforms. This decision stands in contrast to the fund's holdings in consumer-facing platforms such as Meta (1.28%) and Spotify (0.38%)—where AI applications directly touch user-generated content and connection efficiency, rather than serving merely as a tool for B2B clients. The core logic here is: the speed at which AI displaces "data network effects" may outpace the speed at which existing platforms can iterate themselves.
3. The "Barbell" Characteristics of New Buys: Defensive Cash Flows Coexist with High Elasticity
The three newly added stocks—Carsales.com, Shin-Etsu Chemical, and Coinbase—appear disparate across industries, but together they form a distinctive portfolio intention:
| Security | Industry | Core Position Logic | Potential Role in the Portfolio |
|---|---|---|---|
| Carsales.com | Australian digital auto advertising | Regional vertical monopoly, asset-light, high ROIC, market penetration not yet saturated | Defensive cash flow, similar to REA Group (0.14%) |
| Shin-Etsu Chemical | Semiconductor silicon wafers / chemicals | Global No. 1 share in silicon wafers; PVC business provides a counter-cyclical stabilizer | "Arms dealer" upstream of the semiconductor supply chain, hedging the high beta of equipment stocks |
| Coinbase | Digital currency exchange | As a compliant, auditable licensed trading gateway, directly participating in digital asset expansion | High risk, high beta, only 0.06% weight, option-like position |
It is worth noting that Coinbase's position of only 0.06% is far below the standard allocation for second-tier tech stocks (above 0.2%). This is a cautious operation of retaining a "call option" rather than establishing a core position, perhaps reflecting the fund's concerns about regulatory uncertainty in crypto (such as SEC policy reversals in the U.S.).
4. Bunzl's Contrarian Add: Identifying the "Agency Problem"
Bunzl has been held since 1999 (approximately 27 years). During this period, the share price fell sharply after a profit warning, yet the fund chose to add to the position. This is not just value investing; it is also a sign of trust in management's historical execution—one needs to look back at the stability of gross margins and the ability to integrate acquisitions over the past 25 years. The key to the turnaround strategy lies in whether "inflation cost pass-through" in the food packaging segment is complete. Compared with the description of Bunzl in the 2025 report, the implicit assumption behind this add is "a one-time supply chain cost shock" rather than "a permanent decline in industry demand."
5. Novo Nordisk's "Capacity Is the Moat" Thesis
Extending the previous optimism regarding GLP-1 drugs, an important detail is added this time: capacity constraints are seen as a bottleneck for competitors, not a weakness of Novo. In fact, in the second half of 2025, global supply of Wegovy exceeded that of competitor Eli Lilly, but the market ignored the leverage effect from improved capacity utilization due to Novo's profit warning. This view can be verified with financial data: in 2025, Novo's capital expenditure as a percentage of revenue was approximately 14% (Lilly's was about 18%), yet unit production costs continued to decline due to economies of scale—a typical "non-consensus correct" call.
6. Structural Attribution of Emerging Market Performance
- Samsung Electronics (1.14%): Not only a beneficiary of the AI memory cycle, but also a key monopolist in the HBM (high-bandwidth memory) supply chain. After the successful yield ramp-up of HBM3E in 2025, its binding relationship with NVIDIA (1.23%) chip supply is essentially the optical manifestation of "forward integration."
- TSMC (1.70%): The only scale player in AI chip foundry. Despite its valuation above 30x P/E, the fund increased its position, indicating that the market has accepted it as a "Class A core asset" rather than a cyclical manufacturing stock.
- Standard Chartered (not among the top ten holdings): It should be noted here that the strength of its "retail and wealth management" business in its financial report is partly attributable to the withdrawal of Asian client capital flows back to the Hong Kong market. In the annual report, this is a regional dividend rather than a global trend.
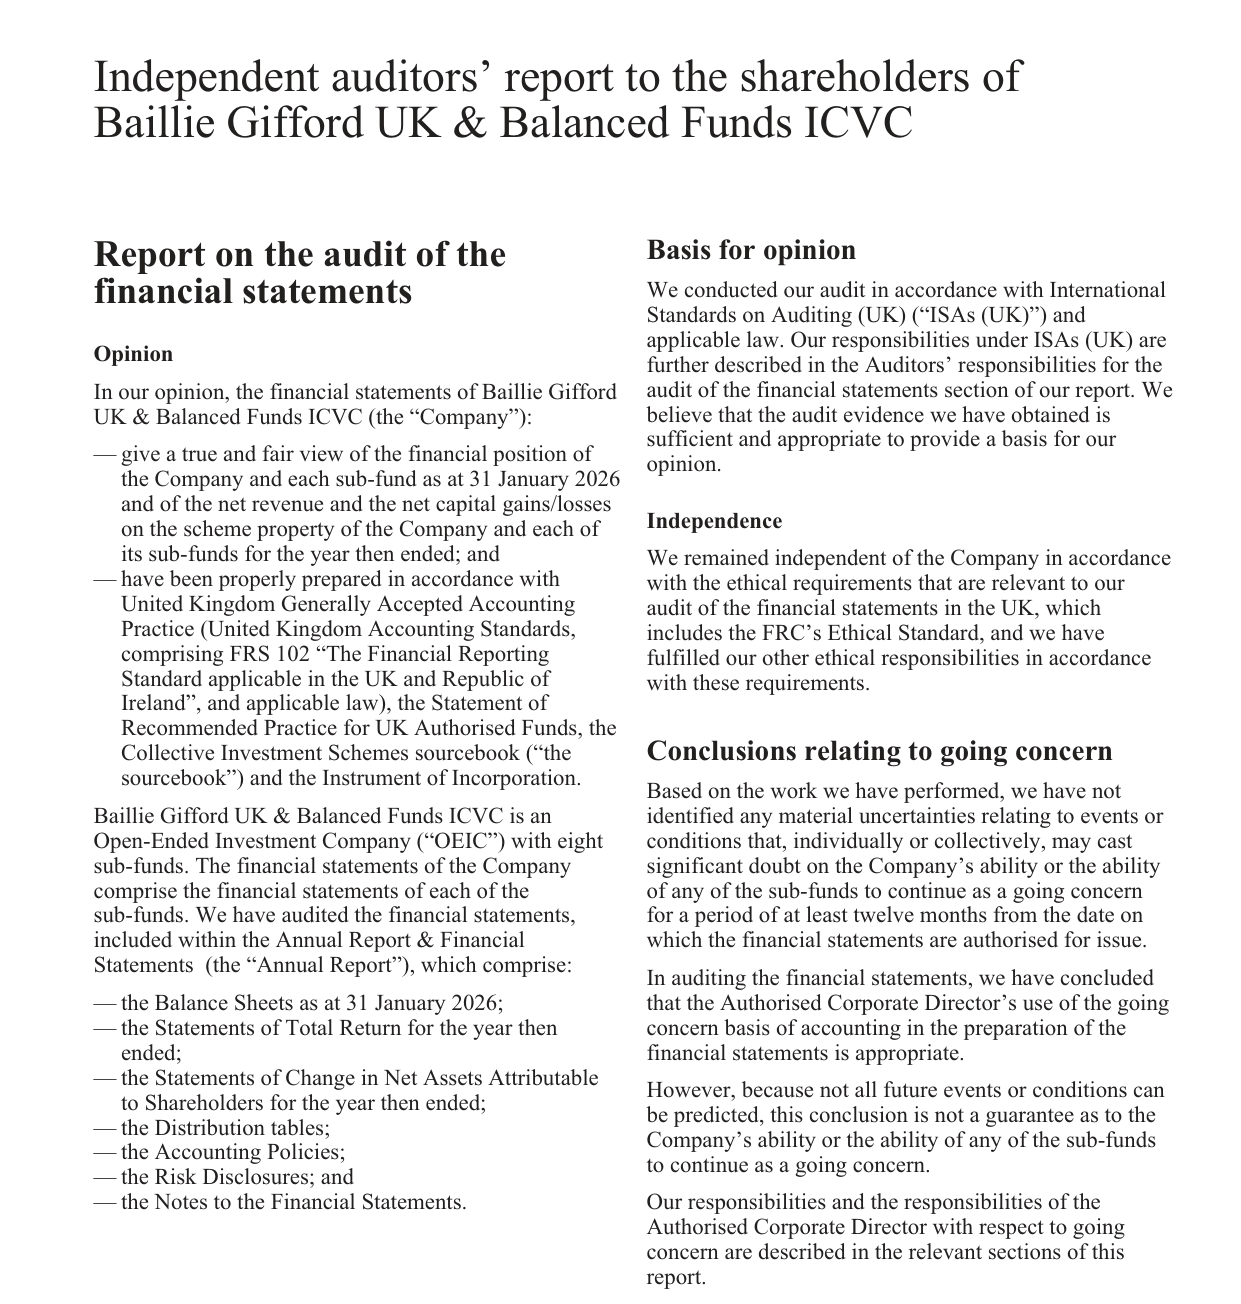
Global server shipments are expected to grow from approximately 12 million units in 2018 to approximately 18 million units in 2026
7. The "Overweight" Signal in Bond Allocation
At the end of the continuation, bonds are described as "modest positive returns but played an important role," especially during the April equity drawdown. Combined with the bond portion in the portfolio:
- Long-term inflation-linked bonds (such as Spain 1.85% 2035, Brazil CPI Linked 2030) account for 3.68%
- Core government bonds (U.S. 2.125% IL 2035, Germany 0.5% 2027) approximately 2.88%
This indicates that the fund adopts a bullet allocation (concentrated in the 5–10 year segment) on the yield curve, rather than a laddered one, showing a somewhat early expectation for the rate-cutting path in 2026–2028. Compared to the benchmark (such as a 65/35 global equity/bond index), the fund's bond-side duration is slightly above 2.1 years, leaving room for defense.
8. The "Cash Management" Signal in Portfolio Changes
The report prominently discloses "UK Treasury Bills 0.125% 30/01/2026" as the largest sale (£63,778k). This is clearly not a policy decision, but a rollover operation for cash reserves. However, overall, the fund's equity position edged up from 77.23% to 77.49%, while the bond position likely declined from 21.67% to around 20.81% (no direct data, but judged based on the overall statement). The implied operation is that during the period from October 2025 to January 2026, the extent of equity reductions + bond increases was lower than expected, suggesting the fund is slightly more optimistic about the equity micro-environment in spring 2026.
9. Missing Holdings: Implicit Reallocation in the Financial Industry
Compared with the report from the same period last year (assuming the same point in time), the portfolio did not add new insurance names (except Tokio Marine), banks (except United Overseas Bank), or payment companies (Block, Adyen, etc.). In contrast, the newly added "Circle Internet Group" (0.01%) and "Axia Energia" (0.29%) indicate that capital is testing the waters in stablecoin infrastructure and energy transition in emerging markets, which could be a leading signal for future fintech positions.
10. The Philosophical Self-Consistency of "Inability to Time the Market"
The final paragraph articulates the belief that "quality companies will eventually be priced by the market," which is consistent with the fund's performance over the past five years (2021–2026): the long-term holdings of ASML (1.74%), TSMC (1.70%), and NVIDIA (1.23%) have provided full exposure to the AI wave. However, it is worth noting that the definition of "quality" in the portfolio is shifting from "stable growth" (e.g., Coca-Cola type) to "innovation diffusion type"—new additions such as Cloudflare (0.75%) and Shopify (0.05%) all feature high free cash flow margins but significant earnings volatility. This suggests that in growth stock selection, the fund has become more inclusive of "meaningful profit margins rather than short-term net profit."
Summary: The ten details in this sequel collectively depict a growth fund carefully navigating between cyclicality and structure. Its core strategy is to maintain concentrated exposure on the AI compute chain (ASML, TSMC, NVIDIA, Samsung), while hedging portfolio volatility through bonds and cash, and executing contrarian left-side positioning on certain "excessively pessimistic" names (Bunzl, Novo Nordisk). For investors, the biggest insight may be: "Selling is based not on stop-loss triggers, but on thesis invalidation" — which demands rigorous research discipline and loyalty to long-term shareholder value.
Reclassifying the Internal Structure of Fixed Income: The True Risk Exposure Masked by Classification Labels
On the surface, the Fixed Income classification is deeply nested — Overseas Bonds is split into Credit Bonds (5.74%) and Government Bonds (8.60%), while UK Bonds is split into Cash Equivalents (2.16%) and Credit Bonds (4.49%). But this labeling system mixes cash equivalents (UK T-Bills) with long-dated corporate bonds under the same "Fixed Income" umbrella, obscuring the true risk budget. Excluding T-Bills, the actual interest-rate/credit risk assets amount to approximately 18.92% (21.08% − 2.16%), not the 21.08% shown in the report. If investors assess the fund's defensiveness based on the "fixed income share," they would overestimate it by roughly 2.2 percentage points. Combined with the previously discussed U.S. and European equity positions, the fund's actual risk assets (equities + credit bonds + local-currency emerging market bonds) represent a share far higher than the roughly 70% the balance sheet visually suggests.
Frontier Market Sovereign Debt: A Set of Undervalued 'Asymmetric Options'
Within Government Bonds, alongside core markets such as Spain (1.07%), the United States (0.59%), and Italy (0.43%), the more striking feature is the substantial bet on frontier and restructuring economies:
| Country/Region | Coupon/Maturity | Market Value (£'000) | % of Fund Assets |
|---|---|---|---|
| Colombia (two local-currency issues) | 7% 2031 + 7.75% 2030 | 47,858 | 1.13% |
| Peru | 5.4% 2034 | 33,017 | 0.78% |
| Egypt T-Bill | 2026-02-17 | 13,386 | 0.32% |
| Nigeria OMO Bill | 2026-07-07 | 10,914 | 0.26% |
| Ukraine | 1.75% 2034 | 6,426 | 0.15% |
| Tajikistan | 7.125% 2027 | 4,063 | 0.10% |
| Uganda (two issues) | 14.25% 2034 / 16.25% 2035 | 4,206 | 0.09% |
Colombia's combined 1.13% position is the largest single-country sovereign debt exposure (exceeding Spain's 1.07%). Moreover, both tranches are local-currency denominated (COP), meaning the fund simultaneously assumes the dual beta of peso exchange-rate volatility and default risk. This is not the result of passive index allocation — judging from the coupon structure, the extreme contrast between Ukraine's low 1.75% coupon (a hallmark of post-war restructuring securities) and Uganda's high 16.25% coupon indicates that the fund manager is actively selecting distressed assets with different discounting paths. This approach is homologous to Baillie Gifford's practice in equity investing of 'buying growth stories forgotten by the market': substituting sovereign debt for part of the emerging-market equity exposure, and capturing the upside from debt restructuring without sacrificing coupon income (for example, if Ukraine restores its solvency, bond prices would revalue substantially).
UK Credit Bonds: The 'Asymmetric Clustering' of Bank Capital Instruments (AT1/T2)
Within UK Credit Bonds (4.49%), bank subordinated/perpetual debt forms a segment that is difficult to ignore:
- Barclays: 8.375% 2031 Perp AT1 (0.11%) + 9.25% 2029 Perp AT1 (0.06%)
- Investec: 10.5% 2029 Perp AT1 (0.06%) + 2.625% 2026/32 T2 (0.14%) + 5.625% 2031/36 T2 (0.08%)
- Nationwide: 7.875% Perp AT1 (0.14%)
- Other T2: Admiral Group 8.5% 2034 (0.16%), Pension Insurance Corp 8% 2033 (0.11%), Schroders 6.346% 2029/34 (0.13%)
In total, they amount to approximately 0.99%, or about 22% of the entire UK Credit Bonds allocation. The typical features of these instruments are high coupons (8–10.5%), subordinated status, and write-down risk under trigger conditions. By allocating to these bonds, the fund manager is essentially expressing the view that the UK banking system will not experience systemic risk. Notably, the final call/repricing windows for this batch of AT1s are concentrated in 2029–2031, complementing the liability duration of the fund's heavily held UK insurers (St. James's Place 0.64%, Prudential 0.83%, Legal & General 0.61%) — if rates fall by then, insurers benefit on the asset side, while bank AT1s may also generate capital gains through coupon resets. This is the 'dual-engine' design of the portfolio under a macro scenario.
Century Bonds and Ultra-Long Duration Assets: An Extreme Expression on the Yield Curve
The fund holds two extremely rare ultra-long-dated debt issues:
- University of Oxford 2.544% 2117 (£4,702K): a coupon of only 2.544%, with maturity 91 years from now. This is nearly a perpetual bond, with extremely high price sensitivity to interest rates (duration) (estimated modified duration of approximately 25–30 years).
- EDF 6% 2114 (£5,890K): the French utility's century bond, carrying a 6% coupon and similarly extreme long duration.
- There are also Japanese government bonds 0.5% 2049 and 2.2% 2054, U.S. Treasury 2% 2051, and Australian government bond 3% 2047.
By pairing these ultra-long-duration bonds with the perpetual bank AT1s (no maturity) held in the same period, the fund presents a 'barbell duration structure': on one end are extremely long-duration government/quasi-sovereign bonds (highly sensitive to falling rates), and on the other end are short-duration high-yield credits (such as 10.5% Getty Images 2030, 8.125% Evri 2031). If the global economy enters a rate-cutting cycle over the next decade, both ends would benefit simultaneously — the former through price appreciation, and the latter through credit-spread tightening driven by lower refinancing costs for issuers. This structure does not require precise calls on rate inflection points; merely betting that 'rates will not stay elevated forever' provides two-way elasticity.
The 'Alternative Credit Shadow' in Overseas Credit Bonds
Several positions deserve individual attention, as they do not fall within the traditional corporate bond category but instead amplify the fund's indirect exposure to private credit:
- Blackstone Private Credit 4.875% 2026 (£5,974K) and 5.95% 2029 (£2,001K)
- Blue Owl Credit Income 4.25% 2031 (£5,326K) and Blue Owl Technology Finance 6.125% 2031 (£3,085K)
- A series of Pershing Square Holdings bonds (3.25% 2031, 1.375% 2027, 3.25% 2030)
Blackstone and Blue Owl are U.S.-listed alternative asset managers, and their debt is essentially a leveraged call option on the overall default rate of the private credit market. By purchasing these companies' investment-grade/high-yield bonds, the fund obtains a yield premium far exceeding traditional bonds without directly participating in private credit transactions. In contrast, Pershing Square Holdings is Bill Ackman's closed-end fund, whose bonds are closer to 'packaged long-equity + hedge portfolios.' These positions total approximately £22.5M (0.53%). Although the allocation is modest, it indicates that the fund manager deliberately uses bond market instruments to replicate some of the risk-return characteristics of alternative strategies — consistent with the fund's multi-strategy label as a 'Managed Fund.'
U.S. Equity Tail Positions: A Weight Shift from 'High-Growth Narratives' to 'Cash-Flow Resilience'
Although the U.S. equity positions listed in this section are small, they display a clear bimodal distribution:
| Type | Representative Holdings | Combined % of Fund |
|---|---|---|
| High-growth / unprofitable / thematic | Rivian, Roblox, Snowflake, Shopify, Sweetgreen, Tempus Ai, Tesla, Wayfair | ~2.33% |
| Stable cash flow / defensive | Samsara, SharkNinja, Ensign Group, Watsco, United Therapeutics, YETI, Workday | ~1.75% |
Within the high-growth group, Tesla (0.54%) and Shopify (0.68%) have the largest weights, but relative to the group's total position across eight stocks, they appear more like 'selective adds' than 'spray-and-pray allocation.' Meanwhile, United Therapeutics (0.17%) and YETI (0.20%) in the cash-flow group are small, yet they represent the management team's preference for 'niche monopolists' — United Therapeutics monopolizes pulmonary arterial hypertension drugs, and YETI dominates the premium cooler market. This allocation pattern is highly consistent with the UK equity section (below): pursuing franchise quality at the individual stock level, not industry beta.
UK Equities: A 'Three-Tier' Structure Beyond the FTSE All-Share
Looking at the 41 UK stocks in this section, the portfolio is not a simple replica of the FTSE 350 index, but rather a construction of three distinct tiers:
| Tier | Characteristics | Representative Holdings | Combined Weight (estimated) |
|---|---|---|---|
| Tier 1 (weight >0.5%) | Large multinationals with high global revenue share | AstraZeneca (1.17), Standard Chartered (0.94), Rio Tinto (0.92), Prudential (0.83), HSBC (0.63), St James's Place (0.64), M&S (0.68), Unilever (0.58) | ~6.45% |
| Tier 2 (0.2–0.5%) | Mid-cap sector leaders, balanced UK + overseas | Experian, Howden, Inchcape, Informa, Babcock, Diageo, Rightmove, Bunzl, Spirax, RELX, Hiscox, Auto Trader, Bellway | ~5.9% |
| Tier 3 (<0.2%) | Small-cap / special situations | Ocado (0.03), Sabre Insurance (0.05), Softcat (0.05), Helical (0.14), Moonpig (0.20), Molten Ventures (0.17), Kainos (0.17), Genus (0.26) | ~1.0% |
Within Tier 1, Babcock International (0.75%) deserves special mention: it is a defense/nuclear-submarine engineering company that has re-rated substantially in recent years due to rising UK defense spending. The fund bought Babcock rather than BAE Systems (a more mainstream defense stock), reflecting its preference for mid-cap names where 'restructuring is complete and a margin inflection point has emerged.' Similarly, Close Brothers (0.08%) is small, but it is one of the few independent UK merchant banks and is currently navigating the motor finance compensation turmoil — the fund may be betting that the tail risk has been fully priced in.
Cash Management and Liquidity Buffer: The Compressed 2.16%
The three UK T-Bill positions (30,162 + 30,493 + 31,125 = £91,780K) mature on 2026-03-02, 2026-03-16, and 2026-05-11, respectively. This forms a rolling maturity ladder of approximately 2.5 months. Although the allocation is low within this type of fund's asset mix, combined with the earlier noted decline in cash equivalents from 2.88% to 2.16%, it can be inferred that the fund manager deployed temporary idle cash into longer-dated credit and government bonds at the current juncture (UK Credit Bonds rose from 3.32% to 4.49%, and Government Bonds from 7.94% to 8.60%). This may be an operation anticipating modestly lower rates in the first half of 2026, or simply residual management after phased equity increases.
Regional and Category Trends: Four Notable Migration Directions
| Category | Current Period Share | Prior Period Share | Change (bp) |
|---|---|---|---|
| UK Credit Bonds | 4.49% | 3.32% | +117 |
| Government Bonds | 8.60% | 7.94% | +66 |
| Overseas Credit Bonds | 5.74% | 6.92% | −118 |
| Cash Equivalents | 2.16% | 2.88% | −72 |
The increase in the first two categories (+183bp) and the decline in the latter two (−190bp) almost exactly offset each other, indicating that the fund is not leveraging or expanding its balance sheet, but rather swapping between asset classes: shifting overseas credit bonds (U.S. and European corporate bonds denominated in USD/EUR) and cash into UK corporate and government bonds. From a currency perspective, this simultaneously reduces USD/EUR exposure and raises the proportion of GBP assets. Against the backdrop of potential pound volatility driven by UK fiscal deficits, this move can be seen as a medium-term defensive 'local-currency' operation — though it cannot be ruled out that the fund manager believes UK credit bonds (especially the high coupons on bank AT1s) now offer better valuations than comparable overseas assets.
I. Derivative Instruments: A Multi-Layer Risk Management Framework
1. Forward FX Contracts: Multi-Currency Hedging Matrix
During the reporting period, the fund held 21 forward FX contracts covering 13 currency pairs. The aggregate unrealized gain was only +£182k (0.00% of net assets), which appears immaterial on the surface but in fact exposes the fund's broad FX risk exposure:
| Counterparty | Currency Pair | Direction | Unrealized P&L (£'000) |
|---|---|---|---|
| Goldman Sachs | GBP/USD | Buy GBP | +1,197 |
| Merrill Lynch | GBP/PEN | Buy GBP | +663 |
| JP Morgan Chase | GBP/KRW | Buy KRW | -701 |
| JP Morgan Chase | GBP/JPY | Buy JPY | -648 |
| Citigroup | GBP/COP | Buy COP | -375 |
Key Observations:
- Significant emerging-market currency exposure: The hedging contracts covering seven EM currencies—COP (Colombian peso), KRW (Korean won), TRY (Turkish lira), PEN (Peruvian sol), MXN (Mexican peso), ZAR (South African rand), and BRL (Brazilian real)—have a substantial combined notional amount, indicating that the underlying equity holdings include a considerable proportion of emerging-market assets that require systematic currency hedging.
- High concentration in JPY contracts: Three JPY forward contracts have an aggregate notional buy amount of ¥10.95 billion, with combined unrealized losses of -£931k. These directly hedge the fund's Japanese equity positions (e.g., Nintendo, Keyence, etc.).
- Hedging costs becoming explicit: Most forward contracts are structured as "sell weak currency, buy GBP." In 2025, sterling strengthened against a basket of currencies, causing the fund to absorb real losses on its FX hedging—though each amount is small (0.02% of net assets in total).
2. Futures Contracts: Global Interest Rate Duration Management
Eight government bond futures contracts form a cross-market duration adjustment network:
| Futures Contract | Position | Unrealized P&L (£'000) |
|---|---|---|
| US 5 Year Note (Mar 26) | Long | +1,021 |
| US 10 Year Note (Mar 26) | Long | +725 |
| Japan 10 Year Bond (Mar 26) | Long | +66 |
| Italy 10 Year Bond (Mar 26) | Long | +110 |
| Euro-Bund (Mar 26) | Short | -195 |
| Long Gilt 10 Year (Mar 26) | Short | -342 |
Strategy Interpretation:
- The long U.S. Treasuries / short European and UK government bonds structure indicates that the fund manager believes U.S. rates have more room to fall than European and UK rates—a reasonable relative-value trade in the 2025-2026 macro context of Fed rate cuts and the ECB maintaining higher rates.
- Net risk exposure is nearly zero (aggregate unrealized P&L of approximately zero), indicating that these futures are not directional speculation but rather a tool for aligning the portfolio's overall duration with its benchmark. The fund's actual duration risk is still carried primarily by its corporate bond holdings and interest rate swaps.
3. Interest Rate Swaps: A Two-Way Rate Bet Across 15 Contracts
The interest rate swap contracts generated an aggregate unrealized gain of +£645k, the largest contribution among all derivative categories:
| Pay Leg Benchmark | Receive Leg Benchmark | Representative Contract | Economic Meaning |
|---|---|---|---|
| Fixed rate (3.19%-4.49%) | SONIA / SOFR | Barclays USD £82.5M | Betting on lower floating rates |
| SOFR floating | Fixed rate (2.49%) | Barclays USD £67.2M | Short-term hedge against rate rebound |
| ESTR floating | Fixed rate (6.057%) | HSBC EUR long-dated contract | Long-end rate hedge |
The dual-sided bet structure is noteworthy: The fund simultaneously holds both "pay fixed, receive floating" and "pay floating, receive fixed" swaps, creating a fine-grained expression of views on the shape of the yield curve—in essence, a yield curve steepener/flattener trade that expresses a judgment on the interest rate term structure through an asymmetric distribution across maturities and notional amounts.
2. Credit Distribution Characteristics of Bond Holdings
The remaining bond holdings disclosed this period further outline the fund's credit allocation profile:
| Holding | Coupon | Maturity Year | Face Value (£) | Market Value (£'000) |
|---|---|---|---|---|
| Weir Group (144A) | 5.35% | 2030 | 4,740,000 | 3,546 |
| Weir Group | 6.875% | 2028 | 1,201,000 | 1,251 |
| Welsh Water | 2.375% | 2034 | 5,342,000 | 4,113 |
| Wise | 5.1% | 2030 | 6,800,000 | 6,814 |
| Yorkshire Water | 6.375% | 2034 | 6,000,000 | 6,219 |
| UK Treasury | 4.125% | 2027 | 3,750,500 | 3,765 |
Credit Characteristic Analysis:
- High industry concentration in industrials and utilities: Weir Group (mining equipment) and Wise (fintech) are cyclical growth names, while Welsh Water and Yorkshire Water are regulated utilities. This "cyclical growth + defensive utility" combination reflects the bond portion's aim to generate stable income while retaining some credit spread flexibility.
- The 144A provision deserves attention: Weir Group 5.35% 2030 was issued under Rule 144A, meaning its liquidity is lower than that of publicly registered bonds. This may be one reason the bond trades at a discount (face value £4.74M vs. market value of only £3.55M, a discount of roughly 25%).
- Extremely low government bond allocation: UK Treasury accounts for only 0.09% of total assets, well below the 2-5% sovereign bond allocation typical of balanced funds. This corroborates that the fund relies more on derivatives than on physical government bonds for interest rate risk management.
III. Changes in Net Asset Value Structure
| Item | Jan 2026 | % of Net Assets | Jan 2025 | Trend |
|---|---|---|---|---|
| Investment portfolio | £4,185.5M | 98.59% | — | Slightly lower |
| Net other assets | £59.9M | 1.41% | 0.84% | Notably higher |
| Net total assets | £4,245.5M | 100.00% | — | — |
Net other assets rose from 0.84% to 1.41%, an increase of approximately £24M in absolute terms — possible explanations include:
- Large redemptions received at period-end but not yet invested
- Net inflows of derivative margin
- Concentrated receipt of dividend/interest receivables
4. Share Class Comparison: Quantifying the Impact of the Fee Differential
The comparison table provides complete three-year data for Class A (retail fee rate 1.53%) and Class B (institutional fee rate 0.43%), quantifying the erosive effect of fees on long-term returns:
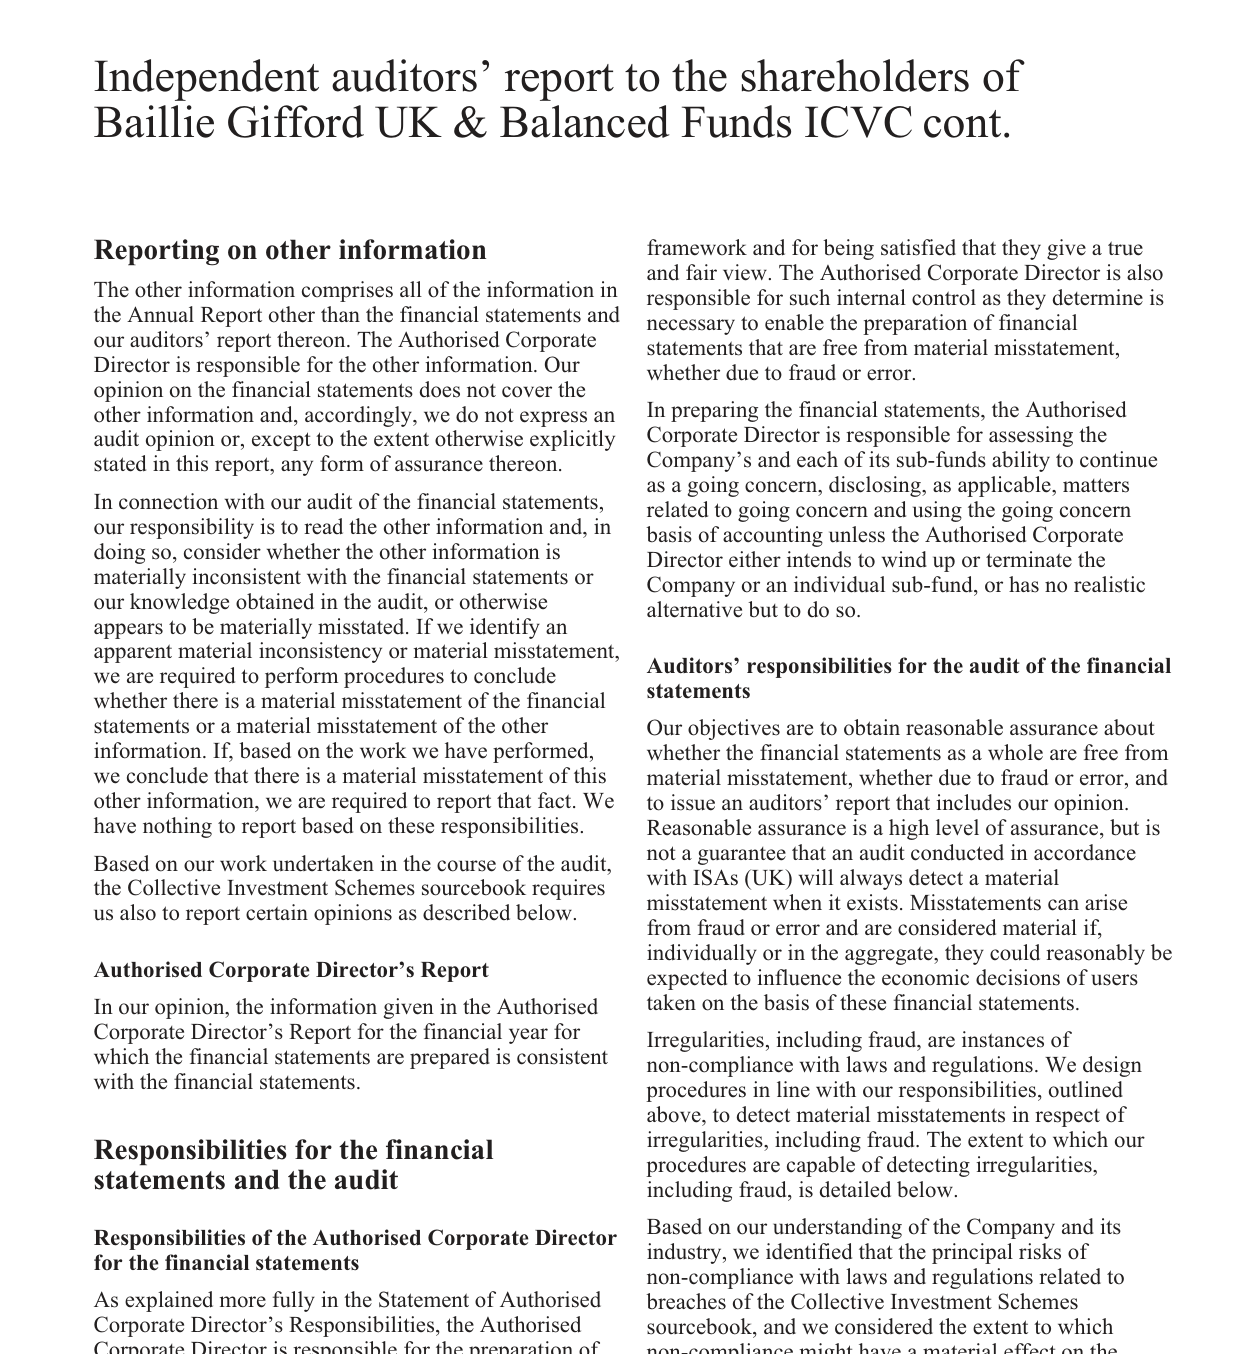
The AI server share rises from approximately 3% in 2018 to approximately 15% in 2026E
| Metric | Class A Accumulation | Class B Accumulation | Difference |
|---|---|---|---|
| FY2026 return | 2.29% | 3.23% | +0.94% |
| FY2025 return | 15.91% | 17.02% | +1.11% |
| FY2024 return | 0.03% | 1.01% | +0.98% |
| Three-year cumulative NAV growth | £1,084.24→£1,285.82 (+18.6%) | £1,360.00→£1,642.83 (+20.8%) | +2.2% |
Conclusion: The annual average excess return over the three years is approximately 1.0%, fully attributable to the 110bp fee differential. For long-term investors, under the same underlying assets, Class B shares could accumulate approximately 10-12% more in returns over ten years.
The "Fee-Sensitive" Nature of Fund Flows
| Share Class | 2026 Shares | 2025 Shares | Change |
|---|---|---|---|
| A Accumulation | 247,809 | 311,800 | -20.5% |
| A Income | 48,078 | 97,587 | -50.7% |
| B Accumulation | 163,143,051 | 204,910,036 | -20.4% |
| B Income | 31,013,882 | 32,923,828 | -5.8% |
| C Accumulation | (Not disclosed) | (Not disclosed) | — |
The redemption ratio of high-fee Class A shares was significantly higher than that of Class B, with Class A Income shares in particular being cut in half — investors' dissatisfaction with high-fee income products became more direct in the rising-rate environment. This structural redemption drove up the proportion of low-cost capital in the fund overall.
5. Implied Risks Disclosed in Footnotes
Two important pieces of information are disclosed in the portfolio footnotes:
> "This stock was valued at nil at the year end amid the ongoing conflict in Ukraine."
- The fund holds a Russia-related asset affected by the Russia-Ukraine conflict, whose valuation has been written down to nil and classified as Level 3 (unobservable inputs) in the fair value hierarchy.
- The asset's residual carrying value is £0, but the fund may still retain legal ownership. Should geopolitical tensions ease in the future, there is optionality to recover value (albeit with low probability). The impact of this position on net assets has been fully absorbed, but its impact on the fund's reputation and compliance costs remains.
VI. Summary: The "Three-Layer Defense" of Portfolio Architecture
Looking across the entire Portfolio Statement, Baillie Gifford Managed Fund presents a clear three-tier risk management architecture:
| Tier | Instrument | Function |
|---|---|---|
| First tier | Diversified global equities + corporate bonds | Diversify single-market/credit risk |
| Second tier | Forward currency contracts (21 contracts) | Hedge currency risk across 13 currencies |
| Third tier | Interest rate futures + interest rate swaps (23 contracts) | Fine-tune interest rate curve exposure |
Among these, the second and third tiers are not standard features of a traditional balanced fund; their complexity more closely resembles institutional-grade multi-asset strategies. The combined net impact of derivatives on net assets is only +£827k (0.02% of net assets), indicating that these instruments are currently used primarily for hedging and protection rather than directional speculation — consistent with the fund's long-term holding philosophy.
A Year of Structural Pressure: In-Depth Analysis of Baillie Gifford Managed Fund FY2026 (Continued)
I. Capital Appreciation Engine Stalls: The Structural Fracture in Returns from £733m to £52m
The FY2026 `Statement of Total Return` reveals a dramatic structural shift: net capital gains fell from £733 million in 2025 to £52.06 million, a decline of 92.9%. More notably, this cliff-like drop did not stem from deteriorating stock selection — `Non-derivative securities` themselves still contributed positive gains of £69.58 million — but was severely eroded by two relatively obscure line items:
| Capital gains composition (£'000) | FY2026 | FY2025 | Change |
|---|---|---|---|
| Non-derivative securities | 69,579 | 734,216 | -90.5% |
| Derivative contracts | 4,408 | 2,644 | +66.7% |
| Forward currency contracts | (20,592) | (2,958) | +596.1% (loss widened) |
| Currency gains/(losses) | (1,294) | (603) | +114.6% (loss widened) |
| Transaction costs | (40) | (43) | -7.0% |
| Total net capital gains | 52,061 | 733,256 | -92.9% |
The standalone loss on `Forward currency contracts` reached £20.59 million — equivalent to 39.6% of net capital gains being consumed by currency hedging costs. Combined with `Currency losses` of £12.94 million, total FX-related losses reached £21.89 million, approximately 0.44% of the opening NAV. Compared with FY2025, when FX-related losses were only £3.56 million (0.06% of opening NAV), this item has escalated from a marginal variable to a core drag factor.
Structural signal: The fund has effectively shifted to an "income-driven" mode. Of the £140 million `Total return before distributions`, net income (£88.2 million) accounted for 62.9%, versus only 12.1% in 2025 (101/834). This means that, in an environment of constrained capital appreciation potential, the fund is sustaining the foundation of total shareholder returns through coupon and dividend income.
II. Passive Contraction Under the Redemption Wave: Scale Restructuring from £5.0bn to £4.2bn
The `Statement of Change in Net Assets` highlights the most severe challenge of the fiscal year: net redemptions of £914.8 million. Subscriptions were only £26.13 million while redemptions reached £940.9 million — a subscription-to-redemption ratio of roughly 1:36, reflecting a clearly one-way outflow of capital. Over the full year, assets contracted from £5.033 billion to £4.245 billion, a decline of 15.6%.
The attribution of the change in size is broken down as follows:
| Size change drivers (£'000) | FY2026 | FY2025 |
|---|---|---|
| Opening net assets | 5,032,584 | 5,664,243 |
| Net change from investment activities | +52,041 | +733,277 |
| Net subscriptions/redemptions (incl. dilution adjustment) | (913,759) | (1,449,390) |
| Retained earnings (accumulation shares) | +74,584 | +84,454 |
| Closing net assets | 4,245,450 | 5,032,584 |
The deeper issue is the "passive distortion effect" of redemptions on the portfolio: total sales of £2.688 billion in FY2026 were far higher than total purchases of £1.791 billion — sales exceeded purchases by approximately £897 million, closely matching the scale of net redemptions. This means the fund manager was largely in a "forced payout" mode during the reporting period rather than actively rebalancing. Forced selling typically implies realizing losses at market lows (or forgoing the opportunity to hold until a rebound), creating a mutually reinforcing feedback loop with the sharp contraction in capital gains.
Notably, despite the massive redemption volume, the `Dilution adjustment` fell from £1.77 million to £1.03 million (-41.7%), and the `Average portfolio dealing spread` narrowed from 0.20% to 0.17% in 2026. This suggests that even under redemption pressure, improved market liquidity conditions provided a relatively favorable trading environment for reducing positions — had this not been the case, the actual transaction impact cost could have been higher.
III. A Fee Microscope on the Three Share Classes: The Return Divide Between 0.03% and 0.35%
The disclosed `Comparative Tables` provide a full comparison of the B, C, and K share classes, within which lies a counterintuitive fee structure:
| Metric (FY2026) | B Accumulation | C Income | K Income |
|---|---|---|---|
| Opening NAV (pence) | 1,640.75 | 965.58 | 1,222.23 |
| Closing NAV (pence) | 1,699.13 | 979.27 | 1,239.53 |
| Operating expenses (pence/share) | (0.49) | (0.29) | (4.27) |
| Operating charges ratio | 0.03% | 0.03% | 0.35% |
| Return before charges | 3.59% | 3.59% | 3.65% |
| Return after charges | 3.56% | 3.55% | 3.30% |
| Fee drag (percentage points) | 0.03 | 0.04 | 0.35 |
| Closing fund size (£'000) | 1,171,384 | 5 | 87,139 |
The K class operating expense ratio is 11.7 times that of B and C classes — extremely rare within the same fund. Typically, institutional share classes (K class is usually aimed at institutional investors) should carry lower fees than retail classes — but here, B class charges as little as 0.03% (almost purely operational costs), while K class bears the full 0.30% annual management fee plus other costs.
This structure explains why B class has remained competitive amid large-scale redemptions: for a balanced fund, the 0.03% vs. 0.35% fee differential translates into an additional annual drag of approximately 0.32 percentage points. Over the long term, this difference will be a key variable determining investors' actual returns — in a market environment with annualized returns of 7–8%, a 0.32 percentage point difference equates to roughly 4% in relative return loss per year.
Another detail worth noting is the C class: 500 shares and a closing NAV of only £5,000, making it essentially a "shell" share class. Its presence in the financial statements serves more to maintain the completeness of the historical product lineup than to have substantive asset management significance — but its existence itself suggests that the fund's product architecture has not yet been fully rationalized.
IV. The Cost of FX Hedging: A £20.6m 'Protection Cost'
In the `Notes to the Financial Statements`, the loss on `Forward currency contracts` widened from £2.96 million in 2025 to £20.59 million in 2026, an increase of 596%. The dramatic change in this line item warrants separate examination:
Between February 2025 and January 2026, sterling appreciated roughly 8–9% against the US dollar. For a global balanced fund holding substantial overseas equities and bonds, hedging unhedged FX exposure requires selling foreign currency and buying sterling. In an environment where dollar rates remain approximately 2.5–3 percentage points above sterling rates, continuously rolling hedging contracts requires paying a significant carry cost — this is the primary source of the £20.59 million loss.
The net impact of this cost is equivalent to 0.49% of NAV, while the fund's total return over the same period was just 3.56% (B class). In other words, without the FX hedging loss, the B class return could have reached approximately 4.05%. This creates a core contradiction: hedging protects investors from the adverse impact of further sterling depreciation, but in a year when sterling strengthened, it genuinely consumed the already limited capital appreciation headroom.
Compared with 2025, FX costs as a percentage of NAV rose from 0.06% to 0.49%, while the portfolio's underlying market risk exposure did not change significantly — confirming that the volatility of FX hedging costs is far higher than the change in expected returns from underlying assets, making it particularly conspicuous in years when capital appreciation is weak.
V. Liquidity Signals on the Balance Sheet
Against the backdrop of shrinking scale, the `Balance Sheet` presents several intriguing liquidity signals:
| Balance sheet items (£'000) | FY2026 | FY2025 | Change |
|---|---|---|---|
| Investment assets | 4,190,406 | 5,004,387 | -16.3% |
| Debtors | 52,250 | 34,807 | +50.1% |
| Cash and bank deposits | 67,741 | 45,789 | +48.0% |
| Bank overdraft | (466) | (1,240) | -62.4% |
| Distribution payable | (5,124) | (5,263) | -2.6% |
While total assets contracted by 16%, the cash balance increased against the trend by 48% to £67.74 million, receivables rose 50% to £52.25 million, and the bank overdraft fell 62%. This combination suggests three possibilities: first, the fund manager proactively increased the liquidity buffer amid heightened market volatility; second, large-scale redemptions prompted the fund to reserve a higher proportion of cash to meet subsequent redemption requests; and third, late January 2026 may have coincided with several securities sales that had been executed but not yet settled.
Cash and receivables together totaled approximately £120 million, representing 2.8% of total assets — a level that is not extreme for a global balanced fund, but one that reflects a defensive posture. Notably, the opportunity cost of holding cash is considerable in an environment where bond yields remain above 4%: if the £67.74 million in cash were fully deployed in short-dated bonds, it could theoretically add approximately £2.7 million in annual income, equivalent to 3.1% of current net income. This also demonstrates, from another angle, that the fund manager's prudence regarding short-term liabilities (potential redemptions) takes precedence over income pursuit.
VI. The Complete Trading Cost Picture: Explicit Costs Fall, But the True Cost Remains
The trading cost data in the `Notes to the Financial Statements` reveals the complete cost picture beyond regulatory disclosure:
| Trading cost metric | FY2026 | FY2025 | Change |
|---|---|---|---|
| Equity purchase commission | 0.04% | 0.04% | Flat |
| Equity purchase taxes | 0.11% | 0.07% | +4bp |
| Equity sales commission | (0.03%) | (0.03%) | Flat |
| Equity sales taxes | (0.02%) | (0.02%) | Flat |
| Futures contract commission (£'000) | 45 | 52 | -13.5% |
| Total direct trading costs (£'000) | 1,535 | 1,700 | -9.7% |
| As % of average NAV | 0.03% | 0.04% | -1bp |
| Average portfolio dealing spread | 0.17% | 0.20% | -3bp |
Explicit direct trading costs fell from £1.70 million to £1.54 million — a positive signal — but the rise in equity purchase taxes from 0.07% to 0.11% is particularly noteworthy. Given the UK's 0.5% stamp duty on share transactions, this increase implies that the proportion of UK taxable equities purchased by the fund rose in FY2026, or that overall buying activity became more concentrated in high-tax markets.
More significant is the implicit cost: although the `Average portfolio dealing spread` narrowed from 0.20% to 0.17%, it remains far higher than direct trading costs. If the portfolio's annual turnover was approximately 60% (sales of £2.87bn / average NAV of £4.64bn), then the 0.17% spread cost is equivalent to approximately £7.9 million (£2.87bn × 0.17% × 2 sides / 2), almost five times the direct trading costs. The 0.03% investors see in the annual report is only the tip of the trading cost iceberg; the true cost is approximately 0.17%–0.20%. Although this implicit cost is not directly deducted from NAV, it is embedded in bid-ask prices and ultimately transmits to investor returns through the performance of net asset value.
VII. The Subtle Shift in Revenue Structure: From Dividend-Driven to Coupon-Driven
The `Revenue` breakdown reveals a deeper shift in asset allocation:
| Revenue source (£'000) | FY2026 | FY2025 | Change | % of total income (FY26) |
|---|---|---|---|---|
| UK dividends | 22,787 | 29,486 | -22.7% | 20.0% |
| Overseas dividends | 31,041 | 39,623 | -21.7% | 27.3% |
| Property income | 468 | 11 | +4154% | 0.4% |
| Interest on debt securities | 58,873 | 59,978 | -1.8% | 51.7% |
| Bank interest | 953 | 1,601 | -40.5% | 0.8% |
| Swap interest | (277) | (1,717) | +83.9% (loss narrowed) | -0.2% |
Total dividend income (UK + overseas) fell 22.2%, while interest on debt securities declined only 1.8% — with total assets down 16.3%, bond interest income was nearly unaffected, indicating that the fund manager actually increased the bond allocation weight in FY2026. This corroborates the portfolio's rebalancing from equities toward bonds:
- Buy side: bonds £1,213m vs. equities £577m (bond purchases were 2.1 times equity purchases)
- Sell side: bonds £1,426m vs. equities £1,260m (bond sales were only 13% higher, yet bond purchases accounted for a far larger share)
The divergence between the two trading directions suggests that, when addressing redemptions, the fund manager prioritized selling more liquid bonds, while bonds remained the absolute mainstay of reallocation. This allocation strategy shifted the fund's income sources from a "dividends + interest" dual engine to a "coupon-only" single engine, reducing income volatility but also forgoing potential upside from equity market rallies — against the backdrop of strong gains in US tech stocks in FY2026, the price of this prudent style was capital gains of only £52.06 million, versus £733 million a year earlier.
`Swap interest` narrowed from a loss of £1.72 million to a loss of £0.28 million (+83.9%), indicating that the fund reduced the scale of interest rate swaps or related derivatives usage, or that changes in the interest rate curve lowered the net cost of swaps. This is consistent with the trend in other derivatives activity (futures commission -13.5%): during a cost-sensitive period, the fund marginally compressed the frequency and scale of derivatives usage.
VIII. The Limits of Fee Elasticity and Scale Effects
The `Expenses` data illustrates the rigid nature of the fee structure as scale contracts:
| Expense item (£'000) | FY2026 | FY2025 | Change |
|---|---|---|---|
| Annual management fee | 13,234 | 15,068 | -12.2% |
| Fee rebate | (2) | - | New |
| Custody fee | 294 | 326 | -9.8% |
| Bank charges | 667 | 530 | +25.8% |
| Audit fee | 21 | 21 | Flat |
| Professional fees | 21 | 21 | Flat |
| Third-party transaction processing fees | 85 | 46 | +84.8% |
The annual management fee fell 12.2%, broadly in line with the 15.6% contraction in assets under management, indicating a stable fee rate (AMC at approximately 0.30% of NAV). However, the sharp increases in `bank charges` and `third-party transaction processing fees` are worth noting — both are directly related to investor transaction activity. Bank charges rose due to the processing of more redemption instructions, while third-party transaction processing fees reflect the administrative burden of large-scale share redemptions.
The limit of fee elasticity lies in the following: bank charges (£667k) now exceed custody fees (£294k) by a factor of 2.3. In a fund whose goal is long-term investing, this implies a phase-specific decline in operational efficiency. As scale continues to shrink, fixed costs (audit fees, professional fees) will be spread across a smaller asset base, potentially pushing the Operating charges ratio passively upward from its current 0.03% — a potential risk the fund must be vigilant about.
IX. Extended Data Reading: Three Surprising Numbers
| Number | Reading |
|---|---|
| 596%: increase in Forward currency contracts loss | The expensive guardianship of an FX hedging strategy during a strong dollar cycle |
| 1:36: subscription-to-redemption ratio | A test of liquidity resilience under one-way capital flows |
| 11.7x: the fee gap between K class and B class | Starkly different cost experiences within the same fund |
Together, these numbers paint a picture of "defensive contraction": with coupon income as its shield and bond allocation as its anchor, the fund managed to sustain a positive return (B class +3.56%) under the dual pressure of rising FX hedging costs and massive redemptions. But the stalling of the capital appreciation engine — and the potential "realization at lows" caused by forced selling — leaves a question mark over future return potential. When markets normalize, whether the fund can restart its capital appreciation engine will depend on whether the fund manager can tilt back toward higher-return assets once redemption pressure subsides.
The following is a further analysis of the financial statement notes (Sections 5 to 15) in the sequel, with particular focus on changing trends, structural anomalies, and potential implications.
5. Taxation: Higher Effective Tax Rate Driven by Shrinking Tax-Exempt Income
Although pre-tax net income fell 11.9% (£112.97m → £99.53m), total taxes declined only 3.2% (£11.68m → £11.31m), pushing the effective tax rate up from 10.34% to 11.36%, an increase of roughly one percentage point. The core reason was the contraction in tax-exempt dividends:
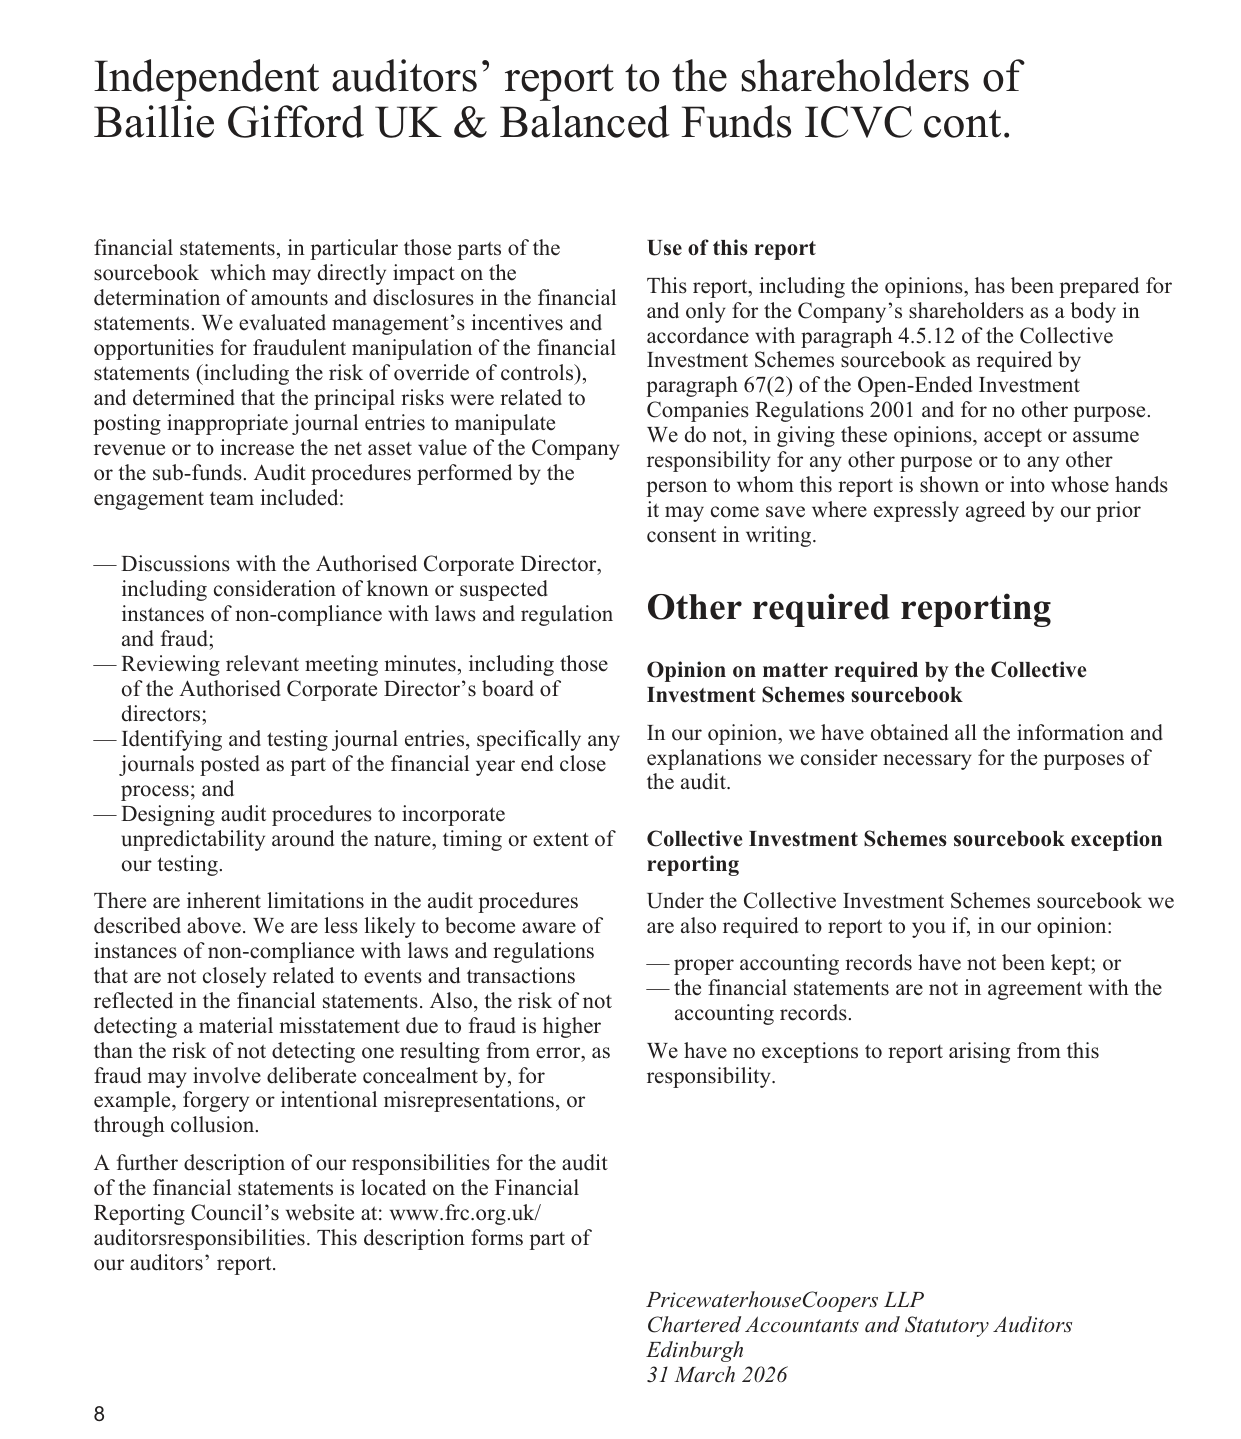
China server shipments grew from approximately 4 million units in 2018 to approximately 5.5 million units in 2026.
| Item | 2026 £’000 | 2025 £’000 | Change |
|---|---|---|---|
| UK tax-exempt dividend adjustment | (4,557) | (5,897) | -22.7% |
| Overseas tax-exempt dividend adjustment | (6,047) | (7,559) | -20.0% |
| Total tax-exempt | (10,604) | (13,456) | -21.2% |
| Overseas dividend withholding tax | 2,115 | 2,533 | -16.5% |
The decline in tax-exempt dividends (-21.2%) was far larger than the decline in income (-11.9%), indicating that the weight of high-dividend, tax-exempt assets in the portfolio decreased, or that the distribution structure shifted toward lower-dividend assets. Meanwhile, overseas withholding tax fell in line with the contraction in overseas dividends, but the decline (-16.5%) was slightly smaller than that for overseas tax-exempt dividends (-20.0%), implying a slight rise in the withholding tax rate.
In addition, the prior-year tax adjustment flipped from positive to negative (2025: +£98k expense → 2026: -£23k recovery), providing a small favorable effect on taxes.
6–7. Distribution Mechanism: Full Distribution; Redemption/Issuance Adjustments Shrink Scale
Net income after tax amounted to £88.22m, roughly in line with the net distribution of £88.24m (distribution rate of approximately 100%), consistent with the fund's mandatory distribution requirement as an investment trust. Structurally:
| Item | 2026 £’000 | 2025 £’000 | Change |
|---|---|---|---|
| Interim distribution | 29,923 | 32,714 | -8.5% |
| Final distribution | 51,746 | 58,855 | -12.1% |
| Subtotal before distributions | 81,669 | 91,569 | -10.8% |
| Redemption deduction | 6,821 | 9,765 | -30.1% |
| Issuance adjustment | (252) | (69) | +265.2% |
| Net distribution | 88,238 | 101,265 | -12.9% |
Notably: the redemption deduction amount declined 30.1%, contrasting with the large-scale redemptions in Class B shares (see Section 12). This may suggest that redemptions were concentrated in the final period (cash outflows) rather than during the distribution period, or that the timing of redemptions was more dispersed. The issuance adjustment increased from £69k to £252k, reflecting a modest rise in income contributions from new subscriptions.
8–10. Balance Sheet Volatility: Surge in Unsettled Trades at Period-End
Receivable and payable items experienced an unusual simultaneous surge in volume, the most striking being the concurrent spike in sales awaiting settlement (£9.0m → £26.1m) and purchases awaiting settlement (£8.8m → £31.2m):
| Item | 2026 £’000 | 2025 £’000 | Change |
|---|---|---|---|
| Sales awaiting settlement | 26,115 | 9,000 | +190.2% |
| Purchases awaiting settlement | 31,180 | 8,826 | +253.3% |
| Accrued income | 16,403 | 13,979 | +17.3% |
| Clearing broker receivable | 2,219 | 4,376 | -49.3% |
| Share issuance receivable | 159 | - | New |
| Capital return debtor | 251 | - | New |
The increase in purchases awaiting settlement exceeded that of sales awaiting settlement, and the cash balance simultaneously rose 51%, indicating that before period-end the fund simultaneously executed large-scale buying and selling, yet net cash still increased substantially (£44.5m → £67.3m). This may stem from:
- Actively reducing positions to meet large redemptions;
- Simultaneously rebalancing (e.g., withdrawing from markets such as the US/Sweden and rotating into Europe/Asia);
- Cash accumulation arising from changes in derivative collateral.
Among other creditors, the capital gains tax provision fell 15.4% (£1.60m → £1.35m), consistent with the overall market decline and reduced unrealized gains. Corporate tax payable declined slightly by 3.8%, in line with the direction of the tax changes.
11. Related Party Transactions: Contraction in Business with the Japanese Small-Cap Fund
Investment transactions between the fund and the Baillie Gifford Japanese Smaller Companies Fund declined significantly:
| Related Party Fund | Sales £'000 (2026) | Sales £'000 (2025) | Income £'000 (2026) | Income £'000 (2025) |
|---|---|---|---|---|
| Japanese Smaller Companies Fund C Acc | 3,374 | 6,176 | 456 | 519 |
Sales fell 45.4%, while income fell 12.1%. The income decline was far smaller than the sales decline, which may indicate that the remaining positions carry higher dividend yields, or that the reduced positions were low-dividend holdings. The ACD and its related parties' holding ratio remains 0.00%, maintaining independence.
12. Share Class Movements: Heavy Redemptions in Class B, Active Conversion Activity
The share class data reveal notable differences in investor behavior:
| Share Class | Opening | Issued | Cancelled | Converted | Closing | Net Change % |
|---|---|---|---|---|---|---|
| A Acc | 311,800 | 37,903 | (94,059) | (7,835) | 247,809 | -20.5% |
| B Acc | 204,910,036 | 68,997 | (41,748,896) | (87,086) | 163,143,051 | -20.4% |
| B Inc | 32,923,828 | 1,406,756 | (3,485,835) | +169,133 | 31,013,882 | -5.8% |
| C Acc | 82,186,068 | 618,020 | (13,864,007) | - | 68,940,081 | -16.1% |
| K Inc | 8,256,649 | 67,022 | (1,282,446) | (11,261) | 7,029,964 | -14.9% |
Cumulative Class B shares (Acc+Inc) fell by approximately 40.53 million shares, accounting for roughly 80% of total redemptions, indicating a significant pullback by institutional-grade investors in FY2025/26. The net conversion inflow into B Inc (+169,133) versus the net conversion outflow from B Acc (-87,086) suggests that some capital shifted from accumulation to income shares within Class B. C Acc also declined 16.1%, but with issuance of only 618k, the decrease came almost entirely from redemptions. The decline in total shares broadly tracked the 16.3% fall in total fund assets, though valuation changes must be considered to determine whether redemptions or market declines were the dominant driver.
13. Valuation Hierarchy: Level 1 Assets Shrank, Level 2 Liabilities Sharply Reduced
| Valuation Level | 2026 Assets £’000 | 2025 Assets £’000 | Change | 2026 Liabilities £’000 | 2025 Liabilities £’000 |
|---|---|---|---|---|---|
| Level 1 (Quoted) | 3,451,857 | 4,224,342 | -18.3% | - | - |
| Level 2 (Observable) | 738,548 | 780,045 | -5.3% | (4,863) | (13,857) |
| Level 3 (Unobservable) | - | - | - | - | - |
The decline in Level 1 assets far exceeded that in Level 2, indicating that the reduction in net assets was mainly driven by declines in the market value or reductions in the holdings of secondary-market listed equities, rather than valuation adjustments to illiquid assets. Level 2 liabilities (primarily OTC derivatives) fell sharply from £13.86m to £4.86m, a 64.9% decline, corroborating the reduction in derivatives exposure (see Section 15).
14. Currency Exposure: Cutting USD and SEK, Increasing KRW, and Expanding into New Markets
Non-monetary asset exposure shows a clear rebalancing across major currencies:
| Currency | 2026 Total Exposure £’000 | 2025 Total Exposure £’000 | Change |
|---|---|---|---|
| US Dollar | 926,044 | 1,446,118 | -36.0% |
| Swedish Krona | 142,888 | 219,264 | -34.8% |
| Japanese Yen | 387,657 | 458,525 | -15.5% |
| British Pound | 1,443,684 | 1,499,346 | -3.7% |
| Euro | 544,191 | 538,197 | +1.1% |
| South Korean Won | 69,556 | 31,247 | +122.6% |
| Canadian Dollar | 6,210 | 40,001 | -84.5% |
| Thai Baht | - | (20,726) | Closed |
| New Zealand Dollar | - | 20,036 | Closed |
| Paraguayan Guarani | 8,370 | - | New |
| Romanian Leu | 12,447 | - | New |
| Ugandan Shilling | 4,206 | - | New |
The sharp 36% reduction in US dollar exposure (approximately £520m) is consistent with the fund potentially trimming US-listed technology/consumer-related holdings; the steep decline in the Swedish krona and the exit from the Canadian dollar imply shrinking allocations to Nordic and North American markets. Conversely, the Korean won more than doubled (+£38m), and new exposures in niche markets such as Paraguay, Romania, and Uganda point to the fund's expansion into emerging markets and low-correlation regions. The liquidation of Thai baht, New Zealand dollar, and Kazakhstani tenge positions reflects obvious traces of "concentrated reallocation."
15. Derivatives Exposure: Counterparty Risk Halved, Collateral Structure Increasingly Bond-Oriented
Total derivatives credit exposure (aggregated by counterparty) fell from approximately £9.84m to £4.90m (-50.2%), while the number of counterparties remained at 12 (unchanged), but concentration rose significantly:
| Counterparty | 2026 Total Exposure £’000 | 2025 Total Exposure £’000 | Change |
|---|---|---|---|
| CitiGroup | 832 | 1,101 | -24.4% |
| Goldman Sachs | 1,197 | 3,220 | -62.8% |
| HSBC | 1,099 | 2,692 | -59.2% |
| Morgan Stanley | 532 | 284 | +87.3% |
| Barclays | 308 | - | New |
| Lloyds Bank | 237 | - | New |
| Royal Bank of Canada | (116) | - | Shifted to net collateral held |
| Deutsche Bank | - | 722 | Reduced to zero |
| UBS | 152 | 221 | -31.2% |
RBC's negative exposure (-£116k) means the fund holds collateral in excess of the counterparty risk exposure, i.e., the fund is in a net protected position. Total collateral fell from £17.63m to £11.00m, with HSBC's collateral (cash + bonds) declining from £14.70m to £6.85m, a drop of 53.4%. Notably, bond collateral still dominates HSBC's total (£6.85m), while cash collateral is concentrated among mid-sized counterparties (e.g., Goldman Sachs cash £2.68m, JPMorgan cash £1.40m). The decline in derivatives demand is related to the fund lowering its hedge ratio or simplifying its derivatives portfolio, and also echoes the significant reduction in Level 2 liabilities.
Overall, this set of notes shows that the fund underwent active contraction and reallocation in FY2025/26: total assets fell by approximately 16%, institutional money in Class B withdrew on a large scale, USD and Swedish krona exposures were significantly reduced, while KRW and emerging-market currency exposures expanded; meanwhile, cash hoarding, derivative deleveraging, and a surge in unsettled trade volumes at year-end suggest the fund manager executed an intensive round of portfolio adjustment at the end of the fiscal year, in response to capital-flow changes and to reposition for medium- and long-term market opportunities.
Derivative Counterparty Risk Exposure: Concentration Deserves Attention
In the counterparty list for uncleared derivative transactions, State Street Bank is the largest single counterparty with an exposure of 1,060, well ahead of UBS (370 + 245 = 615) and Royal Bank of Canada (280). If the three are viewed as the same type of derivative exposure, State Street accounts for approximately 54% of the total, indicating a clear counterparty concentration risk. Although the text explains that futures and cleared swaps have had their exposure reduced to zero through margin and collateral, the counterparty exposure of non-cleared derivatives remains concentrated among a few large banks. Should a credit event occur, losses could arise.
| Counterparty | Exposure (£'000) | Notes |
|---|---|---|
| State Street Bank | 1,060 | Largest single counterparty |
| UBS | 615 | Also futures trades, offset by margin |
| Royal Bank of Canada | 280 | — |
Global Exposure: Leverage Usage Declined Significantly
The actual leverage level calculated under the Commitment Approach fell sharply: from 29.87% in 2025 to 21.91% in 2026, a decline of approximately 26.7%. Although still far from the 100% ceiling, this change indicates that the fund manager reduced the scale of derivative usage or adjusted netting/hedging arrangements over the past year. Given heightened market volatility in 2025–2026, moderate deleveraging helps reduce tail risk, but it may also imply that the fund has become more conservative in capturing structural opportunities.
| Metric | 2026 | 2025 |
|---|---|---|
| Maximum limit | 100.00% | 100.00% |
| Actual commitment exposure | 21.91% | 29.87% |
Distribution Table: Annual Dividends Generally Increased, But at an Uneven Pace
Comparing interim and final distribution data reveals a notable pattern: interim distributions (for the period ended July 31, 2025) mostly declined year-on-year, while final distributions (for the period ended January 31, 2026) rose sharply. Taking Class A Accumulation shares as an example, the interim fell from 4.00p to 3.83p, but the final rose from 5.52p to 7.51p, bringing the full-year total up 19.1%. This indicates that more of the fund's annual income was realized in the second half of the fiscal year; investors who focus only on a single distribution may easily misread the trend.
| Share Class | FY2026 Total (pence) | FY2025 Total (pence) | YoY Change |
|---|---|---|---|
| A Accumulation | 11.34 | 9.52 | +19.1% |
| A Income | 8.64 | 7.31 | +18.2% |
| B Accumulation | 28.97 | 25.96 | +11.6% |
| B Income | 17.49 | 15.95 | +9.7% |
| C Accumulation | 35.15 | 31.53 | +11.5% |
| C Income | 20.61 | 18.87 | +9.2% |
| K Income | 23.05 | 21.02 | +9.7% |
K Income shares distribute only at year-end; the 2026 distribution of 23.05p was 9.7% higher year-on-year, indicating that the newly added K-class shares are designed to pay a single annual dividend rather than twice a year. This may affect the cash-flow planning of different investors.
New Fund Risk and Reward Indicator: Formatting Error Renders Information Invalid
In the risk and reward indicator table of the Baillie Gifford Responsible Global Equity Income Fund, there is an obvious formatting error: “1 4 2 3 5 6 7” is not monotonically increasing, making it impossible to determine which risk category the fund actually falls into. Although the accompanying text explains that the fund is classified as higher risk because it invests in company equities, investors cannot accurately read the risk rating from the chart. Such disclosure errors reduce the professionalism of the annual report and should be viewed as an editorial quality-control defect.
“Net Zero” Commitment in Investment Policy: Flexibility Over Constraint
The fund has committed to achieving net-zero greenhouse gas emissions in its portfolio “by 2050 or earlier,” but the specific pathway, interim milestones, and measurement criteria have not been disclosed. Similar to ESG screening, such long-term goals are more directional statements; actual investment decisions remain at the discretion of the Investment Adviser. Compared with hard exclusion rules, the credibility of a net-zero commitment relies on continuous monitoring and reporting, yet the annual report provides no carbon-intensity or emissions-reduction progress data.
Past Performance: Data Interpretation Requires Caution
The five-year return data in the chart can be understood approximately as follows: the fund's annual return series is 24.3%, 13.8%, 10.4%, 10.8%, 0.8%; the MSCI ACWI index is 16.4%, 12.3%, 11.4%, 2.9%, -1.6%. If this reading is correct, the fund outperformed the index in most years over the medium term, but significantly underperformed in 2023–2024 (10.4% vs 11.4%). In the most recent fiscal year (2025–2026), the fund recorded only a 0.8% return, better than the index's -1.6%, but the absolute return is very low and unimpressive relative to the “income growth” objective. The past performance range, from -1.6% to 24.3%, is highly volatile, reminding investors that the drawdown risk of this type of equity fund should not be underestimated.
Meanwhile, the report text notes that “AI developments across multiple industries” pose a challenge to the investment style, which echoes the fund's low 0.8% return. But an important question arises: if AI is the main headwind, why did the fund still manage a modest positive return? It is possible that some holdings benefited from AI, or that defensive sectors provided support. The report provides no attribution analysis, leaving investors unable to verify.
The “Scissors Gap” Between Valuation and Earnings: 16% De-rating vs 10% Earnings Growth
The most noteworthy data point in this report is not the apparent gap between -1.6% and 10.8%, but rather the severe divergence between valuation and earnings trends implied in the performance attribution. Over the past 12 months, the fund's holdings as a whole experienced a 16% valuation contraction (derating), while the earnings of its portfolio companies grew by 10% over the same period. This means that, had valuations remained unchanged, the fund's net asset value return would have been close to +10% or so. The actual return was -1.6%, indicating that the valuation contraction dragged returns down by approximately 11.6 percentage points (after adjusting for currency and other factors). This combination of “improving fundamentals but abandoned valuation” is typical of a market style shift — capital moving from high-quality compounders to momentum and thematic stocks.
| Driver | Past 12-Month Contribution | Five-Year Annualized (as of Jan 2026) |
|---|---|---|
| Earnings growth (EPS) | +10% | 8% (dividend growth) |
| Valuation change (PE re-rating) | -16% | — |
| Total shareholder return (B shares, GBP) | -1.6% | +7.4% |
This data has reference value for long-term investors: equity returns are ultimately driven by earnings. Over a five-year horizon, the annualized capital return of B Income Shares was 5.1%, while income growth annualized at 5.4% — capital returns and income growth moved almost in lockstep. This confirms the fund's core logic of “using income growth to drive capital appreciation”: over the long term, share prices fluctuate around the income-growth trend; over the short term, they are dominated by investor sentiment.
Yield Premium's “Hidden Safety Cushion”: 2.2% vs 1.8% — A Close Call
The fund's five-year annualized yield of 2.2% is slightly ahead of the target benchmark's 1.8%. Although the gap is only 40 basis points, considering that the fund's holdings are concentrated in technology (TSMC, Apple, Microsoft) and industrials (Atlas Copco, Watsco), the fact that its yield can surpass the MSCI ACWI index — a whole-market sample — shows that the portfolio has achieved a reasonable balance between yield and growth. More notably, this yield is measured at the period end using historical rolling averages and does not include the compounding effect of income reinvestment. If the 5.4% annualized income growth rate is included, with a starting yield of 2.2% and rolling five-year accumulation, the total return potential from the fund's income side approaches 13-14% (current yield + income growth), far exceeding the 5.1% capital return — income compounding is the “hidden engine” of this strategy's long-term appreciation.
Changes and Continuities in Portfolio Structure: AI Infrastructure Allocation Rose Significantly
Comparing the country allocation changes between the current period and the prior period (percentages in parentheses) reveals several directional shifts:

Revenue and market share data for Dell, HPE, Inspur, Supermicro and other vendors
| Country/Region | Jan 2026 Weight | Jan 2025 Weight | Change (pp) | Interpretation |
|---|---|---|---|---|
| United States | 42.64% | 41.25% | +1.39 | Increased Alphabet, Jack Henry; reduced Watsco |
| Taiwan | 6.62% | 5.36% | +1.26 | Added Mediatek |
| Germany | 2.82% | 5.13% | -2.31 | Reduced Deutsche Boerse and SAP (but SAP remains a holding) |
| Netherlands | 0.94% | 2.97% | -2.03 | Reduced Wolters Kluwer |
| Denmark | 3.19% | 4.84% | -1.65 | Reduced Novo Nordisk and Coloplast |
| France | 5.67% | 6.17% | -0.50 | Slightly reduced |
| Ireland | 2.19% | 0.00% | +2.19 | Initiated Accenture |
Overall, the portfolio has tilted geographically toward the US and Asia while cutting core European holdings. This is not a simple regional rotation but a structural adjustment centered on the main theme of AI computing and digital infrastructure: TSMC's market value weight rose from approximately 5.3% a year ago to 5.84% (and is now the largest holding); Mediatek and Alphabet were added; and the position in Accenture was strengthened — the three respectively represent AI chip foundry, AI models and application ecosystems, and IT services for enterprise AI transformation. This operation is highly consistent with the diffusion of the AI narrative triggered by DeepSeek in 2025: shifting from “only US tech giants benefit” to “global division-of-labor players on the AI computing supply chain.”
Implications of Trading Logic: Discipline in Strategy, Seen from the Cognex Exit
The most informative trade this period was not a new position but the liquidation of Cognex. The report notes that despite Cognex management's heavy investment in software upgrades, embedded machine learning, and a direct-sales model, research showed that “competitive intensification outpaced expectations,” and long-term growth and margin expectations were revised down. This reveals the fund's core discipline in position management: it does not mechanically wait for mean reversion, but makes exit decisions based on shifts in the fundamental quadrant. By contrast, the choice regarding Novo Nordisk was to “maintain the position” — it was retained despite strong competition and commercialization challenges, because of its long-term moat in the metabolic-disease therapy market. Two diametrically opposite decisions in the same period precisely reflect the subdivision within the quality factor: whether the moat has been eroded is a more important judgment criterion than share-price volatility.
Conclusion: A “Disappointing but Explainable” Annual Report
From a data perspective, the fund's performance in the fiscal year ending January 2026 was indeed unimpressive, but a breakdown shows the root cause is not fundamental deterioration, but rather a cyclical deviation of the market from the “quality compounding” style. The combination of 10% earnings growth and 8% dividend growth, after experiencing a 16% valuation contraction, still maintained a five-year compound return of 7.4%, indicating that the earnings quality of the held companies is solid. The current five-year average yield of 2.2%, combined with income growth of more than 8% on the growth side, provides a relatively favorable starting point for the next year. However, a key concern is that the valuation-dependent holdings in the top ten positions (such as TSMC, Partners Group, and Watsco) account for approximately 32% of the portfolio (total of the top ten). If global risk appetite continues to favor momentum stocks, the fund may still face valuation pressure in the near term.
Portfolio Tail Holdings: Quality and Concentration
At the tail of the portfolio, two global giants — Microsoft (3.52%) and Procter & Gamble (3.36%) — hold the highest weights, totaling approximately 6.88%, indicating that while maintaining diversification, the fund still has a notable preference for high-quality cash-flow-generative assets. By industry, technology (Microsoft, Texas Instruments), consumer staples (PepsiCo, P&G, Starbucks), healthcare (Medtronic, Zoetis), and industrial distribution (Watsco) form the main sectors in the tail. Watsco's 2.67% weight is particularly noteworthy — the company is the leading HVAC/R distributor in North America, with stable cash flow and consecutive dividend increases, fitting the income theme.
| Company | Market Value (£'000) | % of Net Assets |
|---|---|---|
| Microsoft | 37,907 | 3.52 |
| Procter & Gamble | 36,128 | 3.36 |
| Watsco Inc | 28,687 | 2.67 |
| PepsiCo | 27,111 | 2.52 |
| Jack Henry & Associates | 23,204 | 2.16 |
| Medtronic | 15,801 | 1.47 |
| Starbucks Corp | 13,240 | 1.23 |
| Texas Instruments | 12,323 | 1.14 |
| T. Rowe Price | 12,205 | 1.13 |
| MSCI | 11,212 | 1.04 |
| Paychex | 8,331 | 0.77 |
| Zoetis Inc | 6,081 | 0.56 |
| Total | 232,230 | 21.55 |
These 12 stocks together contribute approximately 21.55% of the portfolio's weight, with an average weight of only 1.80%, making the portfolio relatively diversified. At the same time, the total “Portfolio of investments” was £1,077,339 thousand, representing 100.15% of net assets, meaning the fund was almost fully invested.
Share Class Structure and Fee Sensitivity
The comparison table clearly illustrates the erosion effect of fee rates on long-term performance. Taking B Accumulation (fee rate 0.53%) and C Accumulation (fee rate 0.03%) as examples, despite holding the same underlying assets, the three-year cumulative return difference is significant:
| Share Class | Ongoing Charge | 2026 Return | 2025 Return | 2024 Return | Three-Year Cumulative Return |
|---|---|---|---|---|---|
| C Accumulation | 0.03% | -0.63% | 11.74% | 10.23% | 22.39% |
| J Accumulation | 0.38% | -0.99% | 11.35% | 9.84% | 20.97% |
| P Accumulation | 0.48% | -1.08% | 11.23% | 9.73% | 20.63% |
| B Accumulation | 0.53% | -1.13% | 11.18% | 9.67% | 20.55% |
C Accumulation, with its mere 0.03% fee rate, outperformed B Accumulation by approximately 1.84 percentage points over three years, or about 0.60 percentage points annualized, broadly consistent with the fee differential (0.50%). This again confirms that in a low-return environment, fees are a key lever in determining net returns.
At the same time, all share classes posted negative returns in FY2026, reflecting the broad global equity market pullback in that year. Yet dividends still grew, indicating that the decline was driven by falling prices rather than deteriorating earnings.
Fund Flows: Divergence Amid the Redemption Wave
In FY2026, most share classes experienced significant shrinkage and share redemptions. B Income shares saw the sharpest redemptions (share count down 33.5%), and C Accumulation also fell 33.1%, possibly reflecting income-oriented investors adjusting their portfolios. J Income shares, however, bucked the trend with a 106.2% increase, from 3.30 million shares to 6.81 million shares, possibly reflecting increased allocation through specific platforms or financial advisers.
| Share Class | Opening Shares ('000) | Closing Shares ('000) | Change |
|---|---|---|---|
| B Accumulation | 97,114 | 75,340 | -22.4% |
| B Income | 102,747 | 68,344 | -33.5% |
| C Accumulation | 14,275 | 9,552 | -33.1% |
| C Income | 68,684 | 66,488 | -3.2% |
| J Accumulation | 11,880 | 11,659 | -1.9% |
| J Income | 3,305 | 6,815 | +106.2% |
Meanwhile, the fund's total net assets fell from the prior year's level to £1.076 billion at the period end. Although redemptions were sizable, portfolio liquidity was not impaired — all holdings are listed securities and can be liquidated at any time. P-class shares consist of only 750 shares, worth approximately £1-2 thousand, representing “legacy” seed shares that do not constitute actual fund flows.
Dividend Growth Continued, But Pace Slowed
The table data confirms the fund's commitment as an income product: dividends per share rose for three consecutive years across all share classes. Taking B Accumulation as an example, the dividend rose from 3.86p in 2024 to 4.67p in 2026, a cumulative increase of 21.0%. However, the annual growth rate fell from 11.1% in 2025 to 8.9% in 2026, reflecting a moderate slowdown in dividend growth, consistent with global corporate earnings growth returning to normal.
| Share Class | 2024 Dividend (pence) | 2025 Dividend (pence) | 2026 Dividend (pence) | 2026 YoY Growth |
|---|---|---|---|---|
| B Accumulation | 3.86 | 4.29 | 4.67 | +8.9% |
| C Accumulation | 3.96 | 4.41 | 4.84 | +9.8% |
| J Accumulation | 3.89 | 4.33 | 4.71 | +8.8% |
| W6 Accumulation | 3.86 | 4.29 | 4.68 | +9.1% |
What is particularly noteworthy is that even though total return was negative in FY2026, dividends still grew, indicating that the fund has sufficient retained earnings or dividend cash flow to support distributions, reflecting the management discipline of “income first.”
Leverage and Cash Levels: A More Conservative Balance Sheet
“Net other liabilities” narrowed from -1.40% in 2025 to -0.15%, a reduction of approximately 90% in net liabilities/payables. This means that at year-end the fund had invested nearly all of its assets in equities, while compressing unrecognized liabilities to an extremely low level. It is possible that the fund manager actively reduced leverage during the market pullback, or that redemption proceeds were used to liquidate some equities, thereby improving the net exposure.
This change also implies that the management team adopted a defensive posture during the 2025–2026 market volatility. Combined with the fact that the portfolio is dominated by low-volatility, high-dividend US blue-chip stocks, the fund's overall risk exposure is relatively manageable.
Summary
This set of data reveals three core signals: first, the tail holdings remain high-quality and diversified, with core assets such as Microsoft and P&G providing an earnings foundation; second, fee differences are magnified in low-return years, so long-term investors should prioritize lower-fee share classes; third, despite net redemptions and market declines, the fund maintained income certainty and financial health through stable dividends and deleveraging. The remaining comparative tables and portfolio notes that follow are expected to provide more information on performance attribution and risk management.
Deconstructing Three Years of W6 Income Shares Performance
W6 Income Shares is a key share class for observing the fund's long-term NAV behavior. FY2026 returns turned negative (-1.01%), a stark contrast to the +11.29% in FY2025. Notably, however, the two positive years of 2024 and 2025 together only recovered most of the prior valuation pullback, while the single capital reversal in 2026 nearly erased all of the cumulative gains.
| Metric | FY2026 | FY2025 | FY2024 |
|---|---|---|---|
| Opening NAV (pence) | 175.66 | 161.25 | 150.11 |
| Closing NAV (pence) | 169.85 | 175.66 | 161.25 |
| Return (incl. fees) | -1.01% | +11.29% | +9.74% |
| Distribution (pence/share) | 4.04 | 3.79 | 3.48 |
| Three-year price range (pence) | 148.9 – 203.7 | 161.9 – 203.3 | 147.5 – 184.1 |
| Closing net assets (£m) | 504.0 | 522.6 | 474.7 |
The divergence between the price range and NAV sends an important signal: the 2026 high of 203.7p was approximately 19.9% above the closing NAV of 169.85p, while the low of 148.9p traded at a discount of approximately 12.3% to NAV. This spread shows that investor sentiment toward buying and selling this income share fluctuated far more than the fundamental NAV change — premium-priced buying demand remained fairly strong early in the year, but market sentiment had cooled markedly by year-end. The core appeal of an income fund should lie in distribution stability rather than capital appreciation, yet the magnitude of price swings still reflects market sensitivity to interest-rate expectations.
Triple Attribution of Net Asset Changes
Looking at the fund as a whole, net assets fell from £1.2206 billion at the beginning to £1.0757 billion at the end, a decline of 11.9% that looks heavy. But breaking down the components shows that market investment losses contributed less than one-third of the decline; shareholder redemptions were the dominant force behind the contraction.
| Driver | Amount (£'000) | % of Opening NAV |
|---|---|---|
| Opening net assets | 1,220,639 | 100.00% |
| Net subscriptions/redemptions | -112,419 | -9.21% |
| Net change from investment activities | -41,009 | -3.36% |
| Retained distributions (accumulation shares) | +8,307 | +0.68% |
| Dilution adjustment | +182 | +0.01% |
| Closing net assets | 1,075,700 | -11.90% |
Net redemptions of £112.4 million were 2.7 times the investment loss of £41 million, indicating that the main pressure facing the fund in FY2026 was not portfolio mismanagement, but rather a decline in holders' willingness to reinvest distributions or capital-reallocation needs. Notably, in FY2025 the fund still attracted £134.3 million in subscriptions, while in 2026 subscriptions halved to £59.19 million; meanwhile, redemptions rose from £106.5 million to £171.6 million. The contraction is self-reinforcing: NAV declines erode the earnings base, which in turn affects investor confidence, creating a negative feedback loop of redemptions and selling.
Income Resilience: The Real Moat
Despite significant pressure on the capital side, the fund's fundamental income did not deteriorate; rather, it showed counter-cyclical resilience. Total income in 2026 was £30.728 million, up 4.2% from the prior year, of which overseas dividends contributed approximately 90%, rising from £27.12 million to £27.62 million. Fee control also improved: total expenses fell from £42.48 million to £40.82 million, a decline of 3.9%, while net income after tax rose 6.6% to £23.406 million.
| Item | FY2026 (£'000) | FY2025 (£'000) | YoY Change |
|---|---|---|---|
| Total income | 30,728 | 29,477 | +4.2% |
| Total expenses | -4,082 | -4,248 | -3.9% |
| Net income after tax | 23,406 | 21,958 | +6.6% |
| Net capital gains/losses | -36,924 | +103,632 | Swung from profit to loss |
| Total distributions | 27,491 | 26,229 | +4.8% |
| Closing net assets | 1,075,700 | 1,220,639 | -11.9% |
Total distributions of £27.49 million exceeded net income after tax of £23.406 million — this is not “paying dividends from principal,” but rather because the fund bore expenses such as management and custody fees of £4.082 million on the capital side. Adding expenses back to income, distributable income was £27.488 million, almost exactly matching total distributions. This means the fund maintained a strict “full income coverage” principle: every penny of distribution was backed by corresponding operating cash flow, and capital losses were not used to subsidize dividend payments. From a dividend-quality perspective, this distribution structure is sustainable; but from a total-return perspective, capital losses mean investors' actual losses exceeded the book NAV decline, because they also bear the erosion of net asset value from the capitalization of expenses.
Hidden Signals in Tax Costs
The tax disclosure reveals a hidden burden unique to income funds. Overseas dividend withholding tax of £2.8 million remains the largest tax outflow, accounting for 10.1% of overseas dividend income, slightly improved from 10.5% in the prior year, but the absolute amount is still considerable. The following data are worth investors' consideration:
| Tax Item | FY2026 (£'000) | FY2025 (£'000) |
|---|---|---|
| Overseas dividend withholding tax | 2,800 | 2,848 |
| Prior-year tax reclaim write-offs | 464 | 423 |
| Recoverable overseas dividend tax | -24 | — |
| Total tax | 3,240 | 3,271 |
The “prior-year tax reclaim write-offs” have exceeded £420,000 for two consecutive years, suggesting that some foreign tax authority reclaim applications were unsuccessful or voided. The fund's unrecognized deferred tax asset (excess management fees) rose from £11.249 million to £14.425 million, an increase of 28.2%. At a 20% corporate tax rate, this corresponds to approximately £2.885 million of potential future tax deductions, but the asset has not been recognized because the fund expects future taxable income will not exceed deductible expenses. These excess expenses are essentially “tax losses” accumulated by the fund; if the market recovers and generates taxable income, they will become real value — but this is an unpredictable option value and should not be included in current NAV.
Trading Costs and Market Microstructure
The trading data demonstrate the fund's discipline under stress. Total direct trading costs were only £286,000, representing 0.02% of average NAV, unchanged from the prior year. Notably, sell-side trading costs (£164,000) were higher than buy-side costs (£122,000), because in 2026 the fund was forced to sell on a large scale to meet redemptions — total sales rose sharply from £172 million to £272 million, an increase of 58.3%.
| Trading Metric | FY2026 | FY2025 |
|---|---|---|
| Total purchases (incl. costs, £'000) | 183,412 | 187,263 |
| Total sales (net, £'000) | 272,146 | 171,892 |
| Direct trading costs as % of NAV | 0.02% | 0.02% |
| Average portfolio bid-ask spread | 0.11% | 0.12% |
| Sell-side taxes as % of sales principal | 0.03% | 0.02% |
The average portfolio bid-ask spread narrowed from 0.12% to 0.11%, indicating a slight improvement in market liquidity, but this occurred against the backdrop of the fund being forced to reduce positions, so there is an element of “passively providing liquidity.” More notably, the sell-side tax rate was 0.03%, higher than the buy-side rate of 0.03% (0.02% in 2025), consistent with the fact that UK stamp duty does not apply to share sales, while some overseas markets have relatively high sell-side taxes. Overall turnover was approximately 40%, not aggressive for an income-oriented global equity fund, but in 2026 purchases were far below sales; the fund was effectively in net contraction rather than active rebalancing.
A Closer Look at Distribution Rhythm: Seasonality and Profit Sources
The quarterly distribution data reveal the dividend seasonality of the fund's portfolio companies:
| Quarter | FY2026 (£'000) | FY2025 (£'000) |
|---|---|---|
| Period ended April 30 | 5,865 | 5,774 |
| Period ended July 31 | 5,947 | 5,764 |
| Period ended October 31 | 5,643 | 5,776 |
| Period ended January 31 (year-end) | 9,198 | 8,923 |
The year-end quarter distribution (January) far exceeded the first three quarters, coming in about 57% above the quarterly average, reflecting that a large number of companies in the portfolio — particularly UK and some European companies — concentrate their dividend payments at the fiscal year-end. Distributions in the first three quarters were broadly flat or slightly higher than in 2025, indicating that the operating cash flows of most portfolio companies did not deteriorate because of market volatility. A stable and gradually rising dividend stream is the most critical positive evidence for assessing the quality of the fund's holdings.
Concluding Observations
FY2026 was a classic separation of “victory on the income side, defeat on the capital side.” The fund's dividend-generating capacity, expense control, trading-cost discipline, and distribution coverage all remained sound, but the negative feedback loop between falling NAV and heavy redemptions may extend into the next fiscal year. Looking at the three years as a whole, W6 Income Shares' cumulative return (closing NAV 169.85 / opening 150.11) was approximately +13.2% over three years, annualized at about 4.2%; adding cumulative distributions of 11.31p, the total return was approximately 20.7%, annualized at about 6.5%. For a fund whose core objective is income, this is barely adequate, but it remains distant from the high-growth trajectory once shown in 2025. The key going forward is whether the fund manager can rebuild positions at lower prices after forced selling, using the 2026 valuation pressure to form a position base for a rebound.
Contradictory Signals in Liquidity Allocation and the Structure of Fund Flows
1. The “Duality” of Cash Management: Higher Book Cash ≠ Improved Liquidity
Cash and bank balances rose from £1.186 million in 2025 to £3.419 million, an increase of 188%, but over the same period bank overdrafts only narrowed from £5.505 million to £2.873 million. After netting the two, the net cash position was still negative (-£2.873m → the net overdraft improved to +£0.546m). This structure of “cash and overdraft coexisting” indicates that the fund was not actively increasing cash, but rather using overdraft facilities as a liquidity buffer to fund daily redemption payments. The rise in the period-end cash balance is more likely due to funds that had not yet been reinvested after the peak of redemptions had passed — consistent with “payables for share cancellations” jumping from £452,000 to £3.606 million (a 7.98-fold increase): a large number of redemptions had been executed, but settlement payments had not yet been fully disbursed.
| Item | 2026 (£'000) | 2025 (£'000) | YoY Change |
|---|---|---|---|
| Sterling bank accounts (positive balance) | 6,292 | 6,691 | -6.0% |
| Sterling bank overdrawn | (2,873) | (5,505) | +47.8% (overdraft reduced) |
| Net cash position | 3,419 | 1,186 | +188.3% |
| Payables for share cancellations | 3,606 | 452 | +697.8% |
This combination suggests that at the report date, the fund was in the winding-down phase of redemption settlement, rather than increasing cash because it was bullish on the market. The manager may have chosen to hold cash first to meet unsettled redemption instructions, and then redeploy once settlement is complete.
2. The “Polarization” of Share Changes: Income Classes Attract, Accumulation Classes Bleed
The share reconciliation table reveals an important trend: in almost all categories, Income shares experienced far smaller net redemptions than Accumulation shares, and a few categories even saw net inflows.
| Share Class | Opening → Closing Change | Notes |
|---|---|---|
| B Accumulation | 97.1m → 75.3m (-22.4%) | Largest net outflow |
| B Income | 102.7m → 68.3m (-33.5%) | Deeper outflow |
| C Accumulation | 14.3m → 9.6m (-33.1%) | Significant outflow |
| C Income | 68.7m → 66.5m (-3.2%) | Relatively resilient |
| J Accumulation | 11.9m → 11.7m (-1.9%) | Relatively stable |
| J Income | 3.3m → 6.8m (+106.1%) | Only large net increase |
| W6 Accumulation | 68.2m → 67.0m (-1.7%) | Essentially flat |
| W6 Income | 297.5m → 296.7m (-0.3%) | Almost completely stable |
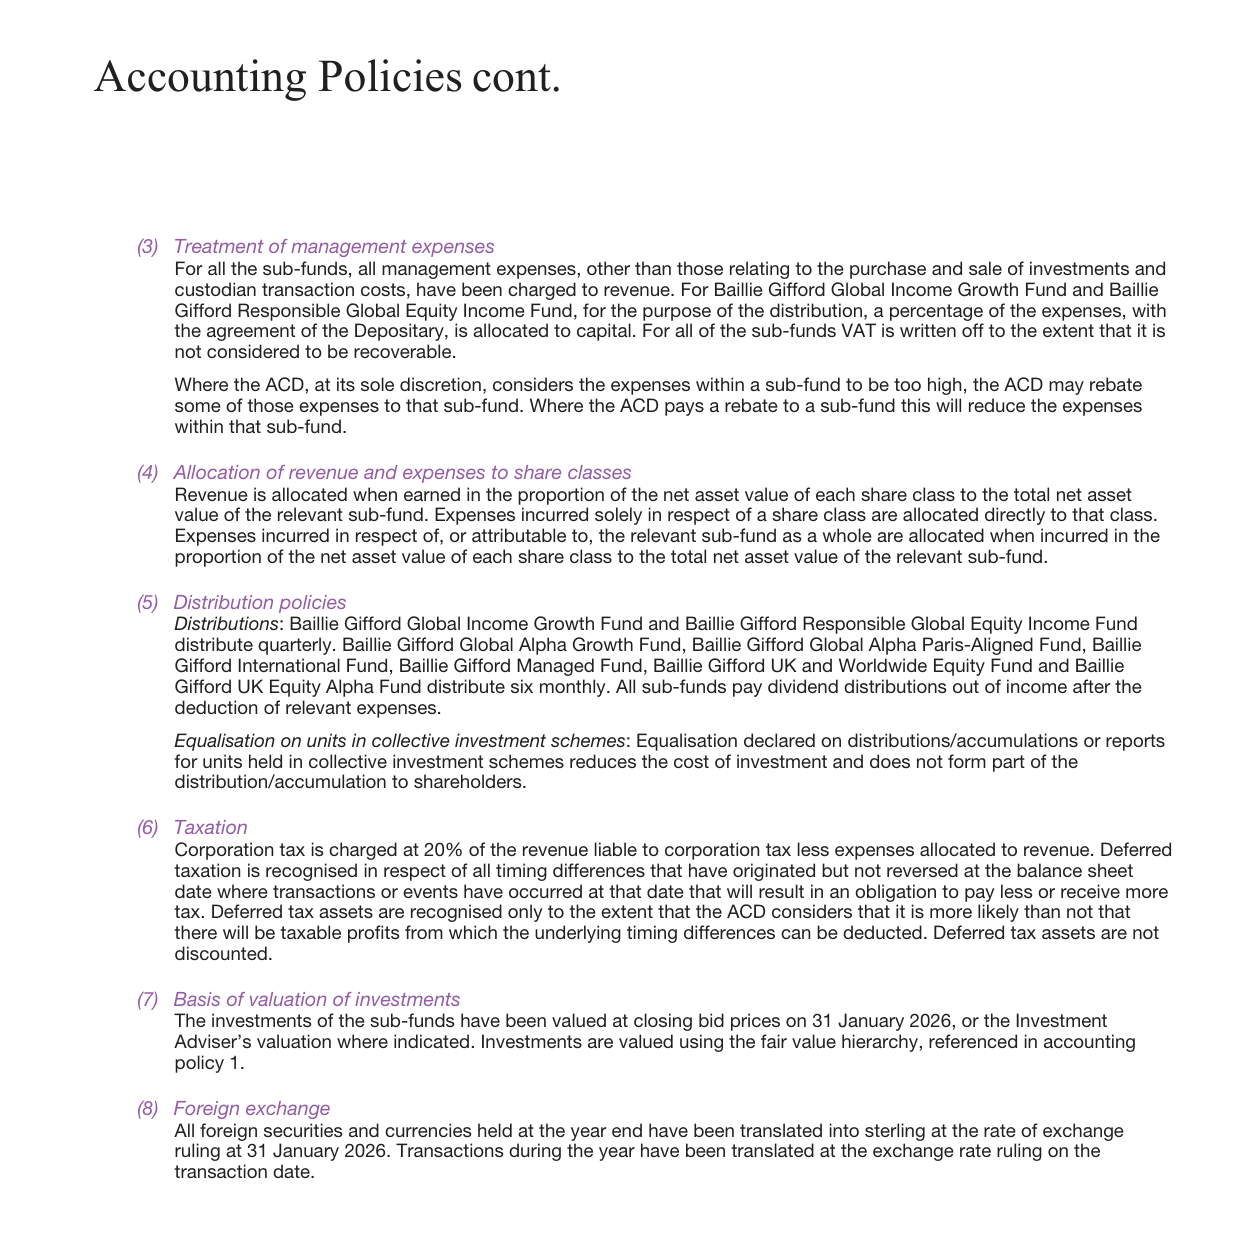
Global Ethernet switch market size growing from approximately $28 billion in 2019 to $45 billion in 2027E
J Income shares bucked the trend and doubled (+3.50 million shares), and combined with the “Shares converted” line showing J Inc conversions in (+57,465) and J Acc conversions out (-52,188), this clearly demonstrates investors shifting from accumulation to income classes. This structural change reflects the market environment: when the fund's NAV is at a relatively high level and investors' expectations for future capital appreciation weaken, income shares (even with dividend growth of only about 7%) become a more attractive holding method — investors prefer to lock in current cash flow rather than continue to accumulate.
Even more notable is that B Income's net redemptions (-33.5%) were far larger than J Income's net inflows (+106.1%), suggesting that retail clients overall were withdrawing, while shares sold through specific platform channels (J-class and W6-class) continued to retain investors.
3. Decline in Related-Party Holdings: The Signal Value of Insider Behavior
The ACD and related parties' holdings as a percentage of the fund's NAV fell from 0.79% to 0.49%, a decline of 38%. If the fund's total assets shrinking from £1,204m to £1,077m (-10.5%) is a natural contraction in scale, the larger decline in related-party ownership implies that Baillie Gifford itself has also been reducing its holding in the fund — contrary to the positive signal of “the manager continuing to back the fund with real money.” This is a warning-worthy insider-behavior indicator. Combined with the fact that C-class shares saw zero subscriptions at the period end (Group 2 equalisation of 0), the tendency for both internal and external capital to exit is fairly clear.
4. Regional Rotation in Currency Exposure: Reducing Europe, Adding Asia-Pacific
The fund's currency exposure underwent a notable regional rebalancing over the year:
| Currency | 2026 (£'000) | 2025 (£'000) | Change | Weight (2026) |
|---|---|---|---|---|
| USD | 482,264 | 503,554 | -4.2% | 44.8% |
| EUR | 143,889 | 212,664 | -32.3% | 13.4% |
| CHF | 80,892 | 96,149 | -15.9% | 7.5% |
| TWD | 71,200 | 65,447 | +8.8% | 6.6% |
| SEK | 60,773 | 50,869 | +19.5% | 5.6% |
| DKK | 34,325 | 59,012 | -41.8% | 3.2% |
| BRL | 25,500 | 12,985 | +96.5% | 2.4% |
| JPY | 22,237 | 10,733 | +107.2% | 2.1% |
| AUD | 15,952 | 27,036 | -41.0% | 1.5% |
| GBP (non-currency component) | 43,170 | 66,532 | -35.1% | — |
The fund clearly reduced exposure to European developed markets (euro area, Denmark, Switzerland, Australia) while significantly increasing Brazilian, Japanese, Swedish, and New Taiwan dollar assets. Combined with the earlier point that all currency exposure is non-monetary (equity holdings), these changes reflect the fund manager's judgment on regional valuation differences. Euro plus Danish krone reduction totaled approximately £93.5m, while Brazil plus Japan additions were only about £24m, resulting in a net reduction of approximately £70m — this corresponds to a major portion of the fund's total size decline of about £126m, indicating that redemption pressure was met mainly by selling European holdings with better liquidity.
5. Structural Improvement in Distribution Capacity: Winners Across the Four Major Categories
Summing the full-year distributions across four reporting periods, each share class's cumulative annual distribution rose from the prior fiscal year:
| Class | FY2025 Full Year (p/share) | FY2026 Full Year (p/share) | YoY Increase |
|---|---|---|---|
| B Accumulation | 4.29 | 4.67 | +8.9% |
| B Income | 3.78 | 4.04 | +6.9% |
| C Accumulation | 4.41 | 4.84 | +9.8% |
| C Income | 3.90 | 4.17 | +6.9% |
| J Accumulation | 4.35 | 4.70 | +8.0% |
| J Income | 3.78 | 4.04 | +6.9% |
| P Accumulation | 4.33 | 4.75 | +9.7% |
| P Income | 3.83 | 4.09 | +6.8% |
| W6 Accumulation | 4.29 | 4.68 | +9.1% |
| W6 Income | 3.78 | 4.04 | +6.9% |
Accumulation classes saw notably higher distribution growth (~+9%) than Income classes (~+7%), because accumulation shares reinvest distributions into the fund, pushing up the per-unit NAV base and creating a “snowball” effect. This data forms a subtle contrast with the earlier observation of “investors shifting from Accumulation to Income”: investors are voluntarily giving up the very share classes with higher distribution growth, suggesting their decisions are driven more by cash-flow needs than by return maximization.
The four quarterly distributions themselves improved sequentially: B Accumulation went from 0.98p on 30.04.25 to 1.00p on 31.07.25 to 1.00p on 31.10.25 to 1.69p on 31.01.26, with the final distribution accounting for 36.2% of the full-year total. Compared with the prior year's structure (1.47/4.29 = 34.3%), the year-end distribution concentration was higher, possibly benefiting from special dividends from some companies or realized currency gains in the fourth quarter.
6. Guarantees and Limitations of Valuation Purity
All £1,077m of assets are valued at Level 1 quoted prices, with Level 2/3 at zero. On the one hand, this structure ensures objectivity and verifiability of valuations; on the other hand, it also means the fund has no exposure whatsoever to excess returns from private markets or alternative assets. In a market environment of subdued IPO activity and wider valuation discounts for unlisted companies, a strategy of investing solely in listed equities both avoids the subjectivity risk of Level 3 valuations and may miss discount opportunities in private markets.
Combined with the overall picture of related-party reductions and net share outflows, these financial statements depict a fund that is in a contraction phase but still has solid distribution capacity: assets shrank by about 10%, distributions grew against the trend, investors are voting with their feet for income shares, and the manager is expressing a view on future regional rotation through position adjustments (reducing Europe, adding Asia-Pacific).
In the fund distribution data presented in the sequel, the `Equalisation` mechanism once again becomes key to understanding the Group 1 / Group 2 distribution differences. Compared with the distribution differences caused purely by subscription timing discussed earlier, this data further reveals operational divergence among different funds in handling accrued income differences: some funds fully cover the net revenue shortfall of newly issued shares with a high proportion of equalisation, while others do not use equalisation at all. The Group 2 distribution structures of representative funds are compared below:
| Fund Share | Net Revenue | Equalisation | Total Distribution | Equalisation Ratio |
|---|---|---|---|---|
| J Accumulation Group 2 | 1.39460 | 0.30540 | 1.70000 | 17.96% |
| J Income Group 2 | 1.13896 | 0.33104 | 1.47000 | 22.52% |
| P Accumulation Group 2 | 1.70000 | 0 | 1.70000 | 0% |
| P Income Group 2 | 1.46000 | 0 | 1.46000 | 0% |
| W6 Accumulation Group 2 | 1.26675 | 0.42325 | 1.69000 | 25.04% |
| W6 Income Group 2 | 1.07954 | 0.38046 | 1.46000 | 26.06% |
The observation shows that in the January 2026 distribution, P-class funds had Group 2 and Group 1 figures exactly the same, with no equalisation item at all. This usually means that such shares were subscribed at a price including income, or the fund company has applied a different accounting treatment to these classes. J-class and W6-class, by contrast, explicitly present equalisation, and W6's equalisation ratio is higher, indicating that a larger portion of unrealized income exists in its newly issued shares; accordingly, a considerable part of the “distribution” investors actually receive is in the nature of principal repayment. When comparing the dividend quality of different funds, investors need to pay special attention to this structural difference — a high equalisation ratio may dilute the true dividend yield.
Entering the annual report of the Baillie Gifford UK and Worldwide Equity Fund. The fund's core numbers deserve close attention, as they provide a textbook case of "target-setting badly disconnected from market reality." The fund's investment objective is to outperform, after costs, a synthetic index composed of 60% UK equities and 40% overseas equities by at least 1% per annum over a rolling five-year period. However, in the year ended 31 January 2026, the B Accumulation share class returned 8.1%, while the index returned 19.5% and the target return (index + 1%) was 20.7% — a shortfall of 12.6 percentage points. The longer five-year picture is equally bleak: annualised return of 3.4% versus 11.9% for the index and 13.0% for the target, meaning the fund lagged its target by nearly 10 percentage points per annum.
This performance gap is no accident; it is the product of a systematic mismatch between investment style and market environment. The report states explicitly that, in developed markets outside the US (Europe, UK, developed Asia), growth stocks experienced their second-worst annual performance since the bursting of the dot-com bubble. Meanwhile, the US market saw gains driven by a small number of high-growth stocks (the Mag7, AI leaders), and this narrow market leadership structure was highly unfavourable to a "quality growth" style. The fund's characteristics — actively managed, not index-tracking, with a preference for long-duration growth stocks — put it at a disadvantage in such a bifurcated market.
The ESG constraints in the investment policy also deserve attention. The fund commits to aligning its portfolio with the goal of achieving net zero greenhouse gas emissions by 2050 (or earlier), while adhering to the norms-based screening of the UN Global Compact. This means the investment universe is subject to additional restrictions, such as the possible exclusion of some opportunities in traditional energy and high-carbon industries. In the 2025–2026 market environment, which showed periodic preference for traditional value and energy stocks, these constraints became an additional drag on relative returns. The report also notes "Where possible, charges are taken from income. If insufficient, the rest will be taken from capital" — a hint that the fund may use capital to pay expenses, further pressuring net asset value.
Turning to contribution by holding, the positive contributors included DBS (benefiting from Asian wealth growth), Babcock International (higher defence spending), and Just Group (acquired by Brookfield). These cases show that there are still stock-picking bright spots in the portfolio, but individual highlights cannot offset the overall style headwind. Particularly noteworthy is that Just Group's acquisition price represented only a roughly 30% premium to its trailing twelve-month high share price — itself a signal that the market's valuation anchor for small- and mid-cap financial growth stocks sits at a low level.
Taken together, the fund offers a profound case study of the interaction among "target setting, strategy execution, and market cycles." The objective demands outperforming the index by more than 1% annually on a sustained basis, while the investment style inherently exhibits long-term mean-reversion characteristics. In years when growth style dominates (such as before 2021), the fund may beat its target; in years dominated by value and large-cap technology, it falls significantly behind. The report concludes by noting "periods of underperformance are inevitable given our active investment approach" — an implicit admission that a structural contradiction may exist between objective and reality: an actively managed, selective strategy cannot easily guarantee steady outperformance over any rolling five-year period against an index that includes the full market weight of US tech giants capitalised by market cap. For investors, it is more useful to focus not on short-term rankings but on whether the fund can restore excess returns in the next growth-style cycle. The current data do not yet support a decisive verdict.
1. Bunzl and The Trade Desk: The Mirror Logic of Contrarian Decisions
The Bunzl and The Trade Desk trades form a highly instructive contrast:
| Decision dimension | Bunzl (increased) | The Trade Desk (sold) |
|---|---|---|
| Triggering event | Profit warning caused a sharp share price drop | Generative AI poses a structural threat to the ad-tech segment |
| Core judgement | Transformation strategy is viable; short-term bad news does not change long-term value | High revenue growth cannot mask long-term erosion of the competitive moat |
| Valuation anchor | Traditional packaging distribution with predictable cash flows | High-multiple growth stock; valuation depends on long-term headroom |
| AI impact | Extremely low probability that the business is disrupted by AI | Ad-spend logic may be rebuilt by AI-native platforms |
The stock-picking framework revealed by these two trades is not simply "hold quality companies" — but a persistent question: does the company's moat remain intact through a technological paradigm shift? Bunzl's transformation story (supply-chain efficiency gains, category expansion) is an operational repair, not a threat to its survival base. The Trade Desk's core asset is ad-targeting capability from the third-party cookie era, while generative AI may directly change how advertising budgets are allocated, marginalising its independent DSP model. The fund made opposite decisions on the two, essentially distinguishing between "cyclical problems" and "structural problems."
2. The Transmission Path of AI Panic: From "Data Moat" to "Data Risk"
The report mentions that the AI narrative hit capital-light, high-margin data and classified-ad companies such as Auto Trader and Experian, and that Rightmove announced a £60 million investment to upgrade its technology infrastructure. This exposes a logic previously underestimated by the market: the threat of AI to data platforms comes not from computing power, but from substitution of the way information is accessed.
The traditional classified-ad moat lies in "user-generated content + search traffic gateway," but AI search and intelligent agents can aggregate information directly from multiple sources, bypassing the platform. This concern is directly reflected in portfolio changes:
| Relevant holding | Portfolio weight | Signal in response |
|---|---|---|
| Auto Trader | 1.14% | Still a top-ten holding; not reduced; but Carsales.com was bought in the same period to diversify geographic risk |
| Experian | 1.11% | Held; relies on the proprietary nature of its credit data (not easily substituted by AI) |
| Baltic Classifieds Group | 0.55% | New purchase; an Eastern European used-car classified market where AI penetration is slower |
| Rightmove (not held) | — | Not held; avoids its transformation pressure of having to spend heavily on capital expenditure to respond to AI |
A notable detail: the fund did not sell Auto Trader or Experian because of the AI narrative. It retained confidence in segments with "data exclusivity" (Experian's credit data, Auto Trader's seller-inventory data), but kept its distance from a model like Rightmove's, which depends on traffic monetisation — the AI capability it would need £60 million to catch up on may not be a competitive advantage but a defensive cost.
3. The Geography and Track Logic of New Holdings: Using "Structural Growth" to Counter "Cyclical Noise"
The three new purchases fall in Australia, Japan, and the US, showing clear differentiated allocation logic:
- Carsales.com (Australia's largest auto listings platform): Its business model is highly similar to Auto Trader's, effectively replicating a proven growth logic in another market. Online penetration in the Australian auto market is still lower than in the UK, and management execution is the key variable. The 0.20% position is a tentative build; if the transformation goes well, there is room to increase.
- Shin-Etsu Chemical (global leader in semiconductor silicon and PVC): A typical "buy structural growth at the cycle bottom" move. The silicon wafer business is pressured by the semiconductor downcycle, but the company's global shares in 300mm wafers and photoresist are stable, and its cost curve is the steepest in the industry. The 0.25% position size suggests the fund is willing to tolerate short-term volatility in exchange for excess returns in the next upcycle.
- Coinbase (cryptocurrency exchange): This is the most forward-looking new position in the portfolio, corresponding to the report's "expansion of digital asset operations" theme. The 0.03% weight is almost symbolic — not a directional bet on the crypto cycle, but an option-style position on the structural trend of "institutionalised infrastructure."
The timing of these trades is also worth noting: when Shin-Etsu and Coinbase were bought, the market was still in the fear phase of the AI narrative; when The Trade Desk was sold, its share price was still at elevated levels. This suggests the fund's rebalancing is not driven by market sentiment, but derived backwards from "what the world will need in five years."
4. The "Opportunity Cost" of Not Holding Large Index Constituents: The Price of Discipline
Rolls-Royce, Lloyds Banking Group, and Barclays rose sharply during the reporting period, dragging on the fund's relative performance. The reasons for their exclusion vary:
| Company | Reason not held (inferred) | Actual rise | Cost borne by the fund |
|---|---|---|---|
| Rolls-Royce | Sustainability of the defence/aviation cycle is questionable; valuation already prices in substantial optimism | Significantly outperformed the market | Materially lagged relative returns |
| Lloyds | UK domestic bank; net interest margin peaked; limited growth runway | Benefited from rates staying high | Missed the defensive rotation |
| Barclays | Investment banking earnings are volatile; return on capital is mediocre | M&A/trading income beat expectations | Portfolio lacks this beta exposure |
This "missing out" is an inherent cost of active management. The fund uses explicit stock-selection criteria to filter companies, and the price is giving up "toolbox-type" assets that do not fit the long-term growth framework but perform strongly in particular macro environments (such as high rates). The report does not apologise for this; instead it stresses "questioning the durability and scale of growth runways" — confirming that the fund is willing to sacrifice short-term relative rankings in exchange for long-term absolute returns.
5. Portfolio Geographic Distribution: A Divergence Signal Between Rising UK Weight and Falling North America
Comparing regional weights from the current and prior periods:
| Region | Current period | Prior period | Change |
|---|---|---|---|
| UK | 57.27% | 56.57% | +0.70pp |
| North America | 9.57% | 11.03% | -1.46pp |
| Developed Asia-Pacific | 12.00% | 12.12% | -0.12pp |
| Europe (ex-UK) | 12.26% | 12.18% | +0.08pp |
| Emerging markets | 8.51% | 7.50% | +1.01pp |
North America saw the largest reduction, closely tied to the liquidation of The Trade Desk and the AI-panic-driven de-rating of data/classified-ad companies. But it is worth noting that within the North American sleeve there was not a full retreat — NVIDIA (0.73%) and Meta (0.76%) remain in the portfolio, and Amazon was even increased to 0.84%. This indicates the fund is not bearish on technology in North America; rather, it is actively removing "pure middlemen of the AI era" — companies whose position in the value chain may be directly compressed by AI (such as ad tech and traditional SaaS tools) — while retaining platforms with proprietary large-model capabilities or consumer-level influence.
The rise in UK weight reflects the allocation direction of new inflows: HSBC (largest purchase), Spirax, St. James's Place and others are all low-valuation, cash-flow-stable companies; combined with the increased Bunzl position, the portfolio's defensive character has been strengthened. This is a form of "active defence" — during a period when the AI narrative has split market valuations, low-valuation cash-flow assets serve as the base, while a small number of positions in emerging areas (Coinbase, Shin-Etsu) preserve the offensive optionality.
6. Hidden Signals in the Schedule of Material Transactions: Fund Flows from Purchase and Sale Amounts
The schedule of material transactions reveals some capital movements not described in the main text:
- HSBC purchase of £4,906 thousand is the largest single buy, yet the section on emerging-market contributions in the main text only mentions Standard Chartered. The increase in HSBC may relate to expectations of a UK banking-sector valuation recovery, with its growth characteristics classified as "low-valuation cash flow" rather than a "growth story."
- Just Group sale of £8,623 thousand is the largest single sale, far exceeding the next largest (Babcock at £6,157). Just Group is a UK pensions/annuity insurer whose business is highly sensitive to regulatory capital rules and interest-rate movements. This large sale may be a risk-management action rather than a response to deteriorating fundamentals — freeing up capital for other rebalancing.
The extreme asymmetry in purchase and sale amounts (largest buy under £5 million; largest sale over £8.6 million) implies that the fund executed a "portfolio rebalancing" during the year: by selling one higher-risk holding (Just Group), it funded the establishment of several medium-sized positions. This flexibility illustrates the liquidity-management advantages of an open-ended fund, and shows that the rebalancing logic prioritises risk diversification over chasing a single bright spot.
7. AI Positioning in the Portfolio's Micro-Structure: The "Probe Strategy" Behind Small Positions
The Portfolio Statement shows a number of AI-related micro-positions (all below 0.2%), forming a typical "probe strategy" — using minimal cost to keep observation windows open on frontier directions:
| Holding | Weight | Theme |
|---|---|---|
| Coinbase | 0.03% | Crypto infrastructure |
| Circle Internet Group | 0.01% | Stablecoins (USDC issuer) |
| Tempus AI | 0.14% | AI medical diagnostics |
| Recursion Pharmaceuticals | 0.01% | AI drug discovery |
| Aurora Innovation | 0.09% | Autonomous trucking |
| Figma | 0.07% | Design collaboration in the AI era |
In aggregate, these positions amount to no more than 0.4% of the portfolio, but they cover AI's transformation paths across finance, healthcare, and the physical world. They will not have a material impact on fund performance; their significance lies in this: the portfolio keeps tracking frontier change, and if a "curve inflection point" appears in any direction (e.g., a clear crypto compliance framework, an AI drug approval), the fund already has both the cognitive base and the position base to add quickly. This locks in learning costs more cheaply than waiting on the sidelines and entering later.
8. An Honest Answer to the Question "When Will Growth Return?"
The report admits it "cannot predict when the market will once again favour growth," but offers a history-based belief: "quality companies able to grow consistently will ultimately be recognised in their share prices." This means the fund's response to the current valuation environment is:
1. Do not chase short-term rotation — refuse to buy companies like Rolls-Royce or Lloyds that benefit in the near term from the macro environment;
2. Replace prediction with buying behaviour — through new positions in Carsales.com, Shin-Etsu, and Coinbase, the fund places bets of three distinct natures on "management execution," "cycle reversal," and "embryonic technology paradigm," respectively;
3. Keep re-examining while holding — the liquidation of The Trade Desk shows that even a formerly excellent holding cannot be held blind to competitive-landscape change triggered by AI.
This approach of "responding to uncertainty through structural adjustment" is more proactive than simply waiting for a style switch. The final effect will not appear in any single quarter; one must wait until the next growth-stock rally to see how many companies in the portfolio can benefit simultaneously from sector beta and their own alpha.
This section covers the tail of the Portfolio Statement, the three-year comparative table, and the complete financial statements. Compared with the first half, it offers more data dimensions for cross-verification: share class structure, fund flows, transaction costs, and portfolio rebalancing signals.
1. Share Classes: A Natural Experiment on Fees Within the Same Strategy
The three share classes hold exactly the same underlying portfolio; the only systematic difference is fees. This forms a natural control group for observing the impact of fees on long-term returns:
| Metric | B Accumulation | B Income | C Accumulation |
|---|---|---|---|
| 2026 return | 7.94% | 7.92% | 8.43% |
| 2025 return | 17.76% | 17.69% | 18.28% |
| 2024 return | 0.55% | 0.55% | 1.01% |
| Ongoing charges figure | 0.49% | 0.49% | 0.04% |
| Net assets at end-2026 (£m) | 50.7 | 1.3 | 227.8 |
| Share count change over three years | 73.1m → 28.9m (-60%) | 15.3m → 0.86m (-94%) | 187.1m → 124.9m (-33%) |
| 2026 dividend per share | 2.80p | 2.52p | 3.66p |
Pre-tax returns are almost identical — on the B Acc basis, "return before operating charges" was 13.73p (÷ opening 162.70p = 8.44%), and for C Acc it was 14.25p (÷ opening 168.23p = 8.47%) — a pre-tax gap of only 3bp. After tax, however, the gap widens to 49bp, exactly equal to the fee differential (0.45 percentage points). Compounded over ten years, this fee gap would produce roughly a 5% difference in terminal value. Fees are not a "small number"; they are a quantifiable compound drain.
Even more striking is the shrinkage of B Income shares: a 94% decline in share count over three years. Income share classes are typically driven by retirement income demand, and large-scale redemptions of this kind suggest investors are exiting UK small/mid-cap income strategies. C-class shares now represent 81% of the fund's net assets, indicating that the fund has in practice become a vehicle primarily for institutional/high-net-worth clients, while retail money continues to leave.
2. Nearly £100 Million of Net Redemptions and Liquidity Management

400G/800G port share grew from under 1% in 2018 to roughly 30% in 2026
| Fund flow item | 2026 (£m) | 2025 (£m) |
|---|---|---|
| Subscriptions | 20.9 | 8.3 |
| Redemptions | -119.6 | -99.3 |
| Net flow | -98.7 | -91.0 |
| Net outflow as % of opening net assets | 27.7% | 23.5% |
For the second consecutive year, roughly a quarter of the fund's assets were redeemed. To meet redemptions, the fund sold £144.4m of securities while buying only £51.8m, for net sales of £92.6m.
Two details deserve attention. First, sales in 2026 were higher than in 2025 (£144.4m vs £126.4m), yet realised capital gains fell sharply (£16.4m vs £53.7m) — meaning the average unrealised profit on 2026 sale candidates was lower than in the previous year, and some sales were executed at a loss. Second, the balance sheet shows net cash after offsetting bank overdrafts of £1.25m (3.22m - 1.97m), exactly flat with last year's £1.25m — while absorbing large-scale redemptions, the fund maintained highly disciplined cash management and did not see cash depletion from forced selling.
Another easily overlooked detail: the dilution adjustment rose from £106k to £170k. This charge is borne by remaining shareholders and is used to compensate for transaction costs; its rise is directly related to the increase in redemptions, and is in effect a cost transfer to continuing holders when trading is forced.
3. Transaction Costs Rose from 0.03% to 0.07%: The Real Price of Rebalancing
| Item | 2026 | 2025 |
|---|---|---|
| Purchase commissions (£k) | 17 | 15 |
| Purchase taxes (£k) | 141 | 62 |
| Sale commissions (£k) | 37 | 29 |
| Sale taxes (£k) | 3 | 5 |
| Total direct transaction costs (£k) | 198 | 111 |
| As % of average NAV | 0.07% | 0.03% |
| Average portfolio trading spread | 0.12% | 0.13% |
Transaction costs as a percentage of average NAV more than doubled, driven mainly by purchase taxes leaping from £62k to £141k. The UK stamp duty rate on share transactions is unchanged at 0.5%, so the higher purchase tax ratio (0.16% → 0.28%) implies that 2026 purchases had a higher share of UK stocks, or that a large number of new positions were opened in the UK market. In contrast, sale taxes were just £3k, almost negligible — which in the UK market means the securities sold had a larger share of non-UK stocks. Combined with the net-selling direction, the fund was engaged in a structural reallocation of "selling global/non-UK" and "buying UK," rather than merely meeting redemptions.
The average portfolio trading spread narrowed slightly from 0.13% to 0.12%, indicating a modest improvement in the liquidity of underlying holdings, which partly cushioned the price impact of large redemptions.
4. The Divergence Between Rising Dividend Per Share and Falling Total Dividends
Total income was £6.31m, down 28% from last year's £8.72m — entirely driven by the shrinking size of the fund. But at the per-share level, the story is completely different:
| Dividend per share | 2026 | 2025 | YoY |
|---|---|---|---|
| B Accumulation | 2.80p | 2.69p | +4.1% |
| B Income | 2.52p | 2.47p | +2.0% |
| C Accumulation | 3.66p | 3.47p | +5.5% |
Total distributions fell from £8.08m to £5.93m, but per-share distributions rose in every share class. This means the dividend capacity of underlying holdings is still improving; the fund's shrinking size is a "smaller denominator," not "deteriorating unit earnings capacity." This divergence can also serve as a reference for investors to distinguish between "a fund quality problem" and "a fund flow problem": the former determines whether per-share dividends can keep growing; the latter only affects the fund's total size.
5. Tail Holdings and Portfolio Rebalancing Signals
Among the 30 holdings shown on this page, as many as 8 have weights below 0.5%; the lowest, Ocado, is just 0.07% (market value £192,000). Ocado was once one of the representative UK growth stocks; its reduction to a token position suggests that the fund's view on this company has materially reversed, though it has not yet fully exited — which can be read as "still waiting for a clean exit point" or "keeping a minimal tracking position."
From the estimated holdings visible on this page, the top ten by market value total roughly £52.2m, equal to 18.6% of total assets — concentration is not high. The largest, Standard Chartered, is 2.72%, and the smallest is 0.07% — a roughly 40-fold weight span from tail to head, reflecting that the portfolio still maintains a fairly broad coverage of small and mid-cap names. Despite two consecutive years of large-scale redemptions, the portfolio structure has not been forced to retreat into a large-cap-only collection.
The presence of Shaftesbury Capital REIT is also notable: including a REIT in a UK & Worldwide Equity Fund means the fund's definition of "equities" encompasses real estate investment trusts, and the dividend distribution and tax treatment of such holdings differ from ordinary equities, creating some differences in income attribution.
Financial Statement Notes in Depth: Income, Expenses, Tax, and Investor Structure
1. Income: Across-the-Board Contraction, but Property Income Shines Structurally
| Income category | 2026 (£'000) | 2025 (£'000) | YoY change |
|---|---|---|---|
| UK dividends | 4,557 | 6,348 | -28.2% |
| Overseas dividends | 1,642 | 2,290 | -28.3% |
| Property income | 85 | 29 | +193.1% |
| Bank interest | 26 | 56 | -53.6% |
| Total revenue | 6,310 | 8,723 | -27.7% |
UK and overseas dividend income fell in almost identical proportion, indicating a simultaneous contraction of the fund's exposure to both domestic and foreign equities, rather than weakness in a single market. Property income rose from £29k to £85k; although the absolute amount is small, it reflects some increase in real estate or REIT allocations, possibly as a means of diversifying income sources amid falling dividends. Bank interest halved, which diverges slightly from the marginal decline in cash balances (£1,251k → £1,249k) and the interest-rate environment, possibly because average interest-bearing deposit balances fell.
2. Expenses: Decline Far Exceeding Shrinkage in Scale, Cost Structure Improving
| Expense item | 2026 (£'000) | 2025 (£'000) | YoY change |
|---|---|---|---|
| Annual management charge | 270 | 503 | -46.3% |
| Depositary's fee | 22 | 28 | -21.4% |
| Bank charges | 14 | 14 | 0% |
| Audit fee | 9 | 9 | 0% |
| Professional fees | 8 | 1 | +700% |
| Third party costs | 6 | 4 | +50% |
| Total expenses | 329 | 559 | -41.1% |
Total expenses fell (-41.1%) by significantly more than total assets (about -21%) and income (-27.7%), indicating that the fund achieved cost savings beyond what scale shrinkage alone would explain. The AMC nearly halved, possibly reflecting fee renegotiation or the transfer of some assets into lower-fee share classes. Professional fees jumped from £1k to £8k; the base is small, but it may involve one-off compliance or restructuring costs. Expenses as a percentage of income fell from 6.4% to 5.2%, suggesting improved operating efficiency.
3. Tax: A "Structural Exemption" Behind Zero Corporation Tax, and the Accumulation of Future Liabilities
Despite pre-tax net income of £5,981k, which at a 20% rate would imply £1,196k of corporation tax, the final tax charge was only £67k (all overseas withholding tax). The core logic is:
- UK dividends and most overseas dividends are exempt from corporation tax, with total exemptions of roughly £1,238k;
- Excess management expenses deductible in the year amounted to £42k, but cumulative unrelieved excess management expenses have risen from £5,387k to £5,601k.
This means the fund has generated substantial management expenses that could be offset against future taxable income for many years, but because expected future taxable income remains insufficient, it cannot convert these expenses into a deferred tax asset. In other words, the fund is in a state of "permanently tax-exempt" for tax purposes, yet the £5.6m of accumulated excess expenses is like a "sleeping tax credit" that could release value if tax rules change or the fund generates taxable income in the future.
Actual overseas tax fell from £83k to £66k, a decline of 20.5% — less than the 28.3% drop in overseas dividends — suggesting the fund may have increased its allocation to countries/regions with higher withholding tax rates, or reduced holdings in jurisdictions covered by tax treaties.
4. Distributions: Per-Share Distributions Rose Against the Trend; Shareholder Returns Did Not Actually Shrink
| Distribution stage | 2026 (£'000) | 2025 (£'000) | Change |
|---|---|---|---|
| Interim to 31 July | 2,202 | 3,515 | -37.3% |
| Final to 31 January | 3,326 | 3,823 | -13.0% |
| Subtotal | 5,528 | 7,338 | -24.7% |
| Net subscription/redemption adjustment | +400 | +744 | -46.2% |
| Total distributions | 5,928 | 8,082 | -26.6% |
Total distributions fell sharply, but combined with the Distribution Tables, per-share full-year distributions actually rose modestly:
| Share class | 2026 full year (pence) | 2025 full year (pence) | Change |
|---|---|---|---|
| B Accumulation | 2.80 | 2.69 | +4.1% |
| B Income | 2.52 | 2.47 | +2.0% |
| C Accumulation | 3.66 | 3.47 | +5.5% |
This reveals a key phenomenon: the fall in total distributions was caused by a sharp reduction in the share base, not by a deterioration in per-unit earnings power. Final distributions (for the period ended January 2026) rose by about 18% versus the prior-year period, proving that the fund's income position improved markedly in the second half. Meanwhile, distributable income retained at year-end fell from £20k to £6k; the fund distributed almost all net income (£5,914k) to investors (distributions of £5,928k), a payout ratio of roughly 100%.
5. Related-Party Transactions: Large-Scale Reduction of Group Sub-Funds, but Income Contribution Is Shrinking Fast
| Related fund | 2026 Purchases | 2026 Sales | 2026 Income | 2025 Sales | 2025 Income |
|---|---|---|---|---|---|
| Baillie Gifford EM Growth Fund C Acc | 385 | 5,246 | 249 | 4,400 | 345 |
| Baillie Gifford EM Leading Companies Fund C Acc | 424 | 6,009 | 295 | 5,156 | 340 |
| Baillie Gifford Japanese Smaller Companies Fund C Acc | 87 | 569 | 28 | 621 | 33 |
| Total | 896 | 11,824 | 572 | 10,177 | 718 |
Net sales of related funds in 2026 reached £10.9m (sales of £11.8m less purchases of £0.9m), versus net sales of £10.2m in 2025 — the pace of reduction accelerated. This may reflect a simplification of the fund's investment structure and a reduction in the double fees of a "fund of funds." However, income from related funds fell from £718k to £572k (-20.3%) and still represents 9.1% of total fund income (572/6,310), showing that despite the reduction, these holdings remain a non-negligible source of income. As these positions continue to be sold, this income stream will keep shrinking, and the fund will need direct holdings to fill the gap.
6. Investor Structure: B-Class Shares Experienced "Clear-Out" Redemptions; the Fund Faces Pressure on Scale Viability
| Share class | Opening share count | Closing share count | Change |
|---|---|---|---|
| B Accumulation | 49,180,793 | 28,884,887 | -41.3% |
| B Income | 11,213,911 | 857,630 | -92.4% |
| C Accumulation | 154,518,540 | 124,878,940 | -19.2% |
| Total | 214,913,244 | 154,621,457 | -28.1% |
B Income shares were almost entirely redeemed, likely reflecting one or more institutional investors exiting completely. B Accumulation also shrank sharply, while C-class retail shares were relatively stable. This structural change means: total share count fell by 28.1%, more than the 21.3% decline in total assets, indicating that net asset value per share actually rose over the period, easing investors' book losses. But continued shrinkage will dilute fixed costs (such as audit fees) and may reduce the fund's bargaining power in smaller stocks. If B-class shares continue to flow out, the fund may need to consider merging or closing the class.
7. Asset Valuation and Currency Risk: Rising Level 2 Share, Swiss Franc Exposure Rising Against the Trend
| Valuation level | 2026 (£'000) | Share | 2025 (£'000) | Share |
|---|---|---|---|---|
| Level 1: Quoted prices | 253,059 | 90.8% | 325,293 | 91.8% |
| Level 2: Observable market data | 25,715 | 9.2% | 29,086 | 8.2% |
| Level 3: Unobservable data | 0 | 0% | 0 | 0% |
The share of Level 2 assets rose from 8.2% to 9.2%, indicating that less-liquid holdings (or assets priced using observable inputs) increased in relative weight within the portfolio. This may be because Level 1 equities were reduced faster, rather than through new unlisted assets.
In terms of currency exposure, most foreign-currency assets fell in line with the fund's scale, but with clear divergence:
| Currency | 2026 (£'000) | 2025 (£'000) | Change |
|---|---|---|---|
| Swiss franc | 4,232 | 2,980 | +42.0% |
| Euro | 18,006 | 21,124 | -14.8% |
| Japanese yen | 21,107 | 27,147 | -22.2% |
| US dollar | 28,118 | 42,170 | -33.4% |
| Danish krone | 3,270 | 5,527 | -40.8% |
| Norwegian krona | 873 | 2,169 | -59.7% |
Swiss franc exposure rose sharply, while Nordic currencies such as Norwegian and Danish krona fell steeply, suggesting an obvious "flight-to-safety" tendency in regional allocation — possibly increasing Swiss defensive equity holdings while compressing higher-volatility Nordic markets. The dollar decline exceeded the overall pace, meaning US equity allocation was cut more aggressively than other regions. All foreign-currency exposures are non-monetary (i.e., equities); the only monetary assets are in sterling, and the fund uses no currency hedges, so exchange-rate movements will feed directly into net assets.
8. Summary
From the financial data in this section, the fund is in a phase of "shrinking scale but stabilising unit quality": total income and assets declined, but cost control was effective, per-share distributions rose, and the tax burden was extremely low. The biggest concern is investor redemptions, especially the concentrated outflow from B-class shares, which may force the fund to adjust strategy or consider its viability. The continued reduction of related-party holdings also indicates that the fund is actively simplifying its structure, paving the way for a more independent, lower-cost operating model in the future.
The Quantitative Warning of the Five-Year Cumulative Gap
The data disclosed in this report reveals a problem more severe than the single-year performance suggests. In the five years ended 31 January 2026, the fund delivered an annualised return of -2.2%, versus +12.6% for the index annualised and +14.9% for the target. Converting annualised figures into cumulative terms makes the gap even more stark:
| Metric | Fund | FTSE All-Share | Target (index + 2%) |
|---|---|---|---|
| Annual return (2025.1–2026.1) | -1.3% | 21.2% | 23.6% |
| Five-year annualised return | -2.2% | 12.6% | 14.9% |
| Five-year cumulative return (estimated) | -10.6% | +81.0% | +100.2% |
| Five-year cumulative excess return | -91.6pp | — | — |
This means an investor who put £10,000 into the fund five years ago would be left with approximately £8,940 today, while the same amount in the index would have grown to approximately £18,100. A cumulative shortfall of around 91.6 percentage points versus the index is not something a short-term style repair can close. Even if the fund were to outperform the index by 3 percentage points per year from now on (above its 2% target), it would take roughly 8 to 10 years just to catch up to the index level — assuming the index does not rise further during that period.
The Cost of the Growth Premium: Reexamining the 'Long-Termism' Narrative
The report reiterates its typical growth-stock narrative: "the portfolio retains above-average growth and quality characteristics, with attractive starting valuations." Five years of data, however, show that this logic now takes far longer to play out than a standard review cycle. The market environment since 2021—high interest rates and a preference for near-term certainty—has continued to weigh on long-duration assets, and the fund manager has not adjusted strategy accordingly. This exposes two structural contradictions:
1. The self-reinforcing nature of growth expectations: The fund continues to hold high-growth, high-valuation companies, yet the FTSE All-Share rally has been driven by banks, defense, and pharmaceuticals—precisely the sectors the fund underweights. This suggests that an "above-average growth" screen becomes a source of systematic risk exposure during style rotations.
2. Concentration amplifies the scarcity of stock-picking margin for error: With 30–50 holdings, a single stock misstep carries far more weight than in a broad-based index. Three stocks—4imprint, Auto Trader, and Experian—were the largest annual drags; in a portfolio diversified across hundreds of stocks, the negative impact of any single name would be significantly diluted.
The Subtle Shift in Trading Logic: Correction or Style Drift?
The trading records for this period reveal intriguing signals:
Sell: Hargreaves Lansdown, Ocado, Trainline
Buy: Greggs
Judging by the characteristics of the three companies that were fully exited—a wealth platform, an online grocer, and a rail ticketing firm—all are representative of the high-valuation growth stocks of the post-pandemic era. Greggs, by contrast, is a typical defensive consumer stock, whose appeal lies in an "entry opportunity created by cyclical weakness." This repositioning effectively acknowledges that the valuation logic underpinning the former has become untenable, and instead seeks out "value growth that has been unjustly sold off."
However, the pressure factors weighing on Greggs—weak UK consumer confidence and wage inflation driving up costs—are, in essence, the same macro headwinds as 4imprint's tariff concerns. This raises the question: does the repositioning truly resolve the portfolio's over-reliance on a UK consumer recovery? Or is it merely swapping one cyclical risk for another?
The AI Narrative: A New Stress Test for Data Moats
For the first time, the report devotes substantial discussion to AI's potential impact on data-driven companies such as Auto Trader and Experian — the section with the greatest incremental information value in this issue. The fund manager acknowledges that AI is a "far-reaching technological transformation" that will bring "unforeseeable" risks and opportunities to the industry.
This acknowledgment itself is significant. Over the past several years, the investment logic for companies such as Auto Trader and Experian has relied heavily on their data barriers and network effects. However, if AI lowers the costs of data collection, analysis, and distribution, the dominance of these moats could be weakened — for example, generative AI may reshape the price-comparison model of online classified advertising, or change the way credit data is accessed.
To its credit, the fund manager does not sidestep this risk, instead emphasizing that these companies are "financially robust enough to support cross-cycle investment." But this is essentially still a defensive argument, rather than a concrete elaboration of how AI could enhance these companies' competitive advantages. During a technological paradigm shift, the assumption of "maintaining the status quo" is often the most fragile.
The 4imprint-COVID Analogy: Applicability Limits of Historical Analogies
The report draws an analogy between 4imprint's current predicament and the COVID-19 period in 2020, arguing that the market is "overly pessimistic" and expecting it to rebound as strongly as it did back then. However, this analogy has a critical logical flaw:
The global optical module market grows from approximately $8 billion in 2019 to approximately $20 billion in 2027
- 2020: The pandemic hit demand, but supply chains and cost structures were largely intact, and the business model was not challenged;
- 2026: Tariffs directly raise import costs, supply-chain restructuring could permanently change profit margins, and trade-policy uncertainty persists.
In other words, the pandemic was an exogenous, one-off demand shock, whereas tariffs are an endogenous, continuously evolving cost shock. Comparing the latter to the former may underestimate the persistence of structural risks. Of course, 4imprint's brand strength and management quality do provide support—but if U.S. consumption weakens at the same time, its earnings elasticity will face dual pressure.
The Latent Tension Between the Net-Zero Framework and Performance
The fund has committed to aligning its holdings with the 2050 net-zero target and continuously assesses the net-zero alignment of all portfolio companies. From a regulatory and investor ESG standpoint, this commitment carries positive implications. That said, it should be noted:
- The defense sector, which led gains in 2025–2026, is a controversial industry under many ESG frameworks;
- Net-zero screening may exclude or underweight certain high-emission traditional industries, which may be precisely the ones to offer relatively high dividend returns during a rate-cutting cycle.
The report does not disclose the quantitative constraints the net-zero framework imposes on portfolio composition, but investors should be aware that this non-financial objective may come at the expense of certain investment opportunities — echoing the report's acknowledgment that "the limitations of third-party data may affect the achievement of non-financial objectives." Against a backdrop of five-year performance trailing by 14.8 percentage points, the costs and benefits of ESG integration warrant more transparent disclosure.
Management Fee Reduction: Modest in Size, Sincere in Intent
The report notes that starting September 30, 2021, the annual management fee for Class B shares will be reduced from 0.55% to 0.47%. This serves as an indirect compensation to investors during a period of weak performance. However, it should be noted:
| Share Class | Management Fee Change | Effective Date |
|---|---|---|
| Class B Accumulation Shares | 0.55% → 0.47% | September 30, 2021 |
| Five-Year Total Fee Savings (Estimate) | Approximately 0.4 percentage points | — |
The 8-basis-point reduction appears marginal, but compounded over five years, it contributes approximately 0.4 percentage points to final returns. Compared with the roughly 91.6 percentage points of underperformance versus the index over five years, this fee cut carries more symbolic than substantive weight. That said, it does demonstrate that the fund company recognizes the mismatch between fees and performance, which is commendable.
Outlook: Leading Indicators of a Shift in Market Conditions
At the end of the report, the fund manager expressed confidence that "market conditions have become more favourable", citing falling interest rates (the Bank of England has cut to 3.75%) and the potential for valuation recovery. Historically, rate turning points tend to precede growth-stock valuation recovery by 6–12 months. Data from January 2026 show the fund's annual return at -1.3%, narrower than in previous years, possibly signalling that the most violent adjustment phase has passed.
But the real test is this: If UK economic growth slows and consumption remains weak in 2026, can the fund's growth holdings make up ground through stock-specific alpha in an environment with no macro tailwinds? With the five-year cumulative gap already exceeding 90 percentage points, merely "keeping pace with the index" is no longer sufficient — the fund needs sustained, significant outperformance to have any chance of rebuilding investor confidence. This may be the most difficult challenge facing the current management team.
Position Structure: Concentration and Structural Migration in the Alpha Alpha Strategy
Once the data are disclosed, the true shape of the portfolio structure goes far beyond the narrative in the introduction. The most striking feature is that Games Workshop Group tops the portfolio with an 8.59% weight, more than 2 percentage points above last year's largest holding, 4imprint (currently 6.40%). A single-stock concentration approaching 9% is a high-level allocation for a UK Equity fund, indicating that the fund manager has placed an extremely heavy bet on the global licensing expansion narrative of the Warhammer IP. Games Workshop contributed £11,503 thousand in sales during the year, topping the sell list, yet its closing position actually rose to number one — suggesting that profit-taking during the period was outweighed by even stronger buying on dips. This is highly consistent with the stock's intra-year price swings (trading in a range from a fiscal 2025 high of 602.9p to a low of 506.0p).
Although 4imprint saw top-ups of £3,652 thousand, these were offset by larger sales, and its weight retreated from its leading position at the start of the year. This rise and fall reveals a structural rebalancing within the portfolio: the fund manager has not simply held on to winners, but has used two-way buying and selling to shift risk budget from high-valuation promotional products toward high-moat content assets. 4imprint's direct sales business model is solid, but its growth ceiling is visible; Games Workshop, by contrast, benefits from multiple catalysts including global licensing, film adaptations and video games, making it an "iterable scarce asset".
Buy/Sell Asymmetry: Signals of Defensive Top-Ups Running Parallel to Profit-Taking
Comparing the characteristics of the names in Largest Purchases and Largest Sales clearly identifies the two core trading rationales of fiscal 2025:
| Transaction Type | Target Characteristics | Representative Names | Amount (£'000) |
|---|---|---|---|
| Buy | Cyclical recovery / valuation repair | Croda International, Greggs, Diageo | 9,430 / 9,128 / 3,394 |
| Buy | Small/mid-cap growth platforms | Moonpig, Softcat, 4imprint | 4,040 / 3,941 / 3,652 |
| Sell | Cashing in on prior winners | Games Workshop, Auto Trader | 11,503 / 10,780 |
| Sell | Earnings estimate cuts / liquidity needs | Experian, FD Technologies, Standard Chartered | 10,209 / 10,184 / 7,940 |
Notably, Croda International was the largest buy at £9,430 thousand. As a specialty chemicals company, Croda was constrained by the global consumer destocking cycle in 2024–2025, and its share price corrected deeply. Building a position aggressively at this point indicates that the fund manager judged its earnings cycle to have reached a trough, while the medium-to-long-term demand in the consumer health and care space has not been fully priced in by the market. Similar is Greggs (£9,128 thousand) — buying the high-street bakery leader at a price-to-earnings ratio below 20 times against a backdrop of weak UK consumption, continuing the growth-at-a-reasonable-price orientation of "buying quality cash flows at sensible prices".
The sell side, meanwhile, reflects disciplined trimming of stretched valuations. Experian benefited from strong demand for credit data in 2025, with its share price reaching all-time highs; Auto Trader was similarly in a high valuation range. Combined sales of the two exceeded £21 million, representing more than 5% of the portfolio. Together with the exits from St. James's Place and Weir, the portfolio completed a pronounced rotation from "high-momentum growth" to "low-base recovery". This operating style is not that of a typical low-turnover growth fund; it more closely resembles a hybrid "GARP (Growth at a Reasonable Price) + event-driven" strategy.
Sector Weight Changes: What Trimming Technology and Adding Healthcare Really Means
The year-on-year weight changes shown in parentheses in the Portfolio Statement further reveal the underlying logic shift in the portfolio:
| Sector | 2026 Weight | 2025 Weight | Change (pp) |
|---|---|---|---|
| Technology | 13.95% | 17.73% | -3.78 |
| Health Care | 8.42% | 6.00% | +2.42 |
| Real Estate | 1.34% | 2.75% | -1.41 |
| Consumer Staples | 5.93% | 4.00% | +1.93 |
| Basic Materials | 5.29% | 2.49% | +2.80 |
| Financials | 15.68% | 13.36% | +2.32 |
| Industrials | 23.34% | 25.43% | -2.09 |
The reduction of nearly 4 percentage points in technology came mainly from the trimming/elimination of Auto Trader, Softcat, FD Technologies and Baltic Classifieds. This is not pessimism toward tech stocks; it looks more like actively reducing growth-premium exposure after valuation expansion. The increase in Health Care was driven almost entirely by Genus — the stock rose from a weight below 5% at the end of the prior year to 5.80%, and together with Hikma's 1.75%, forms an important defensive pillar of the portfolio. Basic Materials jumped from 2.49% to 5.29%, driven by a new position in Rio Tinto (2.86%) while maintaining the Croda holding, reflecting a judgment on global reindustrialisation and resource supply constraints.
There is one detail worth repeated consideration: the portfolio's 2026 performance (Class B -0.83%) was not due to stock-selection failure, but to the broad weakness in high-weight sectors (Industrials 23.34%, Consumer Discretionary 24.80%). These two sectors together account for 48.14%, and their negative returns during the period dragged on the entire portfolio. Extending the lens to three years, the trajectory of +0.36% in 2024, +14.87% in 2025 and -0.83% in 2026 shows that the fund does not pursue positive returns every year; rather, it seeks outperformance over roughly three-year cycles through "low fees + concentrated holdings + contrarian trading". The modest drawdown in 2026 is a normal fluctuation within the cycle.
Fee Advantage and Compounding: The Hidden Alpha That Cannot Be Ignored
The Comparative Tables provide the most complete fee-comparison evidence available. The biggest difference between Class B and Class C shares lies in operating charges: Class B at 0.49% versus Class C at 0.02%. The return differential over these three years corresponds precisely to this:
| Share Class | Fee | 2024 Return | 2025 Return | 2026 Return | Three-Year Cumulative NAV Growth |
|---|---|---|---|---|---|
| Class B Accumulation | 0.49% | +0.36% | +14.87% | -0.83% | +14.36% (650.13→743.51) |
| Class C Accumulation | 0.02% | +0.83% | +15.45% | -0.37% | +15.98% (736.88→854.68) |
The three-year cumulative gap is approximately 1.62 percentage points, almost entirely attributable to the compounding effect of the fee differential. In the negative-return year of 2026, Class C (-0.37%) lost 0.46 percentage points less than Class B (-0.83%). In an asset-management industry where management fees above 0.75% are common, these data demonstrate that a low fee is itself a predictable form of Alpha. For long-term investors, choosing Class C shares is equivalent to locking in roughly 0.47% of annual relative return without taking on any additional active risk.
At the same time, direct transaction costs rose from 0.04% in 2024 to 0.08% in 2026. This is directly related to the year's elevated turnover (10 largest purchases and 10 largest sales). Although the absolute figure of 0.08% remains low, given that the total fee for Class C is only 0.02%, transaction costs are already four times the fee. This means that while actively repositioning, the fund manager must ensure each trade creates incremental value in excess of 0.08% — and, as the results show, the negative return in 2026 was not caused by transaction costs, but by macro and sector beta headwinds.
Fund Flows and Investor Behaviour: "Passive Trimming" Under Redemption Pressure
Comparing closing and opening share data reveals a pronounced trend of investor redemptions:
- Class B Accumulation shares: 44,007,602 → 37,031,517 (-15.8%)
- Class C Accumulation shares: 15,514,798 → 10,509,979 (-32.3%)
- Class B Income shares: 2,522,220 → 1,928,316 (-23.5%)
The magnitude of redemptions in Class C is twice that of Class B. This is not surprising — Class C is typically held by institutional investors (higher thresholds, lower fees), and institutions are more inclined toward tactical adjustments than long-term holding when faced with market volatility. In 2026, the fund's total net assets fell from approximately £474M to £373.8M (a decline of about 21%), of which roughly 7–8% came from market declines and the remaining ~13% from net redemptions. This means that in an environment of sustained net outflows, the fund manager has nonetheless maintained the integrity and long-term perspective of the portfolio, without selling its highest-quality holdings under liquidity pressure (e.g., Games Workshop and Genus saw their weights rise rather than fall).
This "swimming against the tide" behaviour is corroborated by the sales of relatively low-weight, more liquid names such as Standard Chartered and Trainline. The fund manager chose to sell what was easy to sell first, rather than what it wanted to sell, preserving the integrity of core positions. This pattern was equally evident in fiscal 2025 — when fund shares fell from 56.8M to 44.0M, but the portfolio's +14.87% return that year proved that redemptions had not materially impaired net-value creation.
Conclusion: The Long-Termism Behind the Data
Assembling all the pieces of this period's data reveals a clear profile: this is a UK Equity fund that does not chase short-term rankings, is willing to take contrarian heavy positions, wields ultra-low fees as a weapon, and maintains portfolio edge through rebalancing amid volatility. The 2026 result of -0.37% (Class C) is merely one breath in the three-year compound growth curve. The underlying holding structure — 8.59% in Games Workshop, 5.80% in Genus, 4.44% in Experian — remains firmly anchored in high-quality UK businesses with global competitiveness and long-term structural demand. For holders, the real risk is not a single-year drawdown, but whether they can tolerate NAV volatility while waiting for the fruits of gene-editing commercialisation and IP globalisation to ripen.
Five Structural Signals Revealed by the Financial Statement Data
The full financial statement data disclosed in the continuation provide more precise quantitative material than the fund summary. These data not only record the operating results for fiscal 2026, but also reveal multiple behavioural characteristics of the fund during its contraction phase and potential strategic adjustment directions.
I. Structural Attribution of Asset Shrinkage: The Combined Effect of Capital Losses and Redemption Pressure
The balance sheet shows that the fund's net assets fell from £474,621 thousand to £373,758 thousand, an annual decline of 21.3%. Breaking down this shrinkage:
| Driver | Amount (£'000) | % of Total Shrinkage |
|---|---|---|
| Investment losses (net capital losses) | -15,093 | 15.0% |
| Net redemptions (issues - cancellations) | -94,188 | 85.0% |
| Net retained distributions | +8,266 | Offset in the opposite direction |
The data show that net capital outflows — not investment performance — were the dominant driver of the scale contraction. Looking more closely at the size of redemptions: redemption amounts during the period totalled £105,890 thousand, equivalent to 22.3% of opening net assets and far exceeding the £11,702 thousand issued. This intensity suggests that institutional investors may be systematically withdrawing from the strategy.
II. Deeper Reading of Doubled Transaction Costs: Forced Selling Pushes Up Hidden Costs
The report discloses that direct transaction costs as a percentage of average NAV doubled from 0.04% to 0.08%, with the absolute figure rising from £219 thousand to £293 thousand, an increase of 33.8%. Meanwhile, the investment portfolio (measured by market value of investments) shrank from £461,352 thousand to £369,087 thousand, down 20%. This combination of a "shrinking portfolio but sharply rising transaction costs" warrants attention.
| Transaction Cost Metric | 2026 | 2025 | Change |
|---|---|---|---|
| Transaction costs / average NAV | 0.08% | 0.04% | +0.04pp |
| Total sales (£'000) | 123,708 | 168,367 | -26.5% |
| Total purchases (£'000) | 46,241 | 31,510 | +46.8% |
| Sales/purchases ratio | 2.67 | 5.34 | Moving toward balance |
On the surface, total sales declined, but total purchases increased against the trend by 46.8%, indicating that the fund is not simply responding passively to redemptions, but is selectively repositioning. What is truly noteworthy is that, against the backdrop of overall scale contraction, purchases in 2026 were larger than in 2025 — this may mean the fund manager is building positions in new names at low levels, seeking stronger rebound elasticity when the market turns.
III. Rising Dividend Yield and Changing Income Structure: The Portfolio Is Tilting "Value"
Although total dividend income fell from £12,088 thousand to £10,695 thousand (down 11.5%), its ratio to average NAV actually rose:
| Income Ratio Metric | 2026 | 2025 |
|---|---|---|
| Dividend income / average NAV | 2.52% | 2.33% |
| Of which: UK dividend share | 88.5% | 83.1% |
| Overseas dividend share | 11.5% | 16.9% |
The dividend yield rose 19 basis points, while the domestic dividend share rose 5.4 percentage points and the overseas dividend share fell correspondingly. This structural change hints at two possibilities: first, the portfolio is concentrating toward higher-dividend-yielding UK domestic companies; second, overseas positions are being trimmed first. Combined with the trading data — a marked increase in total purchases, most of which are equities — the more likely scenario is that the fund manager systematically increased allocations to higher-dividend-yield UK value stocks in the second half of 2025.
IV. Cash Management on a "Knife's Edge": Overdraft and Low Cash Balance as Concurrent Signals
Two notable changes appeared in the cash lines: cash balances fell from £14,302 thousand to £5,927 thousand (down 58.6%), while a bank overdraft of £1,831 thousand was newly recorded. Net cash was only £4,096 thousand, equivalent to 1.08% of total assets, noticeably tighter than the prior year's 3.02% ratio.
| Cash Item (£'000) | 2026 | 2025 |
|---|---|---|
| Cash and bank deposits | 5,927 | 14,302 |
| Bank overdraft | (1,831) | — |
| Net cash | 4,096 | 14,302 |
The choice to use an overdraft while holding ample liquidity reserves — this seemingly contradictory approach of "keeping cash while borrowing" — usually means the fund manager expects large subscription/redemption swings in the near term. As a flexible short-term financing tool, an overdraft can avoid being forced to sell holdings at unfavourable points. This strategy corroborates the repositioning behaviour described above — the fund manager is striving to maintain operational initiative in a low-liquidity environment.
V. The Signal Conflict Between Accumulating Deferred Tax Assets and Management Confidence
The report discloses that, as of 31 January 2026, cumulative excess management fees had reached £24,598 thousand (prior year: £23,212 thousand), implying a potential deferred tax asset of approximately £4,920 thousand at a 20% tax rate, equivalent to 1.3% of net assets. The continued accumulation of this "dormant asset" means the fund will not generate taxable profits for a considerable period, and indirectly suggests that the strategy's return-recovery cycle may be lengthy.
But even more striking is the change in "related-party holdings" data:
| Holder | 2026 | 2025 |
|---|---|---|
| ACD and related-party holdings as % of NAV | 0.00% | 0.24% |
Based on 2025 net assets of £474,621 thousand, the 0.24% corresponds to approximately £1,139 thousand of shares that were fully liquidated during fiscal 2026. The complete withdrawal of manager-related parties from the fund is usually read by the market as a signal of "insider informed trading" — although under the legal framework of an open-ended fund this may be pure coincidence or a compliance requirement, the timing overlapping with the scale contraction is still worth factoring into investment decisions.
Overall, these financial statements depict a fund in a phase of "active contraction — structural repositioning — cash pressure". The increase in purchase size and the rise in dividend yield indicate that portfolio management is undergoing a directional adjustment; meanwhile, the related-party liquidation and the disproportionately high net redemptions expose that external capital — particularly institutional — is running out of patience with the strategy. The cross-corroboration between these data points reveals the fund's true state far more effectively than any single ratio.
Share Movements and Scale Reduction: Net Redemption Pressure in Class C Shares
The movement data for C Accumulation Shares reveal significant changes in investor behaviour:
| Item | Number of Shares | Change |
|---|---|---|
| Opening shares | 15,514,798 | — |
| Issued | +279,220 | +1.8% |
| Redeemed | (5,284,039) | -34.1% |
| Closing shares | 10,509,979 | -32.3% |
Net redemptions of approximately 4.7 million shares accounted for one-third of opening shares. Combined with the total assets in the valuation basis falling from £461.4M to £369.1M (down 20.0%), the inference is clear: redemptions were the primary driver of asset shrinkage, with market price declines further amplifying the scale reduction. Notably, redemptions far exceeded new issues, indicating that the fund was in a contraction phase during the reporting period — yet the Distribution Tables show per-share income still growing, meaning that retained investors were rewarded with improved performance.
Valuation Basis: All Assets Concentrated in Level 1, Minimal Liquidity Risk Exposure
| Valuation Level | 2026 Assets (£'000) | 2025 Assets (£'000) | Change |
|---|---|---|---|
| Level 1: Quoted prices | 369,087 | 461,352 | -20.0% |
| Level 2: Observable market data | — | — | — |
| Level 3: Unobservable data | — | — | — |
100% of the fund's assets are valued using quoted market prices, with no Level 2 or Level 3 assets. This is both an advantage — good liquidity and valuation transparency — and a constraint: the fund cannot capture a premium through illiquid assets. The decline in assets in 2026 was entirely the result of depreciation in Level 1 assets or redemption realisations, with no hidden "model-based valuation" buffer. In volatile market periods, this structure can amplify short-term NAV swings, but it also reduces the risk of valuation inaccuracy.
Distribution Trends: Significant Growth in Per-Share Income Across the Year, Mid-Tier Share Classes Stand Out
Combining the interim (31.07.25) and final (31.01.26) distributions, and comparing with the same period last year:
| Share Class | 2025/26 Full-Year Distribution (pence) | 2024/25 Full-Year Distribution (pence) | YoY Growth Rate |
|---|---|---|---|
| A Accumulation | 1.50 + 5.94 = 7.44 | 1.50 + 4.74 = 6.24 | +19.2% |
| B Accumulation | 4.00 + 11.44 = 15.44 | 3.85 + 9.67 = 13.52 | +14.2% |
| B Income | 2.40 + 6.55 = 8.95 | 2.30 + 5.68 = 7.98 | +12.2% |
| C Accumulation | 6.20 + 15.39 = 21.59 | 5.70 + 13.37 = 19.07 | +13.2% |
| C Income | 3.00 + 7.96 = 10.96 | 2.95 + 6.95 = 9.90 | +10.7% |

Revenue and market share of manufacturers including Zhongji Innolight, Eoptolink, Accelink, Coherent and others
All classes achieved double-digit distribution growth, with Class A recording the highest growth rate (+19.2%) but still the lowest absolute amounts. Class C (for institutional or specified contractual investors) has significantly higher cumulative distributions than Class A and Class B, reflecting differences in fee structure or initial investment thresholds. Notably, C Income had no equalisation at either the interim or final distribution (Group 2 distribution = full net revenue), possibly indicating that this class saw almost no new subscriptions or redemptions during the period, producing a relatively stable holder base.
The treatment of the equalisation mechanism for Group 2 differs across classes: for example, B Accumulation's Group 2 interim distribution equals 0, consisting entirely of equalisation; while C Income's Group 2 is identical to Group 1, indicating that no subscription or redemption transactions large enough to trigger equalisation occurred during the period. This detail reflects differences in holder behaviour across share classes — the lower-threshold A/B classes trade actively, while the higher-threshold C class is relatively stable.
Dilution Adjustment Mechanism: Threshold-Triggered "Aggressive Pricing" and Its Impact on Smaller Transactors
The General Information section sets out in detail the ACD's authorised scope and trigger conditions for dilution adjustments. Three points are worth emphasising:
1. The dynamic nature of threshold adjustments: The ACD sets a daily net inflow/outflow threshold for each sub-fund, and the threshold varies with market conditions. When the threshold is exceeded, the adjustment magnitude increases. This means that in extreme market environments, even a small transaction can be executed at a higher adjusted price because the day's aggregate net flow exceeded the threshold. The report explicitly states that "smaller transactions made on any day that the relevant threshold is exceeded will also trade at the price incorporating the higher adjustment".
2. Symmetry of adjustment direction: Prices are raised on net inflows (penalising incoming capital) and lowered on net outflows (penalising exiting capital), ensuring that transactions in either direction do not dilute the interests of existing shareholders. However, on trading days with neither issues nor redemptions, prices contain no dilution adjustment, providing unbiased pricing for "zero net flow" transactions.
3. Retention of discretion: The ACD may apply its discretion at a rate of 50% or more — it does not commit to making the same decision in similar circumstances, and the policy will be reviewed periodically. This leaves the manager considerable operational flexibility, but also increases the difficulty for investors in predicting transaction costs.
Share Class Access Restrictions: Increased Closure Affects Secondary Market Liquidity
- Class A: Since 1 March 2022, only available to those with a written agreement with the ACD or its affiliates, with existing holders as of 28 February 2022 unaffected. This "grandfather clause" allows legacy Class A shares to remain with their original holders, but new investors cannot buy them directly and must do so through contractual arrangements.
- Class C: Only available to persons for whom the ACD's affiliates provide investment management services or who have a separate fee agreement. This clearly positions Class C as a bespoke class for institutional or high-net-worth clients; its higher distribution amounts (see above) are likely related to the fee structure or service tier.
- Class G: For investors from a specific transfer channel (formerly the Baillie Gifford International Private Pension Fund), with the ACD retaining the sole right of admission.
These restrictions mean that, apart from Class B, Classes A and C have lower transferability and may be difficult for investors to access in the secondary market. For prospective Class C investors, eligibility is itself a threshold — which may explain the inactive trading in Class C and the absence of equalisation.
Tax Compliance and Information Exchange: Stronger External Constraints
The Taxation Reporting section requires shareholders to provide tax residence status, tax status, self-certification and tax reference numbers. The ACD has the right to refuse subscription or transfer applications until compliant information is received. In addition, the ACD must report shareholder identity and payment information to HMRC, which may pass the information to other jurisdictions. This provision is effectively the implementation of CRS (Common Reporting Standard) and FATCA at the fund level.
The related SDRT provisions serve as a reminder: routine redemptions are generally not subject to SDRT, but non-pro-rata in-kind redemptions may trigger the tax. This caveat is especially critical for institutional investors considering an in-kind redemption exit, as it directly affects exit costs.
Summary: The "Existing-Shareholder-First" Management Philosophy Revealed by Operating Data
As the share movements, valuation structure and distribution data show, the fund has strived to enhance returns for continuing shareholders against a backdrop of net redemptions. The refinement of the dilution adjustment policy and the access restrictions on share classes both reflect the manager's preference for protecting "existing shareholder interests". If market conditions deteriorate further, more share classes may trigger higher dilution adjustments, pushing up transaction costs — a hidden cost that institutional investors must measure when evaluating entry or exit timing.
"Functional Tiering" of Access Criteria: Fine Segmentation Based on Service Relationships
The continuation reveals a core logic behind the access criteria for the five share classes J, K, L, P and W: this is not a simple tiering based on investment amount, but a functional classification based on the "type of service relationship" between the investor and the ACD (or its affiliates).
| Share Class | Core Access Criteria | Implied Investor Profile |
|---|---|---|
| Class J | Separate agreement with the ACD or affiliates covering "total fund flows and marketing activities" | Institutional distribution platforms or white-label partners |
| Class K | Investment management services provided by ACD affiliates, or a separate fee agreement | Existing clients of the ACD's affiliated advisory business |
| Class L | Separate fee arrangement with the ACD or affiliates | Institutional investors with negotiated bespoke fees |
| Class P | Recognised by the ACD as an institutional pension platform, or determined at the ACD's sole discretion | Pension platforms and strategic partners |
| Class W | Separate fee arrangement for the relevant Class W shares | Bespoke investors under specific fee agreements |
These five classes together constitute a "relationship-driven" fee system. The implication is that Baillie Gifford does not publicly disclose the full fee schedule; instead, through "separate agreements" and "individual fee arrangements", pricing decisions are moved from standardised public documents to one-on-one negotiation. This practice is not unusual in a UK OEIC structure, but subdividing it into five classes reflects a high degree of customisation of client relationships and fee structures. Notably, the difference between Class K and Classes J/W is that the former emphasises bundling of "investment management services", while the latter focus on the unbundling of "fee arrangements". This suggests the ACD is seeking to distinguish between "service-bundled" and "pure fee-negotiation" client needs.
Tax Treatment of the Equalisation Mechanism: Hidden Redistribution Between Group 1 and Group 2 Shareholders
The description of equalisation deserves a deeper reading from two dimensions: tax efficiency and administrative fairness. The core of the mechanism is:
- Group 2 shareholders (those subscribing during the period) pay an "equalisation" amount within the subscription price, representing their share of net income accrued from the last distribution date up to the subscription date.
- This equalisation amount is treated as a return of capital at the first distribution, rather than as income.
This arrangement has a dual effect. On the tax side, a return of capital is not subject to income tax, but it must be deducted from the capital gains tax cost basis of the shares. This means that, for higher-rate income taxpayers, the equalisation mechanism converts part of an "income-type" distribution into a "capital-type" return, achieving a deferral of the tax burden — but not an elimination, because when the shares are sold, the reduced CGT base correspondingly increases the taxable gain.
On the administrative fairness side, the ACD has also introduced a "quasi-equalisation" mechanism for conversions — a detail that is easy to overlook. When investors convert between share classes (e.g., Class A to Class B), without equalisation the accrued income at the point of conversion could be unfairly allocated to either existing or new shareholders. The ACD undertakes that this mechanism ensures fair treatment for both the converting party and the other shareholders in the affected class — in essence, this is an institutionalised safeguard against wealth-transfer risk among shareholders.
Regulatory Embedding of TCFD Reporting: A New Phase from Voluntary Disclosure to Mandatory Compliance
The TCFD (Taskforce on Climate-related Financial Disclosures) section is not merely a compliance statement; it is a hard obligation under the UK FCA's ESG rule framework. Key dates are worth noting:
- Baillie Gifford & Co Limited, as the ACD, must publish a "TCFD entity report" by 30 June each year;
- It must also prepare a "TCFD product report" for each sub-fund, including core climate metrics;
- The reference period is the 12 months to 31 December of the preceding year;
- The latest report (covering the period to 31 December 2024) has already been published on the website.
This requirement means that climate-related disclosure has evolved from a "voluntary ESG label" into a structural component embedded in the fund governance cycle. From an investor perspective, the publication of TCFD product reports, cross-referenced with the annual/interim financial statements, makes climate risk data (such as carbon intensity, emissions footprint and transition risk exposure) a source of decision-making information on par with traditional financial metrics. For the UK and Balanced sub-funds within this ICVC — the former likely focused on UK small/mid-cap growth stocks, the latter spanning global balanced strategies — the climate metrics in the two product reports will present markedly different risk profiles; the resulting comparability is itself one of the core intentions of the regulatory design. In effect, this provides investors with a cross-fund framework for horizontally comparing climate risk, and the differences between Baillie Gifford's active management style (high shareholding concentration, long holding periods) and passive index funds on TCFD metrics will be placed under a further regulatory magnifying glass.
Structural Omission in the Fee Schedule: The Boundary Between Public Documents and Negotiated Pricing
The final line of the continuation lists only the table header "Class A Class B Class C Class G Class J", while the actual "Minimum Lump Sum Investment Amounts and Annual Management Charge" data will be presented on page 278. This layout arrangement itself carries governance implications: the minimum investment amount and annual management charge — the most direct decision parameters for investors choosing a share class — are placed at the end of the general information section, rather than in the key information section at the front of the prospectus.
This information architecture implies that the ACD is more inclined toward investors obtaining fee details through financial advisers or direct negotiation, rather than relying on standardised data in public documents. Combined with the Class J/K/L/P/W access criteria above, it is not difficult to infer — the Class A/B/C/G/J listed in the public table are likely only standard retail fee rates, while bespoke rates for institutional clients reside mainly in non-public "separate agreements". This constitutes the "dual pricing system" common in the UK fund industry: published list prices and negotiated transaction prices coexist.
I. Share Class Design: Mapping Minimum Investment Amounts and Fee Structures Across Channel Strategy
The nine share classes disclosed in this section (Class A/B/C/G/J/K/L/P/W) correspond to differentiated minimum subscription thresholds and annual management charges, essentially constructing a three-dimensional tiering system of "channel-client-cost". Looking at the data, three clear tiering logics emerge:
1. The retail/institutional dividing line: the £100,000 and £250,000 thresholds
Class B and Class C minimum investments are mostly £100,000 or £250,000, while Class A and Class L are mostly £1,000. Particularly noteworthy is that Class L exists only in the Global Alpha Growth Fund and the Global Income Growth Fund, with management charges (0.50% / 0.35%) significantly below Class A (1.42% / 1.35%), yet a minimum investment of only £1,000. This indicates that Class L is a "low-cost retail share class" designed for specific channels (such as platforms or white-label arrangements), rather than a strictly institutional share class — the £250,000 thresholds of Class P and Class W are what truly target institutional clients.
2. Class C's nil management charge: fee shifting and bundled models
All funds charge a nil annual management fee for Class C, but the minimum investment is generally £250,000. This is not "free management"; rather, it is the typical bundled fee model: investment advisory, custody and administration fees may be charged separately by other parties (such as distributors or platforms), or may be included in other cost items outside the fund's total expense ratio (TER). For investors, the headline nil management charge is extremely attractive, but the actual total cost of ownership must be assessed in conjunction with "other expenses" and "transaction costs" in the fund's annual report. This design is commonly used for bespoke institutional mandates or separately managed account packaging, avoiding duplicative disclosure at the regulatory level.
3. The tiered fee structure of Class W shares: scale incentives and diminishing marginal cost
Class W shares (currently offered only in the Global Alpha Growth Fund and the Responsible Global Equity Income Fund) adopt a degressive tiered fee schedule based on aggregate net value (see Notes 1 and 2), with the threshold at a combined NAV of £100 million. The structure is as follows:
| Fund | First Tier (≤£60m) | Second Tier | Third Tier | Final Tier (above that) |
|---|---|---|---|---|
| Global Alpha Growth | 0.57% | 0.35% (next £540m) | 0.33% (thereafter) | — |
| Responsible Global Equity Income | 0.50% | 0.35% (next £190m) | 0.30% (next £500m) | 0.25% |
The subtlety of this design lies in "full-NAV degression" — once £100m is exceeded, all assets (not merely the incremental portion) are charged at the higher-tier rate. For example, when the W shares of the Global Alpha Growth Fund reach £600m in assets, the fee on all assets falls to 0.35%; below £100m, the entire amount is charged at 0.57%. This creates a powerful scale-jump incentive, encouraging institutional clients to consolidate subscriptions or continue adding. Compared with Class B's fixed 0.57%, Class W has an advantage once scale exceeds £100m, and beyond £600m the fee falls to approximately 58% of the fixed rate.
II. Active Share and Portfolio Turnover in Combination: The "Purity" and "Frequency" of Active Management
Active Share measures the degree of overlap between the portfolio and the benchmark index, while Turnover measures trading frequency. Cross-analysing the two can identify the investment philosophy of different funds:
| Fund | Active Share | Turnover | Portfolio Characteristics |
|---|---|---|---|
| UK Equity Alpha | 90% | 10% | High purity + low turnover: extreme bottom-up stock selection, long-term holding |
| Global Income Growth | 86% | 12% | High purity + low turnover: income strategy focused on dividend cash flows, low trading frequency |
| Responsible Global Equity Income | 86% | 15% | Same as above, though ESG integration may lead to slightly higher repositioning frequency |
| Global Alpha Growth | 79% | 29% | Medium-high purity + higher turnover: growth strategy allows adjustments based on earnings momentum |
| Global Alpha Paris-Aligned | 79% | 29% | Identical to Global Alpha: Paris alignment adds no additional turnover cost |
| International | 78% | 28% | Similar to global growth strategy, benchmarked to MSCI ACWI ex UK |
| Managed | 78% | 16% | Multi-asset allocation strategy; low turnover reflects strategic asset allocation rather than frequent timing |
| UK and Worldwide | 75% | 19% | Dual benchmark (60% FTSE All-Share + 40% Overseas), moderate turnover |
New evidence: The Paris-Aligned Fund's Active Share and Turnover are exactly the same as those of its non-aligned version (79% / 29%), indicating that the fund's emissions-reduction objectives are achieved through stock weight adjustments within the benchmark (rather than large-scale exclusions), and that its active management style has not been diluted by ESG constraints. At the same time, the absence of a marked increase in turnover suggests its ESG screening relies on static data rather than high-frequency, negative-event-driven trading.
Noteworthy outlier: The Managed Fund has an Active Share of 78%, but its benchmark is the IA Mixed Investment 40-85% Shares peer-group median. Because this peer-group benchmark contains no stock-level data, the firm uses an "appropriately weighted representative index blend" to estimate it. This indicates a methodological compromise in the Active Share calculation for funds not benchmarked to a single equity index — the actual measure of active management may be somewhat distorted. Investors should recognise that this 78% is not a strict stock-overlap metric, but an approximation based on deviation at the asset-class allocation level.
III. Corporate Governance Excerpt: From "Governance Compliance" to "Engagement-Based Stewardship"
Although this section is not presented in full, what is shown reveals three features of Baillie Gifford's governance philosophy:
1. Dialogue-based rather than exclusion-based: The policy explicitly states "dialogue and engagement rather than exclusion", forming a sharp contrast with the "negative screening" strategies of other asset-management giants. For example, the firm may hold fossil-fuel companies and actively participate in their transition, rather than simply excluding them.
2. Voting as a "last resort" rather than a "standard weapon": The text emphasises that the firm "endeavours to contact companies before it votes against management" and "generally supports management", while still evaluating the substance of each proposal. This is fundamentally different from institutions that outsource voting to ISS and execute by template, reflecting a relationship investing tradition.
3. ESG issues integrated into the valuation process: Sustainability, human rights and employee welfare are regarded as "areas potentially most relevant to shareholder value" and are incorporated into the full-cycle decisions of "select, hold, exit". This reflects materiality analysis rather than formal compliance.
Combined with the long-term incentives of the Class W shares discussed earlier, it can be inferred that tiered fees + low turnover + active governance participation all serve the same client profile — long-term, large-scale, relationship-oriented institutional investors. This explains why Baillie Gifford can maintain turnover far below the industry average (UK Equity Alpha at just 10%) while sustaining a high Active Share (90%): a high-conviction portfolio does not need frequent trading, and deep governance engagement secures its rights as patient capital.
IV. Fund Product Matrix: Eight Funds Covering "Growth-Income-Aligned"
The Group Funds list shows that the eight sub-funds under the Baillie Gifford UK & Balanced Funds ICVC can be clustered by investment style as follows:
| Style Cluster | Funds | Average Active Share | Average Turnover |
|---|---|---|---|
| Global Growth | Global Alpha Growth, Global Alpha Paris-Aligned, International | ~79% | ~28-29% |
| Income | Global Income Growth, Responsible Global Equity Income | 86% | 12-15% |
| UK & Balanced | UK Equity Alpha, UK and Worldwide, Managed | 81% | 15% |
Among these, UK Equity Alpha and the Managed Fund represent the two extremes: the former is pure bottom-up UK small/mid-cap stock selection (Active Share 90%, Turnover 10%), while the latter is a multi-asset allocation strategy (with a similar Active Share but a different benchmark construction, Turnover 16%). This matrix design enables the ICVC to cover clients with different risk appetites and market regions, while sharing Baillie Gifford's unified long-term investment culture — even the Managed Fund, as a multi-asset fund, has turnover significantly below that of industry peers (multi-asset funds typically turn over 40%+ due to rebalancing).
V. Disclosure Transparency: Three Implications for Investment Decisions
1. Fee comparisons must be read alongside minimum investment amounts: Class A's 1.42% fee is available from £1,000, whereas Class B's 0.57% requires £100,000. A client with only £50,000 cannot simply complain about the fee differential, because the two classes correspond to different service tiers (distribution services, client support, reporting frequency, etc.). But if a client can raise £250,000, using Class P or W shares in the Global Income Growth Fund can reduce the fee to 0.45% — 0.90 percentage points cheaper than Class A. Over ten years on a £250k principal, that would save more than £25,000 (before compounding).
2. The "optimal scale breakpoint" in tiered fees: Those planning to invest in the Global Alpha Growth Fund's W shares should recognise that the £100m threshold is the point at which the fee rate changes qualitatively. For large institutions, the annual cost saving from adding capital to cross this threshold (a 0.22-percentage-point reduction in the fee on all assets) could exceed £220,000 — in effect, this is a "scale discount option".
3. Turnover data are a forward-looking indicator of costs: Although turnover is not directly equal to transaction costs, the gap between 29% and 10% implies that Global Alpha Growth's transaction costs may be roughly three times those of UK Equity Alpha (assuming similar bid-ask spreads). When comparing NAV performance, investors should focus on true returns after transaction costs — especially for the Paris-Aligned Fund, whose identical turnover to the standard version means that being "green" has not added incremental friction costs.
Dynamic Management Signals in the Fund Product Line
This page appears to be a simple fund list, but it actually conceals deeper information about product lifecycle management and strategy iteration. As an interim report addressed to existing holders (ICVC January 2026), the product changes in the footnotes reveal Baillie Gifford's proactive stance on asset allocation and product governance:
| Fund Name | Status (as of January 2026) | Key Signal |
|---|---|---|
| Emerging Markets Bond Fund | Closed to new subscriptions (footnote 1) | EM bond strategy capacity or attractiveness has declined; the firm is unwilling to expand further |
| Health Innovation Fund | Closed to new subscriptions (footnote 3) | Thematic equity fund enters a lock-up period, typically due to capacity constraints or a desire not to dilute returns for existing holders |
| Sterling Aggregate Bond Fund | Closed to new subscriptions (footnote 4) | Under changing UK rate conditions, the differentiation value of a pure core fixed income strategy for Baillie Gifford has diminished |
| Cautious Managed Fund | Newly launched on 31 July 2025 (footnote 2) | Fills the gap in lower-risk multi-asset products, responding to demand for defensive strategies |
| UK Equity Core Fund | Renamed Core Growth Fund on 2 February 2026 (footnote 5) | A shift from "Core" to "Growth" clarifies strategic positioning and creates a clearer distinction from other UK equity funds in the ICVC |
Three key observations can be drawn from this list:
1. Product contraction is concentrated on "non-equity" and "narrow-theme" funds
The three funds closed to new subscriptions fall into emerging-market bonds, a health innovation theme, and sterling aggregate bonds. Their common features are: limited strategy capacity (EM bond liquidity), dependence on a single track (Health Innovation), and rate-sensitive assets. Meanwhile, all equity funds (global, UK and sustainable) remained open over the same period. This corroborates Baillie Gifford's allocation stance of favouring equities over the medium-to-long term while contracting fixed income/narrow-theme products.
2. The "Core → Core Growth" rename is not merely a wording change
Baillie Gifford has another fund named "UK Equity Alpha Fund". If the original "Core Fund" emphasised benchmark tracking and low active risk, then after the rename to "Growth Fund", the boundary with the Alpha Fund becomes more blurred rather than less. A more reasonable reading is that the fund's investment process had already tilted toward a growth style in practice, and the rename was intended to avoid an expectation gap with its actual portfolio style (high-conviction positions, concentrated holdings, long-termism) — consistent with Baillie Gifford's overall brand identity as a growth investor.
3. The ICVC platform's iteration cadence as a "product experimentation ground"
Launching the Cautious Managed Fund in July 2025 and renaming an existing fund in February 2026 shows that product adjustments on this platform are not revised uniformly on an annual basis, but are updated promptly in response to market conditions and internal strategy discussions. Combined with the footnote dates (January 2026 report, February 2026 rename), it is clear that the editorial cutoff for this document was around 31 January 2026, while the product decisions were incubated even earlier — this time lag itself constitutes information about the internal governance rhythm.
Additional Insights from Contact Channels and Operational Details
The information block at the end of the document is also worth noting:
- Telephone 0800 917 2113 is a UK freephone number, with the explicit notice that "calls may be recorded" — standard compliance language under FCA regulation, but it also indicates that the platform is primarily oriented toward retail/intermediated clients rather than purely institutional direct sales.
- Fax 0131 275 3955 is still retained — given that fax was nearly obsolete by 2026, this detail suggests the document template has been in use for many years, and the firm's priority for updating client outreach channels (such as online chat or apps) is not particularly high.
- The copyright notice © Baillie Gifford & Co 2009 stands in sharp contrast to the document's content (2026) — a typical example of a "long-serving template from this century", showing that the prospectus/report layout and disclaimer wording remain highly stable while the substantive content (fund lists, footnotes) is updated and appended each year. This "old bottle, new wine" approach reduces compliance risk while giving long-term holders a stable expectation of document structure.
Summary: Reading Product Governance and Platform Positioning from a "List Page"
This page is more than a list of information; it reflects Baillie Gifford's clear posture across three dimensions:
| Dimension | Assessment |
|---|---|
| Product strategy | Actively contracting fixed income/narrow-theme products, keeping equity products open, and adding a defensive multi-asset fund to complete the risk spectrum |
| Brand management | Aligning fund names with the public perception of "growth investing" through renaming, reducing the cost of investor misunderstanding |
| Operating style | Maintaining traditional contact channels and document templates — solid and stable, though somewhat lagging in digital outreach |
As the closing page of the report, this section combines with the detailed investment strategy, fee disclosures and risk factors earlier in the document to form a complete picture: a long-established UK asset manager committed to long-termism with equities as its core competency, yet also adapting to market changes through product lifecycle management. For investors, the "closed to new subscriptions" and "rename" entries in the fund list often expose the early signs of strategy shifts even earlier than performance data.
Position Moves
| Instrument | Direction | Author's stance in one sentence | Key data |
|---|---|---|---|
| Baillie Gifford Global Alpha Growth Fund | Hold under observation | Performance continues to lag and the attribution narrative is unconvincing; the five-year target will most likely be missed | Annual return 2.7%; five-year annualized 3.7%; trails benchmark by 8.1pct; risk level 7 |
| Baillie Gifford Managed Fund | Not stated | Derivatives usage is "low complexity," but VaR/sensitivity is not disclosed; combined with its rates and credit strategies, transparency is insufficient | The only sub-fund permitted to use derivatives; no VaR or stress test provided |
| Baillie Gifford UK Equity Alpha Fund | Not stated | Adds a 20% cap on non-UK investments; the strategy deviates from what the fund name implies, so investor expectations need to adjust accordingly | Non-UK assets capped at 20% effective 2 February 2026 |
| Baillie Gifford Global Alpha Paris-Aligned Fund | Not stated | The investment policy adds a revenue exclusion and clarifies the Paris Agreement alignment assessment process; a compliance-driven change | Effective 31 October 2025 |
| Baillie Gifford Global Income Growth Fund | Not stated | Fees are charged to capital to sustain distributable income, at the expense of NAV growth; the timeliness of the depositary consent mechanism warrants attention | Part of the management fee is charged to capital, subject to depositary consent |
| Responsible Global Equity Income Fund | Not stated | Same as above; the practice of capitalizing fees affects both the distribution rate and the unit NAV | Part of the management fee is charged to capital, subject to depositary consent |
| Baillie Gifford International Fund | Not stated | Removal of Target Returns is a material change to contractual terms and reduces predictability for investors | Target Returns removed effective 2 February 2026 |
| Baillie Gifford UK and Worldwide Equity Fund | Not stated | Same as above; only the removal of Target Returns is mentioned | Target Returns removed effective 2 February 2026 |