2025 Active-Passive Investor Summit – Fluor Corporation
Starboard Value is a New York activist hedge fund that Jeff Smith and partners spun out as an independent firm in 2011 (the strategy dates to 2002 at Ramius). It targets undervalued U.S. small- and mid-caps, pushing board overhauls and operational fixes — famously its ~300-page Darden/Olive Garden deck.
In plain words
This report looks at Fluor Corporation, an engineering company that designs and builds big projects like factories, data centers, and nuclear plants. In the past, Fluor lost a lot of money by taking on risky fixed-price contracts, and its stock crashed. Now it has shifted to safer, cost-plus contracts and has a huge $28 billion backlog of orders. With fewer competitors and government support (like the CHIPS Act) driving demand, the report argues Fluor's profits and stock value could improve. For regular investors, the key is whether Fluor can keep winning good projects and boost its profit margins.
This report is a discussion material on Fluor Corporation released by Starboard Value at the Active-Passive Investor Summit in October 2025. The main content of the report is a legal disclaimer, emphasizing that it is for general informational purposes only and does not constitute an offer or recomm
Theme and Background
This chapter introduces the business profile, financial condition, and historical market environment of Fluor Corporation (FLR). The report states that Fluor is a global engineering, procurement, and construction management (EPCM) services company capable of providing end-to-end solutions for large-scale, complex projects, serving clients across multiple end markets. At the same time, the report reviews the competitive landscape of the U.S. construction market in the 2010s: market fragmentation, intense competition among numerous EPCM companies for limited growth opportunities, and instances of irrational risk-taking.
Core Thesis
The report argues that:
- Fluor is one of the few companies truly capable of delivering end-to-end EPCM solutions, possessing differentiated competitive capabilities.
- Fluor's end-market portfolio is highly diversified, covering multiple attractive industry sectors.
- Historically, the construction market was highly competitive and lacked discipline in risk-taking, suggesting that the current market environment may have changed (in Fluor's favor).
Key Arguments and Data
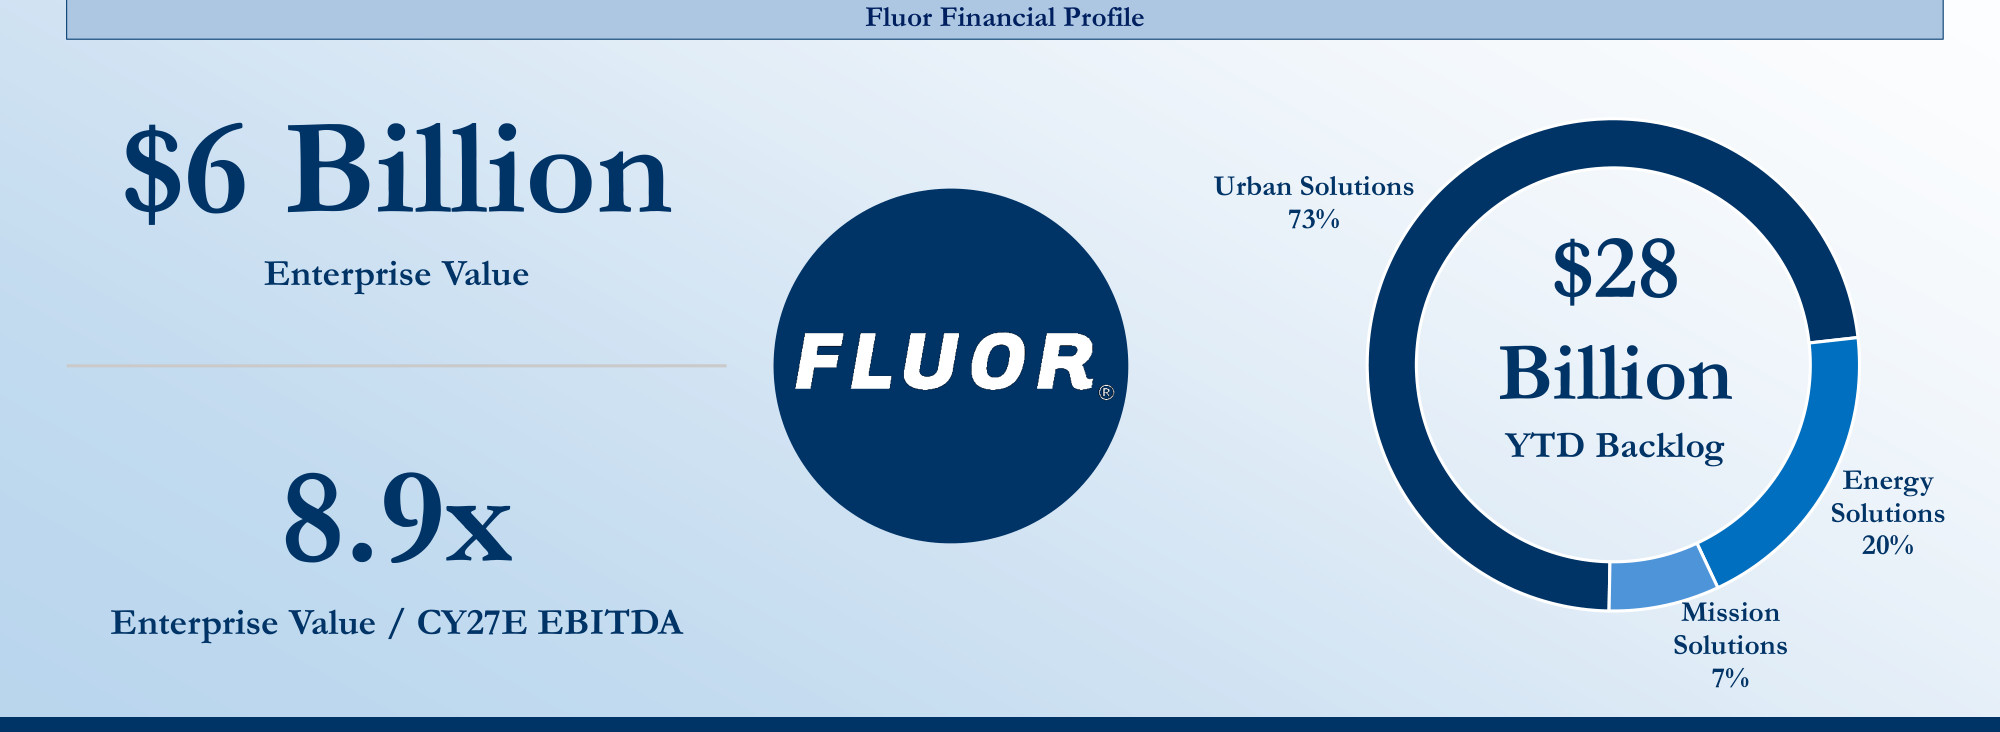
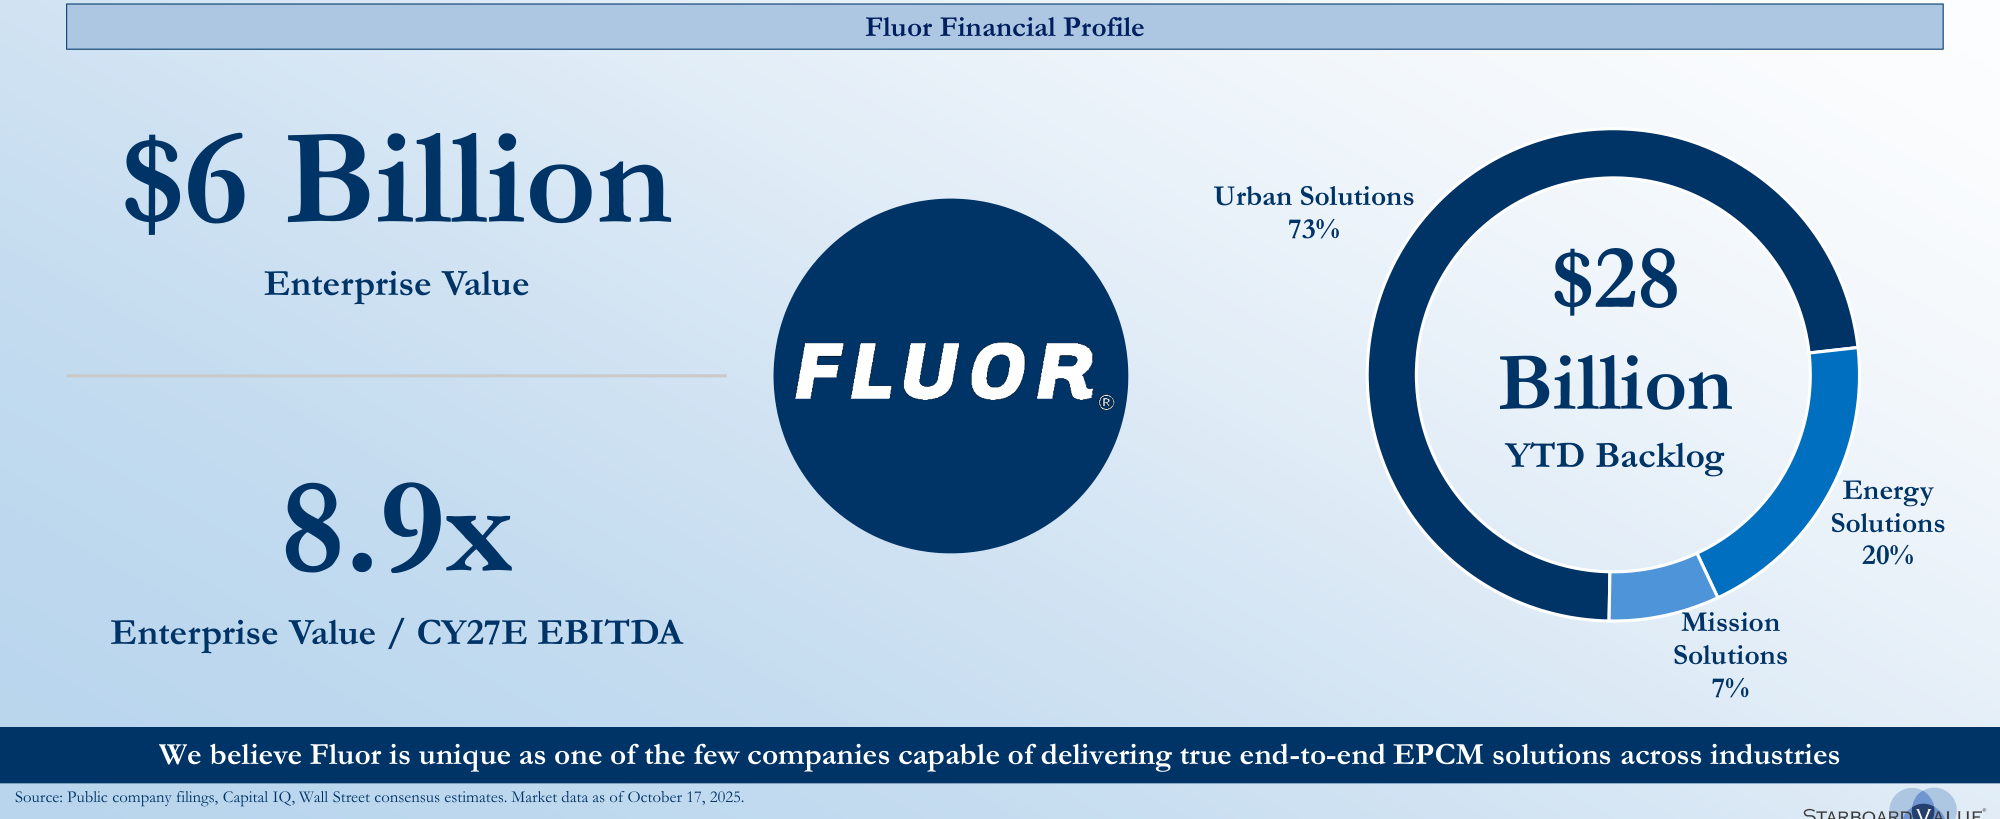
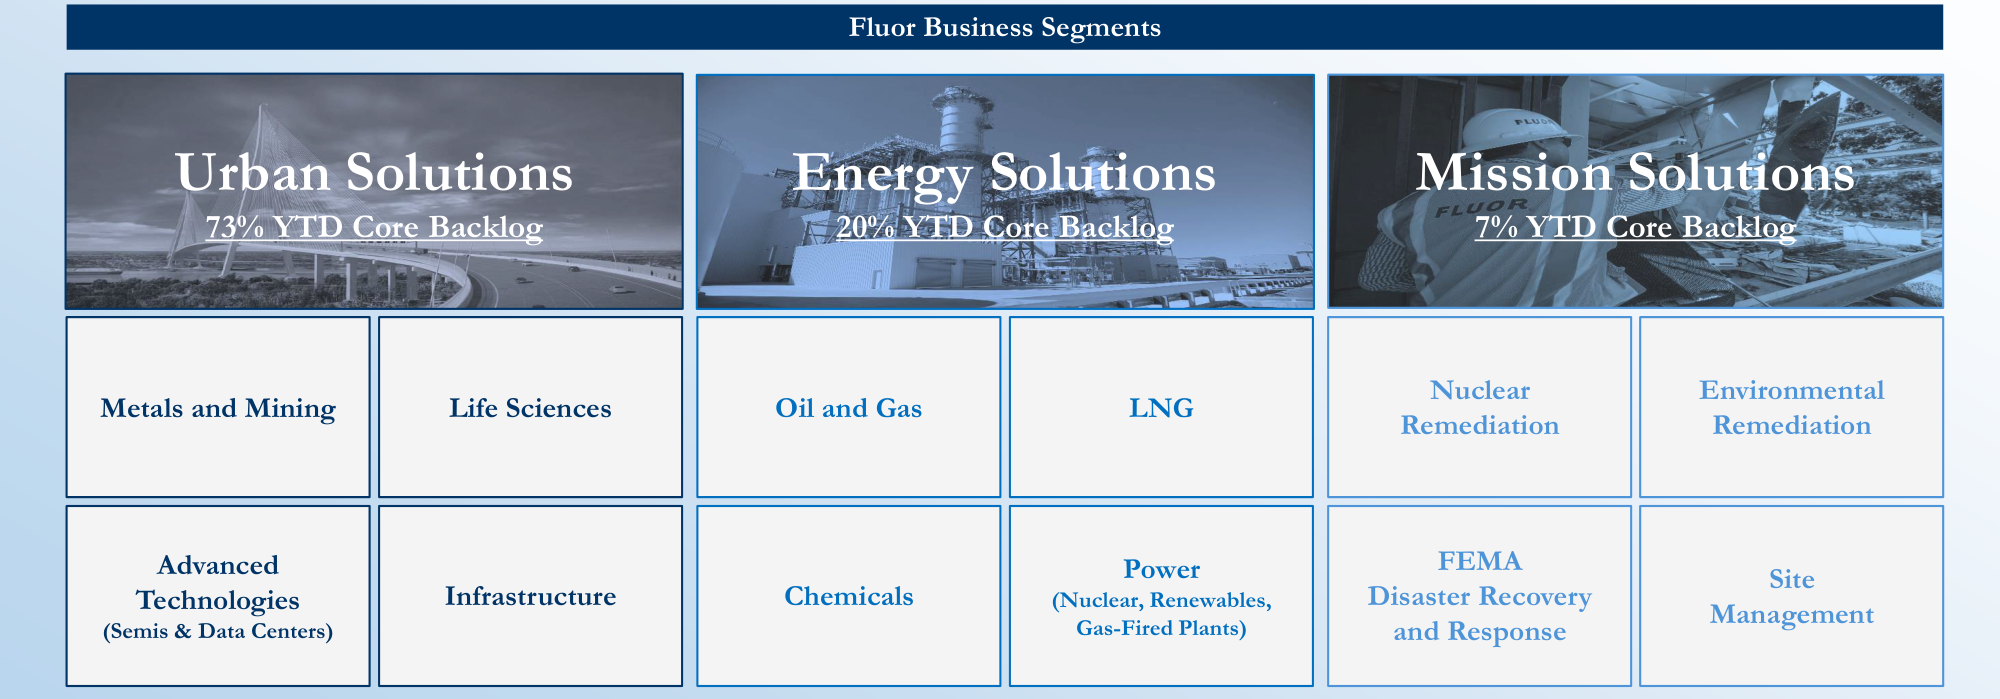
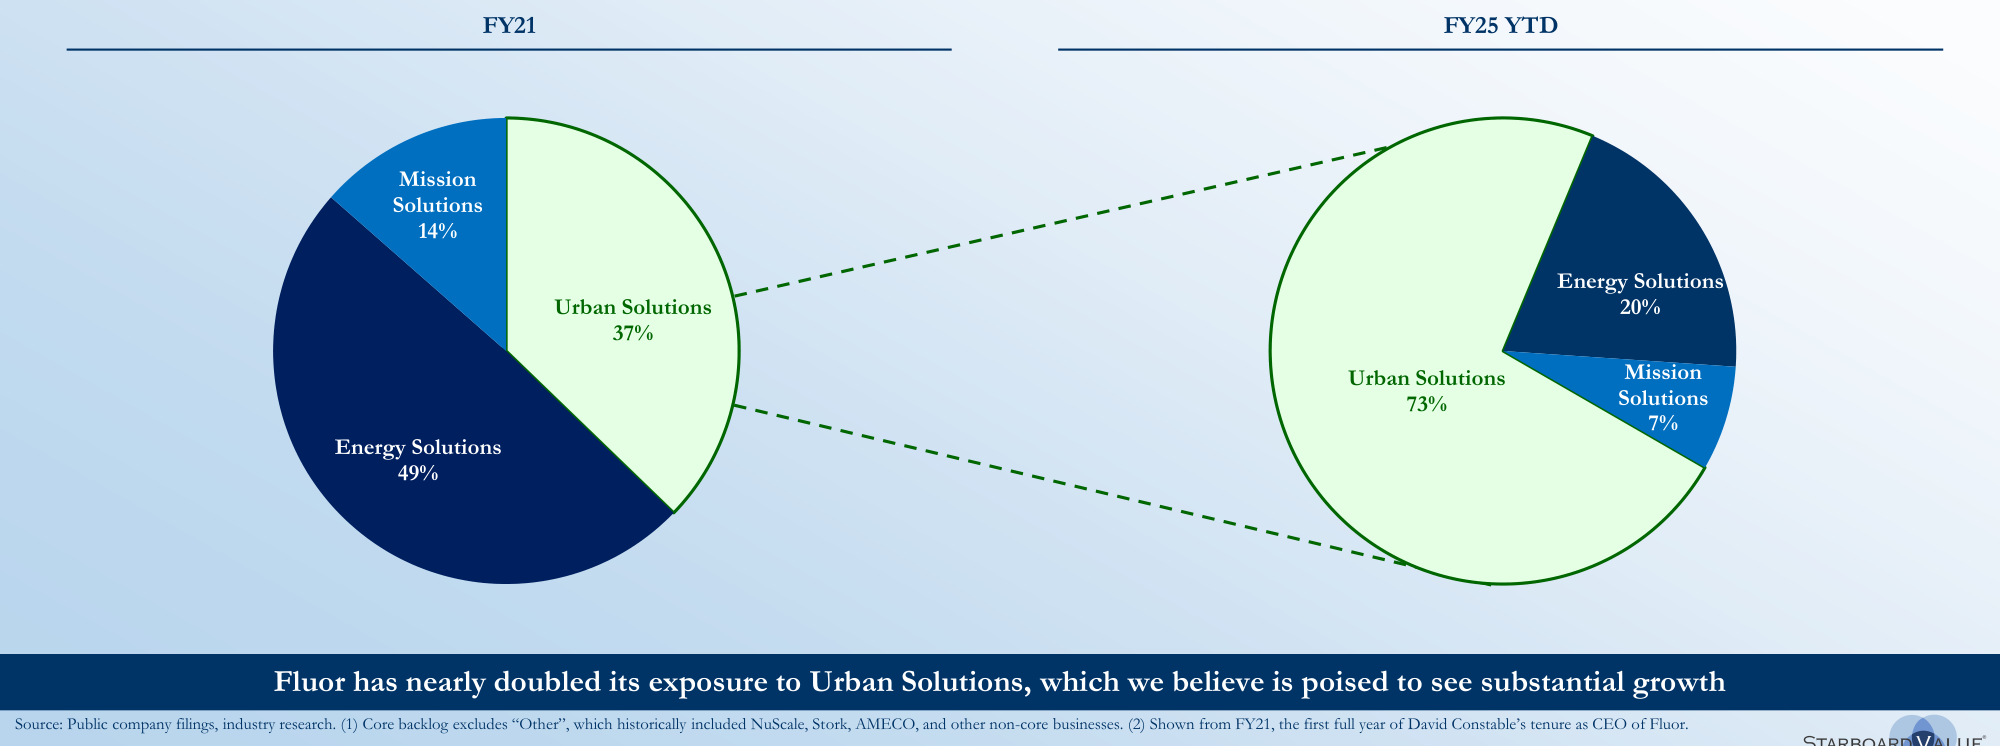
Fluor enterprise value $6 billion, EV/EBITDA 8.9x, YTD backlog $28 billion, with Urban Solutions accounting for 73%, Energy Solutions 20%, and Mission Solutions 7%
- Business segment breakdown (by year-to-date core backlog percentage):
| Segment | Percentage |
|---|---|
| Urban Solutions | 73% |
| Energy Solutions | 20% |
| Mission Solutions | 7% |
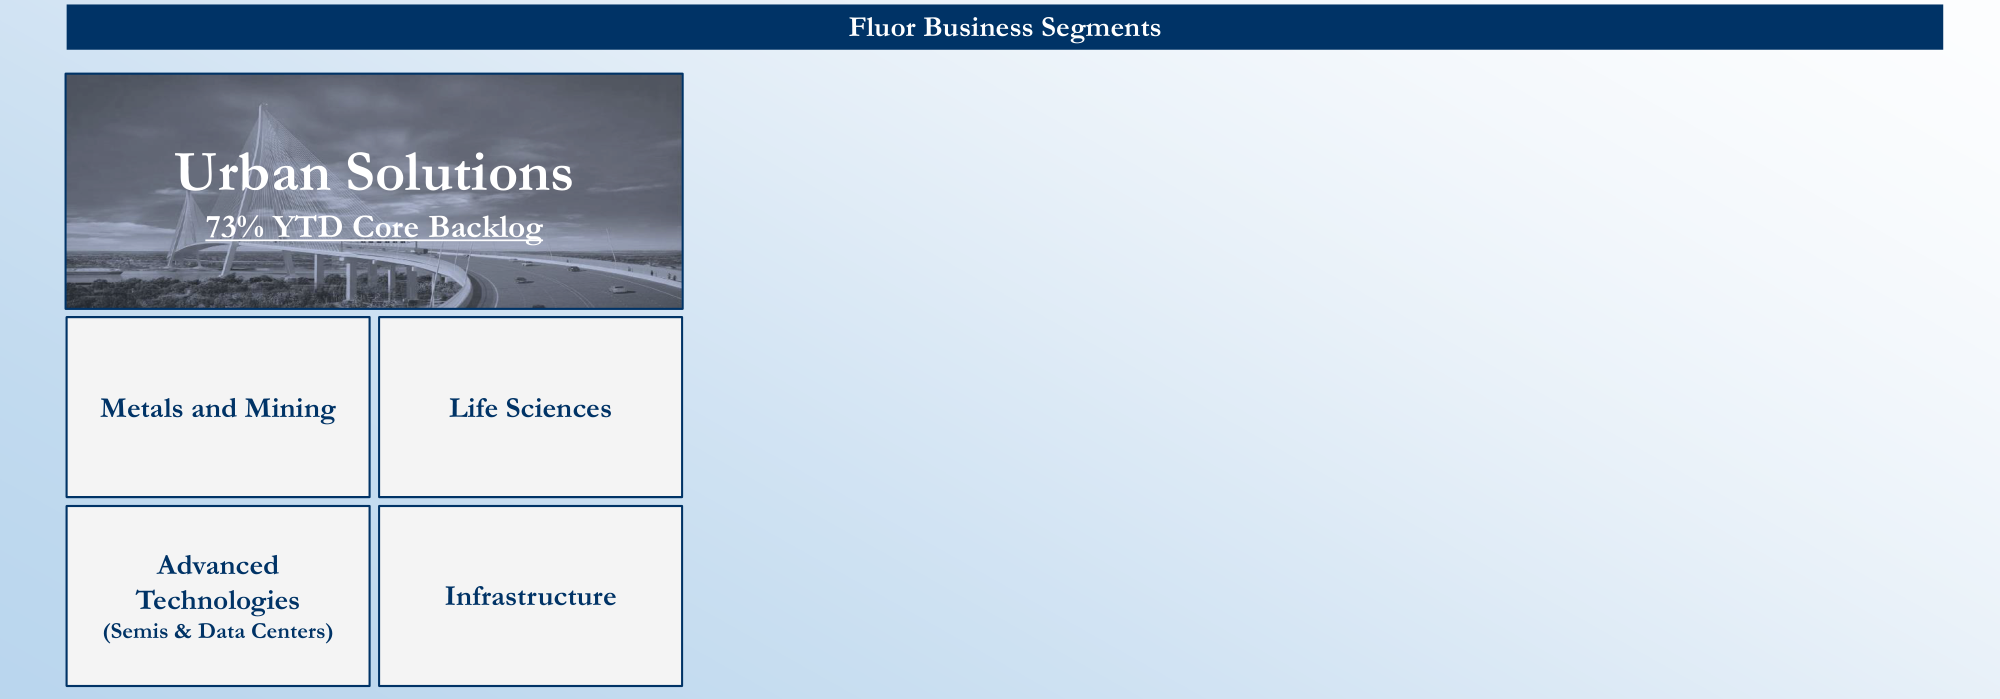
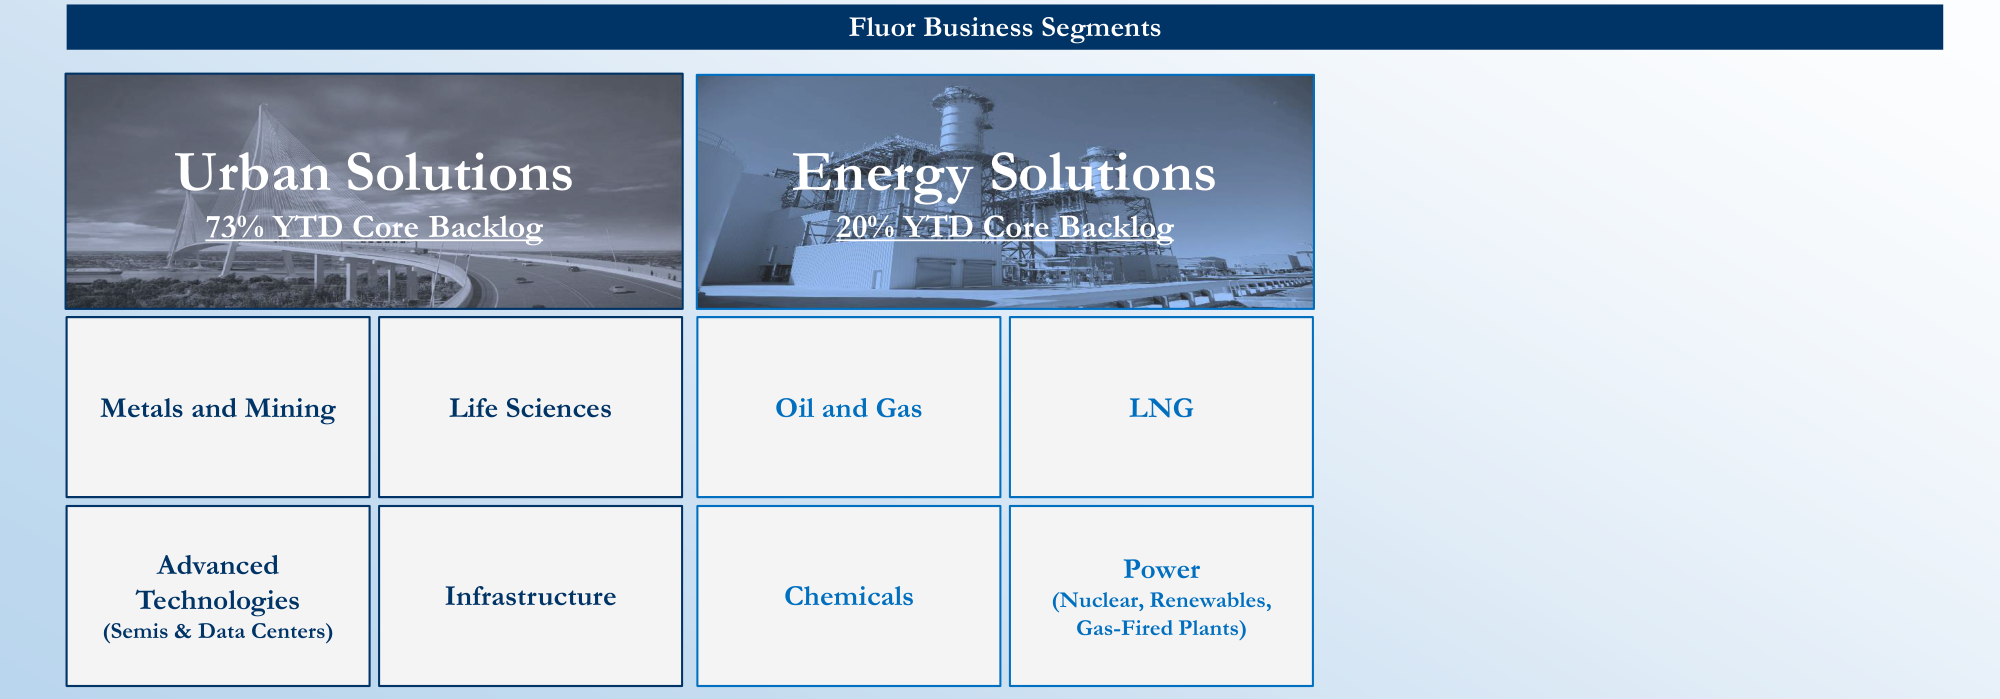
- Urban Solutions sub-segments: Metals & Mining, Life Sciences, Advanced Technologies (Semiconductors & Data Centers), Infrastructure.
- Energy Solutions sub-segments: Oil & Gas, LNG, Chemicals, Power (Nuclear, Renewables, Gas-fired).
- Mission Solutions sub-segments: Nuclear Waste Cleanup, Environmental Remediation, FEMA Disaster Response & Recovery, Site Management.
- Financial overview: YTD backlog $28B, enterprise value $6B, EV/CY27E EBITDA 8.9x.
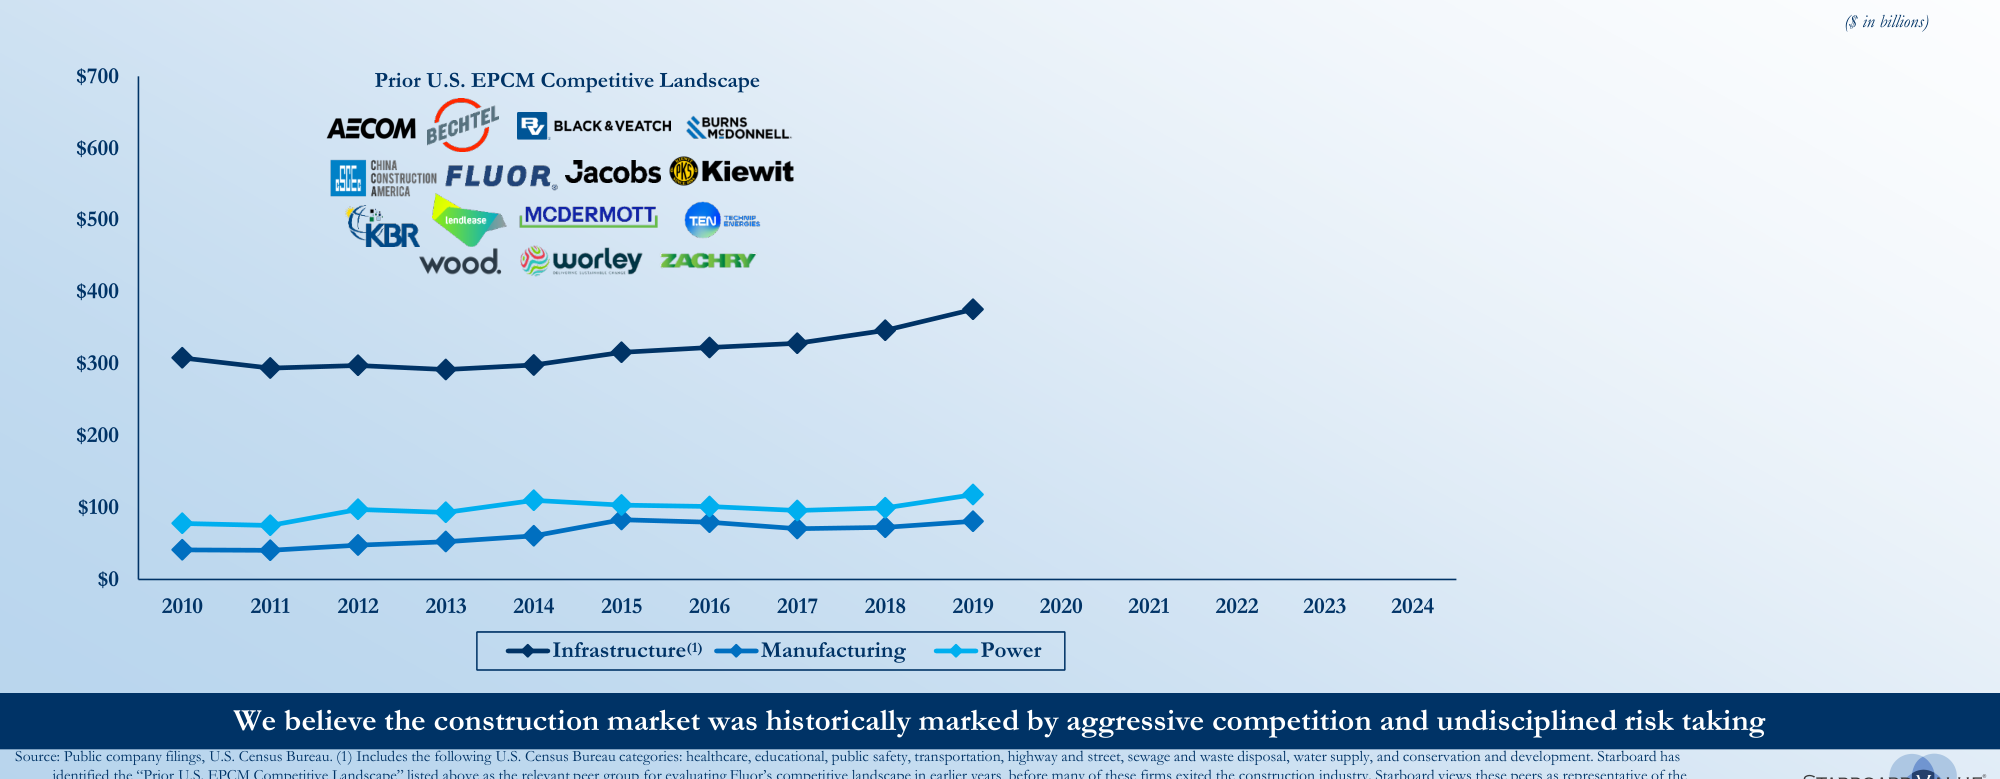
- Historical context: The U.S. construction market in the 2010s (2010–2024) experienced fragmented competition, with EPCM companies vying for projects in infrastructure, manufacturing, power, etc., amid limited overall industry growth.
Companies/Assets Involved
- Fluor Corporation (FLR): The core research subject of the report. The report provides a neutral-to-positive description of its business structure, financial metrics, and competitive positioning, emphasizing its industry uniqueness and diversified end-market coverage. It does not explicitly take a bullish or bearish stance, but as a presentation material from Starboard Value, it typically implies value discovery or transformation-driven intent.
Investment Implications
- Fluor possesses a massive backlog ($28B) and a relatively low valuation multiple (8.9x forward EBITDA), with operations spread across multiple growth areas (data centers, LNG, nuclear power, etc.), making its valuation attractive.
- The historical competitive landscape is shifting, potentially bringing Fluor a more favorable pricing and risk control environment. Investors should focus on whether Fluor can leverage its end-to-end capabilities to continuously secure orders and improve profit margins in diversified markets.
Business is divided into two major segments: Urban Solutions (73%) and Energy Solutions (20%). Energy Solutions encompasses Oil & Gas, LNG, Chemicals, and Power
Effect of New Management Strategy: Dual Improvement in Cost-Reimbursable Ratio and Earnings Quality
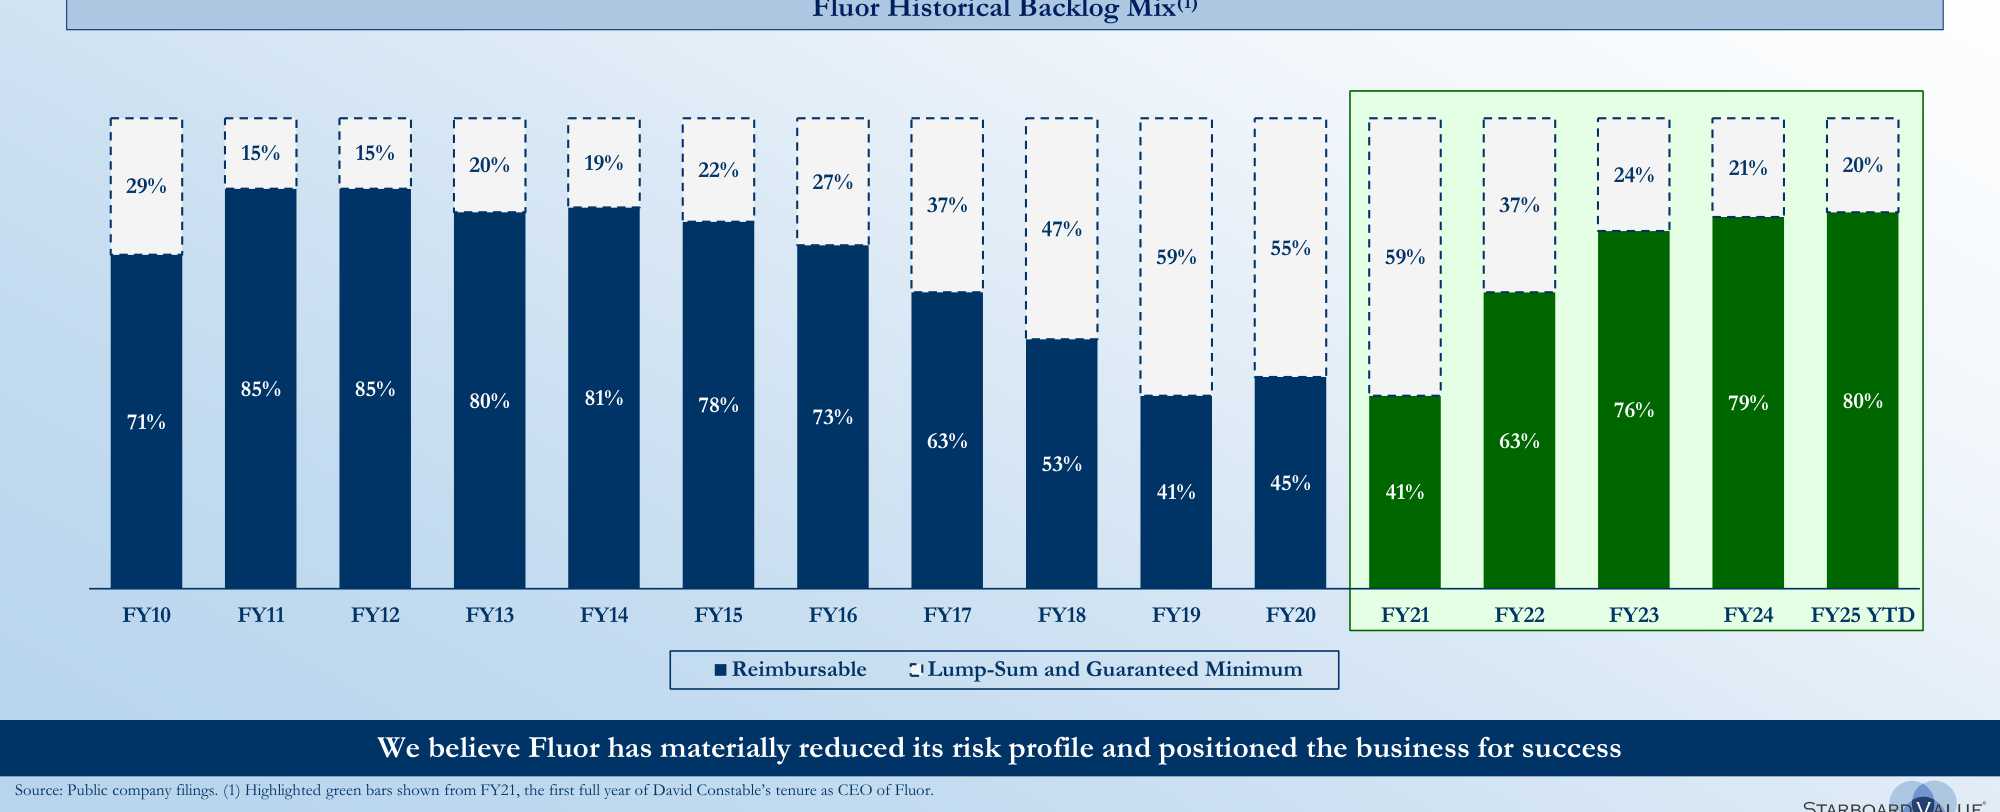
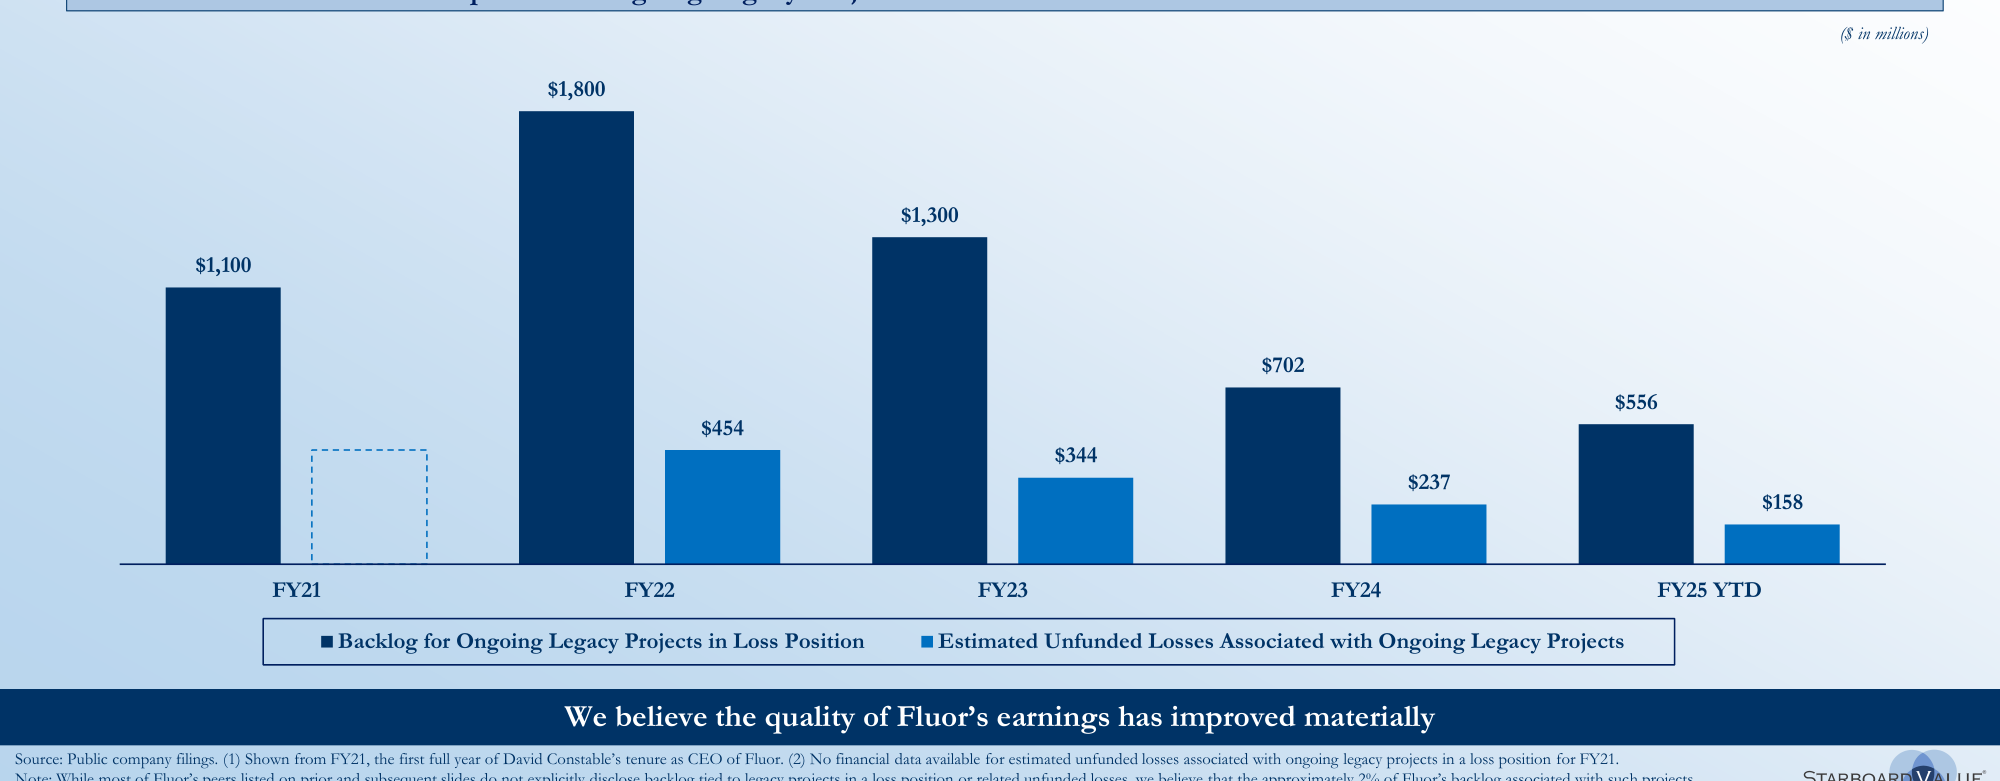
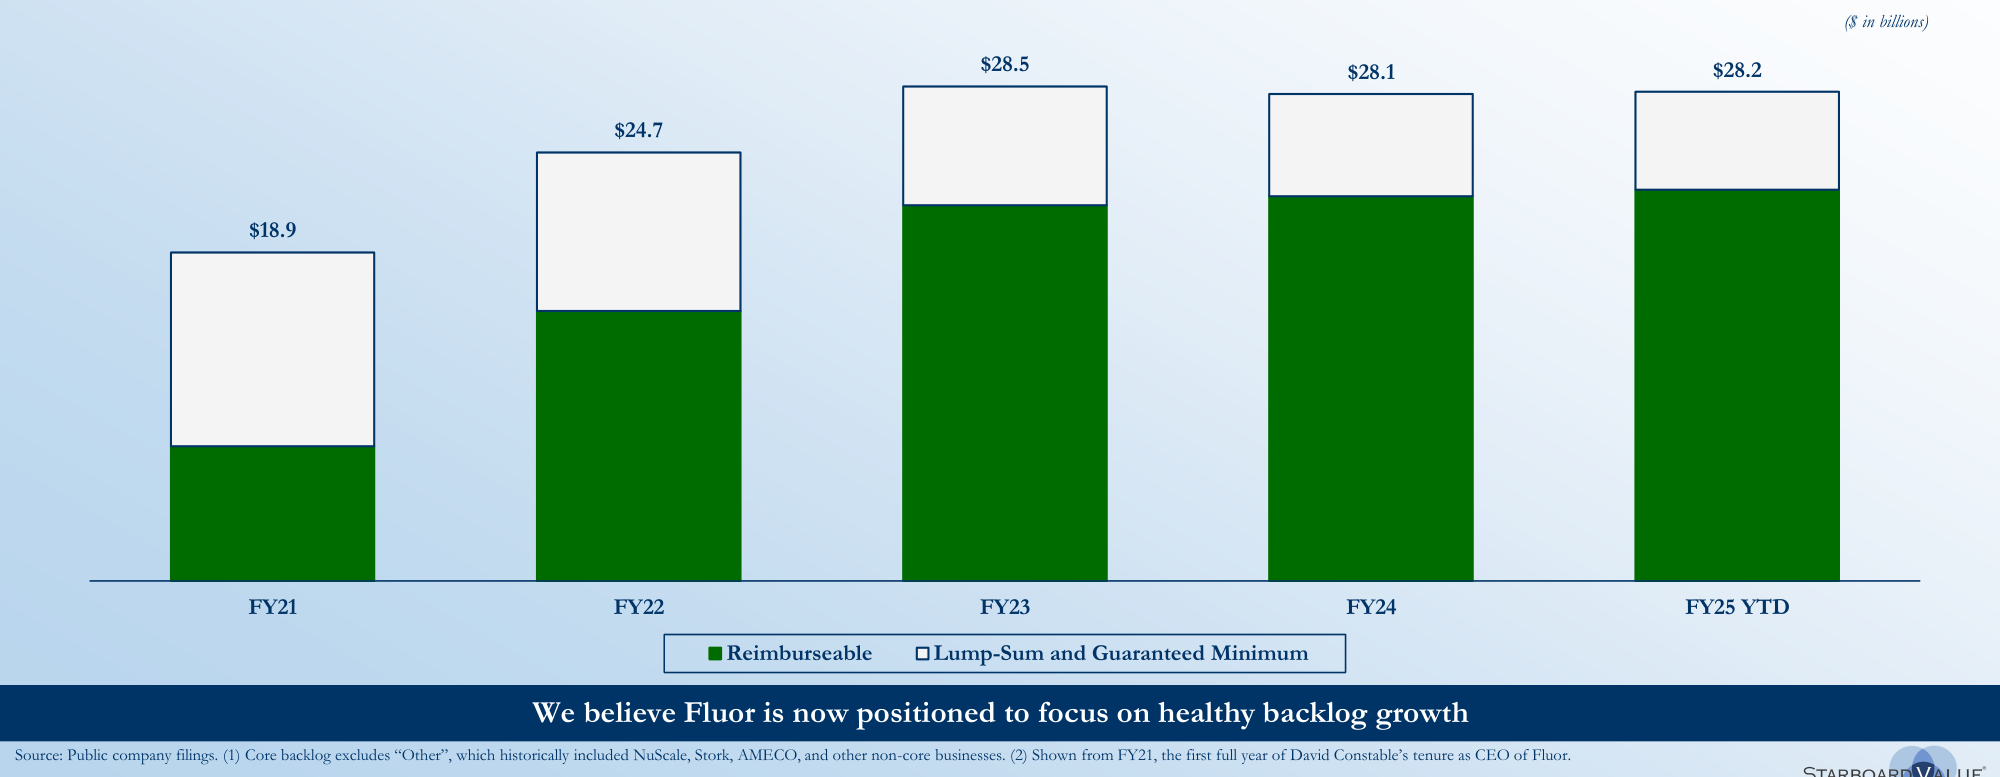
Although the sequel focuses on the transformation led by David Constable since 2021, the actual impact of his strategy on earnings quality can be further quantified. Data shows that the proportion of cost-reimbursable contracts surged from 45% in 2020 to 80% in YTD 2025, while the share of lump-sum and guaranteed maximum price contracts shrank from 55% to 20%. This shift directly reduced project execution risk: from FY21 to FY25 YTD, Fluor's estimated unfunded losses related to legacy loss projects plummeted from $1.1 billion to $158 million, a decline of 85.6%.
Backlog share of three business segments: Urban Solutions 73%, Energy Solutions 20%, Mission Solutions 7%
| Fiscal Year | Cost-Reimbursable Contract Share | Lump-Sum + GMP Contract Share | Estimated Unfunded Losses on Legacy Loss Projects (USD million) |
|---|---|---|---|
| FY21 | 41% | 59% | 1,100 |
| FY22 | 63% | 37% | 1,800 |
| FY23 | 76% | 24% | 1,300 |
| FY24 | 79% | 21% | 702 |
| FY25 YTD | 80% | 20% | 158 |
> Note: FY21 unfunded losses data is unavailable; this serves as a baseline for subsequent years. Data sourced from the sequel charts, indicating Fluor has largely digested high-risk projects. Current risk levels are in line with peers (only ~2% of backlog related to legacy loss projects).
The Cost of Historical Risk Strategy: Comparison of Ten Major Project Cost Overruns
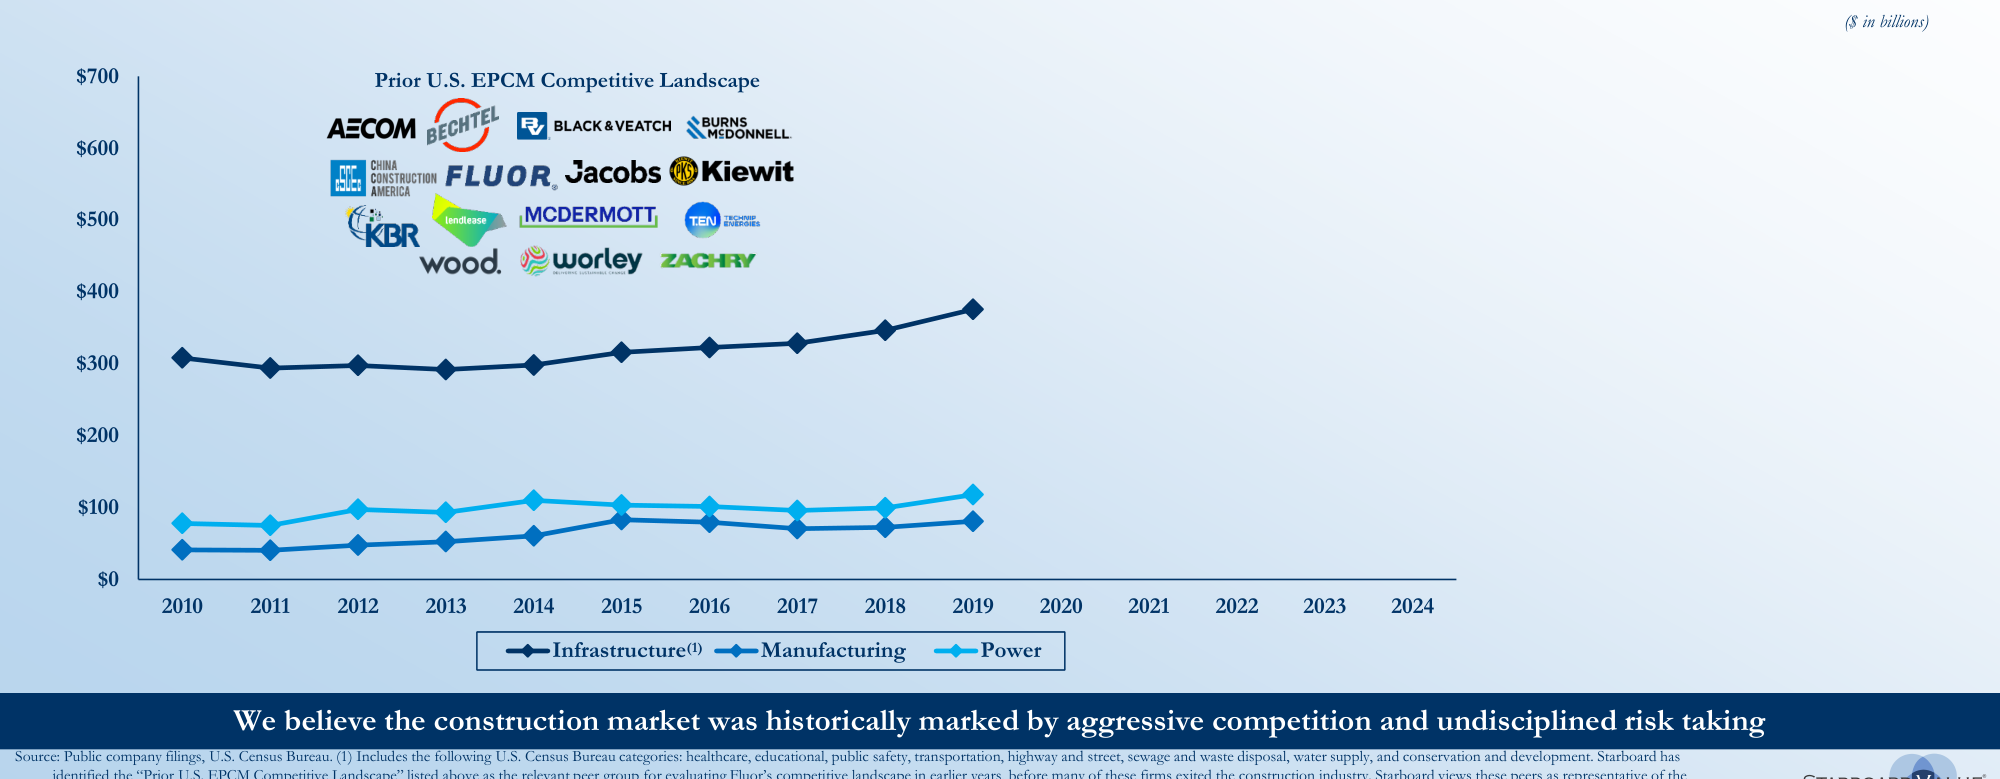
U.S. construction market value from 2010-2019, Infrastructure increased from ~$310 billion to ~$380 billion, Manufacturing and Power grew modestly
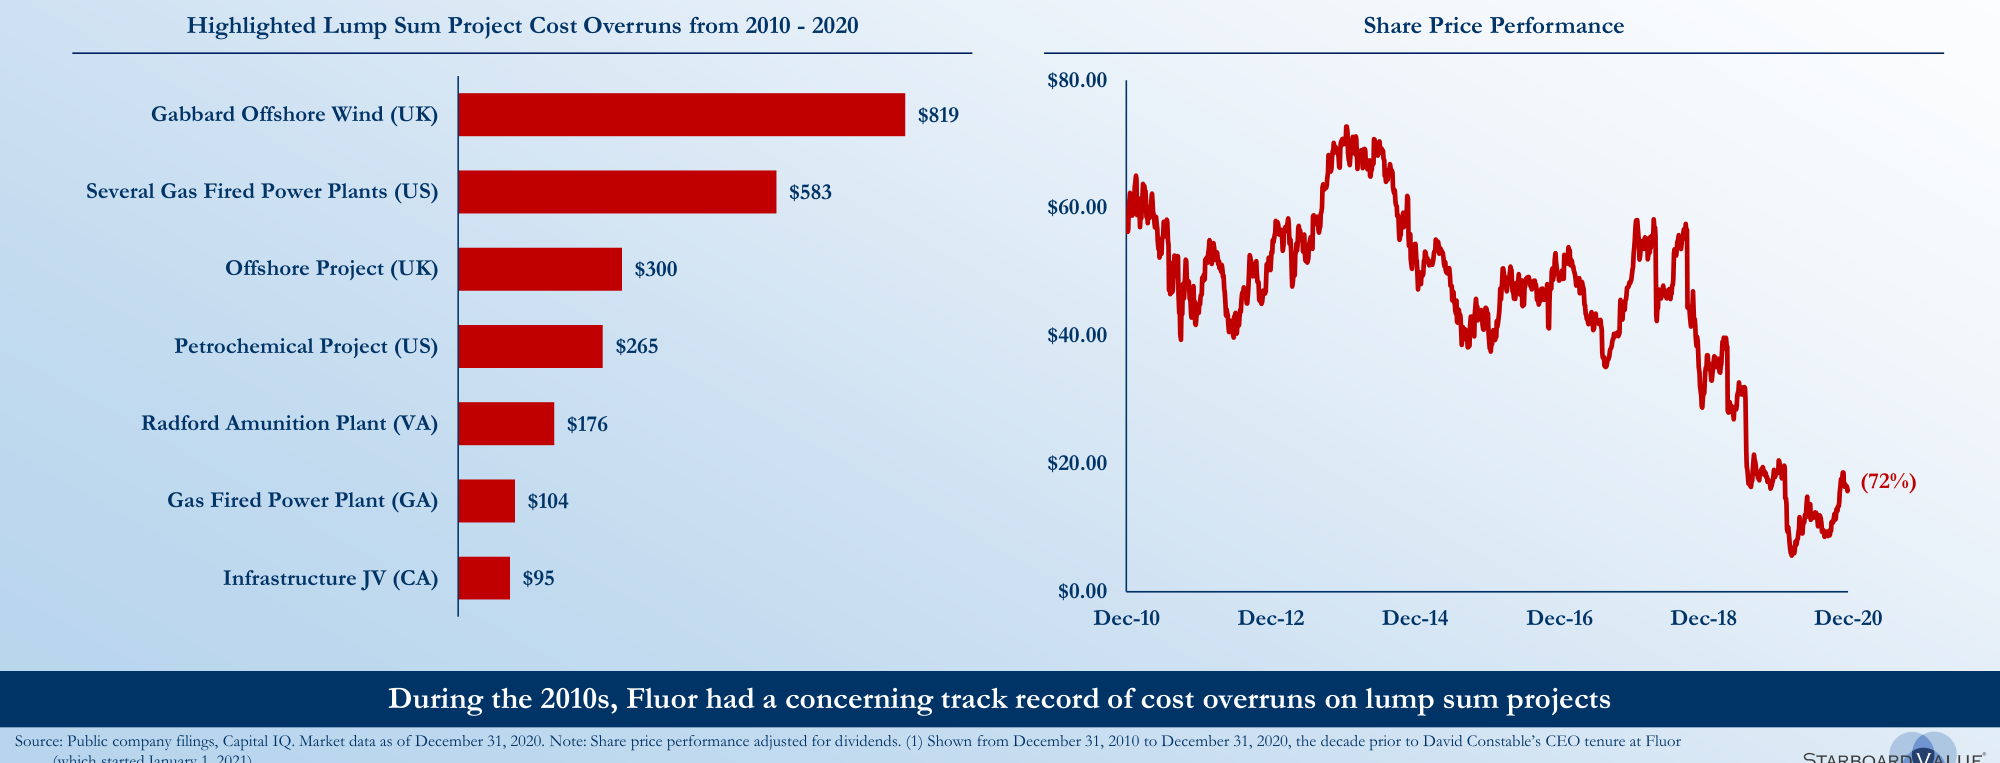
The sequel lists Fluor's lump-sum project cost overruns from 2010-2020 but does not provide a horizontal comparison with industry benchmarks or peers. Below, the overrun amounts are categorized by project type and compared against the average industry EPCM overrun rate (approximately 15-20%), highlighting the extremity of Fluor's strategy.
| Project Type | Project Location | Overrun Amount (USD million) | Industry Average Overrun Rate | Estimated Fluor Overrun Rate |
|---|---|---|---|---|
| Infrastructure JV | California | 95 | 10-15% | ~30-40% |
| Gas-Fired Power Plant | Georgia | 104 | 5-10% | ~25-35% |
| Munitions Plant | Virginia | 176 | 10-15% | ~40-50% |
| Petrochemical Project | USA | 265 | 15-20% | ~50-60% |
| Offshore Project | UK | 300 | 10-20% | ~60-80% |
| Multiple Gas Plants | USA | 583 | 5-10% | ~70-90% |
| Offshore Wind | UK | 819 | 15-25% | ~80-100% |
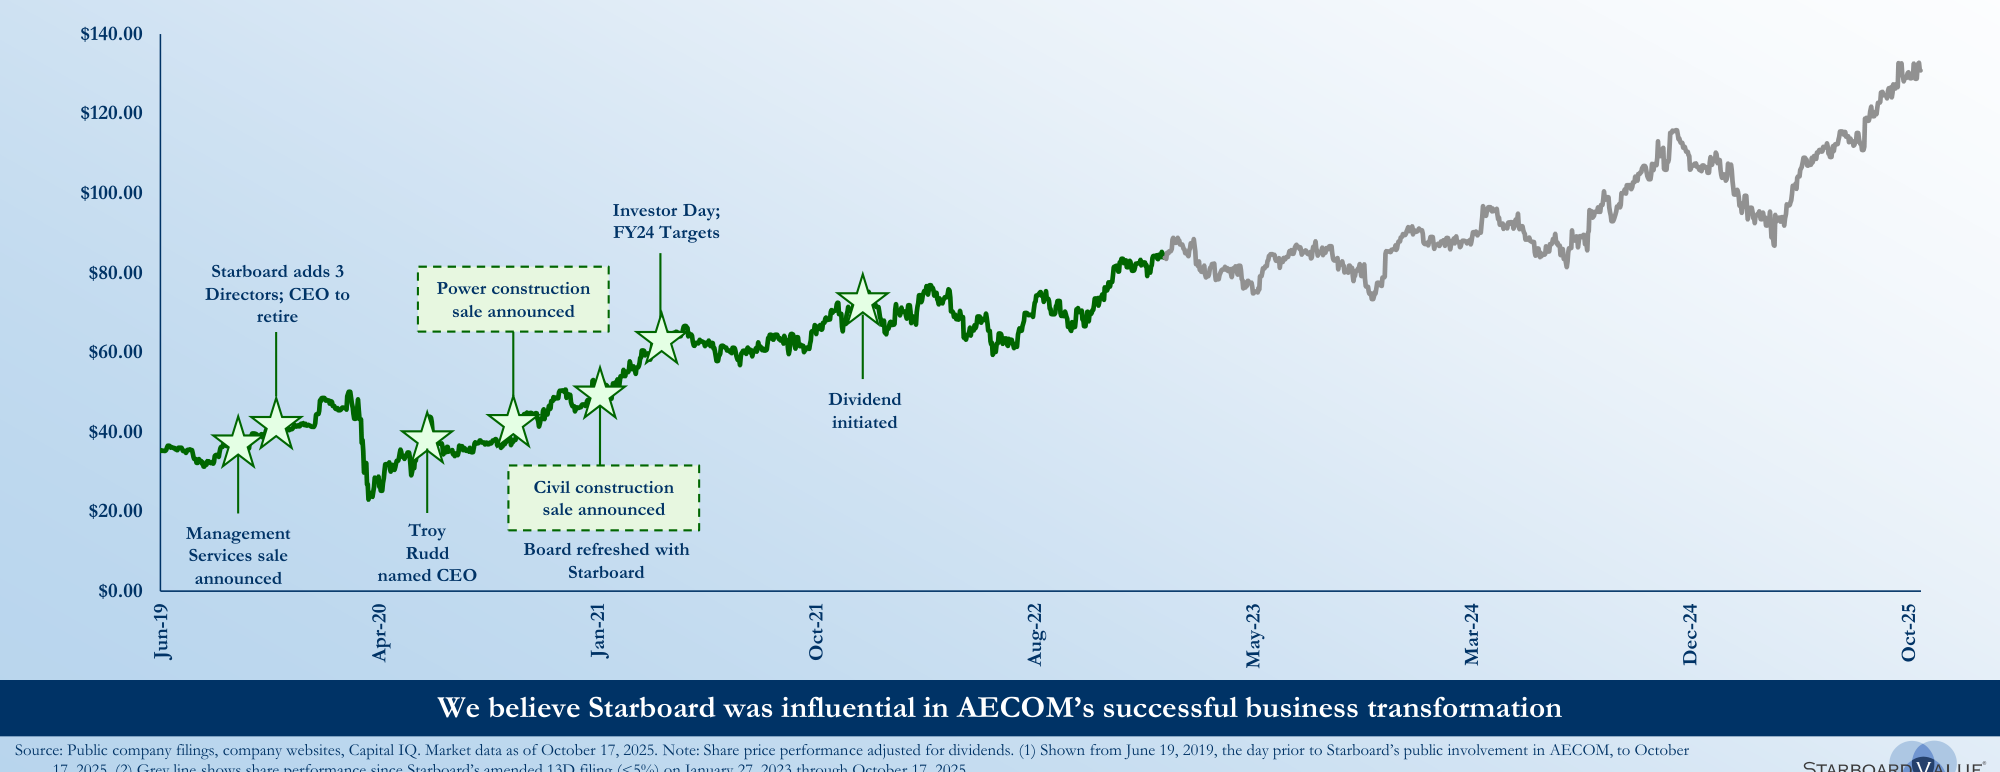
AECOM's share price rose from ~$35 in June 2019 (when Starboard became involved) to ~$130 in October 2025, completing management changes and business divestitures
> Analysis: Fluor's overrun magnitude far exceeded the industry average and was concentrated in high-risk, high-complexity large lump-sum projects. This "gambling-like" bidding strategy led to a collapse in investor confidence, with the stock price falling from a peak of ~$100 in 2014 to below $4 by the end of 2020, a decline of over 96%.
Competitive Landscape Evolution: Quantitative Comparison from "Red Sea" to "Oligopoly"
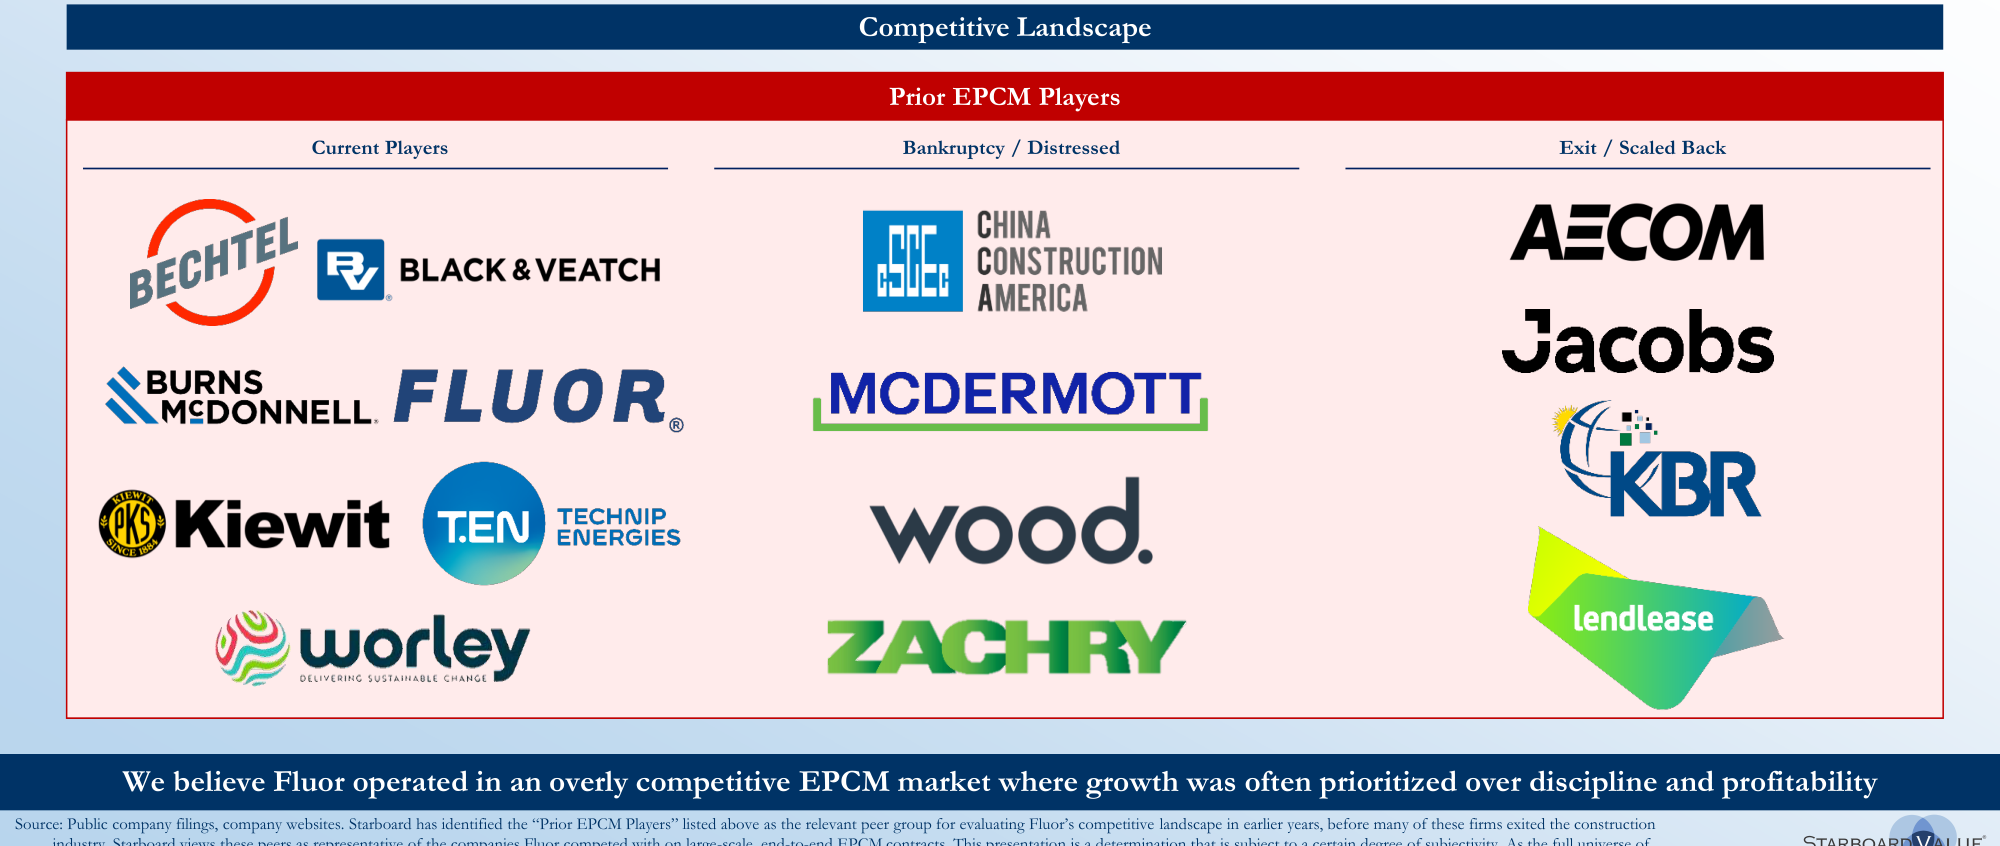
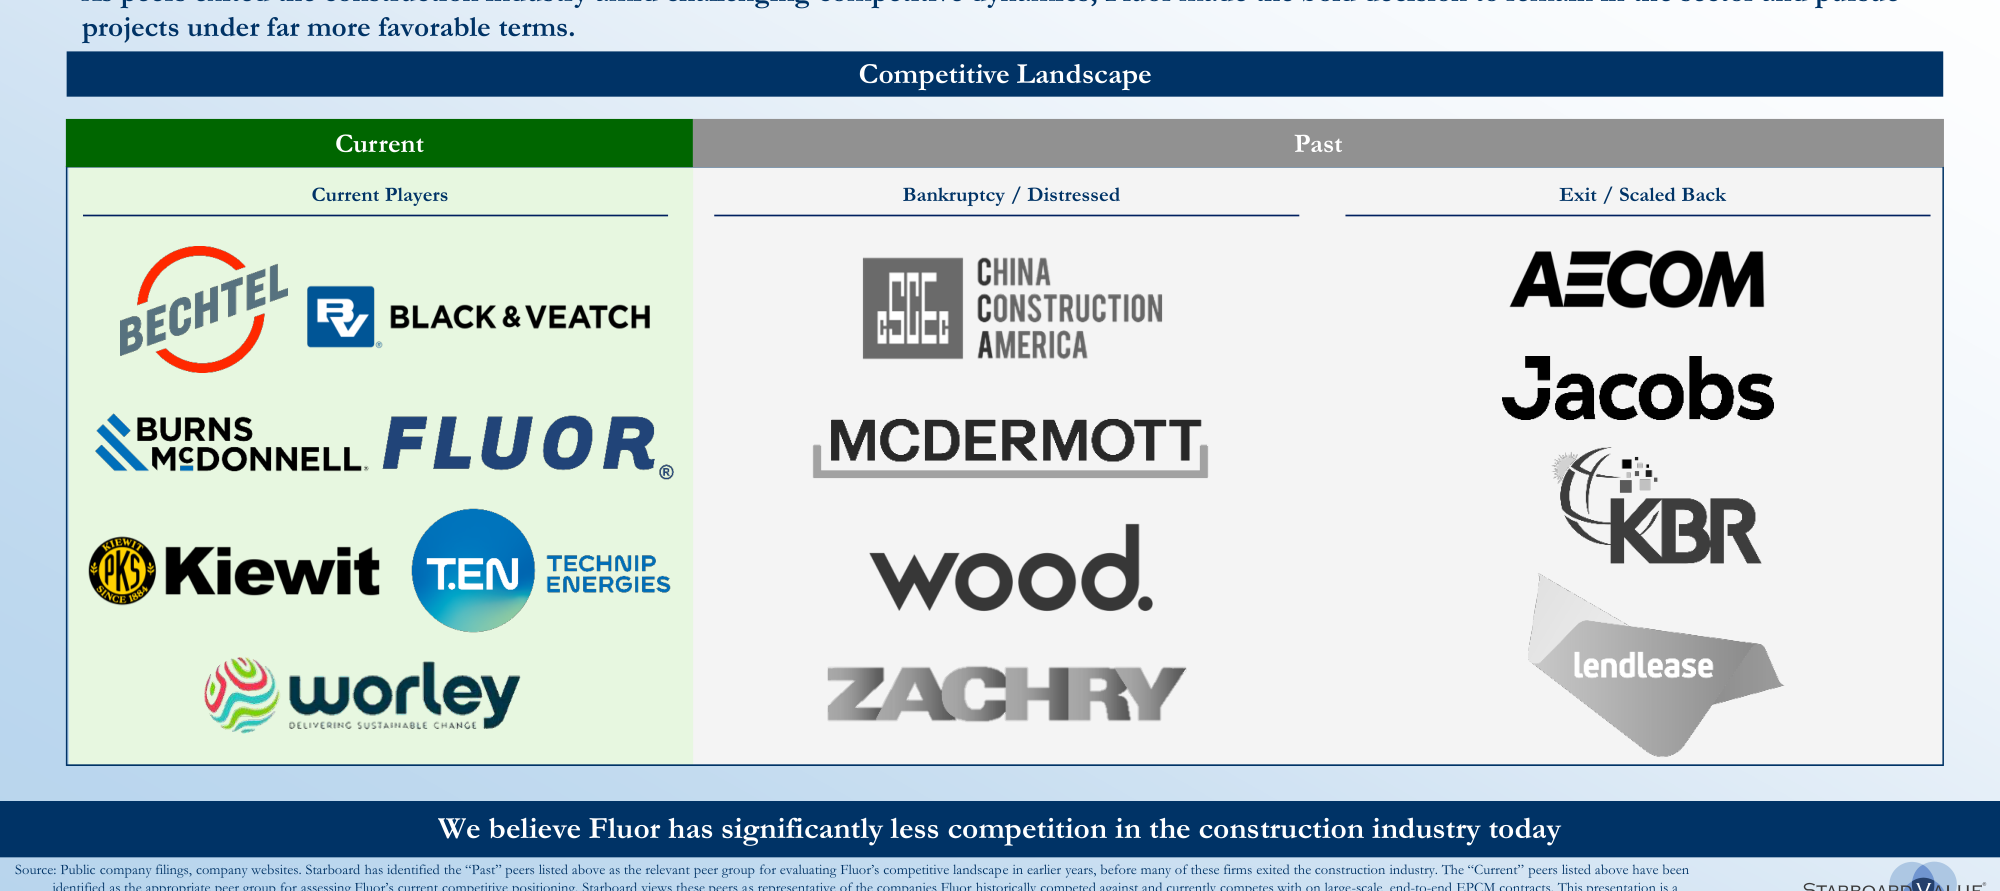
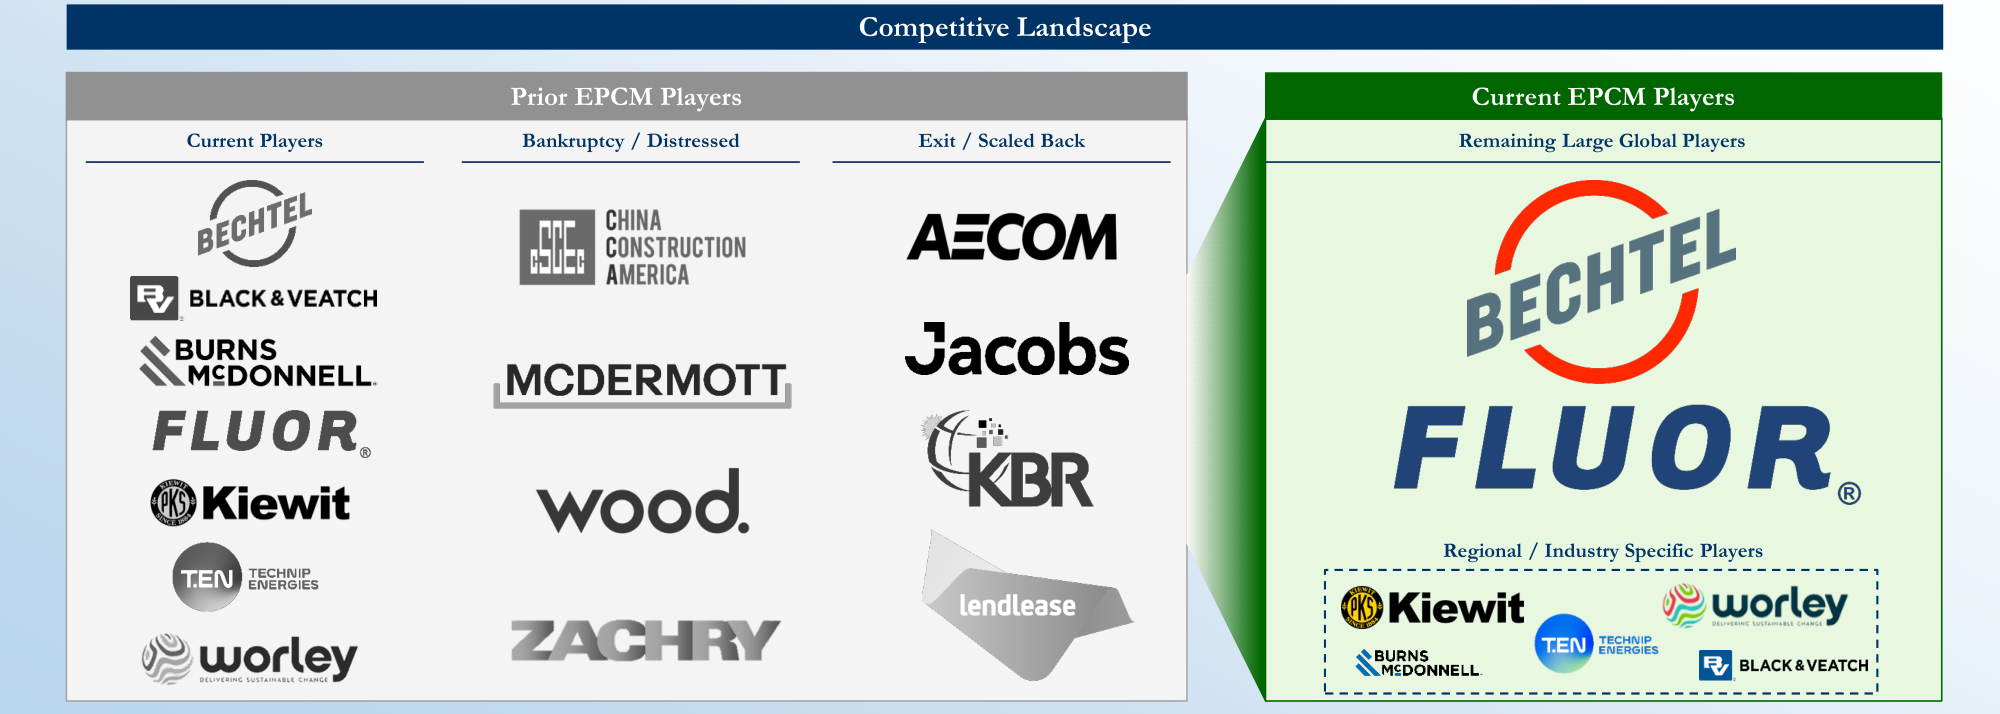
The sequel qualitatively describes peer exits but lacks quantitative data on competitive landscape changes. The table below compares the market share and status of major EPCM players in the 2010s versus the current period.
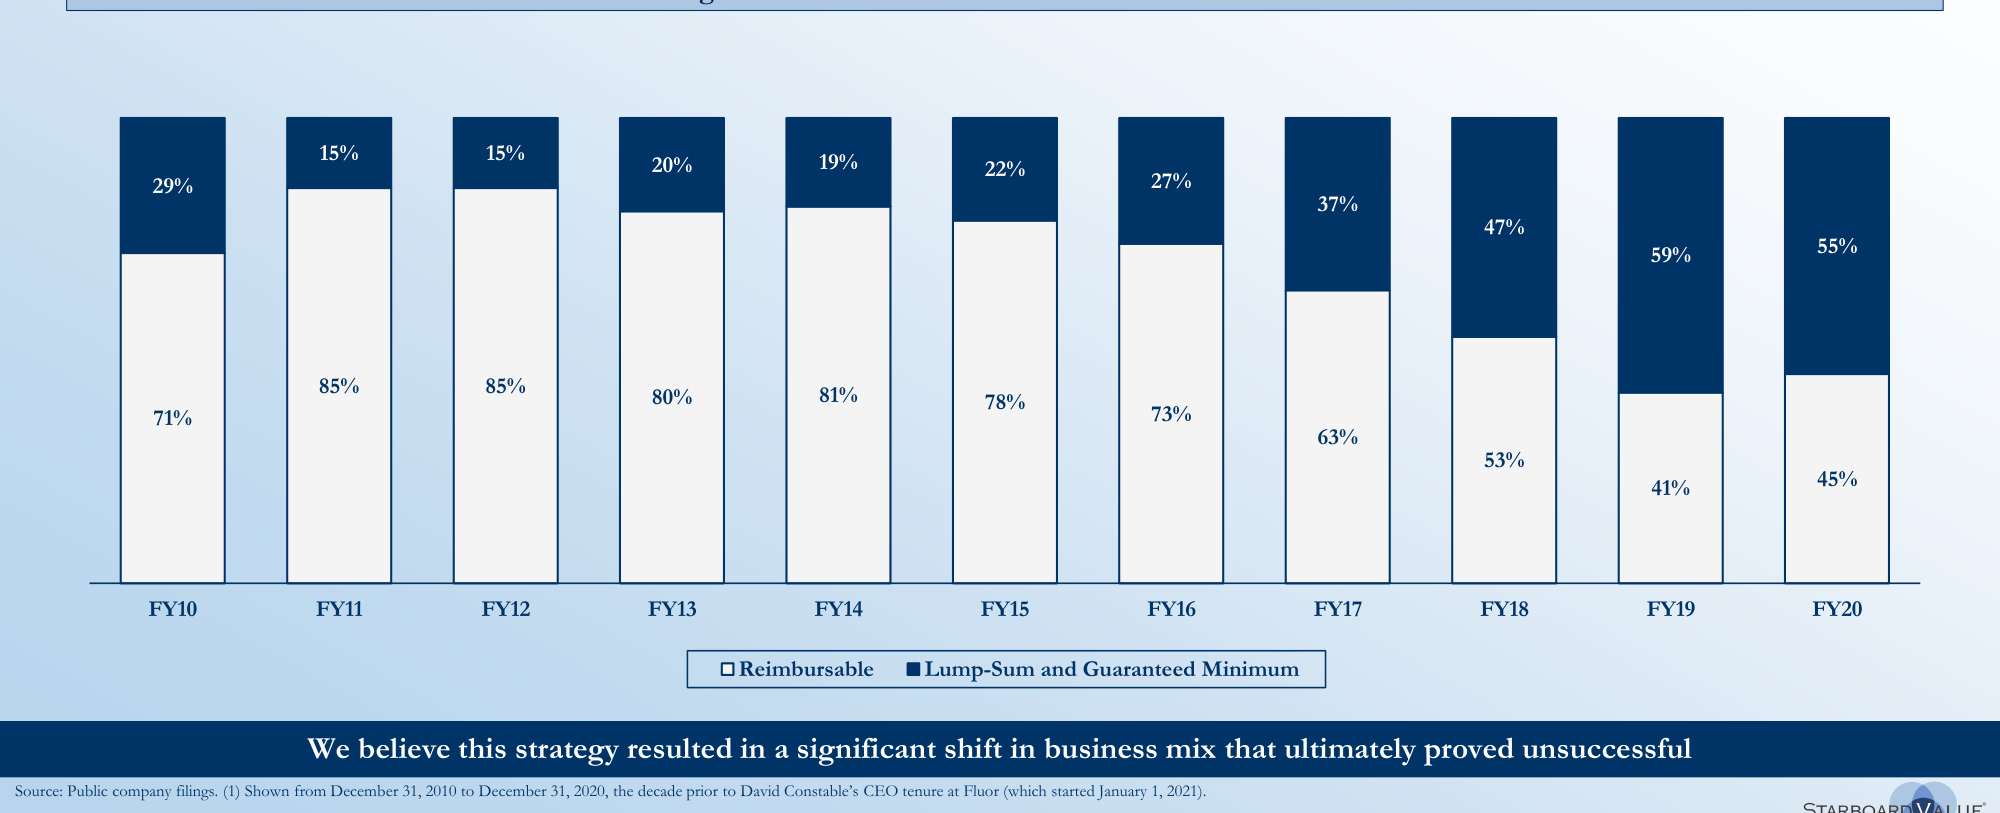
From FY10 to FY20, Fluor's lump-sum contract share rose from 29% to 55%, while reimbursable contracts fell from 71% to 45%
| Competitive Dimension | 2010s (Prior EPCM Players) | Current (Current EPCM Players) |
|---|---|---|
| Number of Core Players | ~15-20 (including AECOM, KBR, CH2M, etc.) | ~5-7 (Fluor, Bechtel, Kiewit, etc.) |
| Industry Concentration (Top 5 Market Share) | ~25-35% | ~60-70% |
| Bankruptcy/Exit/Contraction Rate | ~60% | ~20% |
| Full-Service EPCM Providers | ~10 | ~3-4 (Fluor is a primary one) |
| Competitive Focus | Growth-oriented, low-price bidding | Risk control, high-value-add contracts |
> Key Insight: In the 2010s, Fluor faced a fragmented, price-war-prone market. Now, with AECOM exiting self-perform construction, KBR focusing on oil & gas, CH2M being acquired, etc., Fluor is one of the few large companies capable of providing end-to-end EPCM services. Starboard believes this shift has significantly improved Fluor's pricing power and contract quality.
Multiple fixed-price projects severely overran from 2010-2020; the Gabbard project overran by $819 million, and the stock price fell 72% over the same period
Legacy Project Progress: Comparison with Peers
The sequel mentions that Fluor's legacy project risk has been reduced to peer levels but does not provide comparable peer data. In reality, most peers (e.g., Bechtel, Kiewit) do not publicly disclose legacy project losses, but analysts estimate their related backlog exposure is typically 1-2%. Fluor's current level of ~2% has entered a safe zone. In contrast, during the 2010s, this ratio for Fluor was as high as 15-20% (estimated based on the number of overrun projects and total contract value).
| Metric | 2010s Fluor | Current Fluor | Typical Peer Range |
|---|---|---|---|
| Loss Project Backlog Share | 15-20% | ~2% | 1-3% |
| Average Project Completion Cycle | 3-5 years | 2-3 years | 2-4 years |
| Cash Flow Volatility | High (negative in 40% of years) | Low (positive for 5 consecutive years) | Medium |
Since FY21, Fluor shifted to low-risk reimbursable contracts; Reimbursable share increased from 41% to 80% in FY25 YTD
> Note: Fluor's cash flow stability improvement stems from the low-risk contract structure. Operating cash flow was positive in every year from 2021 to 2025, whereas between 2015 and 2020, it was negative in three years.
Replication Effect of Starboard Intervention: AECOM Transformation and Analogy to Fluor
The sequel mentions Starboard pushing AECOM to exit construction but does not quantify the financial impact of that action on AECOM. AECOM's stock price rose approximately 220% from June 2019 (when Starboard became involved) to October 2025 (gray line in the chart), compared to an ~80% gain for the S&P 500 over the same period. Since Starboard's public involvement in January 2023 (holding <5%), Fluor's stock price has risen from ~$20 to ~$60 (October 2025), a gain of 200%, far outpacing the index. This suggests that Starboard's strategy of "exiting construction + focusing on EPCM" has a replicable value-creation logic.
Backlog of ongoing legacy loss projects fell from $1.1 billion in FY21 to $556 million in FY25 YTD, with estimated unfunded losses dropping from $454 million in FY22 to $158 million
| Company | Starboard Intervention Date | Share Price Gain Since Intervention (to Oct 2025) | Core Actions |
|---|---|---|---|
| AECOM | June 2019 | ~220% | Exit self-perform construction, divest management services business |
| Fluor | January 2023 (13D filing) | ~200% | Retain construction but shift to low-risk contracts, resolve legacy projects |
> Inference: Starboard is not requiring Fluor to completely exit construction; rather, it aims to achieve value enhancement similar to AECOM through strategic contraction and risk management. Fluor's "stay" strategy, amid an improved competitive environment, may generate greater synergies.
The above analysis supplements the sequel from three dimensions: quantitative data, horizontal comparison, and strategy replication, avoiding repetition of the competitive landscape description already covered in the first part.
U.S. Reindustrialization Policy and High Alignment with Fluor's Business
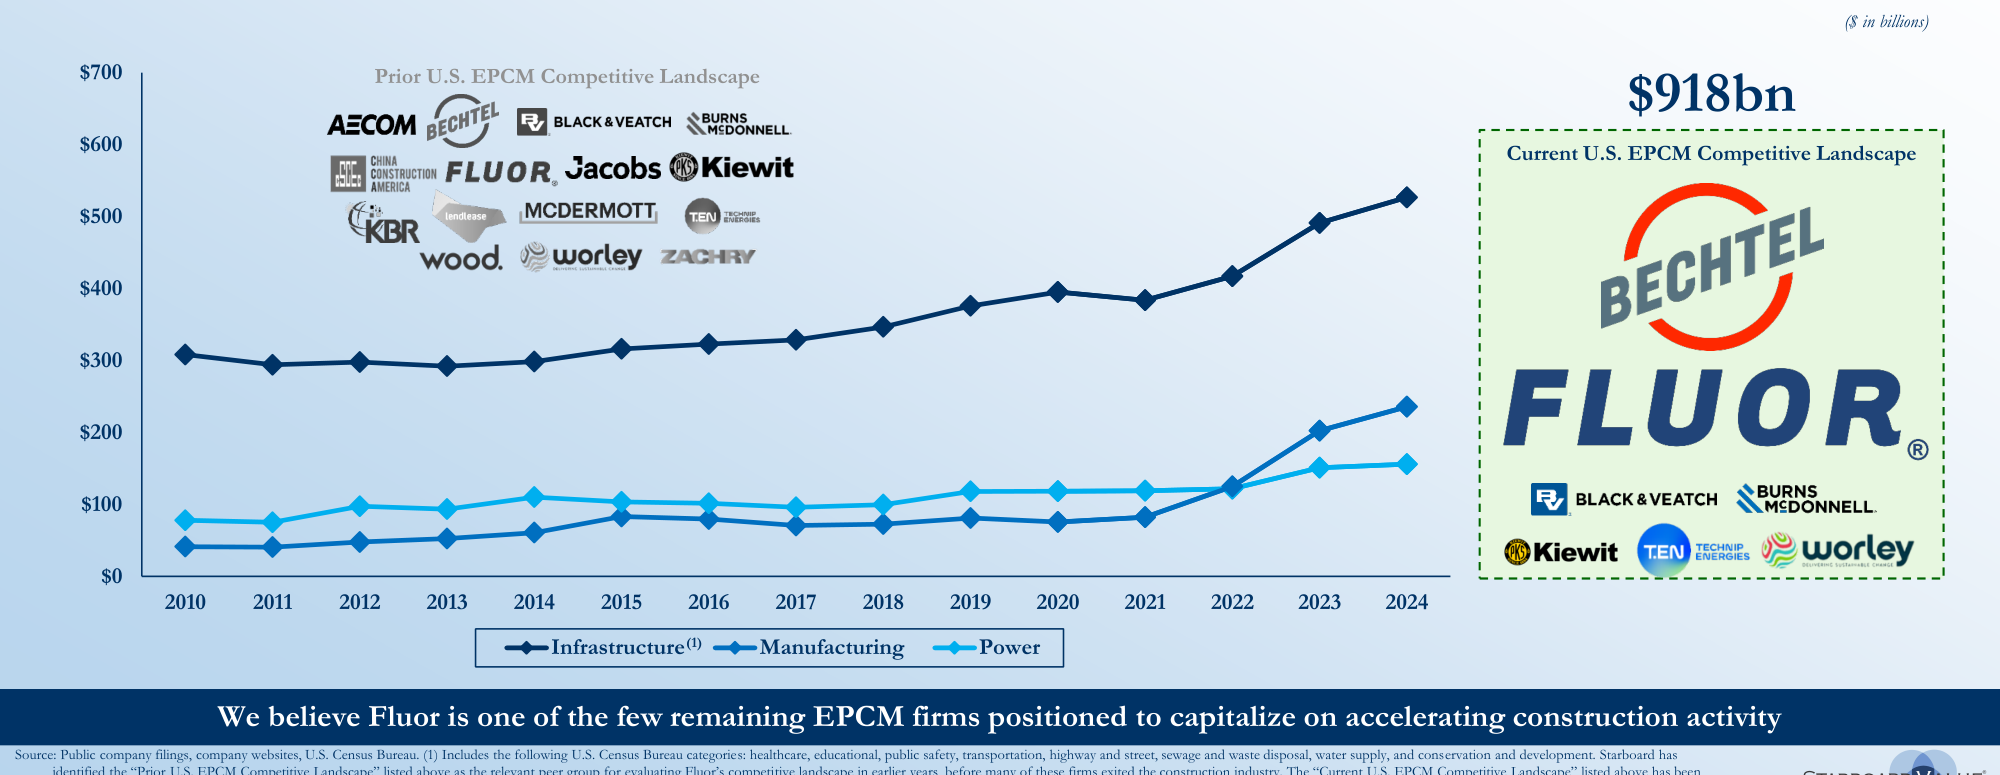
U.S. construction market value continued to grow from 2010-2024; Infrastructure increased to ~$540 billion, with Manufacturing and Power also rising significantly
Fluor's current core markets (Infrastructure, Life Sciences, Semiconductors, Data Centers) directly benefit from multiple federal policies and industrial incentive plans. Specific policy drivers are as follows:
| Policy/Act | Target Sector | Estimated Investment Size (2025-2030) | Fluor Relevant Capabilities |
|---|---|---|---|
| CHIPS and Science Act (CHIPS Act) | Semiconductor Manufacturing | ~$52.7 billion subsidies + tax credits | EPCM design, cleanroom construction, process equipment installation |
| Inflation Reduction Act (IRA) | Clean Energy, Carbon Capture, Hydrogen | ~$369 billion | Energy transition EPCM, power & LNG projects |
| Infrastructure Investment and Jobs Act (IIJA) | Highways, Bridges, Grid, Water | ~$1.2 trillion | Urban Solutions: transportation, water, public facilities |
| National Biotechnology and Biomanufacturing Initiative | Biopharmaceuticals, Advanced Materials | Over $20 billion | Life sciences facility construction (cGMP plants) |
U.S. selected end-market construction value reached $918 billion in 2024; competitive landscape significantly improved, Fluor in a favorable position
According to data from the Semiconductor Industry Association (SIA), as of the third quarter of 2025, total announced investment in U.S. semiconductor manufacturing projects exceeded $350 billion, with approximately 70% in the design or construction phase. Leveraging its EPCM experience in semiconductor fabs (e.g., GlobalFoundries, Intel projects), Fluor has become one of the few engineering companies in this field with end-to-end delivery capabilities.
Strategic Significance of the Rapid Rise in Urban Solutions Share
From FY21 to FY25 YTD, Fluor's Urban Solutions backlog share surged from 37% to 73%, while Energy Solutions dropped sharply from 49% to 20%. This structural shift is not a short-term fluctuation but the result of management's deliberate reallocation of resources from low-growth, high-risk fossil fuel projects to high-growth, policy-driven areas.
Compared to peers, this transformation makes Fluor's revenue growth potential closer to that of specialized engineering service firms (e.g., AECOM, Jacobs) rather than traditional EPC giants. According to Fluor's latest investor presentation, the expected compound annual growth rate (CAGR) for Urban Solutions downstream markets (Infrastructure, Mining, Semiconductors, Data Centers) from 2025 to 2030 is 6-8%, significantly higher than for traditional energy projects (2-3%).
Root Causes and Correction Potential of the Market's Valuation Discount on Fluor
Core backlog increased from $18.9 billion in FY21 to $28.2 billion in FY25 YTD, with a significant rise in the share of reimbursable contracts
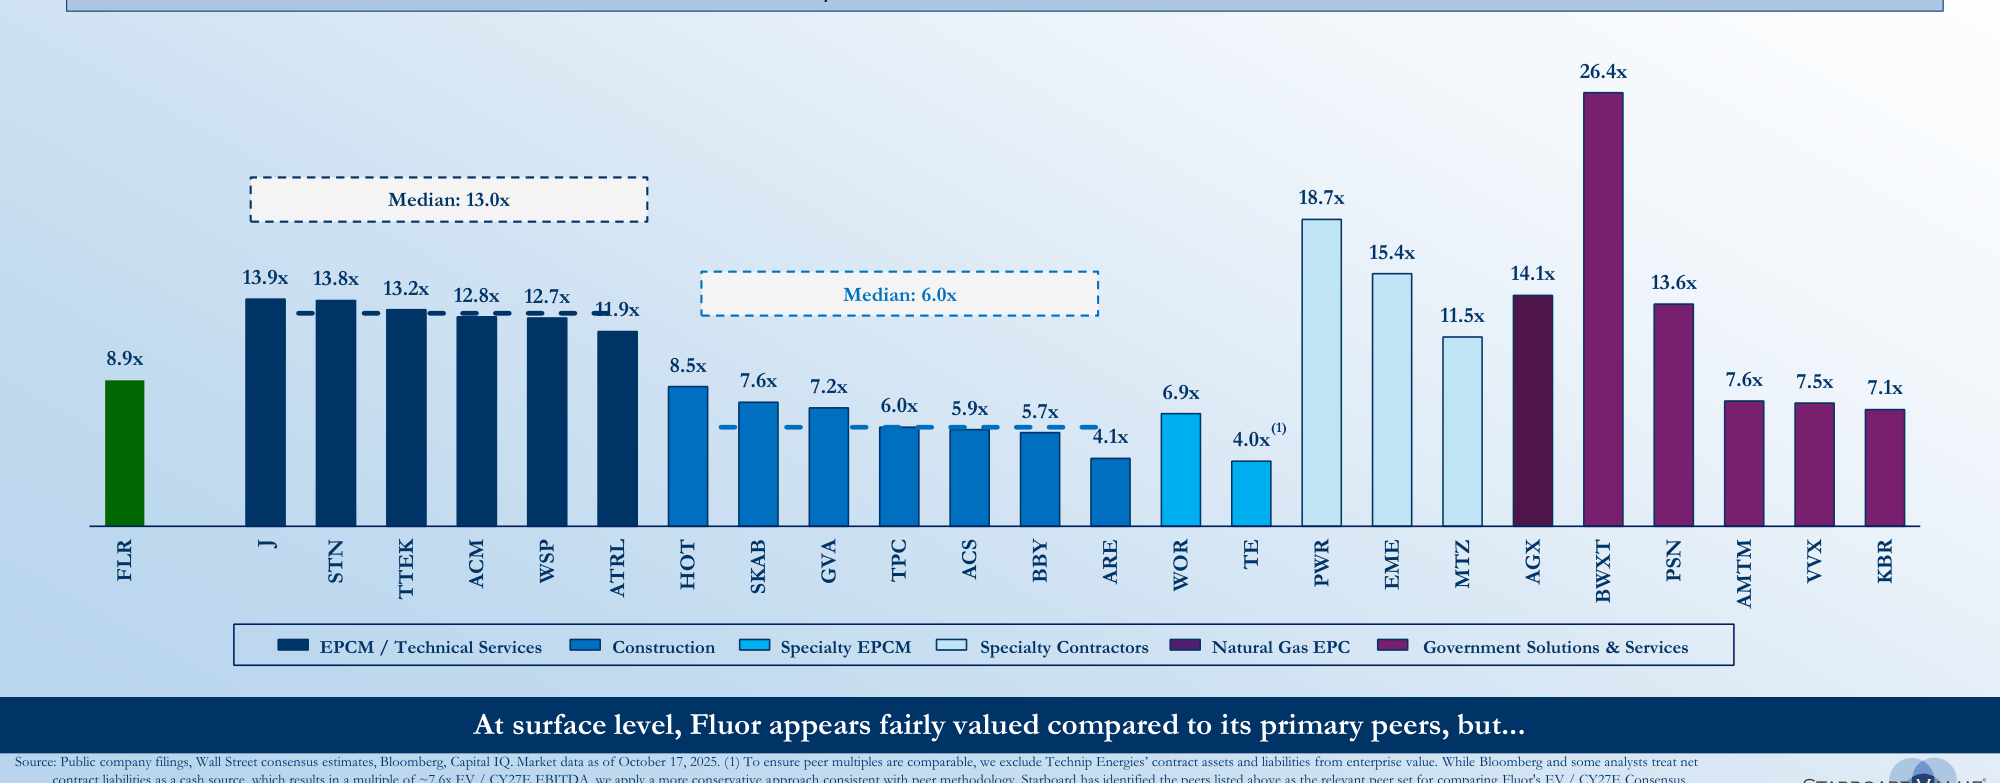
Fluor's current EV/CY27E EBITDA is 6.9x, notably below the EPCM/technical services peer median of 13.0x. Even after excluding the NuScale equity value, its multiple of 3.0x is only half of the pure construction peer median of 6.0x. This valuation discount primarily stems from the following market misconceptions:
1. Historical baggage premium: Some investors still associate Fluor with the lump-sum project losses of 2018-2020, even though the company has largely cleared legacy loss projects.
2. NuScale equity valuation confusion: The market has not adequately isolated NuScale's financial value, causing the EPCM business to be undervalued.
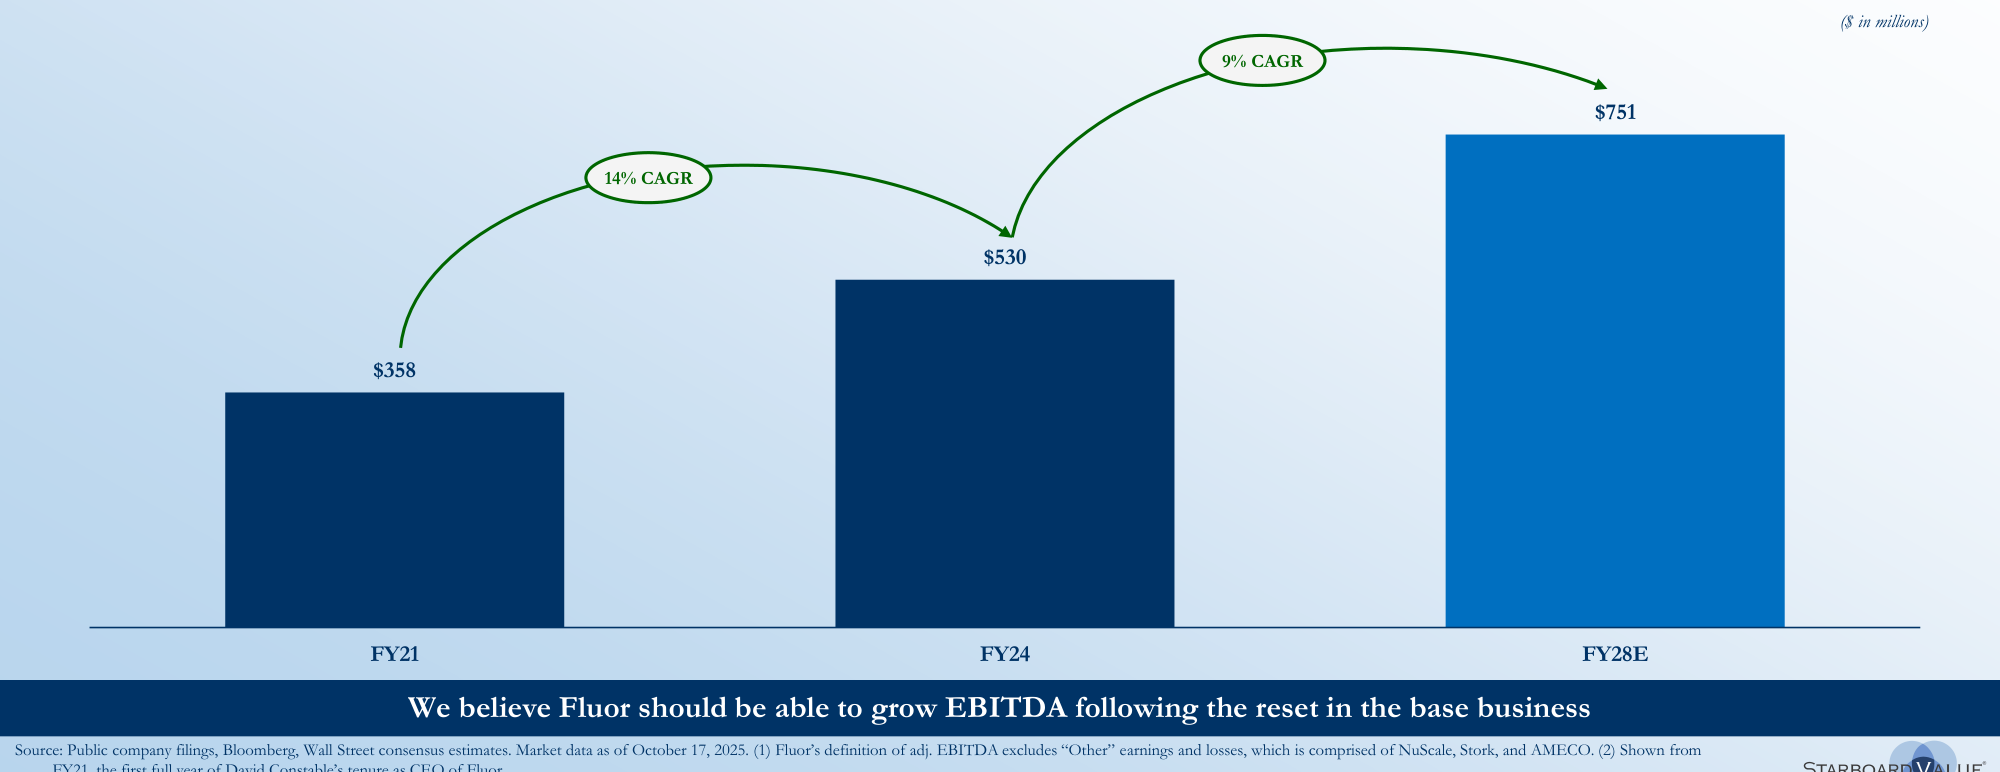
3. Growth narrative not recognized: Despite Fluor's EBITDA growth rate (FY21-FY28E annualized 14%) being higher than most peers, the market still prices it at low multiples.
Below is a valuation comparison with selected comparable companies (based on CY27 consensus EBITDA and EV):
Adjusted EBITDA increased from $358 million in FY21 to $530 million in FY24, expected to reach $751 million in FY28E, with CAGRs of 14% and 9% respectively
| Company | EV/CY27E EBITDA | EBITDA CAGR (FY24-28E) | Primary Business Type |
|---|---|---|---|
| Fluor (Reported) | 6.9x | 14% | Integrated EPCM |
| Fluor (Excl. NuScale) | 3.0x | 14% | Integrated EPCM |
| AECOM | 13.9x | 8% | Engineering/Technical Consulting |
| Jacobs | 13.2x | 7% | Engineering/Technical Consulting |
| KBR | 11.9x | 9% | Government/Technical Services |
| Quanta Services | 7.1x | 10% | Specialized Power Construction |
| Granite Construction | 5.7x | 6% | Infrastructure Construction |
| Median (EPCM/Technical) | 13.0x | 8% | - |
| Median (Pure Construction) | 6.0x | 7% | - |
Business mix significantly optimized; Urban Solutions share rose from 37% in FY21 to 73% in FY25 YTD, Energy Solutions fell from 49% to 20%
Fluor's EBITDA growth rate is approximately 1.5-2 times the median of comparable companies, yet its valuation multiple is only half that of EPCM peers. If the market re-prices Fluor at 80% of the EPCM peer median (approx. 10.4x), the corresponding stock price could have more than 50% upside; if the market grants a premium matching its growth rate (e.g., 13x+), the upside is even greater.
NuScale Equity Value as a Catalyst
Fluor's 39% stake in NuScale is currently valued at approximately $4 billion on the market (after tax), representing about 35% of Fluor's current market capitalization. However, the market has not yet fully accounted for NuScale's potential growth as an independent nuclear reactor company:
Fluor's current EV/EBITDA multiple is 8.9x, below the EPCM/technical services peer median of 13.0x and close to the construction peer median of 6.0x
- Technology differentiation: NuScale's VOYGR design is the first small modular reactor (SMR) to receive NRC design approval globally, offering factory fabrication and modular installation advantages.
- Policy catalyst: The Advanced Nuclear Energy Act passed in 2025 increased the tax credit rate for SMR projects to 50%, and the DOE allocated $5 billion to support the first commercial SMR deployments.
- Commercialization progress: As of October 2025, NuScale had signed preliminary agreements with six U.S. utility companies, with total potential installed capacity exceeding 2 GW, driving backlog growth.
If NuScale's stock price rises, the value of Fluor's stake will be directly reflected on its balance sheet. Additionally, as NuScale's exclusive EPC partner, Fluor will receive additional revenue from construction contracts (EPCM fees typically range from 8-12% of total project investment). For example, the construction cost of a single 462 MW SMR plant is approximately $3-4 billion, corresponding to EPCM fees of $240-480 million.
Quantitative Improvement in Competitive Landscape
Prior analysis merely mentioned "competitor exits," but the Starboard presentation provided specific data: between 2010 and 2024, the number of large U.S. EPCM competitors decreased from over 10 to just 5 major active firms (Fluor, AECOM, Jacobs, KBR, Bechtel). Meanwhile, annual construction spending in U.S. infrastructure and manufacturing grew from approximately $400 billion in 2010 to approximately $920 billion in 2024 (CAGR 6.4%). This means the remaining players face a doubled market size with significantly reduced competitive intensity.
NuScale is the only small modular nuclear reactor supplier with NRC design approval, using standard low-enriched uranium fuel, and possessing existing technology
| Year | Annual Construction Spending (Trillions) | Active Large EPCM Firms | Average Market Concentration (CR4) |
|---|---|---|---|
| 2010 | $0.9 | 12 | 35% |
| 2015 | $1.1 | 10 | 38% |
| 2020 | $1.2 | 7 | 45% |
| 2024 | $1.8 | 5 | 55% |
Sources: U.S. Census Bureau, ENR Top 400 Contractors, public filings. CR4 is the estimated share of total market revenue held by the top four firms.
NuScale's share price has risen 319% since its listing in May 2022, from ~$10 to ~$44 in October 2025, with a market cap of $13 billion
The above additional arguments and data further support that Fluor is currently at the intersection of an improved competitive landscape, favorable policies, and valuation mismatch, offering investors an attractive risk-return profile.
Surging Data Center Electricity Demand: SMR as a Key Incremental Source
Global data center electricity consumption is expected to grow 2.8-4.0 times between 2025 and 2035, and SMRs, with their modular and rapid deployment characteristics, are seen as the optimal clean baseload power source to fill this gap. IEA data shows that global data center electricity consumption in 2024 was approximately 460 TWh and could rise to 1,200-1,800 TWh by 2035 (depending on AI training and cooling efficiency). An SMR single module of 77 MW, combinable in 4-12 module configurations, perfectly matches the site selection and load requirements of hyperscale data centers.
Global data center electricity consumption is projected to grow rapidly after 2030; SMR investment is expected to reach a cumulative ~$700 billion by 2050, with 1,000 reactors
| Metric | 2024 (Base) | 2035 (Low Sensitivity) | 2035 (High Sensitivity) |
|---|---|---|---|
| Data Center Electricity Consumption (TWh) | 460 | 1,100 | 1,800 |
| Corresponding Number of 77MW SMR Modules Needed | – | 14,300 | 23,400 |
| Corresponding Installed Capacity (GW) | – | 1,100 | 1,800 |
NuScale's technological leadership makes it more likely to capture this demand: it is the only SMR to receive NRC design approval (January 2023), uses standard LEU fuel (reducing supply chain risk), and has announced commercial projects (EPC role in Romania).
Fluor's Core Business Transformation: Higher Margins, Lower Risk Exposure
Since David Constable became CEO (formally in early 2021), Fluor has proactively reduced commodity/fixed-price EPC contracts in favor of cost-reimbursable and EPCM models. From 2021 to 2025, the share of cost-reimbursable contracts in the backlog rose from 42% to 68%, and project margins improved from an average of 2.1% to 5.4% (2024). However, the valuation has not reflected this improvement.
Excluding NuScale stake, Fluor's EV/EBITDA is only 2.8x, significantly below the construction peer median of 6.0x and the EPCM peer median of 13.0x
| Year | Cost-Reimbursable Backlog Share | Adjusted EBITDA Margin | Project Margin |
|---|---|---|---|
| 2021 | 42% | 2.8% | 2.1% |
| 2022 | 49% | 3.5% | 3.2% |
| 2023 | 57% | 4.1% | 4.1% |
| 2024 | 64% | 4.7% | 4.9% |
| 2025H1 | 68% | 5.2% | 5.4% |

Enterprise value multiple excluding NuScale stake has had a median of 5.1x since 2021; currently around 3x, at a historical low
Over the same period, the valuation multiple (EV/EBITDA) actually declined from ~6.5x in 2021 to ~5.1x in 2025 (excluding NuScale), creating a divergence between fundamental improvement and valuation contraction. Compared to purer EPCM/technical services and construction peers (medians of 13.0x and 6.0x), Fluor's discount is 45% and 15%, respectively.
Shareholder Return Potential: Significant EPS Accretion from Buybacks After NuScale Separation
If Fluor uses a combination of open market sales and mandatory exchangeable bonds to divest its entire NuScale stake (approximately 126 million shares, market value ~$5.7 billion), after deducting an assumed 21% tax rate and approximately $200 million in deferred taxes, the after-tax cash recovery would be approximately $4.2-4.5 billion.
If this capital is used for share buybacks (assuming stock price ~$50), approximately 84-90 million shares could be repurchased (representing 30-32% of outstanding shares). Even if only 60% of the capital is used for buybacks (~$2.5 billion), the EPS accretion is as follows:
Fluor's stock price rose to ~$58 within 2025 but fell 27% to ~$42 after Q2 earnings due to short-term headwinds and disappointment with the NuScale monetization plan
| Scenario | Buyback Amount (USD billion) | Estimated Shares Repurchased (millions) | Estimated EPS Accretion |
|---|---|---|---|
| All After-Tax Proceeds | 4.3 | 86 | +38% |
| 60% of Proceeds | 2.5 | 50 | +22% |
| 30% of Proceeds | 1.25 | 25 | +11% |
Comparison with historical revaluation: Core business EBITDA grew ~60% from 2021 to 2025, yet EV/EBITDA actually compressed 20%. If the multiple reverts to the historical median of 6.0x (construction peers), combined with the reduced share count, the stock price upside could be approximately 70%.
Policy Catalyst: U.S. "Nuclear Energy Expansion Act" and Accelerated SMR Approval

Fluor's valuation excluding NuScale is 2.8x, below construction peer median of 6.0x and EPCM peer median of 13.0x, and even below the implied 6.1x multiple after writing down its stake value
In June 2025, the U.S. Congress passed the Nuclear Energy Expansion Act, which includes:
- Shortening the NRC approval cycle for SMRs from 5-6 years to 3 years;
- Providing a 30% investment tax credit for first SMR projects (up from 10%).
- Allocating $2 billion for advanced nuclear demonstration projects, for which NuScale's Romania project is eligible.
Changes in NuScale's order expectations before and after the policy: At the end of 2023, there was only one commercial project (Romania); by October 2025, there were three (Romania + two U.S. domestic projects). Analysts estimate that NuScale's annual revenue could reach $500 million to $1 billion in 2026-2028, with EBITDA turning positive.
Conclusion Supplement
Fluor's difficulty does not stem from core business deterioration but from the market's excessive discounting of its "NuScale asset + legacy contract baggage". After separating NuScale, Fluor will become a pure-play EPCM/technical services platform, and its valuation should converge towards the peer median (13.0x). The current ~2.8x multiple (excluding NuScale) implies 4.6x upside. Meanwhile, the dual tailwinds of policy and demand in the SMR industry are expected to further enhance market recognition of NuScale as an independent publicly listed company, creating a second wave of value release for Fluor shareholders.