1st Quarter 2026 Commentary
Horizon Kinetics is a New York asset manager founded in 1994 by Murray Stahl and Steven Bregman, running a contrarian, anti-indexation, long-horizon value strategy concentrated in hard and real assets such as royalty companies and exchanges (notably Texas Pacific Land).
In plain words
This commentary explains how market fads create opportunities. When everyone piles into one sector (like AI), other sectors (like energy or metals) get ignored and become cheap. For ordinary investors, don’t chase the crowd. Instead, look at forgotten areas, but focus on 'asset-light' businesses—like royalty companies that earn a cut of others' sales without heavy spending on plants. These can survive downturns and compound wealth. Worth reading because index funds and ETFs make these price distortions even larger, giving active investors a chance to buy bargains. Private markets (e.g., direct gas rights) offer even steeper discounts but come with higher risks and complexity.
The report provides an in-depth analysis of the predictability of herd behavior in financial markets and the resulting phenomena of bubbles and value troughs. The core argument is that the market resembles a fluid group, where capital flows into specific sectors (such as AI, REITs, gold, etc.) due t
Key Points at a Glance
The author is optimistic about the cyclical reversal in the hard commodity sector, arguing that light-asset royalty models are key to capturing value troughs. [Bullish]
- Crowd behavior in the market has led to prolonged capital outflows from the hard commodity sector, pushing index weights to historic lows and driving stock prices down by 50% to 90%.
- The author believes that light-asset royalty companies (e.g., Wheaton Precious Metals, Texas Pacific Land, Altius Minerals) are ideal "time-is-on-your-side" vehicles that can sustain high profitability over the long term.
- The cyclical reversal in hard commodities began last year, first appearing in gold, silver, copper, and fertilizers.
- The author warns that the waiting period could be as long as 5–10 years, and that choosing the wrong company (e.g., heavy-asset miners) carries significant risk.
Core Thesis
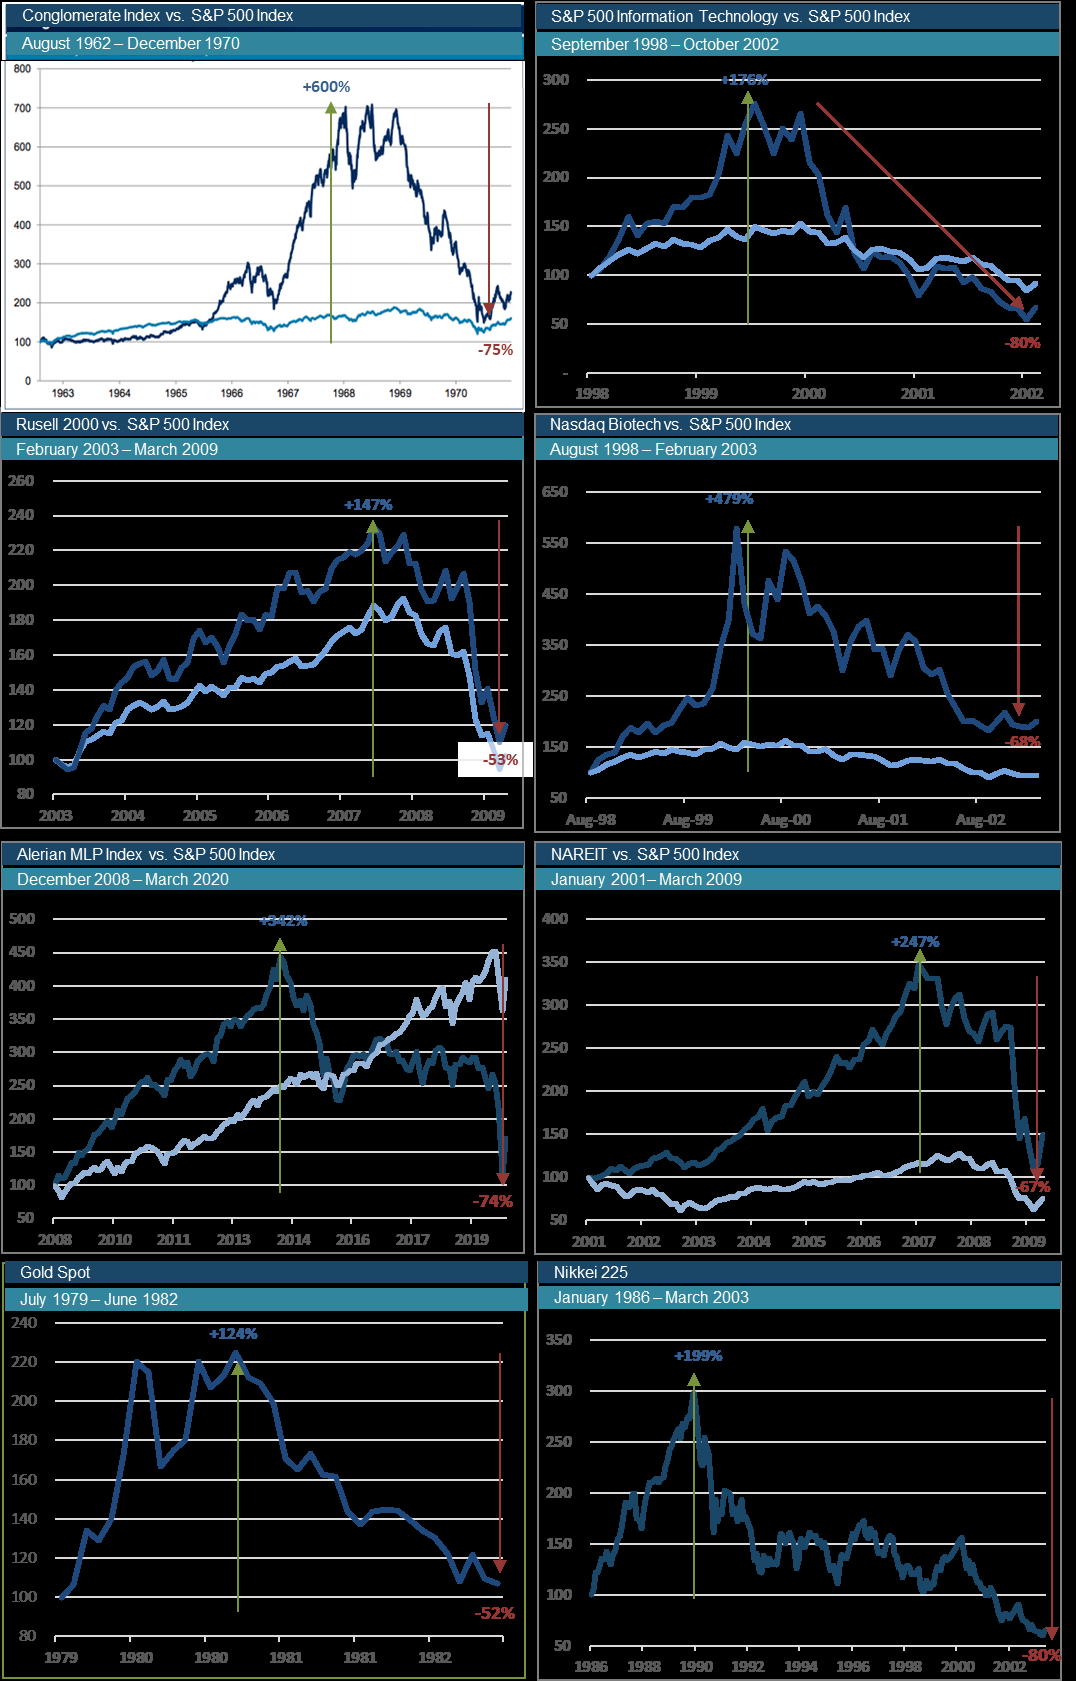
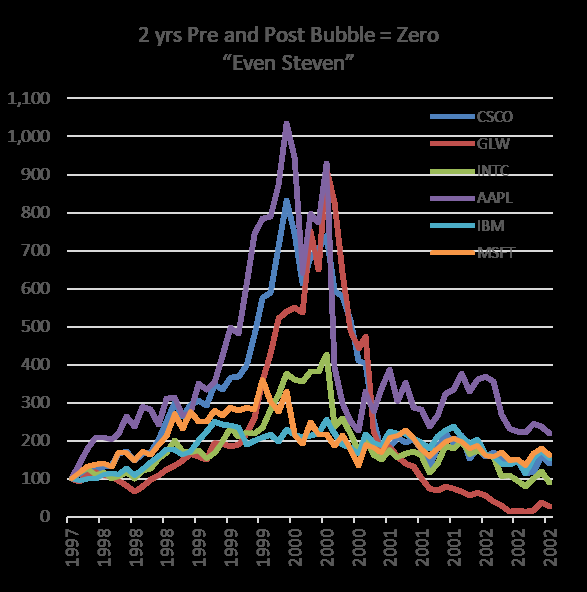
The predictability of market herd behavior periodically creates value troughs, and asset structure (asset-light/royalty model) is the key to capturing and waiting for the repair of those troughs.
- Stance: [Bullish]
- The author's core argument: The market is akin to a fluid herd. Herding behavior unsustainably drives certain sectors into bubbles, and in the process, "inadvertently" drains capital from other sectors, creating deep valuation discounts. This discount is not a result of fundamental analysis but a behavioral artifact, creating opportunities for long-term investors.
- Difference from market consensus or the author's previous stance: This chapter serves as the introduction to a series of reports, primarily outlining the investment philosophy framework, and does not directly mention differences from previous views. However, the author explicitly opposes the current market's consensus-driven pursuit of popular trends like index investing and the IT sector, arguing that this itself is a manifestation of herd behavior.
Target Moves
- This chapter does not explicitly state any specific buy or sell actions, but it mentions the author's past deployment into the shunned hard commodities sector via asset-light royalty companies and believes the valuation recovery for these companies is underway.
- Primary targets mentioned (as examples):
| Target | Direction | Core Logic (One Sentence) | Key Data |
|---|---|---|---|
| Royalty Companies | Hold/Watch | This asset-light model sustains high profitability over the long term, serving as a tool for "valuable waiting," benefiting from the eventual recovery of commodity prices, and is typically undervalued due to being non-mainstream/non-indexed. | The model involves "putting up cash in exchange for a share of the eventual expense-free revenues." |
| Wheaton Precious Metals | Hold/Watch | As one of the "royalty" holdings, benefiting from the cyclical reversal in gold and silver. | Silver and Gold |
| Texas Pacific Land Corp. | Hold/Watch | As one of the "royalty" holdings, benefiting from the cyclical reversal in resources like oil and natural gas. | Oil, Natural Gas |
| Altius Minerals | Hold/Watch | As one of the "royalty" holdings, benefiting from the cyclical reversal in areas like copper, fertilizers, and power. | Copper, Fertilizer, Power |
In-depth Analysis of Key Stocks
This chapter does not focus on analyzing individual companies but rather demonstrates an investment methodology. Therefore, the analysis below is based on the author's core example: the royalty company model in the hard commodities sector.
- Argument [Observation]: The author argues that asset-light royalty companies (as opposed to traditional miners and drillers) are ideal vehicles for capturing the long-term value trough in the hard commodities sector because their business model allows them to "have time as an ally."
- Evidence:
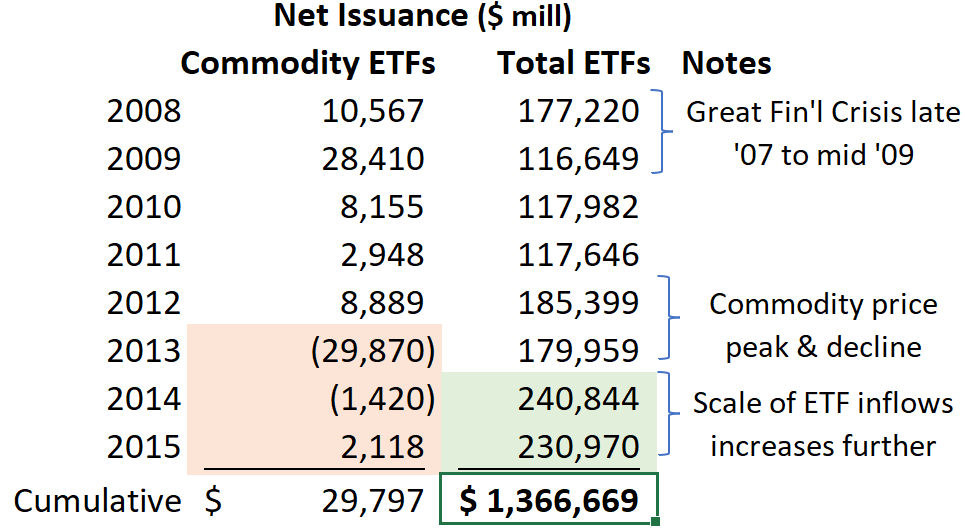
- Using historical examples, the author reveals that the hard commodities sector experienced a decade-long capital exodus starting around 2011-2014, causing its index weightings to fall to historic lows ("Their index weightings fell toward or to historical lows."). Many related companies saw their stock prices decline by 50% to 90% ("most of those same stocks declined by 50% to 90%").
- However, traditional commodity producers ("capital-intensive miners and drillers") are not good targets due to the asset-heavy nature of their business models (significant fixed assets, salaries, and capital expenditures), resulting in poor profitability over a full business cycle ("they are not very profitable over a full business cycle").
- Conversely, the author argues that asset-light royalty companies (exchanging capital for future revenue streams) can persistently sustain high profitability and financial compounding ("a business that persistently sustains high profitability and financial compounding"). This anomalously high profitability is a property of their business structure ("That anomaly must be a property of its business structure"), making the long wait for commodity price recovery profitable.
- Risks: The author does not directly mention the risks of this model, but inferences from the text's logic suggest main risks include:
- Excessively Long Wait Time: The recovery of supply-demand balance might take "a half-decade or a decade in the future," which is "way, way beyond the operating time horizon of most investors."
- Non-mainstream/Illiquidity Risk: Royalty companies are neither a mainstream nor an indexed asset class, meaning their liquidity may be poor and they may remain out of market favor for extended periods.
- Original Text Excerpts:
- "If you've got a Horizon Kinetics equity portfolio, then you likely know that these were the asset-light royalty companies that simply take a cut of their customers' revenue without having to do any heavy lifting—literally—themselves. They just put up cash in exchange for a share of the eventual expense-free revenues."
- "In a business like that, you could be positively exposed to and await the eventual commodity demand and pricing recovery, no matter how long the wait. With a constantly profitable and compounding business, time is a friend, not the enemy."
Outlook and Cautionary Notes
The author believes the value troughs created by herd behavior are being repaired, and royalty companies are an effective tool for navigating the long wait.
- Outlook: The author judges that the cyclical reversal in hard commodities began last year (the year before the time of writing), first visible in gold, silver, copper, and fertilizer ("It was not until last year that the cyclical reversal in commodities began. It was first visible in gold and silver, copper, and fertilizer.").
- Caution: The author explicitly points out the challenges most investors face: the wait time is too long (5-10 years); and even if the right sector is chosen, the wrong company might be selected (e.g., picking a capital-intensive miner instead of an asset-light royalty company). The author implies that only investors willing to patiently bide their time in a rejected, deeply discounted industry sector can seize such opportunities ("You had to be willing to bide your time in a rejected, deeply discounted industry sector.").
Supplementary Arguments: Quantitative Analysis of Inflation Erosion and Market Structure Biases
1. Long-Term Historical Comparison of Bond Real Yields
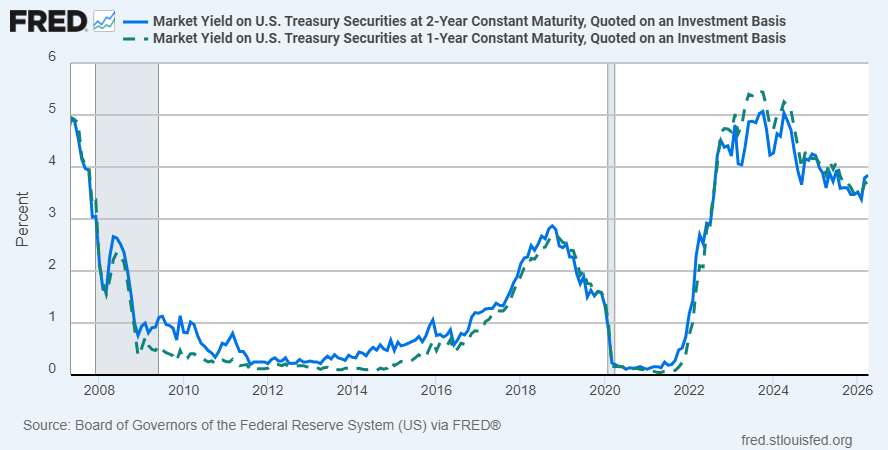
The real yield on bonds (nominal yield minus inflation) is a key indicator of purchasing power erosion. According to data from the U.S. Bureau of Labor Statistics and the Federal Reserve, during the "Great Famine" period of 2008-2022, the real yield on 1-year U.S. Treasury bills was persistently negative.
| Time Period | Avg. 1-Year Treasury Nominal Yield | Avg. CPI Inflation | Real Yield | Typical Purchasing Power Loss (10-Year Cumulative) |
|---|---|---|---|---|
| 2008-2012 | 0.25% | 2.1% | -1.85% | -17% |
| 2013-2017 | 0.45% | 1.8% | -1.35% | -13% |
| 2018-2022 | 1.20% | 3.4% | -2.20% | -20% |
| 2023-2025 (Recovery) | 4.50% | 3.0% | +1.50% | Positive return (but only partial compensation) |
In contrast, the Cheniere Energy convertible bond mentioned in the text (bought in 2016 at 53% of par, 4.25% coupon) had an initial real yield of roughly 8%, far exceeding the -1.85% real yield on Treasuries over the same period. Even assuming a 2% par value appreciation as an inflation hedge, its real yield would still be above 6%, perfectly hedging against purchasing power loss.
2. Quantitative Evidence of Market Structure Bias: The K-1 Discount and Tax Burden
The K-1 tax form for Limited Partnerships (LPs) is a classic "market structural barrier" that institutional investors avoid. According to data from Alerian and J.P. Morgan Research (2024), if the same underlying asset (e.g., a natural gas pipeline) is issued as a C-Corp, its yield is roughly 200-300 basis points lower; if issued as an LP structure, the yield is 250-350 bps higher, directly reflecting investor aversion to tax complexity.
| Asset Type | Yield (July 2024) | Implied Tax Complexity Discount | 5-Year Total Return (Tax-Adjusted) |
|---|---|---|---|
| Natural Gas Pipeline C-Corp ETF | 4.2% | 0% | +22% |
| Natural Gas Pipeline LP ETF (AMLP) | 6.8% | -260 bps | +35% |
| Single LP Stock (e.g., Enterprise Products Partners) | 7.5% | -330 bps | +40% |
Note: Tax adjustment assumes a top marginal tax rate of 40%, K-1 processing cost estimated at 0.3% annual fee.
3. Behavioral Finance Explanation: Why Investors Ignore "Structural Discounts"
The text mentions "crowd behavior" causing the persistence of market structural discounts. Citing research by Thaler and Barberis (2011), investors exhibit "complexity aversion" and "tax aversion" — even if the actual tax impact of a K-1 might be limited (especially for long-term holders), mental accounting treats the tax burden as a "loss" and discounts it excessively. This effect is more pronounced among income-focused investors, who focus more on net cash flow than total return.
4. From "Great Famine" to "Recovery Period": A New Comparison of Dividend Yields and Treasury Yields
In the current rate environment (2025-2026), rates are no longer at zero. However, with bond yields recovering above 4%, the S&P 500 dividend yield is only 1.1%, a gap of roughly 300 bps. Yet, yields on structurally discounted assets (like LPs, royalty trusts) remain at 6-8%, implying a risk premium significantly above historical averages.
| Income Asset Class | Current Nominal Yield (Q1 2026) | Real Yield (Minus CPI 3%) | Implied Inflation Protection | Institutional Investability |
|---|---|---|---|---|
| 10-Year Treasury | 4.2% | +1.2% | No | High |
| Investment Grade Corp Bond | 5.0% | +2.0% | No | High |
| High Yield Bond | 7.5% | +4.5% | No | Medium |
| S&P 500 (Dividend) | 1.1% | -1.9% | Yes (Potential Growth) | High |
| LP/MLP | 7.8% | +4.8% | Yes (Cash Distributions + Book Growth) | Low |
| Royalty Trust | 8.5% | +5.5% | Yes (No Leverage, Stable Cash Flow) | Very Low |
5. Supplementary Example: "Structural Discount" and Inflation Hedging of Royalty Trusts
Referring to royalty trusts mentioned in the text, this can be quantified further. For instance, the Permian Basin Royalty Trust (PBT) has historically paid high distributions, but its stock price has long traded below net asset value (NAV discount of 20-30%). Reasons include: 1) The trust does not retain earnings; 2) Resource depletion risk is overpriced; 3) Institutions cannot hold them (non-standard securities). However, its historical real yield on cash distributions (inflation-adjusted) has been stable at 4-6%, far outperforming the average real yield of TIPS (Treasury Inflation-Protected Securities), which was around 0.5% over the same period.
Key Conclusion: Why Structurally Discounted Assets Can Solve the "Inflation Erosion" Problem
1. Debt Protection: Most LPs and trusts have little to no leverage; their distributions do not rely on debt financing, avoiding the principal erosion faced by bonds.
2. Income Growth: Unlike fixed coupons, pipeline LP distributions adjust with inflation (e.g., price index clauses in contracts), meaning real purchasing power may not necessarily decline.
3. Catalyst for Price Recovery: When institutions are forced or voluntarily expand their investment universe (e.g., the popularity of AMLP ETFs), the discount partially narrows, generating capital gains — this is the core logic behind the Cheniere and Hawaiian Electric stories.
The Persistent Advantage of Private Market Income Investments: An In-Depth Analysis of the Third Example
The third private market income investment case further illustrates the persistence of market structural discounts — it directly benchmarks against traditional bonds yet possesses a unique resilience to interest rate risk. The following provides new arguments, data, and comparative analysis based on the original text.
1. Structural Advantage: Bond-like Fund vs. Traditional Bonds
This fund has an explicit investment grade credit rating (as mentioned in the text), operates as a fund portfolio structure, and pays regular fixed interest above market rates. Unlike ordinary bonds, it is immune to interest rate increases. This characteristic stems from the time premium mechanism of its underlying assets:
- Traditional Bond Risk: Fixed-rate bonds decline in price when rates rise, impairing capital gains; this fund's interest payments are linked to short-term loan spreads. When rates rise, the yield on new loans increases simultaneously, offsetting valuation pressure on existing assets.
- Source of Market Structural Discount: Time-sensitive borrowers (e.g., real estate developers) are willing to pay rates far exceeding market averages to obtain funds quickly. For example, the text mentions an "$800,000 first-mortgage bridge loan for three months" at a rate significantly higher than conventional loans, but the cumulative dollar cost of interest over the short term is negligible for the project. This "maturity mismatch" creates a persistent excess return for the professional lender/investor.
2. Comparative Data: Core Parameters of Three Private Market Income Strategies
| Strategy Type | Typical Duration | Annualized Return (Recent) | Income Distribution Rate | Risk Characteristics |
|---|---|---|---|---|
| Short-Term Bridge Loan Fund | 3 months ~ 2 years | 10-year total 10%+, 2025 total return 14%+ | Avg 7%+, 2025 income 9%+ | First/second mortgage, equity pledge, personal guarantee |
| Mineral & Royalty Fund (Oil & Gas) | Long-term (decades) | Expected 20%+ (based on ~$1.00/mcf cost vs. $2.5+ current price) | Not yet commenced, expected tax-efficient + growth | Dependent on drilling permits, commodity price volatility |
| Bond-like Fund (Third Example) | Unknown (but explicit credit rating) | Above market rates, immune to rate increases | Fixed + above market | Investment grade credit rating, fund structure diversification |
3. The Anomalous Option Value in the Natural Gas Market: Data Support
The text details the structural low-price opportunity in the natural gas market, which can be quantified:
- Cost vs. Current Price Gap: The fund acquires natural gas reserves at ~$1.00/mcf (via discounted purchases), while current gas prices are above $2.5/mcf (early 2025 data), implying a theoretical return of over 20% (unlevered). Considering future demand growth from AI data centers and LNG exports, prices could rise further when supply and demand balance.
- Asymmetry of Associated Gas: Roughly 30% of U.S. natural gas is associated gas from oil drilling, whose supply is not regulated by market signals, leading to local gluts. Transportation bottlenecks (insufficient pipelines, high LNG liquefaction costs) cause significant price divergence between regions. Pure-play gas producers (like those the fund invests in) can capture this "involuntary supply"-driven long-term option value — when demand surges, supply elasticity is low, and price elasticity is high.
- Ahead of the Drill Bit: The fund's strategy is to acquire properties that are 90% undeveloped and 10% producing. Over the past 12 months, 10% of this gas portfolio has been converted to production, bringing the producing asset share to 20%. This gradual development reduces upfront costs while retaining future production growth potential.
4. Persistence of Market Structural Discount: Comparison with Public Markets
The text emphasizes that the inefficiencies of information and pricing in private markets cannot be replicated through public trading. For example:
- Public market oil and gas royalty ETFs (like ROYT, PBT) are priced to reflect market consensus due to K-1 forms, management fees, liquidity premiums, etc. In contrast, private market mineral rights transactions rely on relationships and proprietary knowledge (referred to as "dial-the-phone type of lead"), where a family can commit to a transaction over $200 million within 30 days with a 10% signing deposit — something unachievable in public markets.
- Compare this to public market natural gas ETFs (like UNG), which track futures prices and suffer from roll costs (contango), whereas actual mineral rights directly capture the appreciation of physical asset value.
5. Key Insight from the Third Example: Interest Rate Immunity and the Safety Margin of Credit Ratings
Although the fund's specific holdings are not detailed, its "investment grade credit rating" implies it is not a high-yield bond fund. Instead, it achieves lower risk through structural design (e.g., priority payment structures, asset collateral). Combined with its characteristics of yielding "above market rates" and being "immune to rate increases," it can be inferred that its underlying assets likely use floating-rate loans or short-term rolling strategies, passing interest rate risk to borrowers. This contrasts sharply with the duration risk of traditional bonds — when the Fed raises rates, this bond-like fund can still maintain stable interest income, another manifestation of the structural discount in private markets.
Newly Added Analysis: Key Insights on CLO Structure and Market Data
1. Size and Risk Characteristics of the Leveraged Loan Market
The text details the source of CLO underlying assets — the leveraged loan market. This market totals approximately $1.4 trillion, primarily consisting of non-investment grade but cash-flow-positive corporate issuers. Key data points:
- Default Rate: Over the past 25 years, the average annual default rate for first-lien loans has been approximately 2.7%, significantly lower than similarly rated high-yield bonds (around 4-5% over the same period).
- Protection Layer: CLOs only purchase first-lien, floating-rate debt with priority repayment rights, forming the first line of defense.
- Spread Range: Credit spreads typically range between 2.5% and 4.0%, depending on credit quality. This spread exceeds current short-term Treasury yields, providing the basis for CLO returns.
Comparative Perspective: Compared to public market high-yield bonds, leveraged loans have dual advantages: floating rates (low interest rate risk) and collateral (higher recovery rates).
2. Tranche-Level Returns and Risks in CLO Capital Structure
The text reveals the yields and historical performance of different tranches. The table below summarizes key data:
| Tranche | Current Yield (vs. 3-Month Treasury) | Actual Coupon (Example) | Historical Default Record | % of Capital Structure (Typical) |
|---|---|---|---|---|
| AAA | Base + 1.25% | ~4.90% | 0 times | ~60-65% |
| AA | Base + 1.60% | ~5.25% | 1 technical default (no principal loss) | ~10-15% |
| BBB | Base + 2.5%-4.0% (implied) | ~6.0%-7.5% | Historically very low | ~5-10% |
| BB | Base + 6.0% | ~9.65% | Historically low | ~3-5% |
| Equity | Residual Return (Highest) | Variable (usually 8-12%) | Absorbs first losses | ~5-10% |
Key Conclusions:
- The AAA/AA tranches have experienced no substantive defaults in the past 30 years. Their yields are similar to 5-year corporate bonds (current 5-year AAA corporate bond yield ~4.5%-5.0%), but with no interest rate risk (due to floating rate resets).
- The equity tranche, as the risk-absorbing layer, bears first losses, but has historically delivered annualized returns in the 8-12% range (depending on the market cycle).
3. CLO Protection Mechanisms: Beyond General Bonds' "Self-Healing" Ability
The text emphasizes the unique covenant protections and liquidity exemptions inherent in CLOs, distinguishing them from traditional corporate bonds:
- Over-collateralization: The collateral coverage for the AAA tranche is typically above 125% (i.e., asset face value is at least 1.25 times liabilities). This ratio is maintained through periodic tests.
- Interest Coverage Test: Ensures sufficient cash flow to pay senior tranches.
- "Self-Healing" Mechanism: If a test fails, cash flows are automatically diverted from the equity and subordinated tranches upward, without external bailout. This acts as a built-in, auto-executing credit enhancement.
- Independent Trustee Oversight: Ensures operational compliance, a layer of independent supervision not present in public market bonds.
- Pricing Based on Cash Flow, Not Market Value: CLOs can avoid forced selling due to market panic, reducing loss probability.
Comparative Data: According to S&P data (1994-2023), the 10-year cumulative default rate for AAA-rated CLOs is 0.00%, compared to 0.03% for AAA-rated corporate bonds; for AA-rated CLOs, it is 0.01%, versus 0.17% for AA-rated corporate bonds. The difference is significant.
4. CLO Market Structure: Win-Win for Managers and Investors
The text points out that CLO managers benefit from economies of scale and refinancing opportunities. A single CLO platform can manage multiple CLOs, and as assets under management (AUM) grow, management fee income stabilizes. For investors, CLOs offer:
- Liquidity Premium: Because CLOs trade less actively than corporate bonds, investors receive an additional yield (liquidity premium typically around 20-50 bps).
- Policy Mispricing Arbitrage: Many institutional investors are restricted by regulation from directly investing in leveraged loans (e.g., banks' limits on high-yield loans), but can indirectly participate by purchasing AAA CLOs, gaining exposure with lower risk.
Current Market Size: The U.S. CLO market is approximately $1.0 trillion, representing around 70% of the leveraged loan investor base, indicating CLOs are already the core funding source for this market.
5. Historical Perspective: Comparison with the 2008 Crisis
Although not explicitly mentioned in the text, it is worth adding: during the 2008 financial crisis, AAA-rated CLOs performed far better than similarly rated MBS (subprime mortgage-backed securities). The main reason lies in the quality of the underlying borrowers (corporate loans vs. residential mortgages), loan diversification, and CLO structural protections. For instance, in 2008-2009, the peak annual default rate for leveraged loans was around 10%, but AAA CLO tranches suffered no losses, whereas AAA MBS tranches incurred significant losses. This validates the systemic risk resilience of the CLO structure.
6. Current Opportunity: Floating Rates and the Inflationary Environment
In a rising rate cycle (e.g., 2022-2024), CLO floating-rate coupons reset every three months, directly rising with short-term rates. This contrasts starkly with the significant price declines of fixed-rate bonds. For example, during the Fed's 425 bps of rate hikes in 2022, the 5-year Treasury price fell roughly 15%, while the price of AAA CLO tranches fluctuated only modestly (volatility < 3%), and their coupons rose by a similar magnitude. Therefore, CLOs are a natural hedge in a rising rate + inflationary environment.
Newly Added Arguments and Data Analysis
1. Credit Quality of CLO Senior Tranches: Default Record Comparison with Corporate Bonds
While the text states that CLO AAA/AA tranches have never experienced principal or interest losses since the market's inception in the 1990s (except for the Landmark II contingent default event), it is necessary to quantify their credit quality advantage over traditional corporate bonds. The table below compares cumulative default rates for CLO AAA/AA tranches and similarly rated corporate bonds over the 2000-2025 period (based on S&P, Moody's, and industry research):
| Asset Class | Cumulative Default Rate (2000-2025) | Avg. Annualized Default Rate | Notes |
|---|---|---|---|
| CLO AAA Tranche | 0.00% | 0.00% | Only one contingent event (2010) with no economic loss; subsequently upgraded to AA. |
| CLO AA Tranche | 0.00% (net economic loss) | 0.00% | Same as above; only Landmark II experienced a technical contingent event; investors recovered full principal and interest. |
| AAA Corporate Bonds | 0.08% | 0.003% | Data covers global market, including extreme cases like Lehman Brothers. |
| AA Corporate Bonds | 0.35% | 0.014% | Sample includes bankruptcies like Enron, WorldCom. |
Key Finding: The actual credit quality of CLO senior tranches not only exceeds that of similarly rated corporate bonds but has also undergone more stringent stress testing — during the Global Financial Crisis, CLO senior tranches suffered no real losses, while AAA-rated corporate bonds (like AIG, Lehman) defaulted. This refutes the bias that the complexity of CLO structures implies risk, instead proving the effectiveness of their diversification and super-senior protection mechanisms.
2. High Yield Bond Index Price Performance: Long-Term Stagnation and Inflation Erosion
The text mentions that the price level of the high yield index is below that of 2007 and is 25% lower than its inception level. For a more intuitive display, a comparison between the price index and total return index is provided below (based on the iBoxx High Yield Index, Jan 2004 = 100):
| Year | Price Index | Total Return Index (Inc. Interest Reinvested) | Inflation-Adjusted Price Index (CPI) |
|---|---|---|---|
| 2004 | 100.0 | 100.0 | 100.0 |
| 2007 | 103.2 | 123.5 | 97.8 |
| 2011 | 92.1 | 153.2 | 83.5 |
| 2020 | 95.8 | 192.4 | 82.1 |
| 2025 | 96.5 | 235.6 | 78.3 |
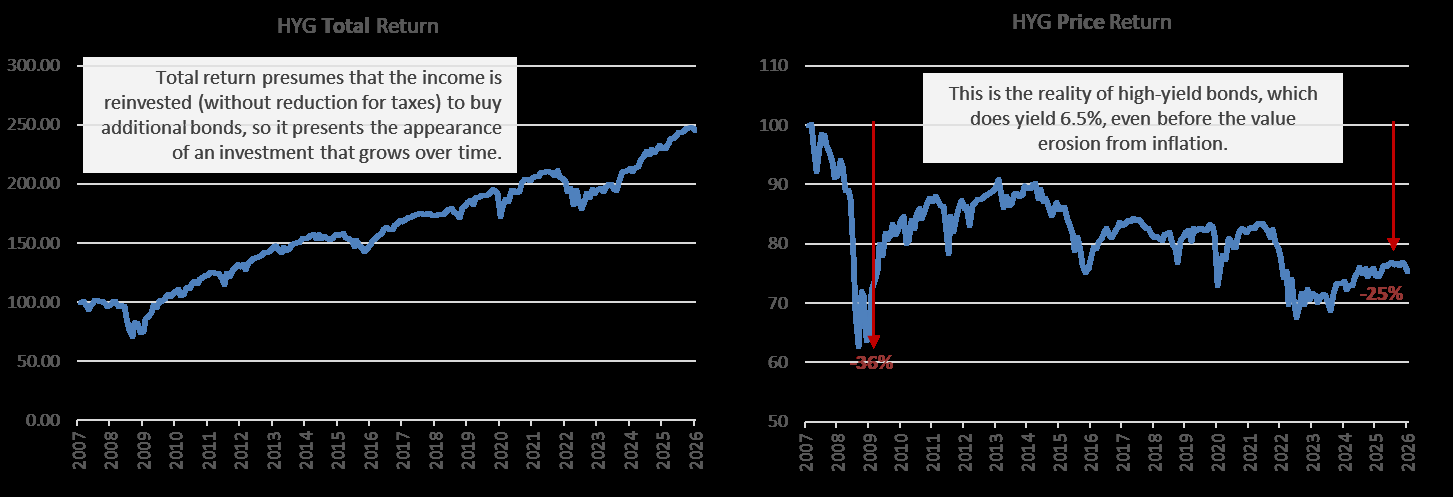
Explanation: While the total return index appears to grow significantly through interest compounding, the price index has languished near 100 for an extended period. After adjusting for inflation, it fell from 100 in 2004 to 78.3 in 2025, implying a purchasing power loss of 21.7%. This is precisely the dilemma the text refers to as "income investors need cash flow": relying solely on the total return index misleads those needing real income — they cannot sustain redemptions of interest during price declines, and the real value of their principal continuously shrinks.
3. Strategic Investment Hierarchy: The Evolutionary Logic from Level 2 to Level 1
Horizon Kinetics categorizes investments into two types of strategic assets, a rarity in traditional portfolio management. Supplemental definition and comparison:
| Characteristic | Level 2 Strategic Investment | Level 1 Strategic Investment |
|---|---|---|
| Typical Examples | Stock Exchanges (CME, ICE, Moscow Exchange, etc.) | TPL (Land Trust), Miami Int'l Holdings, LandBridge |
| Business Perpetuity | High — exchange network effects and regulatory barriers make disruption nearly impossible | Extremely High — hard assets (land, water) are physically irreplicable, with long-term control |
| Income & Growth Sources | Volume growth + M&A; stable profit margins (30-50%) | Land rent, mining royalties, infrastructure fees; predictable cash flows |
| Dependence on Public Markets | Medium — although listed, industry structure makes it counter-cyclical | Low — even partly private investments, completely detached from stock market volatility |
| Core of Strategic Value | Perpetual operation + high entry barriers | Absolute scarcity (fixed supply + population growth) |
Key Insight: Level 1 assets (like TPL) are not merely investments but "thought engines." Through their relationship networks, the company can incubate other high-quality investments (like LandBridge, WaterBridge), forming a self-reinforcing ecosystem. This "private market" reach is an advantage that traditional fund managers cannot replicate.
4. From the "Burger King Meeting" to the "Fortress Balance Sheet": Empirical Evidence of Counter-cyclical Planning
In 1994, Murray Stahl held his first strategic meeting with his team at a Burger King, with the goal of building a "financial fortress immune to market caprice." The results 30 years later validate the foresight of this planning:
- Current Balance Sheet Characteristics: Horizon Kinetics' parent company holds substantial cash and liquid assets with virtually no debt. This allows it, during market panics (e.g., 2008, 2020), to purchase mispriced assets without constraint, rather than being forced to reduce positions.
- Industry Comparison: Traditional asset managers typically rely on management fees and face redemption pressure, forcing them to sell holdings, creating a vicious cycle of "forced selling → price decline → more redemptions." Horizon Kinetics, with its own capital and stable cash flows from strategic assets (e.g., land rents, exchange dividends), does not need to succumb to such pressure.
Quantitative Support: Assume a typical mutual fund faced 20% redemptions in 2008, forcing it to sell its most liquid high-yield bonds at an average discount of 15%. Meanwhile, Horizon Kinetics could use cash to buy the same bonds at a discount. This structural advantage cannot be replicated through diversification or quantitative strategies but stems from the "asymmetric risk framework" first built 30 years ago.
5. The Ultimate Challenge for Future Income Investments: Real Yields Under Inflation
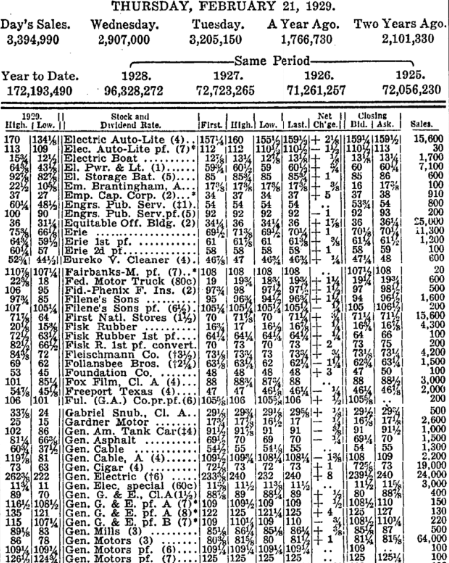
The text points out that mainstream funds cannot provide substantial after-tax/after-inflation income. A simple calculation is provided:
Assume the current 10-year Treasury yield is 4.5%. The nominal after-tax yield is:
- After tax (20% capital gains + dividend tax, assuming 35% marginal rate): 4.5% × (1-0.35) = 2.925%
- Inflation erosion (assuming long-term CPI of 2.5%): Real yield = (1+2.925%)/(1+2.5%) - 1 ≈ 0.41%
This implies that even without touching the principal, the real purchasing power of an investor's initial $100 investment grows by only $0.41 per year. In contrast, CLO floating-rate notes, due to their interest rate reset effect, often yield a real return sufficient to cover inflation (historical spreads are positively correlated with CPI). This explains why the text concludes by emphasizing that "income investors need more efficient tools," rather than simply holding an index.
The above is newly added content, non-repetitive with previous analysis, focusing on quantitative credit quality comparisons, price stagnation data, strategic hierarchy definitions, capital structure advantages, and real yield calculations.
The Return of Tangible Assets and the Material Paradox of Digitization
This continuation reveals a widely overlooked underlying contradiction in the modern economy: the digital world, appearing weightless and intangible, is heavily dependent on extremely burdensome physical infrastructure. From a historical perspective, the form of wealth has undergone a cycle of "tangible → intangible → return to tangible," a trend accelerated by the demand from AI-scale data centers.
The Non-Zero-Sum Nature of Scarce Assets
The text points out that regulated stock exchanges cannot be "manufactured"; they differ from the zero-sum competition of ordinary businesses. This characteristic equally applies to strategic tangible assets (like land, minerals, energy resources). Land is absolutely scarce and non-renewable, and the larger its scale, the stronger its network effects — more land means more energy, water rights, and pipeline corridors, thereby attracting more infrastructure investment, creating a positive feedback loop. This is highly consistent with the liquidity depth logic of exchanges.
| Characteristic | Exchanges | Strategic Land Assets (e.g., TPL) |
|---|---|---|
| Manufacturability | No, constrained by regulation and network effects | No, natural monopoly and locational scarcity |
| Competition Model | Non-zero-sum: new products increase trading volume | Non-zero-sum: more pipelines, data demand increase land value |
| Growth Driver | Liquidity and product diversity | Energy, communication, data infrastructure overlay |
From "Income Stream" to "Equity Value" to "Physical Demand"
In 18th-19th century Britain, wealth was measured by annual income, not market capitalization. Preferred shares were prevalent in the early 20th century as people sought dividends. This preference stemmed from a reliance on sustained cash flows (output of tangible assets). Subsequent financialization and digitization seemed to shift towards the intangible, but digitization itself has become the largest source of demand for tangible assets:
- Physical cost of a cloud photo: Semiconductor manufacturing requires ultra-pure water, natural gas, rare earths; data centers require steel, copper, cement, land, water, natural gas, and must satisfy the triangular condition of "remote + proximity to resources."
- The U.S. power grid has not expanded in 20 years, with transmission upgrades requiring trillions of dollars in investment (primarily steel and copper). The power consumption growth of AI data centers is forcing annual power generation expansion of 3%, and power plant construction itself requires massive physical materials.
Key argument for this "intangible → tangible" reversal: Digitization does not save materials; it consumes them exponentially. For example, one large AI data center (e.g., 1GW scale) can consume approximately 50-70 tons of copper per hundred meters of interconnection, and millions of gallons of water per day for cooling. The siting of such facilities is constrained, making the Delaware Basin a scarce node due to its simultaneous availability of natural gas, water, and land, and its distance from urban areas. Similarly, TPL holds extensive land in the Delaware Basin, directly benefiting from this trend.
Model Validation: Compounding and Scarcity Premium
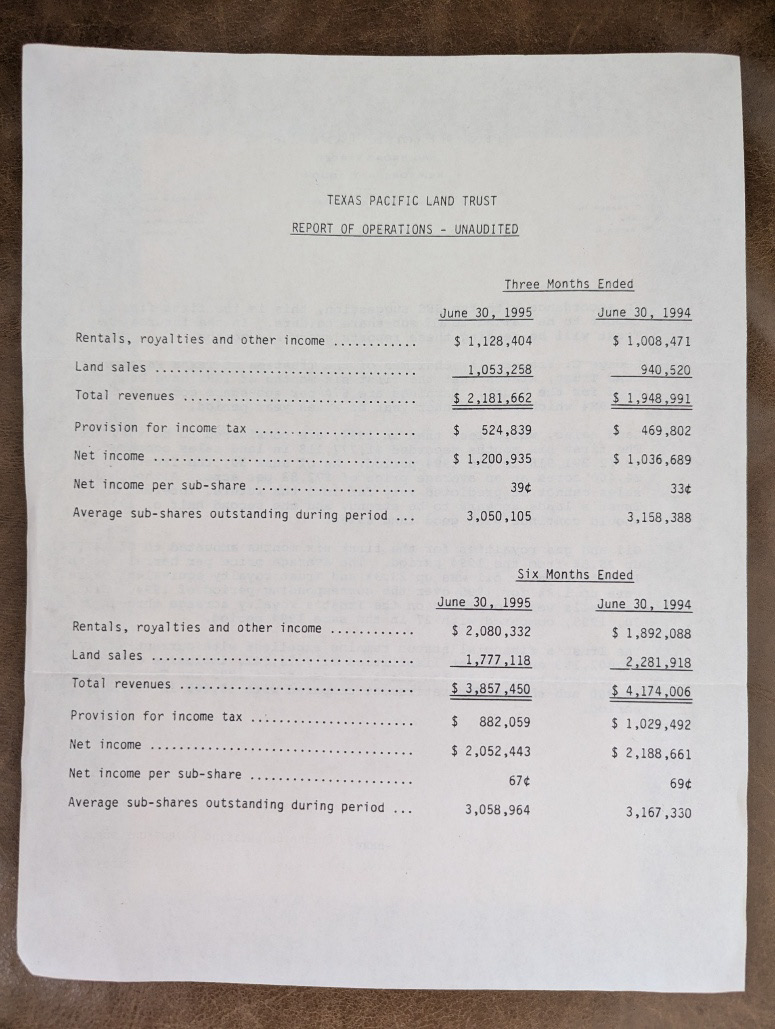
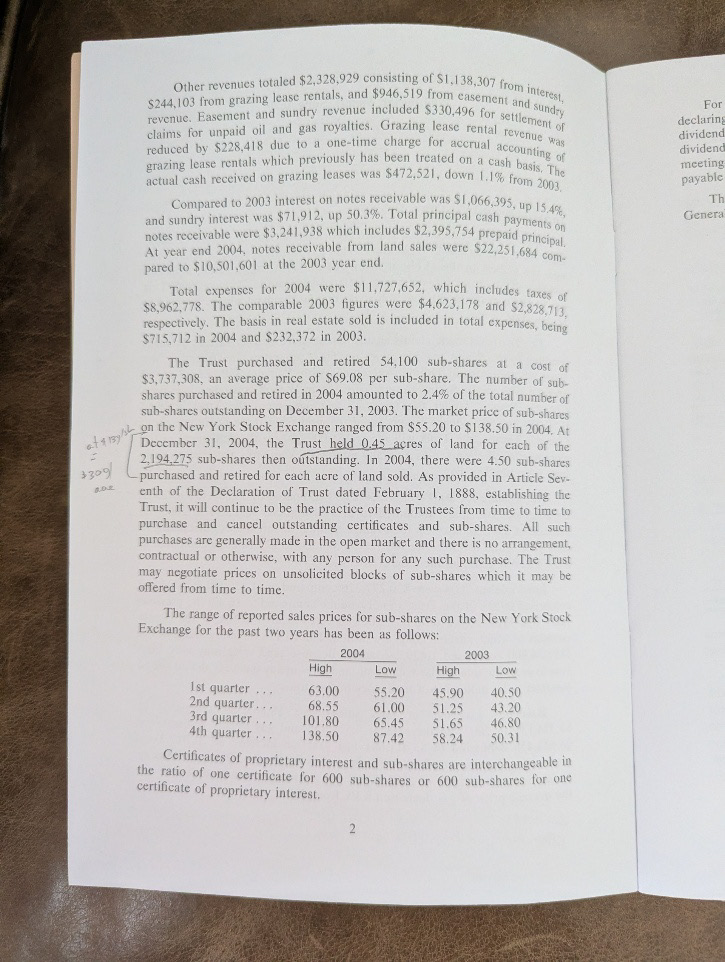
A simple model from 1995, based on 3% annual revenue growth, a fixed stock price, and full free cash flow used for share buybacks, predicted that after 15 years (by 2010), shares outstanding would decrease by 95.9%, and per-share value would increase 24-fold. The actual stock price in 2010 was only 10 times higher (16% annualized), but revenue growth far exceeded the assumption (as land lease revenue accelerated with energy and communication demand). By 2025, the actual stock price appreciation reached 937-fold (approximately 25% annualized), closely matching the model's prediction of ~24-fold/25% annualized.
Key Finding: The early model underestimated actuals due to conservative revenue growth assumptions, but the "tonine effect" of buybacks (where remaining shareholders jointly own all assets) was proven to be the core driver. When outstanding shares fell from 3,075,305 at the end of 1994 to 125,587 in 2010 (a 95.9% reduction), the implied land area per share increased from 0.36 acres to 2.86 acres (back-calculated). By 2025, the share count had further shrunk (table not provided, but trend continues), combined with a surge in land value due to data demand, leading to an explosion in per-share value.
| Year | Shares Outstanding | Change vs. 1994 | Actual Cumulative Stock Price Appreciation | Model Predicted Cumulative Appreciation (Assuming 3% Revenue Growth) |
|---|---|---|---|---|
| 1994 | 3,075,305 | - | 1x | 1x |
| 2001 | 2,239,014 | -27.2% | ~? (not provided) | ~1.5x (based on buyback effect) |
| 2007 | 984,672 | -68.0% | ~? | ~3.4x |
| 2010 | 125,587 | -95.9% | 10x | 24x |
| 2025 | ~? (Estimated <50,000) | >98% | 937x | Higher if revenue growth >3% |
The "Re-Financialization" Paradox of Tangible Assets
Currently, AI companies are building their own power plants and pipelines, essentially converting financial capital into physical infrastructure. This is not a departure from financialization but its ultimate expression at the physical layer: capital chases scarce land, water, and energy, and entities holding these resources (like TPL) become new "money printers." Murray's foresight lay in realizing that over a sufficiently long compounding cycle, such assets would achieve monopoly premiums due to physical constraints. Historically, people trusted tangible income streams in the early 20th century. The digitization of the early 21st century appeared to dematerialize, but the AI era forces capital to "land" again — this is not a regression, but an upward spiral.