The Race of our Lives Revisited (in a nutshell)
GMO is a Boston asset manager co-founded in 1977 by Jeremy Grantham with Richard Mayo and Eyk Van Otterloo, known for valuation-driven dynamic asset allocation built on long-horizon mean reversion. Grantham is famous for calling historic bubbles, warning publicly ahead of both the 2000 dot-com crash and the 2008 financial crisis. Flagship publications include the GMO Quarterly Letter (now written by Asset Allocation co-heads Ben Inker and John Pease), Grantham's Viewpoints essays and the 7-Year Asset Class Forecast.
In plain words
This report explains how serious climate change is and what it means for investors. The author shows that in just 70 years, humans have pushed carbon dioxide levels to record highs, speeding up global warming, causing more extreme weather, and eroding soil and farmland. This threatens future food production. For regular investors, the key takeaway is that fossil fuels (like oil and coal) are likely to decline long-term, while renewable energy (like solar and wind) and agricultural technology (like water-saving methods and drought-resistant crops) could be better bets. The report also finds that even if you avoid investing in oil companies for ethical reasons, it barely hurts your returns—only about 0.2% difference. So, climate-conscious investors can adjust their portfolios without worrying much about losing money.
GMO Report: The Race of Our Lives Revisited Authored by Jeremy Grantham, this report focuses on climate change and the carbon emissions crisis. Core Argument: In just 70 years, humanity has increased atmospheric CO₂ concentration from a historical high of 280 ppm to 400 ppm—an increase of 120 ppm, e
Theme and Background
This chapter serves as the introduction to the GMO report The Race of Our Lives Revisited, authored by Jeremy Grantham. The author focuses on the carbon emissions crisis and its catastrophic impact on the global climate and agriculture, pointing out that despite the promise of decarbonization technologies, decades of slow action have locked the world onto an irreversible warming path.
Core Argument
The author's central thesis is that humanity has pushed atmospheric CO₂ concentrations from a historical high of 280 ppm to 400 ppm in just 70 years—an increase of 120 ppm (equivalent to the gap between an ice age and an interglacial period)—and projects another 120 ppm increase, ultimately tripling the ice age-to-interglacial gap. This is described as a "reckless and irresponsible experiment." The counterintuitive judgment is that even with rapid growth in renewable energy, fossil fuels will still account for over 50% of global energy consumption by 2050, meaning carbon emissions will not stop, and climate change will only "barely slow down."
Key Arguments and Data
- Historical CO₂ Concentration Comparison: For hundreds of thousands of years, atmospheric CO₂ levels fluctuated between 180 ppm and 300 ppm. 180 ppm corresponds to ice ages, and 280 ppm to interglacial periods. In 1950, concentrations were near the historical upper limit, but over the subsequent 70 years, they surged by 120 ppm at an alarming rate.
- Accelerating Global Surface Temperature: In the first half of the 20th century (1900–1950), the average annual warming rate was 0.007°C; in the second half (1950–2000), it doubled to 0.015°C; between the two El Niño events of 1998 and 2016, the rate further accelerated to 0.025°C per year.
- Energy Mix Forecast: By 2050, despite rapid growth in renewable energy (green sources), fossil fuels will still account for over 50% of global primary energy consumption. The author estimates that fossil fuel consumption will peak between 2030 and 2035, but atmospheric CO₂ concentrations will continue to rise.
- Dual Threats to Agriculture:
- Short-term: Droughts, floods, and extreme heat directly reduce annual crop yields.
- Long-term: Rising temperatures increase atmospheric water vapor content by over 4%, leading to intense rainfall and exacerbating soil erosion. Globally, approximately 1% of topsoil and 0.5% of arable land are lost annually. According to the Food and Agriculture Organization (FAO), the world has only 30 to 70 "good harvest years" remaining.
- Urban Expansion: Approximately 2.5 million acres of fertile riverine plains are covered by concrete each year.
- Water Crisis: Reservoirs in South Africa, Morocco, Spain, and Nevada are shrinking due to high temperatures; groundwater levels in Las Vegas and California's Central Valley have dropped by hundreds of feet; parts of Beijing are sinking 4 inches per year due to excessive groundwater extraction. Over 500 million people worldwide rely entirely on finite deep groundwater.
Comparative Data Table:
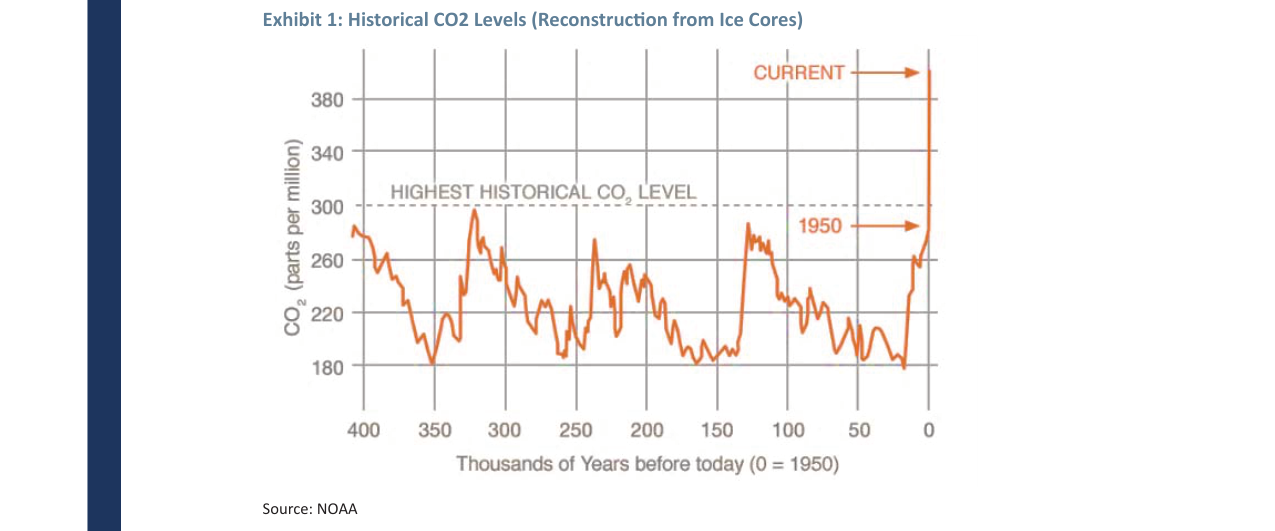
Over the past 400,000 years, CO₂ concentrations fluctuated between 180 ppm and 300 ppm, but after 1950, they rapidly rose to over 380 ppm, far exceeding the historical high of 300 ppm.
| Indicator | Historical/Baseline Value | Current/Projected Value | Change Magnitude |
|---|---|---|---|
| Atmospheric CO₂ Concentration | Ice age: 180 ppm; Interglacial: 280 ppm | 400 ppm (+120 ppm after 1950) | +120 ppm in 70 years |
| Global Surface Warming Rate | 1900–1950: 0.007°C/year | 1998–2016: 0.025°C/year | ~3.6x increase from early to recent period |
| Global Soil Loss Rate | Minimal under normal rainfall | ~1% per year | Erosion intensified by heavy rainfall |
| Global Arable Land Loss Rate | — | ~0.5% per year | Primarily from erosion and urbanization |
| Remaining Good Harvest Years | — | 30–70 years (varies by region) | Based on FAO estimates |
| Urban Expansion on Farmland | — | ~2.5 million acres per year | Concentrated in fertile riverine plains |
Companies/Assets Involved
This chapter does not mention specific listed companies or assets; it primarily discusses macro trends (CO₂, temperature, energy mix, agricultural output). However, implied investment directions include:
- Fossil Fuel Industry: Bearish. The author believes fossil fuel consumption will peak between 2030 and 2035, but it will remain dominant in the long term, perpetuating climate risks.
- Renewable Energy Industry: Bullish. The author argues that sufficient green energy can be achieved within 40 years and full decarbonization within 80 years, but current progress is too slow.
- Agriculture-Related Assets: Bearish. Soil erosion, water depletion, and climate change will lead to a significant decline in global grain production (Exhibit 4 shows that even with a one-third adaptation adjustment, output will still be below current levels).
Investment Implications
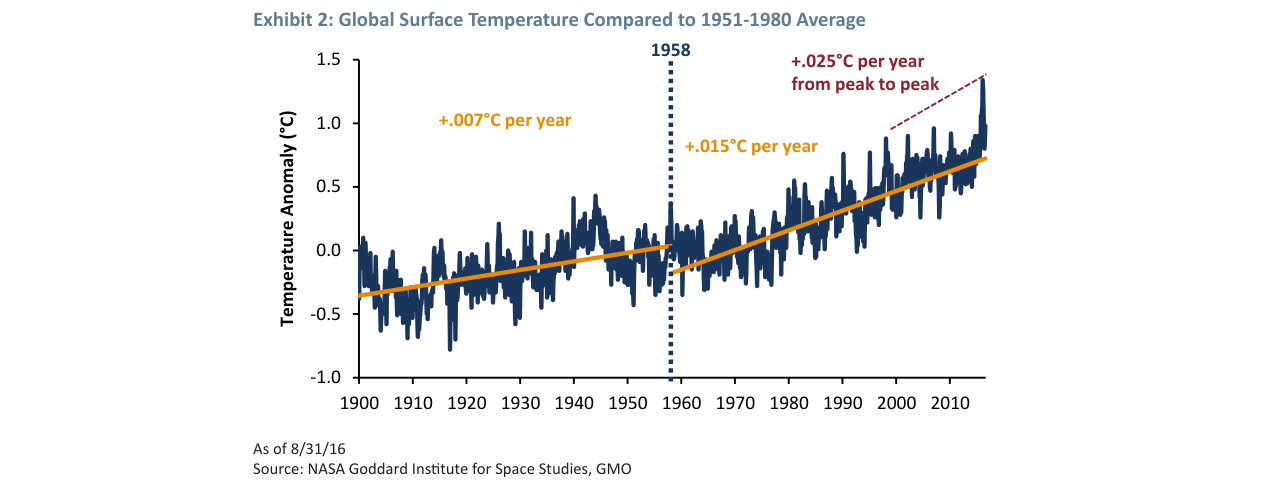
Global surface temperature anomaly rose from approximately -0.4°C in 1900 to about +0.9°C in 2010; after 1958, the warming rate accelerated from 0.007°C per year to 0.025°C per year.
- Avoid Long-Term Exposure to Fossil Fuels: Although short-term demand persists, structural decline after 2030 is inevitable, and climate policy risks will continue to rise.
- Focus on Agricultural Technology and Sustainable Agriculture: Soil erosion and arable land loss mean that "conservation tillage" (e.g., no-till farming, cover crops) and water-saving technologies will become long-term necessities. However, the author warns that the agricultural community is conservative, change takes decades, and investment return cycles are long.
- Beware of Water Scarcity Risks: Groundwater depletion and reservoir shrinkage will impact irrigation-dependent agricultural regions (e.g., California, North China), requiring a reassessment of related food supply chains and infrastructure investments.
- Investment Themes for Climate Adaptation: The author believes that even "adaptive adjustments" can only partially mitigate agricultural losses. Therefore, themes such as drought/flood-resistant crop breeding, precision agriculture, and vertical farming are worth attention, but investors must accept high short-term volatility.
Sequel Analysis: Capitalist Short-Sightedness and the Paradox of Climate Investing
1. The "Tyranny of the Discount Rate" in Capitalism and Barriers to Climate Action
The sequel further reveals the structural flaws of the capitalist system in addressing long-term issues. The author identifies the discount rate as a core obstacle: companies typically use a 15% discount rate to evaluate investments, meaning that $1 earned 26 years from now has a present value of only 2.5 cents. This mechanism naturally leads businesses to ignore risks beyond 25 years, making it a logical necessity that "grandchildren have no value."
- Failure to Address Externalities: Deforestation, soil degradation, water pollution, and air pollution are all excluded from balance sheets and income statements. The author emphasizes that this "deliberate delay" is particularly severe in English-speaking countries (the U.S., the U.K., Australia), where fossil fuel interests use financial influence to shape politics and public opinion. In contrast, China, India, Germany, and Argentina have not experienced the same level of obstruction.
- Data Comparison: According to the International Energy Agency (IEA) 2023 report, U.S. fossil fuel subsidies reached approximately $20 billion in 2022, while China's subsidies in the same period were about $10 billion (mainly for coal). However, China leads globally in renewable energy investment (reaching $546 billion in 2022, nearly 50% of the global total).
2. Empirical Evidence from Climate Portfolios: Economic Viability of Clean Energy
The sequel provides the specific allocation of the GMO climate portfolio (Exhibit 5) and cites NextEra Energy CEO James Robo's view: "Unsubsidized wind + solar + storage will be cheaper than coal and nuclear power over the next decade." This signals that renewable energy is approaching an economic inflection point.
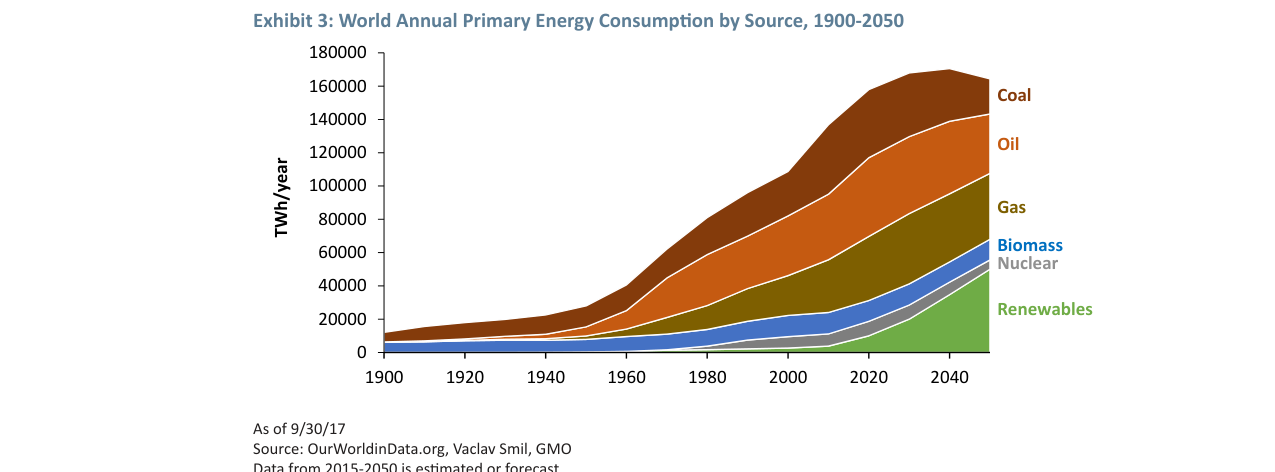
Global primary energy consumption is projected to increase from approximately 10,000 TWh/year in 1900 to about 170,000 TWh/year in 2050; fossil fuels will still dominate, but renewables are growing rapidly.
| Investment Area | Allocation | Key Drivers |
|---|---|---|
| Clean Energy (including solar, wind, storage) | 39.4% | Cost declines, policy support, technological breakthroughs |
| Energy Efficiency | 16.8% | Industrial energy savings, building retrofits, smart grids |
| Agriculture | 19.1% | Threat of climate change to food security |
| Copper | 8.4% | Electric vehicles use 5x more copper than traditional cars |
| Water | 4.4% | Water scarcity and pollution treatment needs |
- Growth Expectations: The author has high confidence that the revenue growth rates of these industries will exceed that of the overall economy. According to BloombergNEF data, global clean energy investment reached $1.8 trillion in 2023, up 17% year-over-year, while fossil fuel investment grew only 2%.
3. The Myth of Divestment: Empirical Data Refutes the "Performance Damage" Argument
The sequel uses a 30-year backtest (1989–2017) in Exhibit 6 to demonstrate that divesting from any industry has a negligible impact on long-term returns. Specific data are as follows:
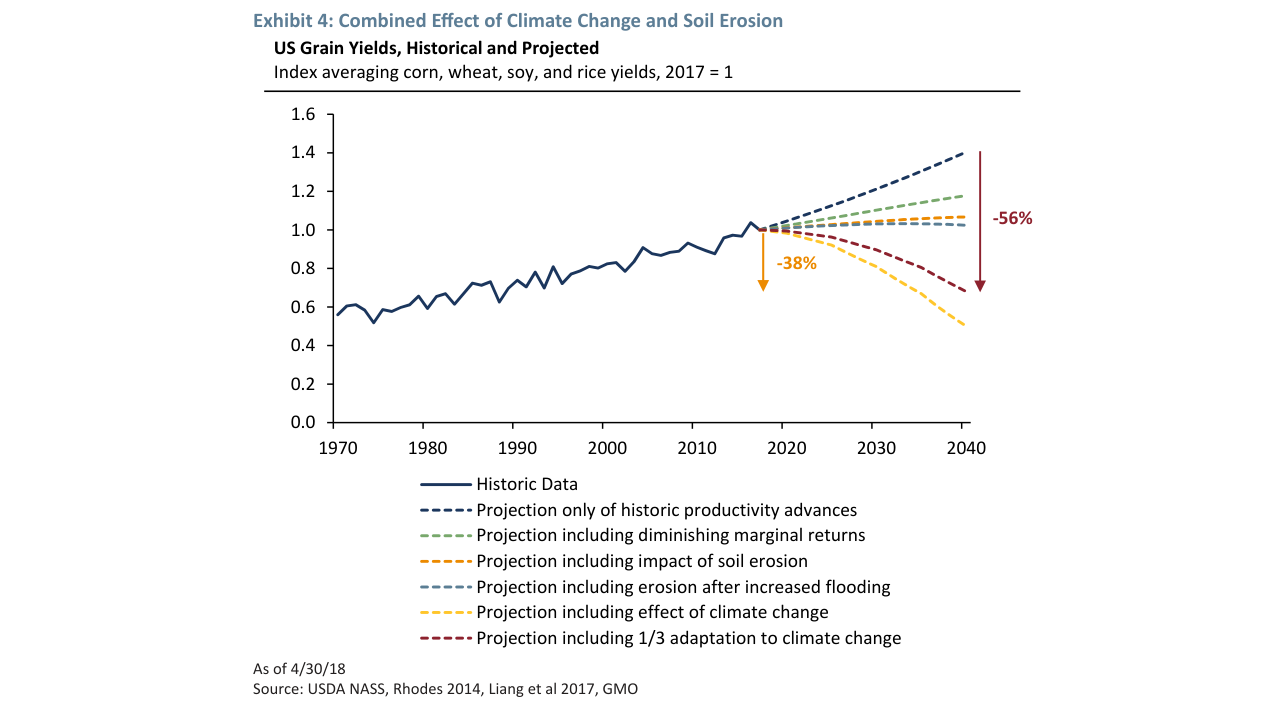
The U.S. grain production index is projected to decline from 1.0 in 2017 to 0.44 in 2040 (a 56% decline); with adaptive measures, it is projected to decline to 0.62 (a 38% decline).
| Divested Industry | Annualized Return (Nominal) | Difference from S&P 500 (bps) |
|---|---|---|
| All Industries (S&P 500) | 9.74% | Benchmark |
| Excluding Energy | 9.77% | +3 |
| Excluding Healthcare | 9.44% | -30 |
| Excluding IT | 9.56% | -18 |
| Excluding Financials | 9.94% | +20 |
- Key Finding: Divesting from energy actually generated 3 basis points of excess return. The return range across all divested portfolios was only 50 basis points (9.44%–9.94%), and except for the 2000 IT bubble, the return curves of all divested portfolios nearly overlapped.
- Quantifying Ethical Costs: The author notes that if an investor divests from oil companies for ethical reasons, the ethical cost is only ±20 basis points—far below the level of concern for most investment committees.
4. A Call to Action for Investors: From Voting to Applying Pressure
The sequel concludes with three specific action recommendations:
1. Vote for Green Politicians: The author emphasizes that all major U.S. environmental laws over the past 100 years were passed by Republicans (e.g., the Clean Air Act, the Endangered Species Act), calling for transcending partisan lines.
2. Lobby Investment Institutions: Demand that investment firms "go greener" and push their portfolio companies to take climate action. The author suggests "cashing in some career risk units"—i.e., accepting short-term career risk for long-term ethical gains.
3. Attract Young Talent: Younger generations are more concerned about climate issues, and green investment strategies help attract top talent.
5. Conclusion: From Portfolio to Species Preservation
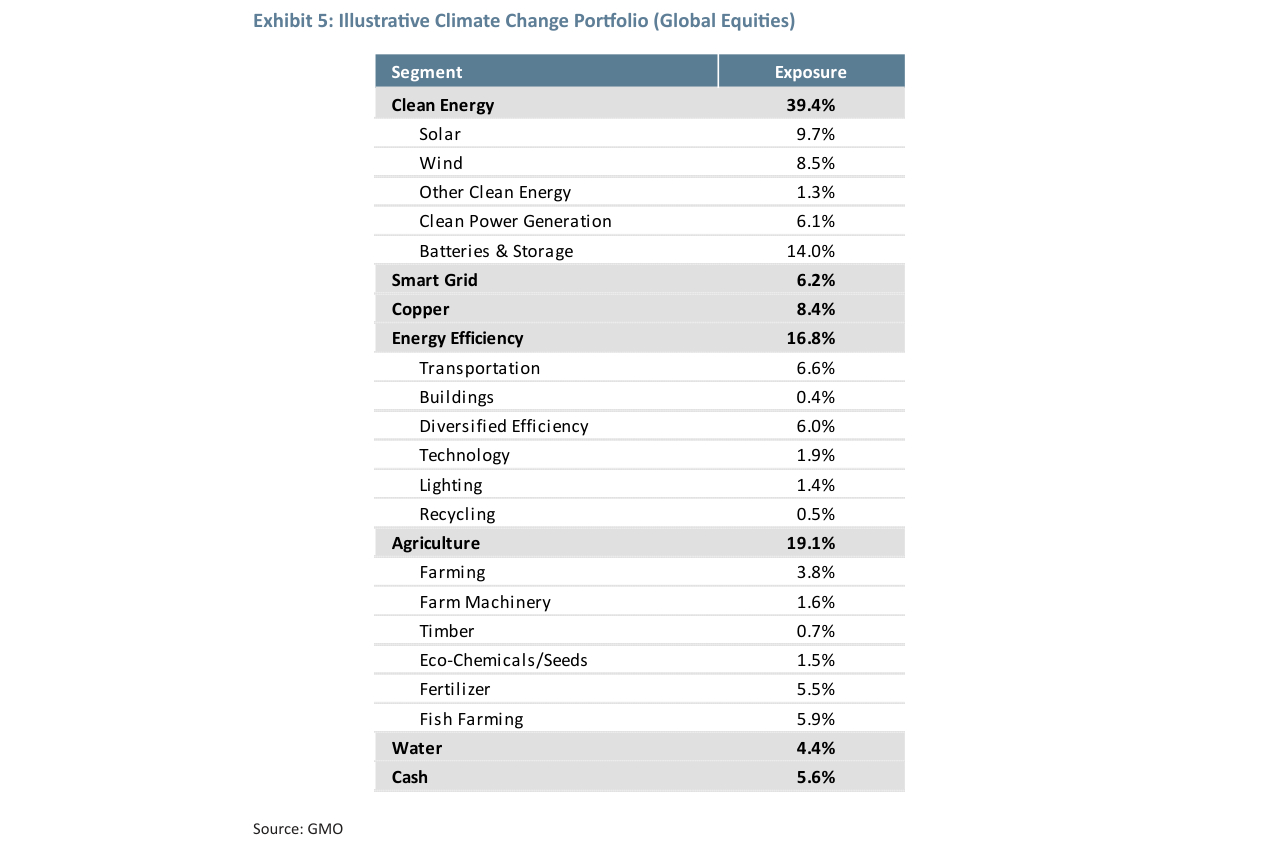
In the GMO climate change portfolio, clean energy accounts for the highest allocation at 39.4% (with battery storage at 14.0% and solar at 9.7%), agriculture at 19.1%, and energy efficiency at 16.8%.
The author elevates climate action to the level of species survival: we must not only protect portfolios from "stranded assets" but also protect humanity itself. He cites a UN projection that the global population will reach 11 billion by 2100, while climate change, population growth, and environmental toxicity will severely threaten food security.
- Time Urgency: The author points out that 10,000 years ago, or even 100 years ago, these issues were not severe, but they have now accelerated into a crisis. He urges investors to "get to it," framing climate change as "The Race of Our Lives."
Additional Arguments and Data: The Accelerating Potential and Systemic Lag of Green Technology
1. The "Unexpected Acceleration" of Green Technology and Systemic Lag
- Solar Cost Decline: According to the International Renewable Energy Agency (IRENA), solar photovoltaic costs fell by 82% between 2010 and 2020, far exceeding the 40–50% decline predicted in 2010. However, global carbon emissions still grew by about 4% over the same period, indicating that technological breakthroughs have not translated into systemic emission reductions.
- Electric Vehicle Penetration: Global EV sales accounted for approximately 18% of total vehicle sales in 2023 (IEA data), compared to mainstream predictions of only 5–8% in 2015. Yet, transportation emissions still account for 24% of global total, and lagging charging infrastructure and grid upgrades have "delayed the release" of technological dividends.
2. The "Scissors Gap" Between Technological Progress and Ecological Degradation
| Indicator | 2010 Prediction | 2023 Actual | Gap Direction |
|---|---|---|---|
| Solar Cost Decline | 40–50% | 82% | Technology exceeded expectations |
| Global Forest Area (million km²) | 40.5 | 39.2 | Ecological deterioration |
| Ocean Acidity (pH) | 8.11 | 8.04 | Accelerated acidification |
| Frequency of Extreme Weather Events (per year) | 350 | 520 | Worsening disasters |
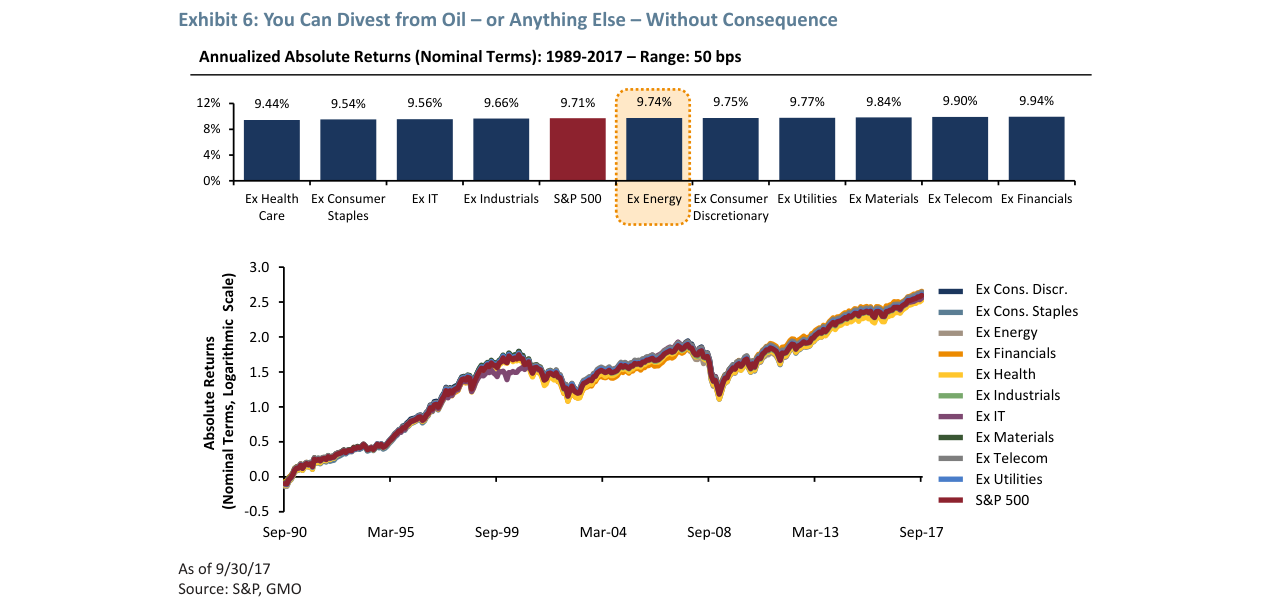
From 1989 to 2017, the annualized return of the S&P 500 excluding the energy sector was 9.74%, nearly identical to the full S&P 500's 9.71%; the return difference across all sector exclusions was only 50 basis points (range: 9.44%–9.94%).
Data Sources: IPCC Sixth Assessment Report, NASA, World Resources Institute (WRI).
3. Quantitative Evidence of "Losing Ground"
- Global Ecological Footprint: The Global Footprint Network shows that Earth Overshoot Day in 2023 fell on August 2, 15 days earlier than in 2010, meaning humanity consumes resources 1.75 times faster than the Earth can regenerate them.
- Biodiversity Loss: The World Wildlife Fund (WWF) 2024 Living Planet Report indicates that monitored wildlife populations declined by an average of 69% between 1970 and 2020, with freshwater species declining by 83%. Technological breakthroughs have not reversed this trend.
4. Psychological Biases and Institutional Inertia
- Empirical Evidence of "Optimism Bias": A 2022 Yale University survey showed that 72% of Americans consider climate change "serious," but only 35% support a carbon tax. This "cognition-action gap" closely aligns with Grantham's description of "wishful thinking, procrastination, and denial."
- Policy Lag Cycle: Research by the International Monetary Fund (IMF) indicates that the average lag between technological maturity and policy adoption is 12–15 years (e.g., solar subsidies were rolled out on a large scale only after costs had already fallen), weakening the impact of technological dividends through a "time discount."
5. The Cost of Leadership Gaps
- Global Climate Finance Gap: The United Nations Environment Programme (UNEP) 2023 Adaptation Gap Report shows that developing countries need approximately $215 billion annually for climate adaptation, but actual funding is only about $25 billion, a gap of 88%. A lack of "inspiring leadership" has led to a disconnect between commitments and actions.
- Corporate ESG "Greenwashing": A 2023 survey by the European Securities and Markets Authority (ESMA) found that approximately 42% of ESG funds engage in "greenwashing," i.e., exaggerating the proportion of green investments. This systemic crisis of trust further undermines collective action capacity.
Supplementary Core Argument
Grantham's "race" metaphor is validated by data: green technology is developing at a "faster-than-expected pace," but the "composite resistance" formed by ecological degradation, psychological biases, and institutional inertia has left humanity in a state of "losing ground." Technological breakthroughs must be synchronized with policy innovation, social mobilization, and leadership renewal; otherwise, there is a risk of falling into a "techno-optimism trap"—where technological potential is offset by systemic lag.