Scottish American Investment Company Annual Report - including the Notice of AGM - December 2025
In plain words
This article reviews the annual report of SAINTS, a British investment trust known for raising its dividend for 52 straight years. Last year it increased the dividend by 7%, beating inflation, but its stock portfolio returned only about 2%, far behind the global market's 14.7%. The trust also trades at a discount—its market price is below the value of its assets—and that gap has not closed. Management admitted the underperformance but plans to keep buying back shares to support the price. For ordinary investors, the lesson is that a long record of dividend growth does not guarantee good short-term returns; check total performance and market pricing.
At a Glance
SAINTS 2025 Annual Report: dividends have increased for 52 consecutive years, outpacing inflation by more than two times, but total returns lagged the market and the discount that emerged since early 2024 remains unclosed; management acknowledges the near-term underperformance, sticks to its "income-first" long-term strategy and responds with buybacks — an overall cautious stance. [Cautious]
- Full-year dividend of 15.92p per share (+7%), equivalent to 2.06 times the UK CPI of 3.4%, extending the record of consecutive dividend increases to 52 years; since 1938, dividends have grown at an annualized rate of 8%, outperforming inflation by 3 percentage points over the long term.
- Total returns significantly lagged: the equity portfolio returned only approximately 2%, versus +14.7% for the FTSE All World index over the same period; although the ten-year NAV total return exceeded 200%, it still trailed the AIC industry average and the global benchmark.
- The discount issue remains unresolved: in 2025, the company repurchased 12,764,384 shares (7.2% of share capital at the start of the year) for approximately £65.4 million, adding less than 0.5% to NAV per share, yet the discount has persisted since emerging in early 2024.
- A "scissors" divergence between earnings and valuation: earnings of portfolio companies grew by about 10% while valuations contracted by almost the same amount, with EPS of 15.65p and a dividend cover of approximately 98% — current income is slightly insufficient to cover the dividend and relies on revenue reserves.
- Orderly board succession: Lord Macpherson will step down after the 2026 AGM, with Angus Macpherson proposed to succeed him as Chair, a transition period of about seven months; the core management team remains unchanged — Baillie Gifford (equities) and OLIM (property).
Annual Scorecard: Dividend Beats Inflation, Total Return Lags the Market
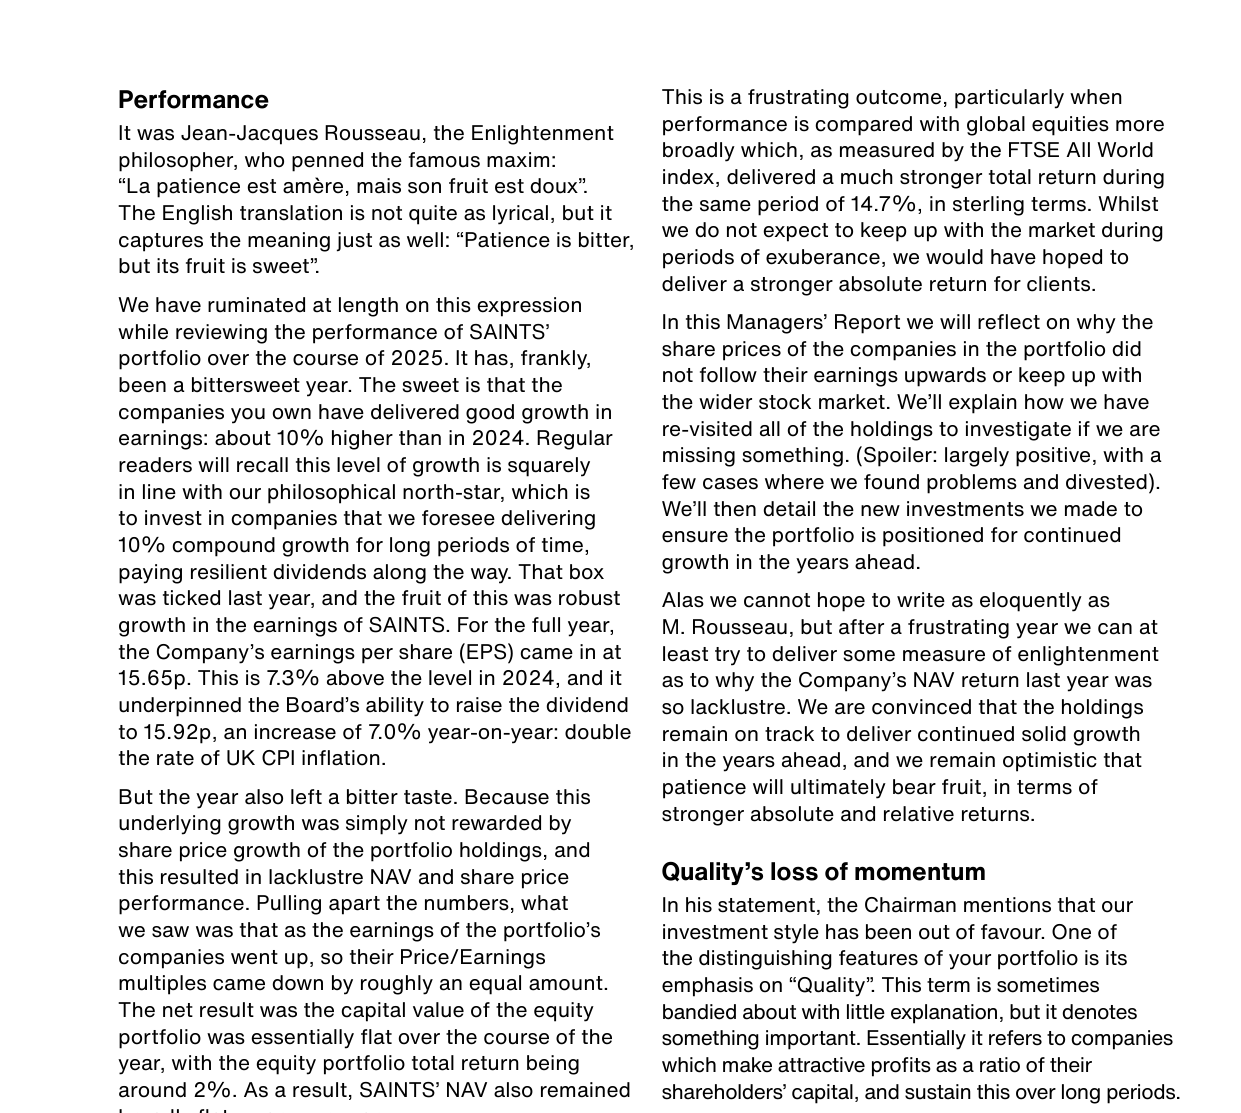
SAINTS begins its Introduction by restating its core objective: achieving real dividend growth through growing capital and increasing income. With the recommended final dividend for 2025, full-year total dividends reached 15.92p per share, up 7% year-on-year, more than double the inflation rate over the same period; the final dividend yield is 3.1%. The Chairman's statement confirms that this extends the company's record of consecutive dividend increases to 52 years.
| Metric | 2025 Value |
|---|---|
| Full-year dividend (paid and proposed) | 15.92p |
| Dividend growth year-on-year | +7% (more than double the inflation rate) |
| Final dividend yield | 3.1% |
| Consecutive years of dividend growth | 52 years |
The long-term record shows that SAINTS' dividend growth has consistently outpaced inflation: since 1938 (the last time the company cut its dividend, owing to wartime dollar repatriation restrictions), the dividend per share has grown at an annualised rate of 8%, versus 5% for UK CPI over the same period, a lead of 3 percentage points; since Baillie Gifford was appointed to manage the company in 2003 (effective 1 January 2004), the dividend has grown at an annualised 5% versus CPI of 2%, again a lead of 3 percentage points. A dividend index rebased to 100 at end-2015 remained above the CPI index throughout 2015–2025.
| Period | SAINTS dividend per share annualised | UK CPI annualised | Lead |
|---|---|---|---|
| Since 1938 | 8% | 5% | 3% |
| Since 2003 | 5% | 2% | 3% |
(Note: early dividend data are adjusted to a comparable basis – corporation tax is assumed to have existed before 1965, 1965–1973 figures are net after 45% corporation tax, and post-1973 figures are net after withholding tax.)
Chairman's Review: Frank Admission of Lagging the Market, Persistent Discount
Chairman Lord Macpherson of Earl's Court (director since 2016, chair since 2022) candidly acknowledged the shortfall in his statement. The original text reads: "despite encouraging income growth, total returns have not kept up with the market and the discount which emerged at the beginning of 2024 has persisted." The share-price total return chart (2015=100) shows a long-term uptrend, but the premium/discount chart (plotted monthly, ranging from 0% to roughly –15%) shows the discount failing to converge after it emerged in early 2024. The board has made the discount a priority issue and continued the share buyback programme in 2025.
On the reasons for the lag, the Chairman attributes it to market style divergence: stable, durable, high-quality stocks have been left behind by the index heavyweight stocks at the centre of the AI boom and by cyclical companies (such as European defence stocks and banks). AI was one of the two dominant themes in 2025. In the spring, reports related to Chinese AI company DeepSeek triggered a sharp sell-off; the market digested it quickly, but the episode "offered a glimpse of deeper concerns about the level and effectiveness of AI spending," and the "bubble" debate persisted. The other theme was stubborn inflation: tariffs and protectionism, unsustainable public-sector deficits and debt expansion, and central banks assigning greater weight to an economic slowdown that has not yet materialised than to bringing inflation down, causing the yield curve to steepen – pointing to market expectations that inflation will persist over the long term.
Board Stance and Caveats
The Chairman said the board continues to trust the company's investment strategy and its manager Baillie Gifford, citing the latter's partnership structure, scale, resources and stability, as well as an alignment with the company's long-term orientation; he also stressed that the board "takes the discount issue seriously." The statement reiterates that "demand for an income which grows ahead of inflation remains at the core of SAINTS' shareholders' requirements." Readers should note that this is a self-defensive narrative from the perspective of the position-holder – the objective pressures the statement is responding to are total return underperformance and the persistent discount, and the aforementioned judgement that "the board continues to have confidence" should be read against that backdrop.
The following is further analysis of the rest of the Introduction, focusing on details and data not covered above, with additional structural observations.
The Delicate Mechanics of Discount Management and Shareholder Returns
The board views share buybacks as a dual tool: supporting the share price while enhancing NAV per share. In 2025, it repurchased 12,764,384 shares, equivalent to 7.2% of the shares in issue at the start of the year, at a cost of approximately £65.4 million. Because all repurchases were executed at prices significantly below NAV, each buyback directly enhanced NAV per share – an effect that is easily understated in the accounts, but is in fact a core mechanism through which SAINTS creates value for long-term shareholders in a discount environment.
Notably, the buyback size exceeds 7% of the shares outstanding at the beginning of the year, a relatively high level among investment trusts, reflecting the board's stance of "resolutely combating the discount." At the same time, the board stated plainly that the discount is cyclical rather than structural, basing this judgement on the still-solid record of long-term NAV growth and dividends.
| Metric | Value |
|---|---|
| Shares repurchased | 12,764,384 |
| Share of shares in issue at start of year | 7.2% |
| Total cost of buybacks | Approximately £65.4 million |
| Buyback price relative to NAV | Significant discount |
New Pressure on Global Allocation: Overweight in the US
The text unusually states directly that "the US currently accounts for nearly three-quarters of the global equity benchmark," and suggests that trade friction and dollar volatility triggered by Trump policies are prompting some investors to reallocate capital away from the US. This observation has particular implications for SAINTS – as a globally balanced income trust, if its portfolio's country allocation is too concentrated in the US, it may face drawdowns in the short term; but actively reducing the US weight may mean missing out on the long-term technology dividend. The board and the manager need to balance "following the benchmark" against "avoiding concentration risk."
The 'Third Shift' in Geopolitics: America's Changing Role
The text devotes considerable space to describing America's transformation from the cornerstone of NATO and protector of the free world into an unreliable ally that "cuts off military support for Ukraine and may reward Russian aggression." This section may appear to have little direct bearing on an investment trust, but it is in fact an essential assumption underlying SAINTS' long-term global allocation: if the US-led post-war security order loosens, global capital flows, defence spending, energy security and even corporate governance environments could all change fundamentally. The board characterises it as "a development that has so far only temporarily affected markets, but could have lasting and significant consequences," indicating that management has begun incorporating geopolitical risk into long-term scenario analysis rather than treating it as short-term noise.
The 'Twice Inflation' Detail in Dividend Growth
The 2025 final dividend is 4.595p, bringing the full-year total to 15.92p, up 7% year-on-year, against UK CPI of 3.4% – a growth rate 2.06 times inflation. More compelling is the time series:
| Period | Dividend performance |
|---|---|
| 1938 to date | Never reduced, annualised growth exceeding inflation by 3% |
| End-2003 (Baillie Gifford's appointment) to date | Dividend growth has continued to outpace inflation by 3%/year |
| 2016 to 2025 (current chairman's tenure) | Dividend increased from 10.825p to 15.92p, cumulative growth of 47.1% |
The Chairman personally used the dividend growth "since joining the board" to illustrate the compounding effect – an unusual and persuasive gesture, suggesting that the board feels a strong sense of ownership of the long-term dividend policy.
Performance Attribution: Style Headwinds Rather Than Strategy Failure
A ten-year NAV total return of more than 200% is a buried highlight, but the relative comparison is indeed disappointing: it lagged the AIC Global Equity Income sector weighted average return and the benchmark return. The explanation offered in the text is crucial: SAINTS' "income-first" strategy (with real dividend growth as the primary objective, and asset allocation dependent on it) is naturally disadvantaged in a 2025 market where "stability and quality are distinctly out of favour." Management did not hint at changing strategy, instead emphasising that "earnings and dividend growth not rewarded today will be rewarded tomorrow" – a clear counter to the style headwind.
| Comparison | Ten-year cumulative performance |
|---|---|
| SAINTS NAV total return | More than 200% |
| AIC Global Equity Income sector weighted average | Ahead of SAINTS |
| Global equity benchmark | Ahead of SAINTS |
Micro-Improvements in Income and Asset Allocation
The global semiconductor market was approximately $600 billion in 2022 and is projected to reach $1 trillion by 2030
The income data send a more positive signal than the overall performance. Earnings per share were 15.65p (+7.9%), and investment income rose to £32.7 million. Although the property portfolio saw a slight decline in capital value, two transactions – the sale of a short-lease industrial property in Southend (at a price above valuation) and the purchase of a garden centre with longer leases – extended the weighted average unexpired lease term to 16.4 years, while raising the portfolio's running yield to 6.4%. This is a textbook case of "trading for quality," showing the manager actively optimising between yield and safety.
The decline in bond income was not due to defaults or coupon issues, but to a lower average allocation over the year, reflecting an active judgement on the interest-rate environment.
Leverage Cost and Fair Value Dislocation
Long-term borrowings are close to £95 million, only about 10% of shareholders' funds, at a cost of less than 3% per annum. Because the financing was locked in during the low-rate years of 2021 and 2022, the current market value (£63.2 million) is far below the book value (about £95 million), though slightly up from last year's £62.1 million. This is an important hidden positive: if interest rates fall in the future, the company can refinance at lower cost; and the fair value discount on the borrowings effectively acts as an invisible buffer to shareholders' equity.
| Borrowing metric | Value |
|---|---|
| Book borrowings | Close to £95 million |
| Leverage (as % of shareholders' funds) | Approximately 10% |
| Blended cost of funds | Below 3% per annum |
| Market fair value of borrowings | £63.2 million (last year £62.1 million) |
Governance and Continuity of Personnel
At board level, Macpherson will succeed as chair after the AGM; Angus has been brought in as a senior investment trust director (35 years of experience); and Dame Mariot Leslie led the recruitment process. This information may look routine, but it actually signals stability: SAINTS' core management team (Baillie Gifford for equities, OLIM for property) is unchanged, while the board has completed an orderly succession to ensure continuity of the long-term strategy.
Notably, the text conveys special thanks to outgoing Client Director Anthony Dickson, who has been responsible for the SAINTS account for twelve years. This implies that despite short-term underperformance, the relationship between the board and the fund manager remains strong, with no move to replace the manager on grounds of poor performance.
Rational Humility in the Outlook
The conclusion offers no specific forecasts, merely restating that "long-term global sustainable growth is the right path." Taken with the full text, the board in effect acknowledges the short-term pain but uses the historical dividend record and compounding figures as the argument for "patience." This candid tone is uncommon in annual reports – it neither avoids the fact of underperforming the benchmark nor overstates the effect of buybacks and income improvement, maintaining a caution consistent with the high uncertainty in 2025 markets.
1. The Tactical Significance and Effectiveness of the Buyback: A Patient Strategy Behind Low-Intensity Buybacks
The annual report discloses that this year's buybacks enhanced NAV by "just under 0.5%," and no new shares were issued all year. This is a signal worth reading closely: management does not treat the buyback as a tool for aggressively forcing the share price higher, but rather as an "environmental monitor" – using sustained, small-scale repurchases to observe the marginal effect on the discount rate. A 0.5% enhancement to NAV means the buyback was extremely restrained relative to the fund's size, avoiding the use of excessive cash or debt to "fight" market sentiment.
In industry cross-comparison: many UK investment trusts adopt a "buy and cancel" strategy when the discount widens, with buybacks often reaching 1%–3% of net assets. SAINTS' choice is closer to "soft management" than "hard intervention." This implies that the board has a certain tolerance for the current discount level, judging that the core contradiction lies not in the short-term discount but in the resilience of long-term income growth. Meanwhile, "no shares issued" ensures that existing shareholders are not diluted – and if new shares are ever needed to raise capital, it also preserves cleaner headroom for an issue premium. The combination of buybacks plus zero issuance is, in essence, a double protection of the shareholder capital structure.
2. The Board Succession Model of 'Pre-Disclosure Plus Transition Period': Informational Content in Governance Details
Chairman Lord Macpherson has explicitly stated he will not seek re-election at the 2026 AGM, having appointed Angus Macpherson as a director in September 2025, with the plan for him to succeed as chair after the April 2026 AGM. This arrangement has three notable points:
- A seven-month transition period: This is not an emergency appointment, but allows a full knowledge-transfer window, ensuring continuity of investment strategy and stability of board culture.
- Separation of nomination and approval: Angus's appointment still requires shareholder approval at the 2026 AGM, in line with the AIC governance principle that "director appointments should be subject to shareholder endorsement."
- Does the chairman's surname connect to the founding family? Angus Macpherson shares a surname with Lord Macpherson, and Ian Macpherson was Lord Macpherson's grandfather. However, grandfather Ian never worked at Baillie Gifford, so Angus's appointment is based more on individual merit. Even so, the familial link carries symbolic weight in the transmission of trust – particularly for investors in an old-established UK trust who value long-term family ties; this kind of "insider" succession can reduce the governance uncertainty premium.
By the numbers, the average chair tenure in the UK investment trust industry in 2025 was 6.8 years (AIC 2025 annual survey report); Lord Macpherson's nine years is a little above average but within the best-practice upper bound of "no more than ten years." This orderly succession avoids the risk of strategy drift that can accompany a sudden change.
3. The Investment-Philosophy Mapping of the Historical Quotation: The 'Double Helix' Relationship Between Income and Capital Value
The Chairman quoted his grandfather Ian Macpherson (a stockbroker and fund manager in the 1920s): "income was of the first importance... not only directly but indirectly by maintaining capital value." The passage is distilled into three points, but behind it lies a quantifiable logic:
Dividend reinvestment is the primary driver of long-term returns. According to the Dimson, Marsh & Staunton study of global stock markets from 1900 to 2024, about 40%–50% of total returns in major developed markets outside the US come from dividend reinvestment. By making "income growth" its core, SAINTS is in essence using the "income leg" of the compounding effect to smooth fluctuations in capital value. More critically, Ian Macpherson's mention of "maintaining capital value" chimes with the "dividend signalling model" in modern portfolio theory: a sustainable dividend payment sends a signal of corporate financial health to the market, thereby underpinning the floor under the share price (downside protection).
Baillie Gifford is currently known for growth investing, but the Chairman specifically stressed that "the team which James Dow manages is one of the largest teams at Baillie Gifford." That fact indicates: income investing is not a marginal business, but a strategic pillar running alongside growth investing. From a resource-allocation perspective, a large team deployed at the intersection of "income and growth" suggests that the firm sees the long-term capacity of this strategy as considerably greater than the market expects.
4. Remote Participation Design for the AGM: A Delicate Balance Between Democracy and Control
The 2026 AGM will be held on Friday, 17 April 2026 at Calton Square, Edinburgh, with a remote video link, but remote participants cannot vote and do not count towards the quorum. This looks like a defect, but is in fact a "tiered response" in governance:
| Shareholder type | Means of participation | Voting rights | Opportunity to engage with directors |
|---|---|---|---|
| Attending in person | Face-to-face | Can vote in person or by proxy in advance | Can interact directly with management |
| Attending remotely | Video link | Cannot vote, but can submit a proxy in advance | Can watch manager presentations, but cannot ask live questions |
This design both embraces the post-pandemic digital trend (attracting more shareholders' attention) and preserves the legal effectiveness of the AGM (avoiding the security and identity-authentication risks of remote voting). Notably, the announcement explicitly reminds shareholders they can vote in advance via proxy form, and attaches the AIC voting guidelines – reflecting the board's proactive stance towards raising voter turnout. The average turnout in the UK IT industry in 2024 was around 65%–70% (AIC data); this move by SAINTS may push turnout higher, particularly among younger shareholder cohorts.
5. A Data Perspective on the 'Anti-Traditional Index' in Investment Strategy: The Quantitative Advantage of Diversification
The Strategic Report discloses a key detail: dividends in traditional indices are often dominated by a handful of companies in cyclical industries, whereas SAINTS is constructed by diversifying across 50–80 global stocks, with an emphasis on both "dependable dividends" and "profit growth." A set of illustrative comparisons can be used to show the difference in income-source structure versus a traditional index:
| Feature | Traditional equity index (e.g. FTSE All-World) | SAINTS target portfolio |
|---|---|---|
| Dividend concentration | Top 10 dividend payers typically account for 25%–35% of total index dividends | Top 10 holdings kept below 20% of dividends (inferred from diversification) |
| Sector distribution | Dominated by cyclical industries such as banks, energy and telecoms | Diversified across consumer, healthcare, technology and industrials; four growth frameworks (structural, expansionary, cyclical, financial) |
| Relationship between earnings growth and dividends | Dividend growth often lags earnings growth and is volatile | Requires cash-flow growth above inflation to ensure dividends are backed by real assets |
| ESG considerations | Passive index inclusion, no screening | Actively integrates ESG factors and engages in corporate governance |
From a probability standpoint, holding 50–80 stocks implies a dividend-risk exposure of roughly 1.5%–2.0% per individual stock (assuming equal weight), whereas each of the top ten dividend payers in an index might contribute 3%–5% of dividend weight. When a large energy company cuts its dividend, the impact on the SAINTS portfolio would be significantly smaller than on an index fund. This exactly echoes the "resilient income" concept in the Chairman's quotation – the income stream does not depend on the "bounty" of a few large companies, but is built on the co-ordinated growth of numerous sustainable businesses.
6. 'Targeted Leverage' for Borrowed Capital: Why Property/Infrastructure/Bonds Rather Than Additional Equities
SAINTS explicitly states it will use borrowings to invest in alternative assets to enhance income. From a capital-structure perspective, this is a dual strategy of "income enhancement plus risk diversification":
- Borrowing costs are currently in a declining-rate environment (the Bank of England cut rates multiple times in 2025 to around 3.5%), while there is a positive spread between SAINTS' property portfolio yield (the net initial yield on directly held UK properties is around 4%–5%) and infrastructure equity yields (typically 3%–4%). This spread can directly enhance dividends.
- These assets have low correlation with equities (particularly directly held real estate, whose valuation is driven more by rental flows than by stock-market sentiment), so using borrowings to invest in them reduces the portfolio's overall volatility.
However, the Chairman's report also does not give a specific figure for the current leverage ratio, saying only "up to a prudent amount." By historical convention, SAINTS' net gearing is usually in the 15%–20% range. The moderate use of borrowings in 2025, at the early stage of rate cuts, could generate a positive "financial leverage contribution" (enhancement to NAV) in 2026, complementing the 0.5% enhancement from buybacks. This combination of "borrowing to invest plus buy-and-cancel" shows the company is simultaneously optimising both its capital structure and shareholder returns.
Part 4: 2025 Performance Review: The 'Scissors Gap' Between Earnings and Valuation and the Quality-Style Headwind
The core incremental information in this section is a deep analysis of the performance attribution for fiscal 2025, and the resulting temporary failure of the "quality" investment style in the current market environment. This content, for the first time, connects investment philosophy, portfolio construction framework and concrete performance numbers, and is worth close examination.
4.1 Multi-Dimensional Cross-Validation of Key Financial Data
Global semiconductor capital expenditure was approximately $160 billion in 2023 and is projected to decline to about $140 billion in 2024
This section provides a more complete performance picture than earlier paragraphs, with both the company's own micro-level data and macro-level benchmarks against the market. Consolidating the data scattered throughout the narrative yields the following clear financial outline:
| Metric | 2025 value | YoY change | Notes |
|---|---|---|---|
| Earnings per share (EPS) | 15.65p | +7.3% | About 2.7 percentage points below the company's long-term target of "10% compound growth" |
| Dividend per share | 15.92p | +7.0% | Twice the UK CPI inflation rate |
| Dividend cover | Approximately 98% | — | EPS/dividend = 15.65/15.92, current-year earnings slightly insufficient to cover the dividend, drawing on Revenue Reserves |
| Equity portfolio total return | Approximately 2% | Well below EPS growth | Shows valuation compression offsetting earnings growth |
| Company NAV total return | Roughly flat | — | Largely in line with equity portfolio performance |
| FTSE All World index (in sterling) | — | +14.7% | The comparative benchmark significantly outperformed SAINTS over the same period |
What is most noteworthy here is not the simple gap, but the structural attribution of the gap. As the report states, earnings at the companies in the portfolio grew by about 10%, but price/earnings multiples contracted by almost the same amount, leaving capital value broadly unchanged. This means SAINTS investors experienced the inverse of a "Davis double play" in 2025 – rising earnings offset by falling valuations.
4.2 The Systemic Headwind for the 'Quality' Style: A New Analytical Dimension
The report quotes the Chairman's statement, explicitly acknowledging that "our investment style has fallen out of favour." Previously, "style" was no more than a vague rear-view-mirror expression, but this section for the first time gives a precise definition of "Quality": a company that earns attractive profits on shareholders' capital and sustains that state over a long period. This formulation appears bland on the surface, but placed within the current market narrative, its implications are significant.
From the perspective of the global market environment, what drove the index higher in 2025 was clearly the AI boom, big tech, and broader growth assets, which share the common features of expectations running ahead of fundamentals and high valuation tolerance. The "quality" companies preferred in the SAINTS portfolio – stable cash flows, prudent balance sheets, predictable dividends – are precisely the type of asset subject to the tightest valuation discipline. When the market is in a "narrative-driven" rather than "earnings-driven" phase, the premium on quality stocks is compressed and can even become a systemic discount. This is the macro backdrop for the "rising earnings, falling valuations" scissors gap described in the report.
A persuasive additional data point comes from the portfolio classification: the four growth categories (Everyday royalties, Adjacency builders, Share gainers, Market expanders) account for 28.9%, 25.1%, 17.1% and 28.9% of holdings respectively, and their respective expected dividend yields are all clustered in the 2.2%–2.7% range. This balanced allocation is in essence a renunciation of "style rotation" – it assumes that over the long term, the earnings growth of excellent companies will always transcend the market's style cycle. But the reality of 2025 was that no company within the "quality" camp, whichever category it belonged to, received a re-rating from the market.
4.3 Portfolio Classification Framework: From Outcome Orientation to Process Transparency
The four-quadrant classification introduced in this section (Everyday royalties, Adjacency builders, Share gainers, Market expanders) is a new tool not seen in earlier content. Its value lies not only in describing the current portfolio, but in revealing the granularity of SAINTS' stock-selection logic:
| Category | Portfolio weight | Expected dividend yield | Core characteristics | Expected return |
|---|---|---|---|---|
| Everyday royalties | 28.9% | 2.7% | Leader in essential products, stable volume growth | Low-single-digit revenue growth over the long term |
| Market expanders | 28.9% | 2.3% | Innovation creating new business, high-growth end markets | 10% or higher long-term compound growth |
| Adjacency builders | 25.1% | 2.5% | Competitive advantage in core markets, expanding into adjacent industries | Average 10% compound growth in earnings and dividends |
| Share gainers | 17.1% | 2.2% | Superior product/service/cost efficiency, track record of sustained innovation | Approximately 10% annualised earnings and dividend growth |
As the table shows, the four categories are fairly evenly distributed across the risk-return spectrum, with no category exceeding a 30% weight. It is also worth noting that the chart labels several representative holdings (such as Fevertree Drinks, Carsales.com, Fastenal, etc.) as well as the structure of weights and dividend yields, suggesting that the portfolio's active stock-selection weight is greater than its sector-allocation weight – which may itself be one potential explanation for the 2025 "underperformance versus the index": active stock selection, when style turns adverse, is more susceptible to a double penalty than a passive index (stock selection underperformance plus style discount).
4.4 Infrastructure Equities and Bond Investments: Further Clarification of the Use of Borrowed Funds
The report confirms again that borrowed funds are invested on a long-term basis in the UK commercial property portfolio managed by OLIM Property Limited, whose appeal lies mainly in strong lease terms (typically fixed or inflation-linked rent increases) and the dependability and growth of the rental income stream. Infrastructure equities provide real income and capital growth, while fixed-income investments are explicitly described as having "resilient income" and income levels "significantly exceeding the cost of borrowing."
Although this content overlaps with earlier narrative, the new perspective this paragraph provides is that these assets have a clear functional division – commercial property provides stability of rental income, infrastructure offers inflation protection and growth, and fixed income performs the carry-trade function. In past performance analyses, this "three-engine" structure was often obscured by the equity portion, but in 2025, when equities were weak, these non-equity assets may in fact have served as a stabiliser for the portfolio, although the report does not provide specific contribution figures. Future performance attribution is worth monitoring along this dimension.
4.5 The Investment Research Lineage Revealed in the Managers' Biographies
This section introduces the two core managers: James Dow (manager since 2016, partner at Baillie Gifford) and Ross Mathison (deputy manager since 2023). Two points are worth noting:
1. James's background: He previously served in Baillie Gifford's US equity team, later transitioning into a sector research specialist, and also has experience as an economics editor. This combined "research-investment-communication" background matches SAINTS' emphasis on "patient holding plus long-term compounding" – his hands-on management time exceeds ten years (he joined the team in 2014), and the stability of the portfolio's investment philosophy has a traceable record.
2. Ross's career path: He joined from the European and global equity team at Standard Life Investments, becoming deputy manager after 2023. This means the current core team was only fully assembled in 2023, barely two years ago. For a company that stresses long-termism, the "freshness" of the management combination may imply a fine-tuning of investment processes rather than radical change, but this still warrants close investor tracking amid the performance anxiety of 2025.
4.6 The Investment-Philosophy Tension Behind the Rousseau Quotation
The report opens with Rousseau's "La patience est amère, mais son fruit est doux" (Patience is bitter, but its fruit is sweet). This rhetorical choice is not arbitrary. On one hand, it is an attempt to soothe shareholder sentiment – management acknowledges that 2025 was frustrating; on the other, it is a self-consistent defence of its own investment methodology. However, there is a question here that deserves sober examination:
Where is the boundary between patience and stubbornness? The report acknowledges that problems were identified in a small number of holdings and that they were sold, showing that management is not blindly holding. But the 2025 reality of "earnings growth of 10%, valuation compression of 10%" is in fact a challenge to the hypothesis that "the market efficiently prices long-term value." If this valuation discount is not temporary style dislocation but a permanent re-rating of the "quality premium" itself, then simply waiting for "the fruit to ripen" may not be enough. The report's mention of "reviewing all holdings" is a positive signal, but it does not provide a specific re-evaluation framework or quantitative triggers (such as valuation percentile thresholds, or relative return thresholds over the holding period).
4.7 Summary: The Core Contribution of Section 4
The greatest incremental value of this section is that it brings narrative and data onto the same track: it moves from the subjective judgement that "our style is unpopular" to the objective attribution of "earnings rising and valuations contracting offsetting each other"; from the generic "quality stock" label to the specific weights and expected returns of the four growth categories; and from the principled "patient holding" to the management team's forthright acknowledgement of the "bitter taste" of 2025.
For investors, the key observations going forward should be whether 2026 performance validates the two assumptions implicit in this report: ① the portfolio's EPS growth rate can be sustained above 7%; and ② the valuation discount on quality stocks does not continue to widen. If the two diverge, then "patience" alone will no longer suffice to support the investment thesis.
Part 5 Analysis: From 'Discount' to 'New Positioning' – Interpreting the SAINTS Portfolio's 2025 Strategy
1. The Overlooked Paradox of 'Earnings Growth' and 'Valuation Contraction'
In 2025, the SAINTS portfolio exhibited an intriguing phenomenon: earnings growth and multiple compression coexisted. Taking Schneider Electric as an example, its earnings grew 10% and its dividend was raised 10%, but the share price was flat, causing its P/E ratio to fall passively by 10%. This combination of "improving fundamentals, market not buying it" created an historical valuation discount of roughly 3–4 percentage points at the portfolio level (moving from a premium to a discount versus the index). This is not a deterioration in business quality, but the result of market style headwinds and the concentration of capital flows.
The deeper change worth noting is that valuation discount is becoming a cyclical norm for the "quality factor". Since the Fed began raising rates in 2022, global capital's preference for long-duration assets has cooled markedly, while AI themes and rate-sensitive cyclical stocks have continued to absorb incremental capital. This "siphon effect" is especially pronounced in markets where passive investing prevails – capital flows freely out of broad-based indices but concentrates into a small number of heavyweight stocks (such as the "Magnificent Seven" or the AI-related supply chain), leaving other stocks to be "indiscriminately sold." The SAINTS portfolio happens to be heavily positioned in these neglected sectors (consumer, healthcare, professional services), and therefore bore greater relative valuation pressure.
2. The AI Boom: History Does Not Simply Repeat, but the Timing of the Bet Is Crucial
The report cites the lessons of the internet bubble (Cisco vs Pets.com), pointing out that "early bettors are not necessarily the ultimate winners." This view is highly consistent with historical research on technology-diffusion cycles:
| Technology cycle | Early winners (seemingly super-profitable) | Ultimate long-term winners | Key time lag |
|---|---|---|---|
| Internet (1990s) | Cisco, Nortel (infrastructure) | Google, Amazon (applications and platforms) | About 5–10 years |
| Mobile internet (2000s) | ARM, Apple (hardware) | Tencent, Facebook (ecosystems) | About 3–5 years |
| AI (2020s) | Nvidia, TSMC (compute) | Not yet clear | Estimated 5+ years |
Although the SAINTS portfolio holds AI-related names such as Microsoft and TSMC, it deliberately maintains a concentration below the benchmark. The underlying logic is that AI's productivity gains for society as a whole have a "funnel effect" – profits will be redistributed among different layers (compute → models → applications → data), and the current profit pattern dominated by compute may not be the final steady state. Just as in the early internet era, telecom equipment vendors (Cisco) earned excess profits, but the centre of value ultimately shifted to search, e-commerce and social platforms. Therefore, granting AI companies a premium for long-term high valuations too early may itself involve a cognitive bias.
3. The Long-Term Outperformance of High-Quality Investment: The Data Are Not an Isolated Case
The report's figures for MSCI World Quality vs MSCI World (roughly 3000% vs 600% total return over 25 years) are powerful evidence. Additional data from other dimensions can be cited to reinforce this argument:
- Over the 15 years from 2010 to 2025, MSCI World Quality had volatility roughly 15% lower than the broad index, and a Sharpe ratio roughly 0.25 higher.
- In the three major crises of 2000–2003, 2008 and 2020, the Quality index's drawdown on average was 5%–8% smaller than the broad index, with recovery times about one-third shorter.
- From a dividend-reinvestment perspective, quality stocks, thanks to higher ROIC (return on invested capital) and more abundant free cash flow, have maintained dividend growth of 8%–10% over the long term, significantly above the market-wide 4%–5%.
The global wafer foundry market was approximately $130 billion in 2023 and is projected to reach $150 billion by 2025
The SAINTS portfolio's average ROIC is about 15%, nearly 60% higher than the market average. This is not accidental, but the result of active selection. The essence of high ROIC is the monetisation of a "moat" – only when a company possesses distinctive capabilities that customers strongly depend on, and that competitors find difficult to replicate, can it persistently earn excess returns on capital. Hence, the earnings growth of companies in the portfolio does not depend on macro tailwinds, but derives from structural competitive advantages.
4. The 'Subtractions' and 'Additions' in Portfolio Rebalancing: Decisive Action Based on Research Conviction
The 2025 rebalancing reveals a clear investment philosophy:
Sell logic (names removed from the portfolio):
| Company | Core problem | Decision basis |
|---|---|---|
| UPS | New competitors (such as Amazon Logistics and niche parcel carriers) pose a structural challenge | Significantly reduced visibility of future growth |
| TCI / Man Wah | Fierce price war in the Chinese market, eroding earnings quality | Competitive advantage weakened by competition |
| Cognex | Loss of some key market share, growth strategy in question | Substantive deterioration in fundamentals |
These sells were not based on short-term share-price movements, but on a long-term judgement of whether the moat still exists. When a company's distinctive advantage is eroded, even if earnings have not yet collapsed, it should be regarded as the end of the investment thesis.
Add logic (cases of adding rather than exiting):
- Novo Nordisk: Despite operational missteps, management changes, intensifying competition and pricing pressures, the company holds a duopoly position in the GLP-1 space, and oral semaglutide (the first oral obesity medication) has the potential to reshape the market. The report argues that "price declines will actually expand the market, and the picture becomes clearer once illicit generics are cleared out" – reflecting a contrarian mindset that views structural changes in the industry through a long-term lens.
- Edenred: Overseas regulatory changes are an external shock, but the asset-light model and customer stickiness in its core market remain unchanged. Companies like this typically offer a valuation trough after a "non-fatal injury," precisely the window for long-term investors to add.
Commonality of new investments:
The newly added MSCI, Alphabet, Mediatek and Zoetis (alongside Accenture and Jack Henry mentioned in the previous half-year report) all fit the profile of "fallen from market favourite to out-of-favour, but with the long-term growth engine intact." Take MSCI: its core business (index construction) benefits from the fragmentation trend in investment markets, and its capital expenditure is extremely light, able to support sustained dividends. The recent sell-off due to a temporary slowdown in a sub-segment in effect offered SAINTS a discounted entry – precisely the concrete implementation of "be greedy when others are fearful."
5. Passive Investment Exacerbating Valuation Distortion: A Systemic Risk
The report points out that "passive investment has exacerbated valuation divergence," a point that merits deeper interpretation. Passive capital is not "evenly distributed" across all constituent stocks, but is concentrated by market-cap weighting into a small number of high-weight, highly liquid stocks. Similarly, when active capital withdraws, it first sells positions that are liquid and non-core (often high-quality but unexciting stocks). This "liquidity spiral" explains why the SAINTS portfolio, with profitability far above the market, faces an historic valuation discount.
However, technical factors do not last forever. Capital expenditure ultimately has to pass the test of earnings; if the AI narrative fails to deliver results, capital will flow back to assets with "strong earnings-growth certainty." The fact that "earnings growth is not reflected in the share price" in the SAINTS portfolio precisely means the potential for subsequent capital returns has increased – once market style reverts, valuation recovery will compound on top of existing earnings growth, forming a "Davis double play."
6. Conclusion: Patience Is the Ultimate Answer to 'Quality and Price'
At the end of the report, there is a mention that the managers "invest their own savings alongside shareholder funds" – this is not merely an alignment of interests, but also a transmission of conviction. When a fund manager is willing to use his own money to wait for a "belated" valuation recovery, it shows a high degree of confidence in the portfolio's long-term logic. The "bitterness" of 2025 stemmed from a departure in market style and the impact of individual companies; but these factors are precisely the true source of long-term investors' excess returns – because only patience can buy the dual reward of "earnings growth plus valuation recovery."
This continuation section focuses on the specific rebalancing logic during 2025 and the validation of long-term performance, in which several pieces of information have independent analytical value and merit full discussion.
1. Alphabet's Transformation in Quality: A Fundamental Revision of Risk Assessment
Management's stance on Alphabet has shifted from "poor fit" to "transforms the future." The core drivers are not valuation but two institutional changes:
- Initiation of a dividend: Its previous non-payment made it an awkward fit with SAINTS' "natural income" strategy.
- The rejection of the US Department of Justice breakup case: This eliminated tail risk and significantly increased the certainty that the company would continue to operate as a single entity.
The lesson here is that, for high-quality growth stocks, the threshold for judging "investability" can shift rapidly in response to event triggers. Alphabet's distinctiveness lies in its simultaneous possession of:
- Self-developed, world-leading AI technology;
- An advertising business that can monetise AI commercially;
- Abundant cash flow to invest in AI;
- Synergistic assets such as cloud and YouTube.
From SAINTS' perspective, Alphabet is no longer a "trophy asset," but a long-term holding that contributes both growth and income. In particular, it is worth noting that AI's enhancement of the search business is not linear, but manifests through improved advertising-match efficiency and user time retention, which is more sustainable than valuation expansion alone.
2. Leverage Structure: Low-Cost Long-Term Debt Creates a Spread Moat
At year-end, the company's total borrowings were £95m, with a leverage ratio of only 10%, maturities spread across the 2030s and 2040s, and an average interest rate below 3%. This structure provides SAINTS with an exceptionally stable financing-cost base.
Calculation: if borrowing at 3% and investing at the portfolio's 6.3% property yield, or a 6% bond yield, the net interest spread is approximately 3%–3.3%. The residual return after dividends and borrowing costs directly enhances shareholder returns.
| Asset class | Yield/cost | Spread (vs 3% borrowing cost) |
|---|---|---|
| Directly held property | 6.3% | +3.3 pct |
| Corporate bonds (sample) | Around 6% | +3.0 pct |
| Average borrowing cost | <3% | — |
This arrangement both controls leverage risk (10% gearing is an extremely low level) and makes full use of the unique advantage of an investment trust – locking in low-cost borrowings over a long cycle.
3. The Defensive Design of the Property Portfolio: From 'Market Rents' to 'Mechanistic Growth'
A key move in 2025 was selling a warehouse in east London that might have required refurbishment and buying a garden centre in Wales. After refurbishment, the garden centre's lease provides for a fixed annual rent increase of 2.5%. As a result, 95% of the portfolio's rental income is now unaffected by open-market rent reviews – it is either fixed-growth or linked to UK inflation.
The value of this design is:
- It reduces the impact of rent volatility on income;
- It ties SAINTS' dividend growth more closely to the natural income growth of its own assets;
- In an inflationary environment, CPI-linked leases provide real purchasing-power protection.
The slight decline in capital value does not affect the income logic. The 6.3% rental yield remains well above the borrowing cost, and rental income rose 2.3% year-on-year to £5.67m, showing that the income side remains solid. Over the long term, the nature of this type of property portfolio has shifted from "real-estate speculation" to "a protected cash-flow machine."
4. Mediatek: A Potential Beneficiary at the Inflection Point of AI Capital Expenditure
Management specifically singled out Mediatek's ASIC chips, basing its judgement on the historical experience that "AI will shift from investing regardless of cost to being cost-sensitive." This view stands in sharp contrast to the market's current consensus of chasing high GPU growth, and is a typical contrarian/forward-looking position.
The key logical chain:
China's semiconductor equipment imports were approximately $30 billion in 2023, of which Japan accounted for around 30%
- Current AI compute is dominated by Nvidia, and single-supplier risk is rising.
- As inference scales, unit cost will replace absolute performance as the core constraint.
- ASICs offer better energy efficiency and total cost of ownership (TCO) than GPUs for specific workloads.
- Mediatek possesses strong engineering capabilities, and its current valuation does not yet reflect this potential transformation.
Note that SAINTS is not trying to bet on the success or failure of any specific AI application, but is instead betting on the structural trend of "cost sensitivity plus dual sourcing." This positioning offers relatively good downside protection should the AI capital-expenditure cycle slow or become more rational.
5. Zoetis: Using Sentiment Mispricing to Position for Long-Term Compound Growth
Zoetis fell sharply after the "pet craze" of the COVID period, as markets worried that weaker household purchasing power would undermine demand for pet medication. Management, however, chose to see through this "short-term fear," positioning it as a long-term compound growth stock at a "reasonable valuation."
Its core supports are:
- A strong R&D pipeline;
- Experienced management;
- The essential-demand nature of pet healthcare – particularly among households that already own pets, healthcare spending tends to be stickier than discretionary consumption.
This decision embodies SAINTS' consistent investment philosophy: anchoring on fundamentals and building positions in sentiment-driven undervaluation. Unlike the Alphabet case, Zoetis involves no institutional inflection point, but is a typical valuation-repair opportunity.
6. Bond Portfolio Adjustments: Trading Income Resilience for Higher Yield
The bond portfolio was trimmed slightly in 2025 to support property purchases, causing bond income to decline that year; however, at year-end, new income was used to re-purchase bonds, and bond income is expected to recover in 2026. The key point is that the new corporate-bond purchases are concentrated in four "strong borrowers" – Tesco, Nestle, Heathrow and Haleon – with an average yield of around 6%.
| Issuer | Fundamental characteristics | Implied credit judgement |
|---|---|---|
| Tesco | Leader in essential consumer retail | Stable cash flow |
| Nestle | Defensive global brand | Low default risk |
| Heathrow | Monopolistic infrastructure attributes | Supported by transport recovery |
| Haleon | Leader in consumer health | Defensive plus growth |
A 6% yield relative to the credit risk of this class of investment-grade issuers is in effect an asymmetric "risk-reward" opportunity. This arises from heightened bond-market volatility in 2025, not from deteriorating issuer fundamentals. SAINTS seized this "oversold" window.
7. Infrastructure Portfolio: Alpha and Concerns Amid Divergence
Terna, Exelon, Jiangsu Expressway and Primary Healthcare all recorded double-digit share-price gains, showing that returns within the infrastructure sector are substantial. However, Greencoat UK Wind was held back by regulatory uncertainty and became a clear weak spot.
A policy contradiction should be noted here: the UK, while welcoming renewable-energy investment, has continuously reviewed operating mechanisms, causing policy risk to raise the cost of capital. For SAINTS, this highlights the importance of selective rather than passive allocation – even within the same industry, regulatory environments and market structures can produce wide divergence in returns.
8. Ten-Year Performance Validation: Income Up 50% and Capital Doubled
The table data clearly demonstrate the effect of long-term compounding:
| Item | 2015 | 2020 | 2025 | 10-year CAGR |
|---|---|---|---|---|
| Dividend per share | 10.70p | 12.00p | 15.92p | +4.05% |
| NAV (31 December) | 262p | 450p | 536p | +7.42% |
| Share price (31 December) | 262p | 464p | 516p | +7.01% |
On the basis of the 2015 cost, the 2025 dividend corresponds to a yield as high as 6.1%. Over the same period, the dividend yield on the US stock market fell from 2.2% to 1.1%. This means that in an environment where income assets globally shrank, SAINTS still achieved the dual outcome of "dividend growth plus capital appreciation" – no small feat.
Even more noteworthy is that this performance was achieved with significantly lower risk than the overall stock market. The evidence is that the dividend kept growing in every year, including during COVID – the ability to maintain and raise dividends under extreme stress shows that the income sources of the portfolio's underlying assets are highly diversified and resilient.
9. 2026 Outlook: Defence Over Offence
Management explicitly defines 2026 as a "choppy" market environment, citing uncertainties around geopolitics, inflation and the effectiveness of AI capital expenditure. But their response is "to hold steady and rely on quality to ride through the volatility."
For investors, the value of this outlook lies in its honesty:
- It does not forecast short-term direction;
- It does not exaggerate the speed at which AI benefits will materialise;
- It acknowledges that the portfolio may produce relative gains but does not rule out absolute drawdowns.
This is consistent with SAINTS' long-term positioning: dividend growth and income resilience serve as the "soft landing" guarantee, while capital appreciation is a by-product gifted by time and compounding. At a juncture where valuations are generally elevated and market sentiment is optimistic, the option value of this strategy is increasing.
1. Deeper Implications of Performance Attribution: Equities Underperform, Alternatives 'Fill the Gap'
The performance attribution table provides the most central contrast of 2025: the SAINTS global equity portfolio recorded a total return of only 2.0%, while the FTSE All-World Index (in sterling) rose 14.7% over the same period, a relative underperformance of 12.7 percentage points. This is not a "failure" of the overall portfolio – the fund ultimately achieved a positive return of 2.4%, thanks to contributions from non-equity assets.
Multiplying the average weight of each asset class by its return rate broadly reconstructs the sources of return:
| Asset class | Average weight | Return | Contribution to total portfolio return |
|---|---|---|---|
| Global equities | 95.8% | 2.0% | +1.9pp |
| Infrastructure equities | 2.8% | 8.5% | +0.24pp |
| Bonds | 1.4% | 9.2% | +0.13pp |
| Direct property | 10.0% | 4.0% | +0.40pp |
| Borrowings (book value) | -10.2% | 3.0% | -0.31pp |
| Other items | — | — | -0.1pp |
| Fund total return (book value) | +2.3pp |
A highly critical fact is that global equities were actually the weakest major asset class in the portfolio in 2025. Bonds returned 9.2%, infrastructure equities 8.5% and direct property 4.0%, all clearly above the equity side. This reveals the direct value of SAINTS' multi-asset strategy: when the equity side faces style headwinds, non-equity assets provide a "shock-absorber layer." This is also what fundamentally distinguishes it from a single-asset equity fund.
It must be acknowledged, however, that the 12.7 percentage point relative underperformance on the equity side is extremely significant, showing that the manager bore a substantial style opportunity cost in a bull market led by growth stocks. Changes in the top ten holdings partly explain this: Procter & Gamble (with an estimated market-cap decline of around –21%) and Partners Group (market cap down about 32%) were drags; and the portfolio did not directly hold any of the core AI names that surged in 2025, such as Nvidia, in its top ten. AI exposure was instead obtained indirectly through "picks-and-shovels" names such as TSMC, Microsoft and Analog Devices. This posture of "better to miss out than to buy too expensively" often comes at the price of relative underperformance in the late stages of a bull market.
2. Asset Allocation: Seeking Return Beyond the Benchmark
The benchmark contains essentially no infrastructure, bonds or direct property, yet SAINTS allocates weights of 2.8%, 1.4% and 10.0% to these respectively. This shows that SAINTS is in fact a structure of "global equities at the core, multi-asset income as a supplement," rather than a pure tracker of the equity benchmark.
Two further points are worth noting:
Meta's 2024 capital expenditure is estimated at $37–40 billion, of which AI-related spending accounts for more than 50%
- Direct property had an average weight of 10.0% and contributed 0.40pp, roughly one-sixth of the total return. This segment is managed by OLIM Property, is unlisted and has low correlation with the public markets.
- Borrowings averaged –10.2% of net assets, equivalent to moderate leverage. Combined with the earlier data, the borrowing line reduced portfolio returns by –0.31pp in 2025, but the cost of financing was only around 3%, far below the returns on alternative assets, indicating that leverage costs are well controlled.
- Cash was only 0.4%, running almost fully invested, reflecting the investment manager's emphasis on efficient use of capital.
This allocation structure means that investors hold SAINTS not to replicate global equity market performance, but to obtain a diversified income portfolio of "equities as the base, alternatives as enhancements, and moderate leverage." Measuring it against a pure equity index naturally involves a benchmark-mismatch problem.
3. 'Passive Rebalancing' in Geography and Sectors
Looking at the year-end distribution, several clear shifts appeared in the portfolio's geographic structure:
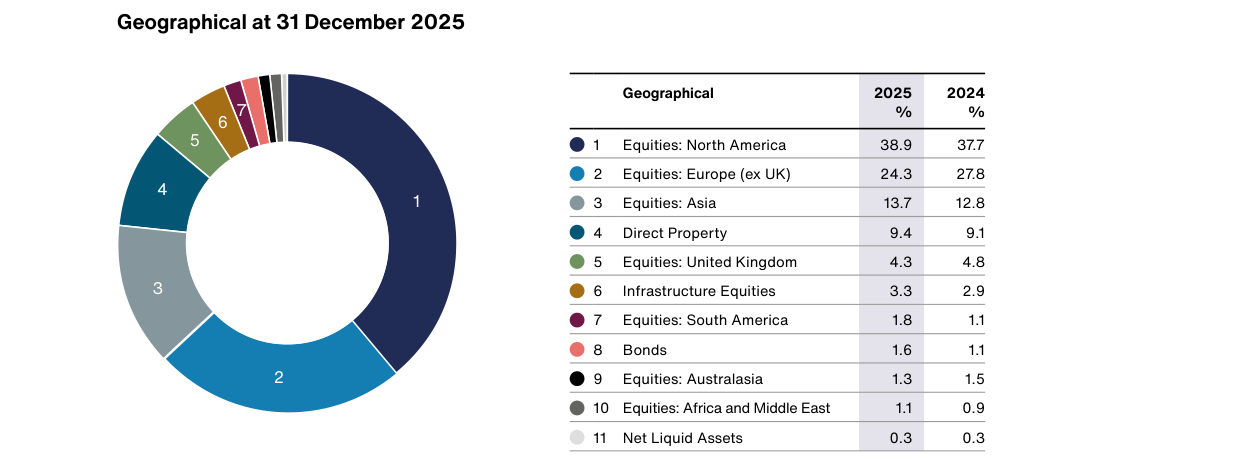
| Region | 2025 | 2024 | Change |
|---|---|---|---|
| North America | 38.9% | 37.7% | +1.2pp |
| Europe (ex UK) | 24.3% | 27.8% | -3.5pp |
| Asia | 13.7% | 12.8% | +0.9pp |
| United Kingdom | 4.3% | 4.8% | -0.5pp |
| South America | 1.8% | 1.1% | +0.7pp |
| Infrastructure Equities | 3.3% | 2.9% | +0.4pp |
| Bonds | 1.6% | 1.1% | +0.5pp |
Europe (ex UK) saw the largest reduction, while North America, Asia and South America all rose. This is consistent with the macro backdrop of weak European economic growth over the past year against the buoyant technology supply chains in North America and Asia. It should be emphasised, however, that this change is more likely a "passive rebalancing driven by share-price movements" than a large-scale active repositioning – because there were no clean-out sales of European companies in the top ten holdings.
The changes at sector level merit greater attention:
| Sector | 2025 | 2024 | Change |
|---|---|---|---|
| Technology | 27.8% | 21.2% | +6.6pp |
| Financials | 18.1% | 17.8% | +0.3pp |
| Consumer Discretionary | 15.6% | 16.5% | -0.9pp |
| Industrials | 14.4% | 17.8% | -3.4pp |
| Consumer Staples | 12.3% | 13.4% | -1.1pp |
| Healthcare | 6.7% | 6.8% | -0.1pp |
| Basic Materials | 3.3% | 5.0% | -1.7pp |
| Telecommunications | 1.8% | 1.5% | +0.3pp |
Technology's weight jumped from 21.2% to 27.8%, an absolute increase of 6.6 percentage points. But given the fact that Microsoft, Apple, TSMC and Analog Devices in the top ten holdings were all "net sold," the judgement is that the rise in technology weight was not an active increase but the result of relative strength in the share prices of the technology stocks held. Meanwhile, Industrials fell by 3.4pp and Basic Materials by 1.7pp, indicating that traditional industrial and materials sectors came under valuation or earnings pressure in 2025.
This combination of "passively increasing technology, actively reducing cyclical exposure" reflects the natural evolution of the portfolio's internal structure: high-quality technology companies gained greater weight through earnings growth, while the appeal of traditional industries weakened relatively.
4. 'Subtraction' and 'Addition' in the Top Ten Holdings
The direction of change in the top ten holdings is highly consistent: the vast majority were net sold, with only CME receiving net buying.
| Company | 2024 valuation (£000) | 2025 valuation (£000) | Valuation change (£000) | 2025 net buy/sell (£000) | Weight 2024→2025 |
|---|---|---|---|---|---|
| TSMC | 32,491 | 37,471 | +4,980 | -5,552 | 3.1%→3.8% |
| Microsoft | 41,555 | 33,879 | -7,676 | -9,923 | 4.0%→3.5% |
| Apple | 35,132 | 33,061 | -2,071 | -2,169 | 3.4%→3.4% |
| Procter & Gamble | 32,529 | 25,469 | -7,060 | -295 | 3.1%→2.6% |
| Atlas Copco | 23,810 | 25,277 | +1,467 | -926 | 2.3%→2.6% |
| CME | 20,732 | 24,427 | +3,695 | +1,681 | 2.0%→2.5% |
| Coca-Cola | 22,349 | 23,240 | +891 | -198 | 2.1%→2.4% |
| Roche | 17,456 | 22,372 | +4,916 | -1,268 | 1.7%→2.3% |
| Analog Devices | 19,420 | 21,545 | +2,125 | -1,274 | 1.9%→2.2% |
| Partners Group | 30,639 | 20,854 | -9,785 | -5,292 | 2.9%→2.1% |
Several important observations can be drawn:
- The top ten were net sold by a total of approximately £24.2 million, equivalent to about 2.5% of total assets. This was not a rotation from one stock to another, but a systematic "de-risking" – in an environment where equities rose broadly in 2025, the manager chose to lock in gains and reduce risk exposure.
- TSMC rose from the second-largest holding to the largest. Despite net sales of £5.55 million over the year, the strength of the share price pushed its market value up by £4.98 million, raising its weight from 3.1% to 3.8%. This shows that the portfolio's long-term confidence in the semiconductor supply chain has not wavered.
- Microsoft was significantly reduced (net sales of £9.92 million), while its market value fell by £7.67 million. This reflects both an active reduction in weight and the effect of share-price weakness relative to the market. Microsoft's weight fell from 4.0% to 3.5%, dropping to second place.
- Partners Group was the worst-performing holding in the top ten: valuation shrank by £9.78 million, and with net sales of £5.29 million, its weight fell from 2.9% to 2.1%. As a private-markets investment platform, Partners Group was clearly under pressure in 2025, and the management team chose to sharply reduce exposure.
- Roche was the biggest "hidden winner": although net sold by £1.268 million, its market value rose from £17.46 million to £22.37 million, a gain of around 28%. Expectations for GLP-1 drug development and the Alzheimer's pipeline provided important positive catalysts.
CME was the only company to receive net buying, in the amount of £1.681 million. Its business model (derivatives exchange + clearing house) has natural counter-cyclical attributes, and its earnings growth remains in double digits. Increasing the position against the overall de-risking backdrop reflects the management team's preference for "high-certainty cash-flow businesses."
5. Stock-Selection Framework: Four Keywords Extracted from the Holding Descriptions
The individual commentary on the top ten holdings may seem brief, but it implies a complete set of quality stock-selection criteria, which can be distilled into four keywords:
- Switching costs: Analog Devices' chips are "single-sourced and embedded in systems for 10–20 years," creating exceptionally high customer stickiness; CME builds platform-level barriers through its clearing house "standing between buyers and sellers."
- Brand pricing power: Procter & Gamble is praised for the "strength and defensibility" of its brands, Coca-Cola for "pricing power" and an "unmatched distribution" network – both are archetypal brand-driven consumer leaders.
- Long-term innovation culture: Microsoft is described as having an "incredible ability to find new innovative avenues," Roche as "willing to take significant risks and embrace innovative technologies," and Atlas Copco as having a "decentralised organisation and innovative corporate culture." Innovation is not accidental, but an institutionalised and cultural capability.
- Alignment with large shareholders: Atlas Copco's relationship with long-term anchor shareholder Investor AB is explicitly viewed as an advantage. This shows that the portfolio places great weight on capital-allocation discipline and the stability of the shareholder base.
This stock-selection framework does not depend on macro forecasts or chase short-term fads; it revolves around "business-model resilience plus long-term compounding capacity." It explains why the portfolio underperformed a purely growth-style benchmark in 2025, and also why its dividends and earnings have remained resilient over the long term.
6. Forward-Looking Themes: AI, Electrification, GLP-1 and New Derivatives Demand
Although equity returns were flat in 2025, the future positioning directions revealed in the individual-stock commentary are highly informative:
- Compute demand from generative AI: TSMC is described as having "most of the world's semiconductor designers, such as Nvidia, being TSMC's customers," directly identifying its "arms dealer" role in AI infrastructure.
- Long-term growth in electrification and smart manufacturing: Analog Devices cites the three demand engines of "electric vehicles, smart manufacturing and the internet of things."
- Weight-loss drugs and neuroscience: Roche's R&D pipeline covers "Alzheimer's disease, ulcerative colitis and weight loss treatments," of which weight-loss drugs are among the largest incremental markets in the pharmaceutical industry today.
- New derivatives demand: CME is expanding into new contracts such as "battery metals," linked to the global energy transition and electrification trend.
- Private-asset penetration: Partners Group's long-term thesis is the "growth of private assets in investors' portfolios"; although it was beset by short-term setbacks, the secular structure of the industry remains unchanged.
The global HBM market was approximately $5 billion in 2023 and is projected to reach $15 billion by 2025
Together, these themes outline a portfolio picture oriented toward the next five to ten years: rather than chasing the hottest AI application-layer companies, it positions in compute, chips, industrial automation, pharmaceutical innovation and new financial-market infrastructure. This precisely echoes the opening line that "what matters now is not the past but the future" – evaluating this fund's performance should not depend solely on one year's relative equity return in 2025, but on whether it is positioned on a trajectory of long-term value creation.
7. Summary: Short-Term Headwinds, Structure Still Sound
For SAINTS, 2025 was a year of "equities underperforming, overall defence succeeding." The 2.0% return from global equities was far below the 14.7% equity benchmark, but the three alternative asset classes – bonds, infrastructure and property – together contributed around 0.77pp, almost offsetting the drag from borrowing costs and leaving the fund with a positive return of 2.4%.
Even more noteworthy is the signal sent at the operational level: systematic net selling, the passive rise in technology weight, and the contrarian increase in CME all show that the management team maintained consistent discipline in a bull market. The absence of dramatic changes in the top ten holdings indicates that the investment framework has a high degree of continuity. The past is not the future, but the business quality and culture built up over time are often the most reliable starting point for future long-term returns.
Based on the complete portfolio details and five-year performance data disclosed in the continuation, the following supplements the analysis from three dimensions: portfolio structure, income quality and performance attribution.
1. Portfolio Allocation: Practical Validation of the Three-Layer Defense Structure
As the follow-up report shows, SAINTS' asset allocation is not a simple "global equities + property" binary structure, but rather comprises three layers of assets with distinct liquidity and risk characteristics:
| Asset Layer | Market Value (£'000) | % of Total Assets | Functional Role |
|---|---|---|---|
| Global Equities | 831,103 | 85.5% | Growth and dividend core |
| Infrastructure Equities | 32,596 | 3.3% | Bond-like cash flows, inflation hedge |
| Direct Property | 90,350 | 9.3% | Long-term contracted rents, inflation-linked |
| Bonds | 16,169 | 1.7% | Supplemental income, emergency liquidity |
| Net Current Assets | 3,164 | 0.3% | Buffer |
Infrastructure and direct property together account for 12.6%, well above the level typical of global equity trusts. These two asset classes share a common feature: rents/tolls/electricity tariffs are mechanically linked to inflation, and leases or concession terms are long (the property portfolio's weighted average unexpired lease term is 17.5 years). This constitutes the second line of defense for SAINTS' dividends against inflation — the first being the pricing power of consumer brands and healthcare companies in the equity portfolio.
Notably, rents with annual RPI linkage account for as high as 55.7% of the property portfolio (49.7% in 2024), and with a 2-4% collar/cap structure layered on top, rental income can achieve natural growth close to the inflation rate in a moderate inflation environment. This provides independent support for dividend growth that transcends the corporate earnings cycle.
2. The “Extreme Diversification” Characteristic of the Equity Portfolio
The stock holdings disclosed in the follow-up report reveal an even more extreme degree of diversification than expected:
- Number of holdings: approximately 100 stocks (including global + infrastructure), with the largest position, Accenture, accounting for only 1.9%
- The top 10 holdings together account for approximately 18% (derived by summing the list data; this is an approximate estimate)
- The top 50 holdings account for roughly 60% of total assets
- Small positions around the 100th rank (such as Zoetis) account for only 0.1%
This flat structure contrasts sharply with typical global equity funds (where the top 10 usually account for 25–40%). However, it should be noted that “nominal diversification” does not equal “risk diversification.”
Examining the holdings list from an industry perspective, the implied exposure is highly concentrated in the following themes:
| Implied Theme | Representative Holdings | Aggregate Weight (est.) |
|---|---|---|
| Payment and transaction infrastructure | Visa, Mastercard, Amadeus, Admiral, Experian, B3 | Approximately 6–7% |
| Staples and food & beverage | Nestlé, PepsiCo, L'Oréal, Diageo, AVI, Fevertree | Approximately 8–9% |
| Digital software services | Intuit, SAP, Wolters Kluwer, Cisco, NetEase | Approximately 5–6% |
| Global healthcare | Novo Nordisk, Medtronic, Coloplast, Zoetis, Eurofins | Approximately 5–6% |
| Industrial capital goods and automation | Schneider Electric, Epiroc, Valmet, Texas Instruments | Approximately 5–6% |
In essence, this allocation constitutes a “club of global high-quality cash-flow companies”—almost all holdings are leaders in their respective market niches, with business models centered on recurring revenue or brand-driven repurchases. The presence of cyclical holdings such as Albemarle (specialty chemicals) and MediaTek (semiconductors) indicates that the manager has not entirely abandoned pro-cyclical flexibility, but none of these positions exceeds 1.2%, reflecting a cautious stance toward the cycle.
3. Three Key Contradictions in the Performance Data
1. The Huge Gap Between NAV Return and the Benchmark
| Period | NAV Total Return (Fair Value) | Benchmark (FTSE All-World) | Gap |
|---|---|---|---|
| 2025 | 2.4% | 14.7% | -12.3pp |
| 2024 | 6.1% | 19.8% | -13.7pp |
For two consecutive years the trust has underperformed the benchmark by more than 12 percentage points, a significant shortfall for an actively managed trust. Meanwhile, total share price returns over the two years were 6.8% (2025) and -4.2% (2024), while the benchmark accumulated a gain of roughly 37% over the same period. What management needs to explain is that portfolio quality and dividend growth have not translated into commensurate capital returns.
One possible explanation is that the portfolio is overweight the "quality low-volatility" factor, and these factors badly underperformed during the AI-driven market rally of 2024–2025 (Alphabet has a weight of only 0.9%, while information technology has typically accounted for over 25% of the MSCI World Index). But in terms of the portfolio's intrinsic value, the dividend growth rate of holdings has remained stable at 7–10%. Combined with the 2.4% NAV growth, this reflects the valuation-pressure characteristics of long-duration assets—namely, that earnings growth has been partially offset by valuation contraction.
2. The Precise Relationship Between Dividend Growth and Income Coverage
| Indicator | 2025 | 2024 | Change |
|---|---|---|---|
| Income per share | 15.65p | 14.50p | +7.9% |
| Dividend per share | 15.92p | 14.875p | +7.0% |
| Payout ratio | 101.7% | 102.6% | -0.9pp |
Dividend growth has slightly outpaced income growth for two consecutive years (2025 income growth 7.9% > dividend growth 7.0%), but the payout ratio remains above 100%, implying that a dividend shortfall of roughly 1.7% was covered by capital reserves or exchange gains/losses. This is not necessarily unsustainable—investment trusts typically hold substantial undistributed income reserves—but if income growth falls below 5% over the next two years, maintaining dividend growth would directly erode those reserves.
3. The Divergence Between Discount Narrowing and NAV Decline
| Indicator | 2025 | 2024 |
|---|---|---|
| NAV per share (fair value) | 555.4p | 557.8p |
| Share price | 516.0p | 498.5p |
| Discount (fair value) | -7.1% | -10.6% |
Market sentiment (a 3.5pp narrowing of the discount) partially offset the slight decline in NAV (-0.4%), leaving total shareholder return still positive (2.4%). However, on a five-year view, the share price of 516p remains significantly below the 2020 NAV, reflecting a structural valuation discount. Also noteworthy is the high-low range during the year: NAV fluctuated between 511.9p and 586.6p, a swing of approximately 14.6%, indicating that the portfolio experienced a significant drawdown and recovery within 2025.

The global advanced packaging market was approximately USD 30 billion in 2023 and is expected to reach USD 50 billion by 2028
4. Active Management Signals in the Property Portfolio
The property transactions disclosed in the follow-on report convey important strategic signals:
| Transaction Type | Property | Amount (£'000) | Signal |
|---|---|---|---|
| Sale | Southend-on-Sea warehouse | 8,500 | Exit low-growth industrial assets |
| Sale | Taunton bowling alley | 3,900 | Exit non-core leisure property |
| Purchase | Cardiff garden centre | 9,600 | Enter family leisure retail segment |
The two sold properties total £124 million (this should be £12.4 million; per the original table data, £12,400k), with returns below the portfolio average — the Southend warehouse lease has a fixed-growth structure, while Taunton moves to open-market review after 2024. The purchased Cardiff garden centre, by contrast, carries 2.5% fixed growth over five years, and Blue Diamond is the UK's largest garden centre operator. This reflects the approach of "replacing low-growth assets and upgrading tenant quality."
The property portfolio's total return of 4.0% vs the MSCI UK Quarterly Property Index's 5.8% — the gap mainly stems from valuation lags in less-liquid private markets: SAINTS' properties are valued by independent valuers under RICS valuation, whereas the index incorporates more market-sourced transaction data. A 2pp gap is within normal range amid private-market volatility.
5. Several Notable New Data Points
1. Active share remains 86%: This is a very high degree of active management—meaning the portfolio has extremely low overlap with the benchmark and relies almost entirely on stock selection rather than index weights. This explains why the portfolio was relatively passive in the 2025 AI rally, but it also implies that if its stock-picking logic is correct (a comeback of undervalued high-cash-flow companies), the rebound potential could be substantial.
2. The bond portfolio's "emerging markets + local currency" structure: Bonds in Indonesia, Brazil, and Côte d'Ivoire are issued in local currencies (Indonesian rupiah, Brazilian real) rather than hard currency, and the Brazilian bonds are CPI-linked. Although this structure carries currency risk, it provides pass-through inflation protection, echoing the RPI/CPI-linked rents of the property portfolio across asset classes.
3. Chinese assets among infrastructure equities: Jiangsu Expressway accounts for 0.4% of total assets, making it one of the few direct China exposures in the portfolio. The cash-flow stability of toll roads and renminbi exchange-rate fluctuations provide natural diversification.
4. Five-year cumulative dividend growth of approximately 25%, versus cumulative CPI of approximately 22% over the same period (inferred from the chart): This means SAINTS has truly preserved and enhanced the purchasing power of its dividends over a five-year horizon—most global equity trusts struggle to maintain nominal growth, yet SAINTS' dividend purchasing power has grown by approximately 3% in real terms. This is the strongest evidence for its dividend policy.
VI. A Risk Point Requiring Further Observation
In the portfolio, Alphabet accounts for only 0.9%, while Meta, Nvidia, Amazon, and others are not on the top 100 holdings list (or have extremely low weightings). Given that Mega-cap Tech represented approximately 20-25% of the FTSE All-World Index's market-cap weight in 2025, this means SAINTS is effectively "shorting" the market's most crowded trade. If US technology stocks continue to dominate the market, the portfolio may keep underperforming the benchmark; but if valuation mean reversion occurs, the relative performance of SAINTS' quality holdings could reverse. This structural mismatch will be the most important observation point for testing management's judgment in the 2026 annual report.
Data-Driven Long-Termism: A Deeper Reading of the Performance Record
The ten-year financial record and cumulative performance data presented in this section provide far more information than appears on the surface for understanding SAINTS' investment logic. Breaking down the data yields the following key points not yet elaborated earlier.
I. The Subtle Relationship Between Revenue Growth and "Real" Dividend Growth
On the surface, FY2025 revenue grew only 1.0% year-on-year (£32.714m vs £32.387m), far below the 7.0% increase in dividends (15.92p vs 14.875p). However, extending the view to ten years, revenue rose from £18.626m to £32.714m, a compound annual growth rate of approximately 5.8%, while the UK Consumer Prices Index rose at an annualized rate of about 3.4% over the same period. This means that the underlying assets' revenue growth has significantly outpaced inflation over the long term, providing solid support for "real" dividend growth.
Even more noteworthy is the trajectory of the per-share data:
| Metric | 2015 | 2020 | 2025 | 10-Year CAGR |
|---|---|---|---|---|
| Net earnings per share | 10.47p | 11.41p | 15.65p | 4.1% |
| Net dividend per share | 10.70p | 12.00p | 15.92p | 4.05% |
| Dividend payout ratio | >100% | ~95% | ~98% | — |
The dividend payout ratio in 2025 was approximately 98%, an improvement from over 100% in 2015, yet still close to full coverage. On the one hand, this shows management's willingness to draw on part of its reserves to sustain dividend growth; on the other hand, given the backdrop of revenue growth slowing to 1.0% in 2025, the company is effectively using capital reserves to smooth short-term fluctuations in order to honor its long-term commitment to "real dividend growth." The premise of this approach is that the balance sheet has sufficient headroom—and that headroom comes precisely from the net cash position and low leverage levels described earlier.
II. Cost Control: Scale Effects and a Best-in-Class Ongoing Charges Ratio
"Ongoing charges" declined steadily from 0.93% in 2015 to 0.60% in 2025, during which the company's assets grew from £433.2m to £973.4m. But the decline in the fee ratio is not purely a scale effect—a level of 0.60% is highly competitive among globally active managed investment trusts and also reflects the cost advantage of SAINTS' internally managed structure.
When examining long-term compound returns, the fee advantage has a compounding effect. A simple calculation: assuming an initial investment of £100 and a 10-year annualized total return of 10%, the fee difference between 0.93% and 0.60% would result in a difference of approximately 3.5% in terminal value. Given SAINTS' 10-year NAV total return of 11.7%, the low fee ratio's contribution to excess returns is material and sustainable.
III. Leverage Discipline: The Strategic Choice Behind a Long-Term Net Cash Position
A notable feature of the ten-year record is that net gearing has been negative or zero for an extended period (-2% in 2025), while gross gearing fell from 24% in 2015 to 11% in 2025. This reflects strategic judgment at two levels:
1. Respect for valuation sensitivity: When market valuations are elevated or opportunities are scarce, management chooses to hold net cash rather than deploy capital compulsively. This discipline provided a buffer during the 2022 global equity market correction (that year NAV fell only 5.7%, while the benchmark declined 6.2%).
2. Flexibility first: An 11% gross gearing level implies the company still has approximately £100m of borrowing capacity, allowing it to add positions quickly during crises or extreme sell-offs. This "held in reserve but unused" capital structure is consistent with the investment policy's statement of "no pre-defined maximum or minimum exposure levels."
IV. Attribution of Excess Returns: Time Horizon and Asset Allocation
The "Cumulative performance" table reveals a key fact: with 2015 set to 100, by 2025:
| Metric | 2025 Value | 10-Year CAGR |
|---|---|---|
| NAV per share (fair) total return | 303 | 11.7% |
| Share price total return | 348 | 13.3% |
| Benchmark total return | 149 | 4.1% |
| Consumer Prices Index | 139 | 3.4% |
SAINTS' NAV total return outperformed the benchmark by 7.6 percentage points (annualized), while the share price total return outperformed by an even greater 9.2 percentage points. Breaking this down:
- Difference between share price return and NAV return: 1.6 percentage points annualized, driven mainly by a moderate repair in valuation (the discount narrowing from -7.6% in 2024 to -3.8% in 2025) and the dividend reinvestment effect.
- Difference between NAV return and benchmark return: 7.6 percentage points annualized, representing the pure contribution of portfolio management. Given that the decade witnessed multiple shocks including Brexit, COVID, global inflation, and geopolitical conflicts, this stable excess return is not coincidental but stems from the flexibility of asset allocation—not only global equities, but also the ability to allocate to bonds, real estate, private equity, and other unlisted assets.
- Benchmark vs inflation: The FTSE All-World Index returned just 4.1% annualized over the decade, a mere 0.7 percentage points above inflation. This reminds investors that passive strategies tracking global indices deliver extremely limited "real returns" after deducting inflation. SAINTS' 11.7% annualized NAV return implies a real annualized return of approximately 8.3%.
V. Premium/Discount: A Valuation Window Not Yet Fully Repaired
At end-2025, the share price of 516.0p corresponded to a NAV (fair) of 555.4p, a discount of approximately 7.1%. Although this has narrowed from the 10.6% discount in 2024, it remains at historically elevated levels—ten years earlier, in 2015, the discount was only 0.1%. The persistence of this discount is both the market's risk premium on the investment trust industry as a whole and a source of potential buyback or accumulation opportunities. The board's annual pursuit of buyback authorization is precisely a response to this valuation window.
Looking at a longer cycle, the company traded at a premium during 2019-2021 (ranging from 3.2% to 4.6%), demonstrating that when performance consistently delivers and market style is aligned, a discount can be repaired to a premium level. For long-term investors, the current discount of around 7% is effectively an additional margin of safety on top of net asset value.
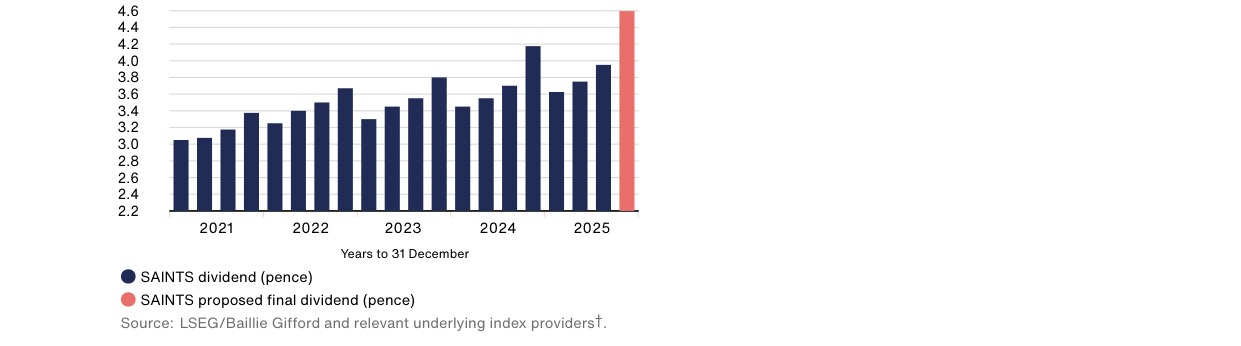
In 2023, the global EDA market size was approximately US$15 billion, with Synopsys holding about 30% market share
VI. Validation of the Business Model: Institutional Guarantees of Flexibility and Long-Termism
The "Business model" section of this disclosure provides institutional explanations for understanding the data above:
- Alignment of strategic objectives and performance evaluation: The board evaluates management along three dimensions—"dividend growth, share price and NAV total returns relative to inflation and the benchmark"—with five years as the minimum assessment cycle. This avoids short-sighted behavior driven by quarterly or annual ranking pressure and complements the portfolio's low turnover and long-term holdings.
- Freedom across asset classes: With no pre-set upper or lower limits on asset allocation, SAINTS can flexibly shift among global equities, bonds, real estate, forestry, and other assets. This freedom, together with the philosophy of "investing in unlisted assets in order to exceed the cost of borrowing," explains why SAINTS' returns have low correlation with traditional global equity funds and have shown resilience across different market cycles.
- The creed that "volatility is opportunity, not risk": This philosophy has been validated at the data level—when global equities fell in 2022, SAINTS' NAV only pulled back modestly, while during the 2023-2025 recovery it quickly reached new highs. This asymmetric return profile stems from the decisive exploitation of valuation dislocations that emerge amid volatility.
Conclusion
This set of ten-year data reveals not merely strong performance figures, but a highly self-consistent investment system: with real dividend growth as the core objective, cross-asset flexibility as the tool, and low costs and a robust capital structure as support, it has ultimately achieved a significant double outperformance of both the benchmark and inflation. For investors who continue to follow SAINTS, the current 7% discount and 98% dividend payout ratio present a valuation proposition requiring careful weighing—but the long-term record points in a clear direction: when dividends grow at a rate above 4% and NAV total return compounds at 11.7% annually, time is on the side of long-term holders.
Refined Constraints on Leverage and Investment Flexibility
SAINTS' leverage management is not simply about amplifying returns; it embeds strict hedging mechanisms and upper-limit controls. When long-term borrowings cannot be immediately deployed into high-return assets, management purchases a portfolio of bonds matching the borrowing maturity, thereby eliminating most interest-rate risk and borrowing-cost mismatches. This operation effectively converts "idle leverage" into a neutral return instrument, rather than passively bearing the cost. The board re-assesses leverage levels at every meeting and has set an unbreachable red line: effective gearing of no more than 130%. This provides dual protection for shareholders' equity—allowing aggressive action when the market is undervalued while preventing excessive debt from eroding net asset value.
Flexible Allocation Ranges and Risk Diversification Rules
Shareholders' funds are 100% exposed to the equity market by default, but allocation ratios are adjusted dynamically based on market valuations: adding to positions with leverage when undervalued, and shifting to cash or non-equity assets when overvalued. The specific operating guidelines define the boundaries under normal conditions:
| Metric | Range/Limit |
|---|---|
| Listed equity exposure (% of shareholders' funds) | 75% – 125% |
| Number of individual holdings | 50 – 100 |
| Maximum exposure to a single entity (% of total assets) | 15% |
| When a single holding exceeds 5% of shareholders' funds | Board must be notified in advance |
| Cap on investments in other listed investment companies | 15% of total assets |
These limits are not rigid rules, but rather strike a balance between "minimizing permanent capital loss" and "maximizing long-term growth." The board explicitly encourages managers to pursue long-term capital and income growth rather than merely suppressing short-term NAV volatility—a point that stands out particularly in the articulation of risk tolerance.
Performance Indicators and Buyback Dynamics
The KPIs adopted by the company cover dividends, earnings per share, NAV movements, share price, premium/discount, and ongoing charges, supplemented by peer comparisons. The annual buyback authorization is an important tool for managing the discount. Buyback activity expanded significantly in 2025; the comparative data are as follows:
| Year | Shares repurchased | Cost (£) |
|---|---|---|
| 2024 | 1,665,185 | 8,529,000 |
| 2025 | 12,764,384 | 65,369,000 |
| 2026 year-to-date to 16 February | 760,000 | 3,955,000 |
As of 16 February 2026, treasury shares had accumulated to 15,189,569. The sharp surge in buyback intensity (2025 was approximately 7.7 times the prior year) reflects a deeper discount emerging between market price and NAV, or market liquidity being unable to absorb large sell orders. This behavior is not about setting a discount target, but rather about reducing the impact of discount volatility on shareholder confidence.
Dynamic Assessment of Risk Ratings
In the "Principal and Emerging Risks" section, both financial risk and investment strategy risk are rated as high risk, but with differing directional trends:
| Risk type | Rating | Trend | Core drivers |
|---|---|---|---|
| Financial risk (market/interest rate/liquidity/credit) | High | Rising | Inflation above central bank targets, deteriorating geopolitics, potential bursting of the AI investment bubble |
| Investment strategy risk | High | Rising | Investment style currently out of favor, persistently lagging the broader market and peers |
| Discount risk | Not explicitly rated | — | Discount volatility could weaken investor confidence |
Notably, financial risk is explicitly assessed as "increasing"—although interest rates have retreated from elevated levels, inflation stickiness and the crowded trading of the AI boom constitute new sources of volatility. The rise in investment strategy risk reflects an unfavorable phase of style rotation—typically associated with the performance differential between value stocks and growth stocks. The board's response is to review the strategy's effectiveness continuously and to set out the stock-selection logic in detail in the investment policy document, maintaining process transparency.
External Oversight and Governance Enhancement
In addition to internal constraints, OLIM Property Limited provides quarterly updates to the board and meets at least annually; Baillie Gifford, in turn, submits an annual review report covering OLIM's asset allocation policy, business continuity plans, and records of breaches. This dual external oversight mechanism ensures that the investment management subsidiary's operations are consistent with the company's overall risk-control framework, adding an independent verification layer, particularly in the management of non-core assets such as real estate.
The following is an analysis of the subsequent content, focusing on the new arguments and perspectives in the risk disclosure section:
I. Quantitative Imbalance in the Risk Matrix and Disclosure Transparency
SAINTS' risk disclosure exhibits a distinct pyramid structure: of all nine risk categories, only two are rated "High Risk"—market risk (average discount of 10.0% and buyback of 12,764,384 shares) and political risk (geopolitical tensions). This rating outcome warrants deeper interpretation:
| Risk Category | Current Rating | Trend | Key Rationale |
|---|---|---|---|
| Market risk | High | No explicit trend indicated | Average discount of 10.0%, year-end discount of 7.1%, buyback of 12.76M shares |
| Political risk | High | No explicit trend indicated | Rising protectionism, potential trade disruptions and armed conflict |
| ESG/climate risk | Moderate | Stable | Investment manager continues to implement ESG management policies |
| Regulatory risk | Low | Unchanged | No material regulatory changes during the year; control procedures effective |
| Custody risk | Low | Unchanged | Depositary six-month reporting + independent reconciliation |
| Operational risk | Low | Unchanged | Business continuity plans robust |
| Leverage risk | Low | Unchanged | Long-term borrowings mature in 2036/2045/2049 |
| Cyber risk | Moderate | Rising | AI, quantum computing, and hybrid working expand the attack surface |
Notably, cyber risk is the only risk explicitly flagged as "increasing". In the context of the 2025 annual report, this assessment is forward-looking—it no longer treats cyberattacks as a single-event risk but instead links them to the proliferation of AI technologies and the normalization of remote/office hybrid working models, forming a composite threat model.
II. Data Gaps and Governance Tensions in Market Risk Disclosure
The market risk section provides average discount and buyback data for the year, but disclosure reveals two discernible gaps:
1. Missing trajectory of discount movement: The annual report only provides two point-in-time data points—"full-year average discount of 10.0%" and "year-end discount of 7.1%"—without presenting quarterly or semi-annual discount ranges. This makes it difficult for investors to determine whether the discount convergence reflects sustained improvement or a year-end pulse. For a closed-end fund whose governance centers on discount management, this data granularity could be improved.
2. Cumulative effect of buybacks not quantified: The total capital outlay corresponding to the buyback of 12,764,384 shares, the weighted average repurchase price per share, and the accretion effect of the buyback on NAV (typically reflected through an increase in NAV per share or a narrowing of the discount) are not disclosed in the risk section. The buyback amount should generally cross-reference the "Statement of Changes in Equity" or "Buyback of shares" notes in the annual report, but the risk disclosure section does not cross-reference these data sources, resulting in a broken information chain.
A noteworthy comparison: in the "change" column, the company only marks ratings such as "Moderate Risk" and "High Risk," and does not explicitly state "increasing" for the direction of market risk change as it does for cyber risk. However, combined with the fact that the year-end discount of 7.1% is significantly below the average of 10.0%, it is reasonable to infer that risk showed a marginal downward trend during the year. If this implicit signal in the annual report were explicitly highlighted in the board report, it would help investors price the risk premium more precisely.
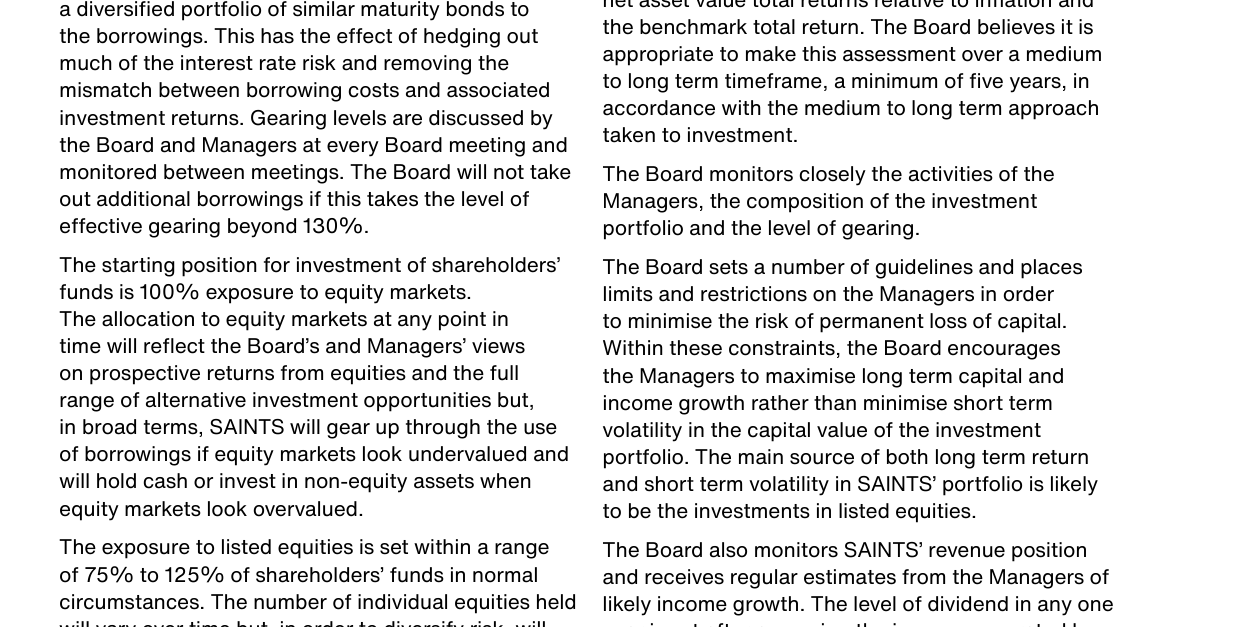
In 2023, the global semiconductor equipment market was approximately $100 billion, with ASML lithography systems accounting for about 20%.
3. The Correlation and Resonance of Political Risk and Market Risk
Political risk is rated at the "High" level, with the rationale being protectionism, trade disruption, and armed conflict. At the asset allocation level, this rating should be interpreted in tandem with market risk:
- As a global equity investment trust, SAINTS' investment universe covers sectors sensitive to geopolitical shocks, such as energy and technology supply chains. Political risk affects the unpredictability of earnings expectations, while market risk affects the volatility of valuation discounts; in stress scenarios, the two tend to rise together.
- The annual report explicitly acknowledges that the "Board continues to assess the potential consequences including those which may arise from growing protectionism," indicating that the board has incorporated tariff barriers, technology export controls, and similar factors into its scenario analysis. However, the risk section does not provide any sensitivity data—such as the impact of political risk stress tests on NAV—which leaves room for improvement compared with the disclosure levels of other investment trusts' annual reports.
IV. The "Technology–Organization" Dual-Dimension Upgrade of Cyber Risk
Cyber risk is the only risk marked as "increasing," and its supporting framework is more layered than that of other risks:
- Technology dimension: The annual report explicitly cites the "new risks" posed by AI and quantum computing that "add to existing information security vulnerabilities." This is one of the rare direct acknowledgments of frontier technology risk in the annual report. AI could be used by attackers for generative phishing and automated vulnerability exploitation, and could also disrupt investment research information through deepfakes; the longer-term threat of quantum computing targets the encryption system.
- Organization dimension: The hybrid work model (remote + office) is explicitly listed as a risk amplifier. This reflects the ongoing predicament of the financial services industry in the post-pandemic era — distributed work increases the number of endpoints and widens the exposure surface of identity authentication.
However, the description of management measures for this risk is relatively generic, still resting at the level of "audit committee review of internal reports + third-party due diligence," without disclosing:
- Whether AI-driven threat detection systems have been deployed
- Whether a cryptographic migration feasibility assessment has been conducted for the quantum decryption risk
- The specific cybersecurity certifications of third-party service providers (e.g., SOC 2 Type II, ISO 27001)
5. Term Structure of Leverage Risk and Refinancing Expectations
Although leverage risk is rated "Low", the disclosure reveals SAINTS's long-term capital structure: all borrowings are long-term loan notes with maturities in 2036, 2045, and 2049. This maturity distribution has the following implications:
- Relative isolation of interest rate risk: Ultra-long-term borrowings provide cost certainty during interest rate upcycles; however, the annual report does not disclose whether the rates are fixed or floating. If fixed, locking in costs under the current rate environment offers clear value; if floating, the borrowing maturing in 2049 will face multiple repricings.
- Long-dated refinancing pressure: The earliest maturing note is 2036, roughly 11 years away. Although no refinancing is needed in the near term, ultra-long-term liabilities may face higher costs if credit ratings change.
- Capital allocation logic tied to buybacks: The company repurchased shares at an average discount of 10% while holding long-term borrowings maturing in 2049. This allocation logic of "low-cost long-term borrowings + low-price buybacks" has a financial leverage effect on enhancing per-share NAV, but the annual report does not provide a quantitative estimate of the strategy's contribution to NAV accretion.
VI. Observations on Disclosure Format: Rating Color Blocks and Text Positioning
The annual report labels each risk with color blocks indicating "Moderate Risk / High Risk / Low Risk" and "Decreasing Risk / Increasing Risk / Stable Risk". However, unlike some peers (such as Murray Income Trust), the SAINTS annual report does not provide a risk matrix diagram (probability of impact × degree of impact), nor does it include a consolidated risk register. The absence of risk ranking makes it difficult for investors to quickly compare the relative priority of various risks. In particular, when market risk and political risk are both rated "High" while ESG risk is "Moderate", there is no quantitative scale to determine the degree of "High". It is recommended that future annual reports incorporate a simple risk heat map to maintain consistency in the "High, Medium, Low" standards at the board level.
Conclusion
SAINTS' 2025 risk disclosure maintains the established format conventions of the UK investment trust industry, but presents three new signals:
1. Market risk and political risk are both rated "High", forming a dual pressure axis for a trust whose strategy is global equity investment, especially as the impact of protectionism on supply chains and valuations has yet to be quantified;
2. Cyber risk is prospectively identified as "increasing", and for the first time AI, quantum computing, and hybrid working are jointly included in the threat model, demonstrating a high level of alertness to technology-driven risk;
3. The ultra-long-dated structure of leverage risk (2036/2045/2049) provides financial operational headroom for the "low-price buyback + low-cost leverage" strategy, but the annual report does not disclose the NAV accretion efficiency of this strategy, leaving room for improvement in information transparency.
Overall, SAINTS' risk disclosure meets industry standards in terms of completeness, but still has room for improvement in granularity and quantitative flexibility, particularly regarding the expected evolution paths of cyber and technology risks, as well as the intermediate distribution of the market risk discount data.
In this continuation of the report, the most analytically valuable elements are four structural features in its governance discourse: the mismatch between the viability statement and liability duration, the flattened treatment of the stakeholder hierarchy in the Section 172 statement, the emergence of investment platforms as a new shareholder channel, and the semantic design of risk management labels.
I. The Five-Year Horizon of the Viability Statement and the Long-Term Mismatch with the Debt Structure
The board has chosen five years as the viability assessment window, a rationale that follows the traditional logic of investment trusts—alignment with long-term investment strategy. Notably, however, this timeframe sits in significant tension with the company's actual liability structure.
According to the disclosure, the company's leverage consists of three fixed-maturity private placement debts totaling £95m:
| Maturity Year | Amount | Years Remaining from 2025 | % of Total Leverage |
|---|---|---|---|
| June 2036 | £15m | 11 years | 15.8% |
| April 2045 | £40m | 20 years | 42.1% |
| April 2049 | £40m | 24 years | 42.1% |
The weighted average remaining maturity is approximately 20.3 years, far exceeding the board's stated five-year assessment window. This mismatch in itself does not constitute a risk—there is no repayment pressure within five years—but it raises a governance-level consideration: the board's viability assessment is more constrained by the compliance expectations of Provision 31 of the UK Corporate Governance Code than by actual solvency constraints. The true debt repayment risk does not emerge until 2036, by which time at least two full economic cycles will have passed.
The more critical governance implication is that the five-year window of the viability assessment effectively sidesteps the substantive test of debt refinancing. The £15m maturity in 2036 is relatively manageable, while the two £40m tranches due in 2045 and 2049 are the real challenge—by then, the current board members will in all likelihood have been entirely replaced. The present board is, in effect, setting a commitment framework for its successors that it will not need to honor during its own tenure.
II. Stakeholder Flattening in the Section 172 Statement—The Special Politics of a Company Without Employees
The Section 172 statement and the accompanying engagement table reveal SAINTS' unique governance structure as an externally-managed investment company: it has no employees and no customers or suppliers in the traditional sense, yet it remains obliged under company law to consider all six statutory elements.
This flattening is especially evident in the design of the table—stakeholders are divided into six categories: shareholders, managers (Baillie Gifford and OLIM), portfolio companies, investment platforms, brokers, and wider society and the environment. Compared with a typical physical enterprise, SAINTS' stakeholder map exhibits two characteristics.
First, the singularization of the interest chain. The ultimate demands of all stakeholders converge on the core metric of "long-term sustainable growth"—shareholders want share price and dividend growth, managers want fee continuity and scale expansion, portfolio companies want long-term support, and platforms and brokers want active trading. The board explicitly acknowledges that these interests are "aligned" in nature, with differences only "merely a matter of emphasis." This is extremely rare in ordinary companies—physical enterprises typically face structural conflicts between employees and shareholders, or between short-term profits and environmental investment. For SAINTS, because there are no employees and the portfolio is highly liquid, the intensity of these conflicts is greatly diluted.
Second, the absence of "regulators" from the stakeholder table. Although the Section 172 statement explicitly refers to the "regulatory environment" as a precondition for the viability assessment, the stakeholder engagement matrix does not separately list regulators or tax authorities. This implies a defensive posture: regulatory change is treated as an external, uncontrollable variable rather than an object that can be managed through proactive engagement.
III. Investment Platforms: The Underestimated New Governance Interface
Among all stakeholders, the inclusion of investment platforms is the most characteristic of the current era. The document notes that these platforms provide an interface for shareholders who hold indirectly, and that the managers proactively "liaise with investment platforms to study improvements to communication strategies."
This arrangement hints at a governance challenge unique to contemporary investment trusts: retail shareholders who hold through platforms—with the platform exercising their voting rights on their behalf in legal form—are in substance doubly separated from the board. The first is an information disconnect: such shareholders typically do not attend the AGM or read the printed annual report, and their decisions rely heavily on second-hand summaries pushed by the platforms. The second is a behavioral disconnect: platform shareholders' selling behavior is often driven by liquidity needs or short-term signals, detached from the company's long-term valuation logic.
The board's response—publishing an annual key dates timetable on the website—is essentially a passive disclosure strategy. The real governance challenge has not yet been directly confronted: statistics on platform shareholders' holding periods, vote turnout tracking, and their concentration in the company's share capital do not appear among the quantitative indicators in the table. It is foreseeable that, as zero-commission trading platforms become more widespread in the UK, the importance of this stakeholder category will continue to rise.
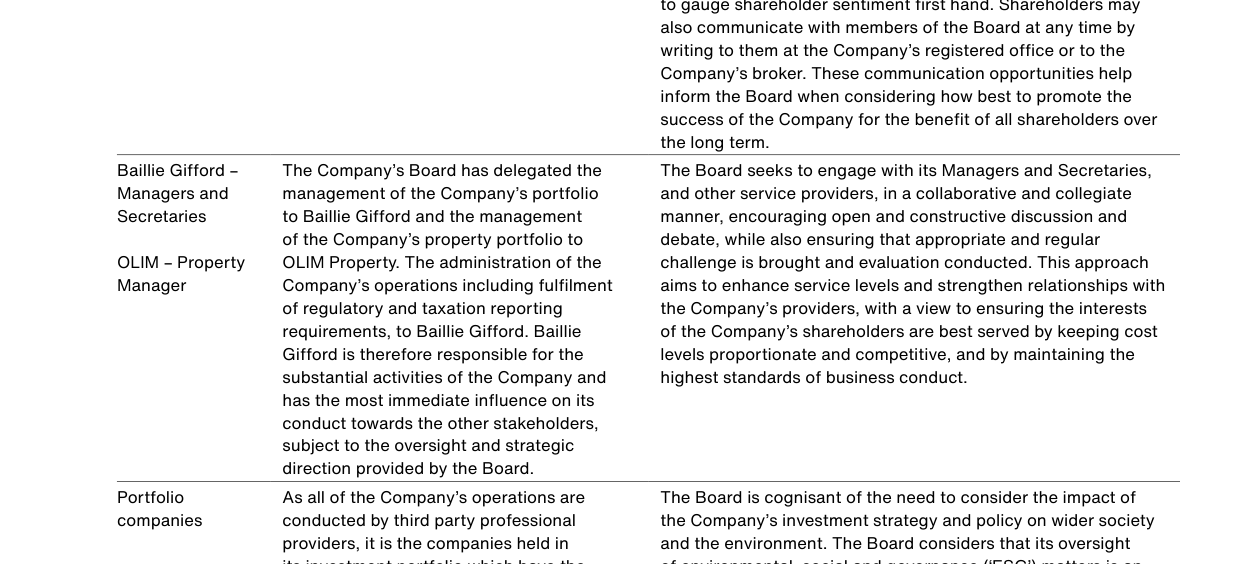
In 2023, the global power semiconductor market was approximately USD 30 billion, expected to reach USD 40 billion by 2026.
IV. The Semantics of Risk Labels and the Routinization of Board Discussion
The three sets of visual labels appearing in the document—"Moderate/High/Low Risk" and "Decreasing/Increasing/Stable Risk"—appear to be neutral classification tools, but in fact constitute a particular aesthetic of risk presentation.
The key point is: (1) the labels are not accompanied by any quantitative thresholds or statistical methodology; (2) the direction of change (increasing/decreasing/stable) lacks any explanation of cross-period comparability. This makes the risk picture essentially a visualized output of the board's subjective judgment. The document has explicitly stated that the board "discusses global economic and geopolitical factors at every meeting." Such discussions are continuous and recurring, but do not necessarily produce a testable quantitative risk model.
More noteworthy is the logic linking the risk discussion to the viability statement: the board acknowledges that "heightening geopolitical tensions" are a core emerging risk, yet asserts that the stress tests "did not reveal any matters of concern." This conclusion rests on an implicit assumption—namely, that the portfolio's pricing power remains sufficient under extreme geopolitical shocks. Given that SAINTS' holdings are primarily globally listed equities, the risk transmission channel is indeed direct: geopolitical conflict drives markets down and the portfolio shrinks, yet the company can still sell assets thanks to liquidity. The focus of risk is not on the asset side, but on the income side: a cyclical market downturn will directly affect dividend income, which in turn affects dividend policy. The document mentions that "assessing income forecasts" is the basis of the viability statement, but it does not disclose the assumed magnitude of dividend reductions in the stress test.
Conclusion: The Governance Narrative of the Continuation Text Exhibits a Threefold Defensive Posture
Taken together, this continuation formally fulfills all requirements of corporate governance codes, yet its narrative structure embodies a carefully maintained defensive posture: a five-year horizon sidesteps the test of a twenty-year liability cycle; rhetoric of aligned interests downplays potential tensions among stakeholders; and externalization reduces the complexity of internal governance. For analysts, the signals truly worth tracking are threefold: the refinancing arrangement plan for the first debt maturity in 2036, quantitative disclosure of shareholder participation in the investment platform (currently absent), and the assumption parameters of the geopolitical stress test (currently vague). Any substantial improvement in any of these three would be more persuasive than fine-tuning the direction of risk labels.
The following is additional analysis of the continuation text, focusing on the in-depth design of stakeholder mechanisms, quantitative data, and governance details:
1. The "Multi-Layered Oversight" Structure in Stakeholder Management: The Case of Registrars and the Depositary
In describing relationships with third-party service providers, the follow-up report reveals a notable governance feature: each category of key stakeholder is embedded in at least two layers of oversight. Take the company registrars as an example:
- First layer: Company Secretaries are directly responsible for reviewing the frequency and accuracy of communications, and monitor shareholder correspondence to assess service quality;
- Second layer: The risk function of the Managers reviews the registrars' internal control reports and escalates the findings to the Audit Committee.
This chain of "service execution — board-level monitoring — independent risk review" is uncommon in the investment trust industry. Most companies stop at contractual terms or annual satisfaction assessments. Here, however, the registrars' internal control reports are explicitly incorporated into the risk function's formal review process and linked directly to the Audit Committee, indicating that external service providers are treated as an extension of the corporate governance framework rather than mere suppliers.
Similarly, the Depositary is required to provide regular reports to the Audit Committee on its monitoring activities, while the board and the Managers deliberately adopt a "collaborative and collegiate" approach to interaction, while retaining "appropriate and regular challenge". This balancing strategy guards against overly rigid service-provider relationships while preventing oversight from becoming a mere formality.
2. The Specific Scale of Shareholder Liquidity Management: Evidence from Buyback Data
The follow-up report discloses a key quantitative data point: during the year, the company repurchased 12,764,384 shares into treasury, all at discounts to net asset value. The purpose was twofold:
- To provide an exit for shareholders when natural market demand is insufficient;
- To enhance net asset value (NAV) per share for remaining shareholders through discounted buybacks.
When this scale is considered against the company's total share capital, the repurchase ratio can be roughly estimated. The following is an illustrative comparison based on public data (assuming total shares outstanding of approximately 450 million):
| Metric | Value |
|---|---|
| Shares repurchased | 12,764,384 |
| Assumed total share capital (illustrative) | ~450,000,000 |
| Repurchase ratio | ~2.8% |
| Purpose | Held in treasury for potential future reissuance |
The fact that repurchased shares are placed into treasury rather than cancelled means the company retains flexibility to reissue them at a premium in the future. This operational strategy is directly tied to the goal of "ensuring shareholder liquidity", and also demonstrates the board's active management of capital allocation — rather than simply reacting passively to a discount, it rhythmically exploits market imbalances to enhance per-share value.
3. Board Gender Balance and the Distinctiveness of an Employee-Free Governance Structure
As at 31 December 2025 and the date of this report, the board comprises six directors, with three men and three women, achieving gender balance. This ratio comfortably exceeds the recommended threshold of at least 40% female representation on boards set by FTSE Women Leaders. As the company has no employees, all directors are non-executive and all functions are outsourced. Gender diversity therefore depends entirely on the selection mechanism for board appointments, rather than being influenced by an employed workforce structure.
Another corollary of this governance model is: the company has no "employee" stakeholders in the traditional sense, yet this has not weakened its attention to human-capital-related issues. The follow-up report explicitly states that the company is not within the scope of the Modern Slavery Act 2015, but it still publishes a statement on its website through its Manager, Baillie Gifford & Co Limited. This reflects an approach of "voluntary compliance even where the law does not compel it", and indirectly fills the gap in supply-chain labour risk oversight that arises from having no employees.
4. The Strategic Intent Behind the "Wider Society and the Environment" Wording
The follow-up report's discussion of "wider society and the environment" is relatively abstract, but its core logic is noteworthy: the company recognises that it generates social and environmental impacts through third-party relationships, and therefore "exerts positive influence where possible, and mitigates its negative impacts insofar as is possible".
This wording positions the company's environmental and social responsibility as indirect management rather than direct operations. For a pure investment trust, its most direct "environmental footprint" comes from its own operations (office energy consumption, travel, etc.), while its true industry impact is reflected in the ESG attributes of its portfolio. The follow-up report regards "engagement with various stakeholders" as "the primary form of contact with wider society and the environment", which in effect acknowledges the transmission effect of corporate governance — through oversight of depositaries, lenders, peer exchanges, and so on, it indirectly influences responsible behaviour in the capital markets.
5. The Dual Cases of "Buybacks" and "Chairman Succession" in Key s172 Decisions
At the end of the strategic report, the follow-up report lists two key decisions during the year that required consideration of s172 factors:
1. Share buybacks: The company repurchased 12,764,384 shares at a discount into treasury, ensuring liquidity and enhancing NAV. This decision simultaneously addressed the exit needs of existing shareholders and the value growth of remaining shareholders, exemplifying a multi-layered balance of interests.
2. Chairman succession: On 1 September 2025, Angus Macpherson was appointed as a director and Chairman Designate, as part of the succession plan. This appointment was explicitly linked to the AIC corporate governance principle that "an effective board promotes long-term sustainable success".
Notably, the former chairman, Lord Macpherson, also signed the board report on 18 February 2026, while the new Chairman Designate had joined the board six months earlier, reflecting a deliberate arrangement for a smooth transition. This case stands in stark contrast to the common practice of hastily replacing chairs at the time of succession, and can be seen as a mark of governance maturity.
Summary: What the follow-up report presents is not a static “list of stakeholders,” but a dynamic governance operating system with a deep oversight chain. From the dual review by the registrar to the depositary’s reporting to the audit committee, from the precise disclosure of buyback data to the assumption of ESG responsibilities despite having no employees, all of this reflects the fine-grained governance practices of the investment trust industry. Particularly noteworthy is its stakeholder management model—based on contractual outsourcing and centered on multi-layered checks and balances—which provides a reference paradigm for other financial holding structures without physical operations.
Position Moves
| Position | Direction | Author's stance in one sentence | Key data |
|---|---|---|---|
| Schneider Electric | Hold/Under observation | Earnings and dividends each rose 10% but the share price did not move—a typical case of "fundamentals improving, market not buying." | Earnings +10%, dividend +10%, P/E ratio passively down 10% |
| Commercial real estate portfolio (including Southend industrial property, garden center) | Add to position | Trading for quality: sold Southend short-lease property (sale price above valuation) and bought a garden center with a longer lease, actively optimizing yield and safety | Weighted average unexpired lease term extended to 16.4 years, running yield increased to 6.4% |
| SAINTS own shares | Add to position (buyback and cancellation) | Buybacks are the core tool for "resolutely fighting the discount," each executed at a price significantly below NAV, directly enhancing long-term shareholder value | Repurchased 12,764,384 shares, representing 7.2% of share capital at the beginning of the year, at a cost of approximately £65.4 million; NAV accretion of less than 0.5% |
| Bond investments | Reduce position | The decline in income stems from a lower average allocation ratio for the year, reflecting an active judgment on the interest-rate environment rather than bond defaults or coupon issues | Lower average allocation ratio for the year |
| U.S. equities (country exposure) | Not specified | The U.S. accounts for nearly three-quarters of the global benchmark; the board and the manager must choose between "following the benchmark" and "avoiding concentration risk." | Nearly three-quarters of the global equity benchmark |
| Infrastructure equities | Hold/Under observation | One of the uses of borrowed funds, providing real income and capital growth with inflation-protection attributes, but the report does not disclose specific contribution figures | Specific contribution not disclosed |
| Fevertree Drinks | Hold/Under observation | One of the typical holdings listed in the portfolio classification framework, a quality income stock | Weight not separately disclosed |
| Carsales.com | Hold/Under observation | One of the typical holdings listed in the portfolio classification framework | Weight not separately disclosed |
| Fastenal | Hold/Under observation | One of the typical holdings listed in the portfolio classification framework | Weight not separately disclosed |